Article

One-Pot Synthesis of N-Doped NiO for Enhanced Photocatalytic CO2 Reduction with Efficient Charge Transfer

1
School of Chemistry and Chemical Engineering, Jiangxi University of Science and Technology, Ganzhou 341000, China
2
School of Chemical Engineering, Guangdong University of Petrochemical Technology, Maoming 525000, China
*
Authors to whom correspondence should be addressed.
Molecules 2023, 28(6), 2435; https://doi.org/10.3390/molecules28062435
Submission received: 25 December 2022 / Revised: 4 March 2023 / Accepted: 5 March 2023 / Published: 7 March 2023

Abstract

:
The green and clean sunlight-driven catalytic conversion of CO2 into high-value-added chemicals can simultaneously solve the greenhouse effect and energy problems. The controllable preparation of semiconductor catalyst materials and the study of refined structures are of great significance for the in-depth understanding of solar-energy-conversion technology. In this study, we prepared nitrogen-doped NiO semiconductors using a one-pot molten-salt method. The research shows that the molten-salt system made NiO change from p-type to n-type. In addition, nitrogen doping enhanced the adsorption of CO2 on NiO and increased the separation of photogenerated carriers on the NiO. It synergistically optimized the CO2-reduction system and achieved highly active and selective CO2 photoreduction. The CO yield on the optimal nitrogen-doped photocatalyst was 235 μmol·g−1·h−1 (selectivity 98%), which was 16.8 times that of the p-type NiO and 2.4 times that of the n-type NiO. This can be attributed to the fact that the nitrogen doping enhanced the oxygen vacancies of the NiOs and their ability to adsorb and activate CO2 molecules. Photoelectrochemical characterization also confirmed that the nitrogen-doped NiO had excellent electron -transfer and separation properties. This study provides a reference for improving NiO-based semiconductors for photocatalytic CO2 reduction.

1. Introduction

The rapid development of current society has increased the consumption of non-renewable fossil fuels. Human beings have to face the problem of energy shortages, and the resulting large emissions of CO2 are also an important cause of global warming [1,2,3,4]. Currently, using sustainable solar energy to photocatalytically reduce CO2 in high-value-added products is a promising way to simultaneously solve the greenhouse effect and the energy crisis [5,6]. Therefore, it is very important to design and synthesize photocatalysts with low pollution, high efficiency, and low cost [7,8].
As an environmentally friendly transition-metal-oxide semiconductor, NiO has excellent conductivity, good chemical stability, and non-toxicity, and it has broad application prospects at the nanoscale [9,10]. At the same time, it is considered to be a semiconductor that can be used for CO2 photoreduction due to its sufficiently negative conduction band position, fast hole mobility, and high charge-carrier concentration [11]. However, due to the high recombination degree of photogenerated carriers, the separation efficiency of electrons and holes in the reaction process is low, which greatly weakens the reactivity [12]. In addition, wide-band-gap NiO semiconductor catalysts can only use about 3–5% of solar ultraviolet light, resulting in the low efficiency of the photocatalytic reduction of CO2, limiting the application of NiO in photocatalysis [13]. Therefore, NiO is often used as a co-catalyst to improve photocatalytic performance and encourage the efficient separation of photoelectrons and holes [14]. For example, NiO can significantly improve the photocatalytic hydrogen-production performance of SrTiO3, TiO2, Nb2O5, Ga2O3, and other photocatalysts [15]. However, the activity was generally low in the reported photocatalytic reduction of CO2 by NiO [16,17]. Therefore, NiO is usually modified by different methods to improve the photocatalytic performance [18].
Since NiO has suitable conduction band (CB) and valence band (VB) positions, it often forms heterostructures with many semiconductors. Zhang et al. [19] prepared an S-type BiOBr/NiO heterojunction. The experiment showed that the layered structure of BiOBr/NiO increased the light-absorption and charge-separation performance, and it improved the redox ability of BiOBr/NiO. In addition, the NiO-layered porous-sheet structure was conducive to the adsorption of CO2, exposing abundant active sites for CO2 photoreduction, thus achieving excellent CO2 photoreduction performance. Moreover, Park et al. [20] prepared a single-layer hollow-sphere photocatalytic material (h-NiO-NiS) of NiO and NiS by partially replacing O with S on NiO hollow spheres. The construction of this heterojunction greatly enhanced the CO2-adsorption capacity and increased the transfer of excited electrons from the NiS to the surface along the hollow spheres. The efficient transfer of electrons led to the prolongation of the photogenerated charges’ recombination times, which further increased the conversion of CO2 to CH4.
Moreover, charge separation can be increased by adjusting the electronic structure of NiO, thereby improving its CO2 photoreduction activity. Xiang et al. [21] constructed ultrathin NiO nanosheets with different oxygen-vacancy concentrations to achieve efficient CO2 photoreduction performance. Density functional theory calculations and CO2-temperature programmed desorption experiments confirmed that moderate oxygen vacancy concentrations achieved a strong combination of the material surface with CO2, enhanced the adsorption and activation of CO2, and encouraged effective charge transfer. By contrast, the excessive oxygen-vacancy content reduced the binding affinity of the CO2; thus, the appropriate regulation of oxygen-vacancy content is an effective means to achieve a NiO electronic structure that is suitable for CO2 photoreduction. In addition, the construction of a ternary bridging structure is also an important method to increase the separation of photoelectrons and holes. For example, Park et al. [22] introduced reduced graphene oxide (rGO) into the NiO-CeO2 p-n heterostructure, which accelerated the separation and transfer of photogenerated electrons, and the surface of the material accumulated electrons more easily, thus improving the photocatalytic activity of the CO2 multi-electron reduction.
In addition, heteroatom doping is an effective method with which to adjust the electronic structures of catalysts and has been extensively studied [23,24,25,26]. However, compared with anion doping, cation doping produces more harmful electron–hole recombination centers. Because oxygen and nitrogen show similar chemical, structural, and electronic characteristics, such as polarizability, electronegativity, coordination number, and ionic radius, when other elements (such as N 2p) with higher potential energy than O 2p atomic orbitals are introduced, new VBs instead of O 2p atomic orbitals can be formed, resulting in smaller Ebg without affecting the CB level, thereby improving the visible-light response [27]. Therefore, non-metallic-element-N doping is a preferable way to improve the photocatalytic CO2-reduction effect of NiO. Furthermore, it is also important to choose the appropriate doping method. The molten-salt method of element doping is an efficient and low-cost method because its molten-salt liquid environment can make the element distribution more uniform, and the treatment process before and after the reaction is very simple [28].
In this research, NiO semiconductor catalysts with different nitrogen-doping contents were prepared using a molten-salt calcination method, and the CO2-reduction activity was tested in a bipyridine ruthenium/triethanolamine heterogeneous catalytic system excited by different wavelengths of light [29]. The phase composition, band structure, optical properties, and surface morphology of the doped NiO semiconductor were researched through a series of characterizations. The enhancement mechanism of the photocatalytic performance was discussed, and the possible mechanism of the photocatalytic process was analyzed.

2. Results and Discussion

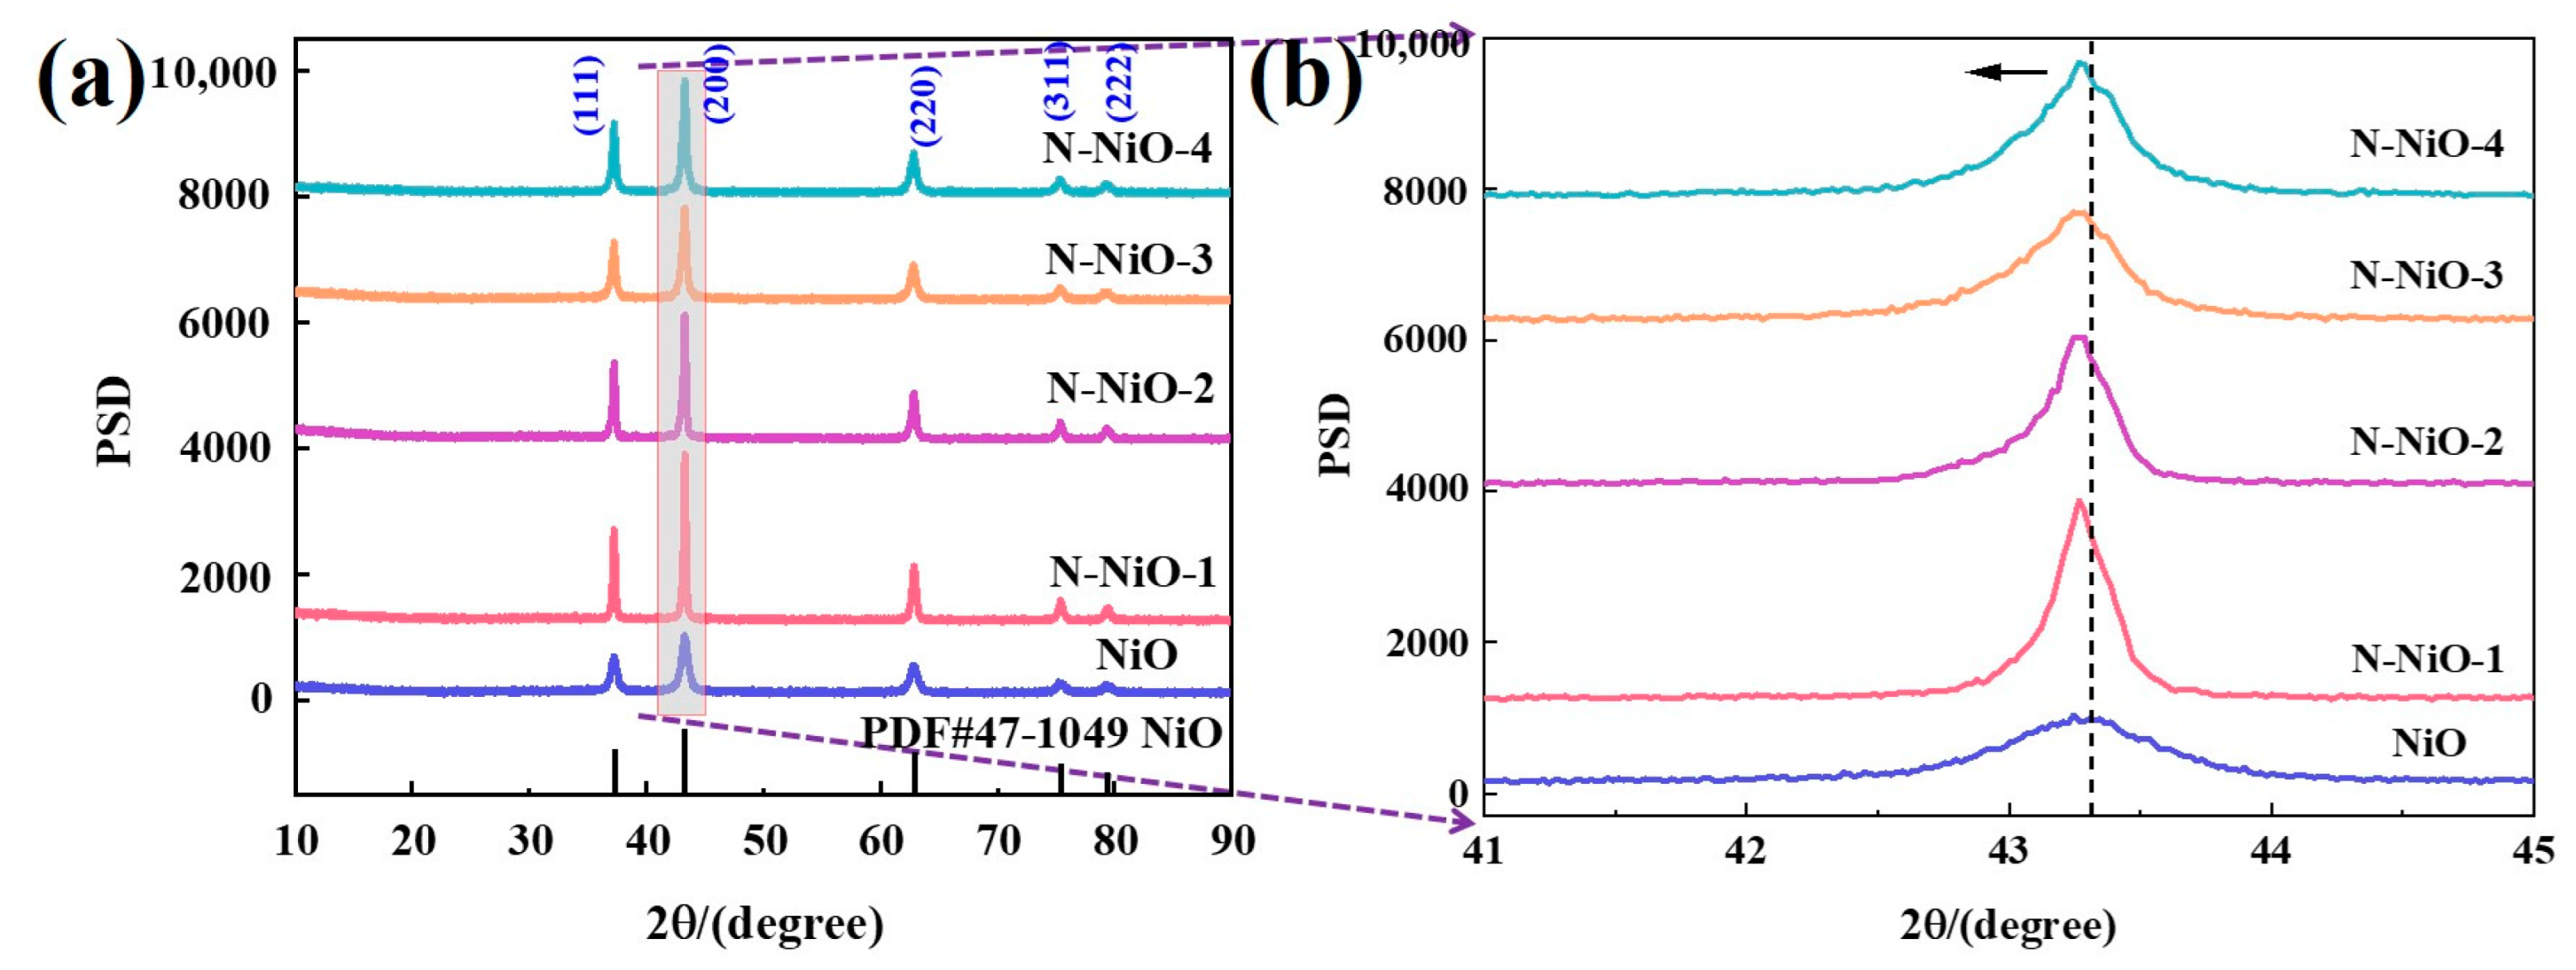
2.1. Phase Structure
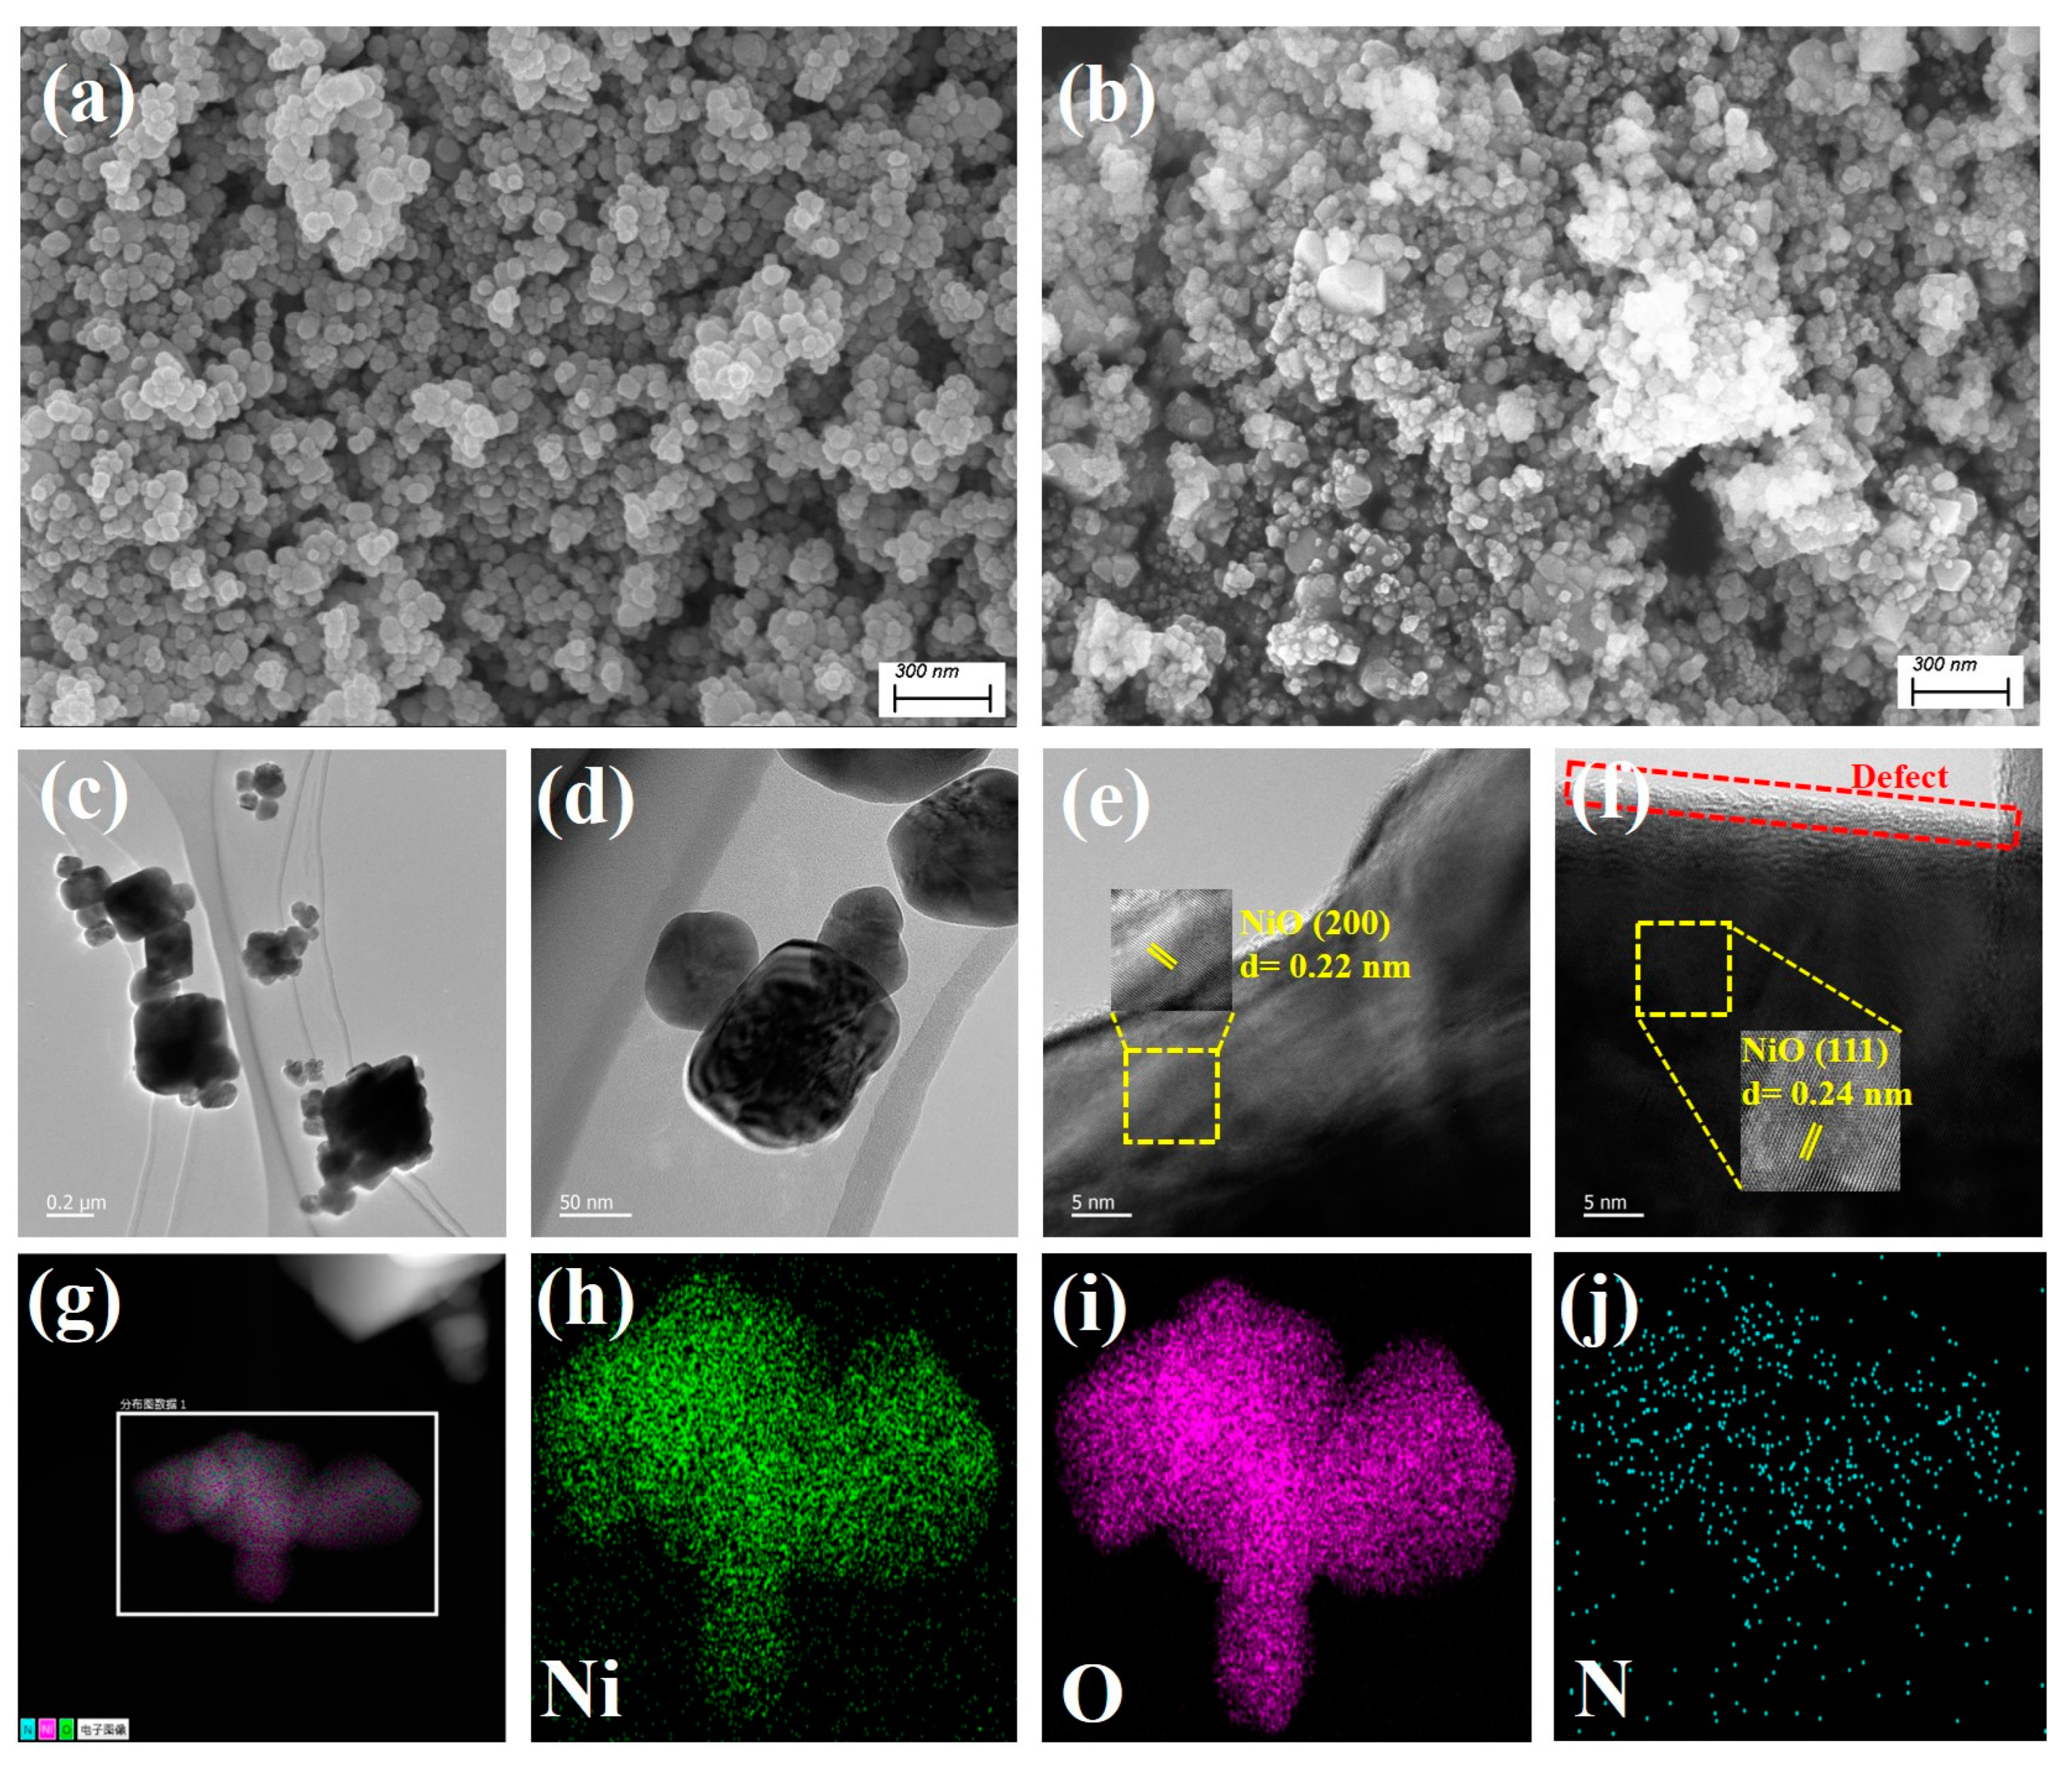
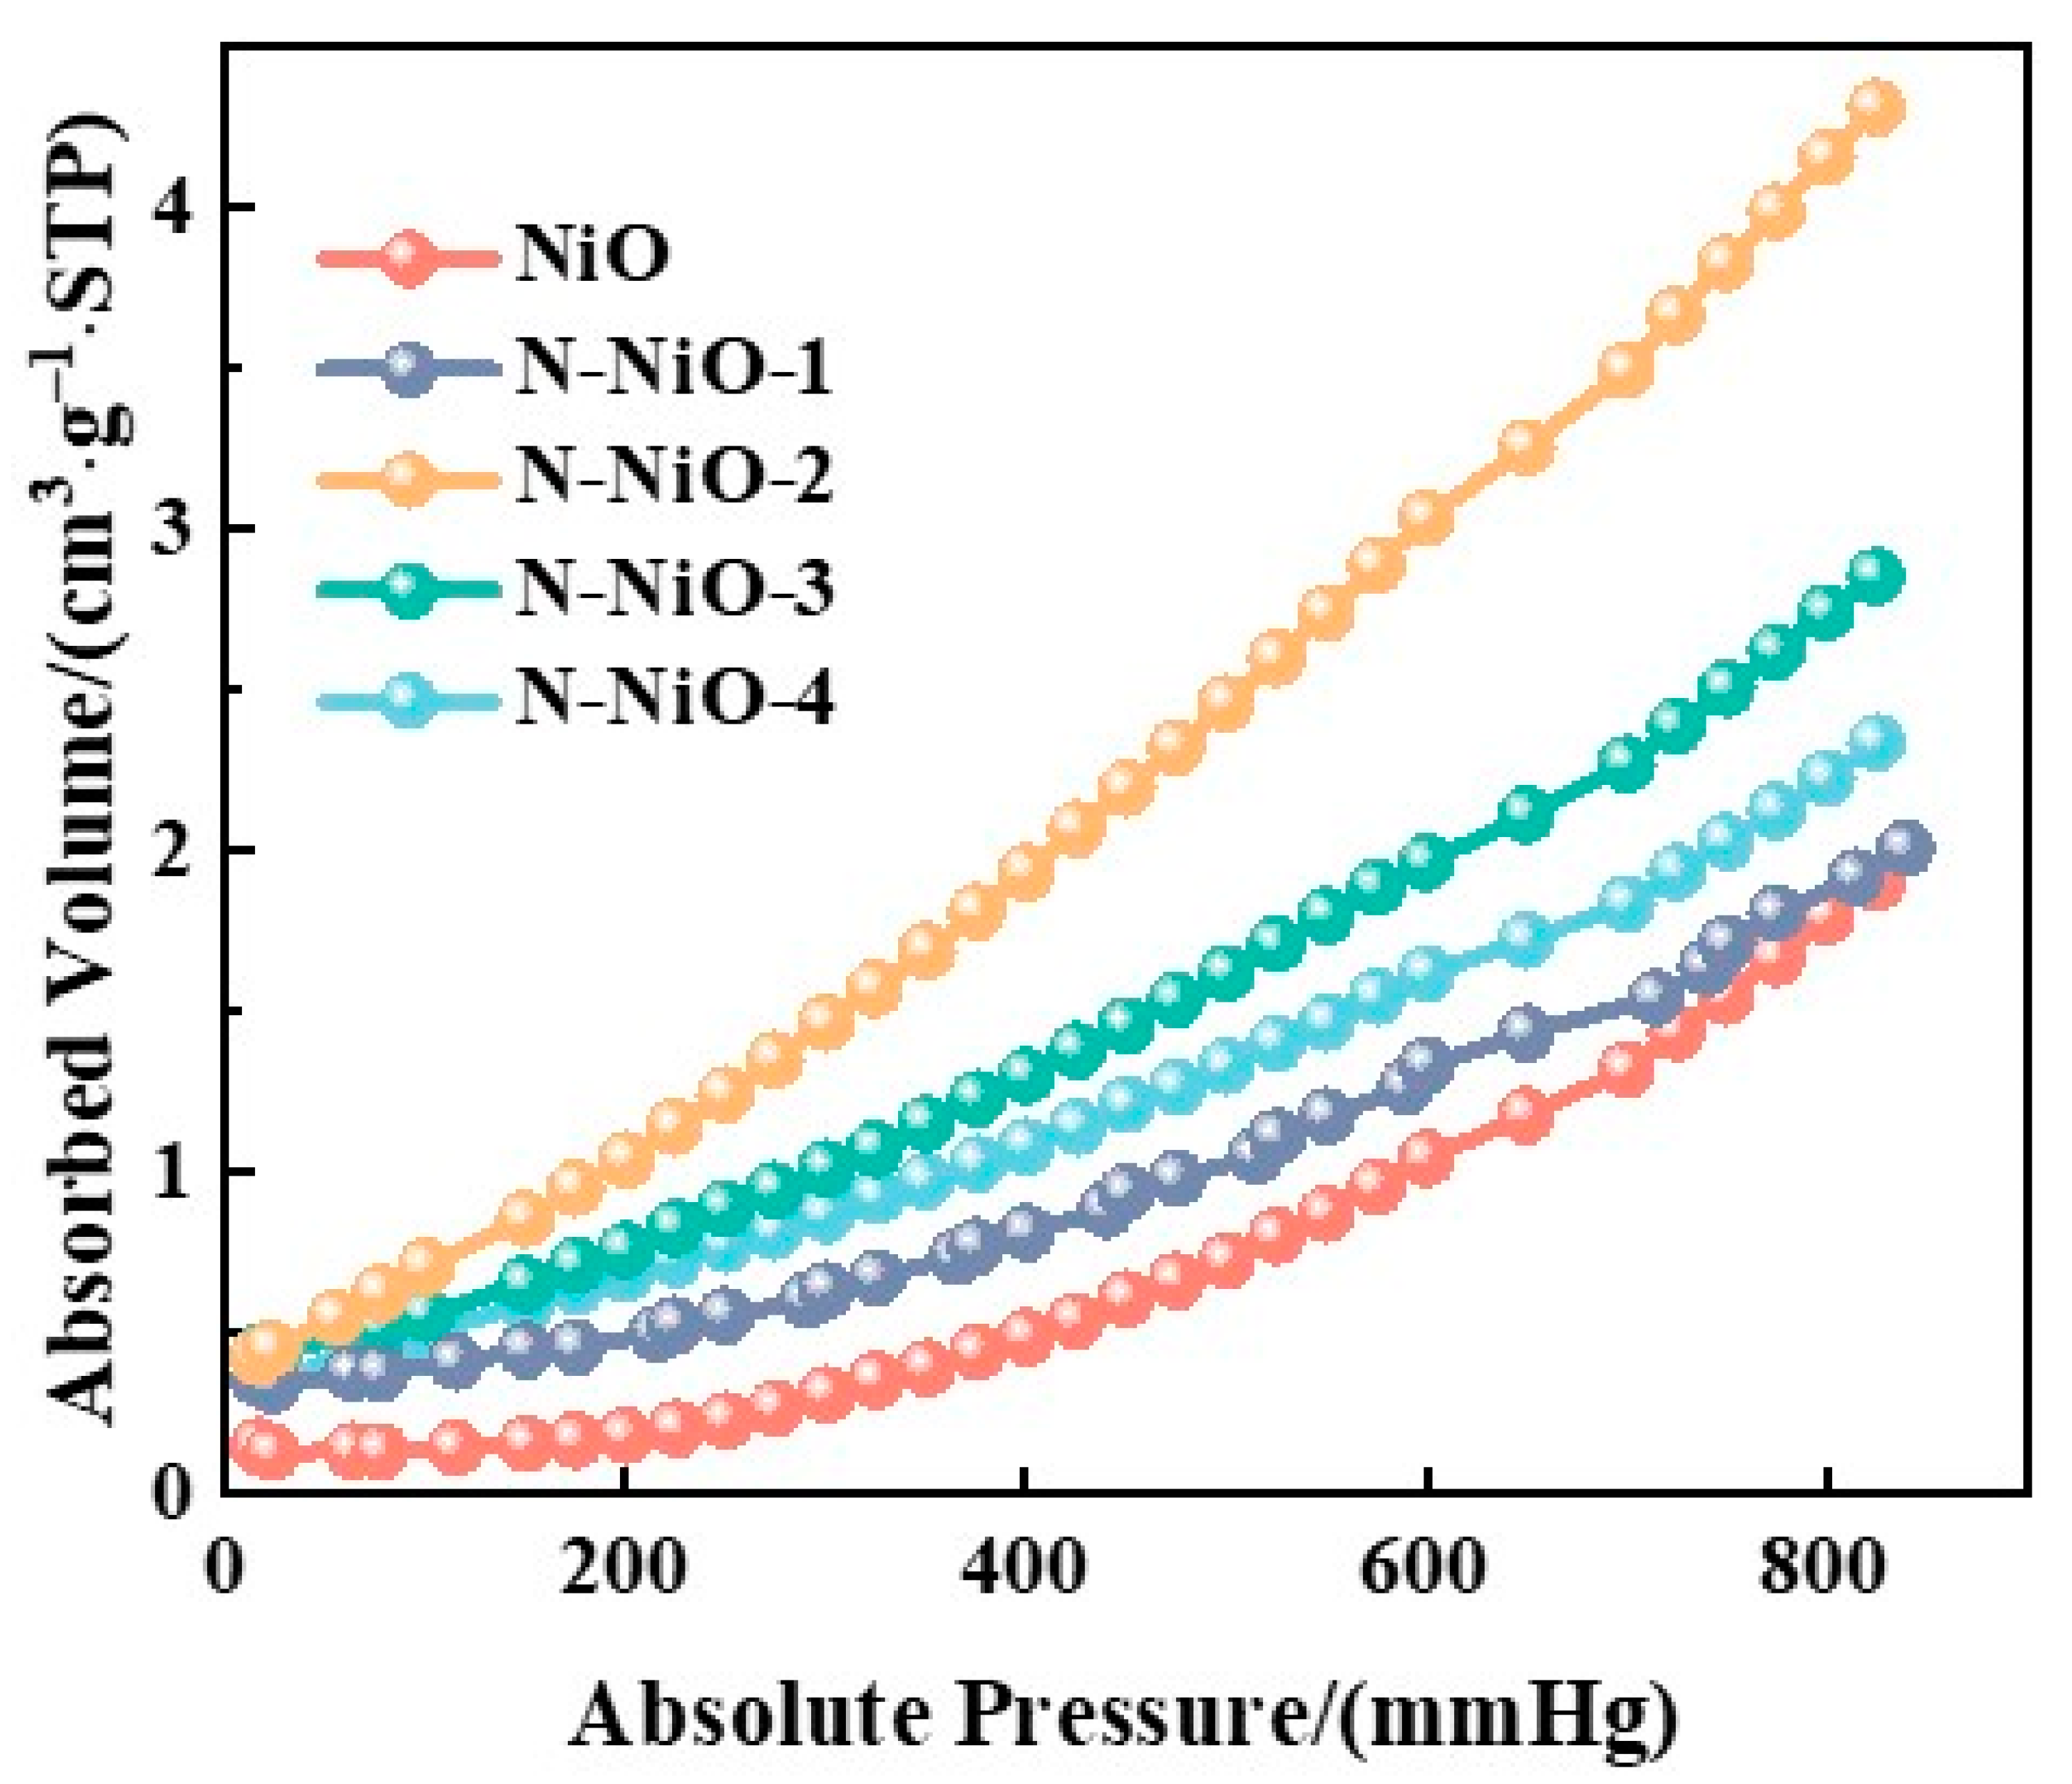
As shown in Figure 1a, all of the samples corresponded to standard NiO (JCPDS PDF#47-1049), and no impurity phase was detected via XRD. The diffraction peaks at 2θ = 37.2°, 43.3°, 62.9°, 75.4°, and 79.4° corresponded to the (111), (200), (220), (311), and (222) crystal planes of the NiO, respectively [30]. In addition, the doping of the N significantly enhanced the crystallinity of the sample, which was more conducive to the migration and separation of photogenerated charges [31]. By enlarging the range of 2θ = 41–45° (Figure 1b), it was found that the doping of N made the (200) crystal plane of the N-NiO-x shift by a small angle. This is because the radius of the N was different from those of the Ni and the O. After the N doping into the lattice of the NiO, the Ni–O bond became compressed and stretched to a certain extent, resulting in a change in the crystal-plane spacing, which showed the shift in the crystal plane’s diffraction angle macroscopically [32]. The average particle diameters of the samples calculated by the Scherrer equation are shown in Table S1. It was found that the calculated results of the NiO and N-NiO-2 were similar to the results of the SEM (Figure 2a,b). The particle diameter of the pure NiO was smaller and more uniform than that of the N-NiO-2. The doping of the N made the NiO agglomerate and the particle diameter increased.

2.2. Microstructure

The microstructure information of the NiO and N-NiO-2 were collected using SEM and TEM. As shown in Figure 2a, the NiO appeared in the form of nanospheres, and the particles were evenly distributed. After the introduction of the N-element doping, the surface of the sample became irregular and agglomerated (Figure 2b). In addition, the TEM images showed that the N-NiO-2 was stacked in sheets and irregularly distributed (Figure 2c), which was similar to the SEM results. Furthermore, as shown by the high-resolution-TEM imagery in Figure 2e–f, it was found that there were lattice-fringe-spacing values of d = 0.22 and 0.24 nm in the N-NiO-2, which corresponded to the (200) and (111) crystal planes of the NiO, respectively. No lattice fringes of impurity phases were detected, indicating that the N doping did not form impurity phases on the surface of the NiO. It is worth noting that the formation of oxygen defects in the sample macroscopically showed the edge of the defect band [33]. In addition, the element-mapping spectra in Figure 2g–j show that the Ni, O, and N elements were uniformly distributed without impurity elements.

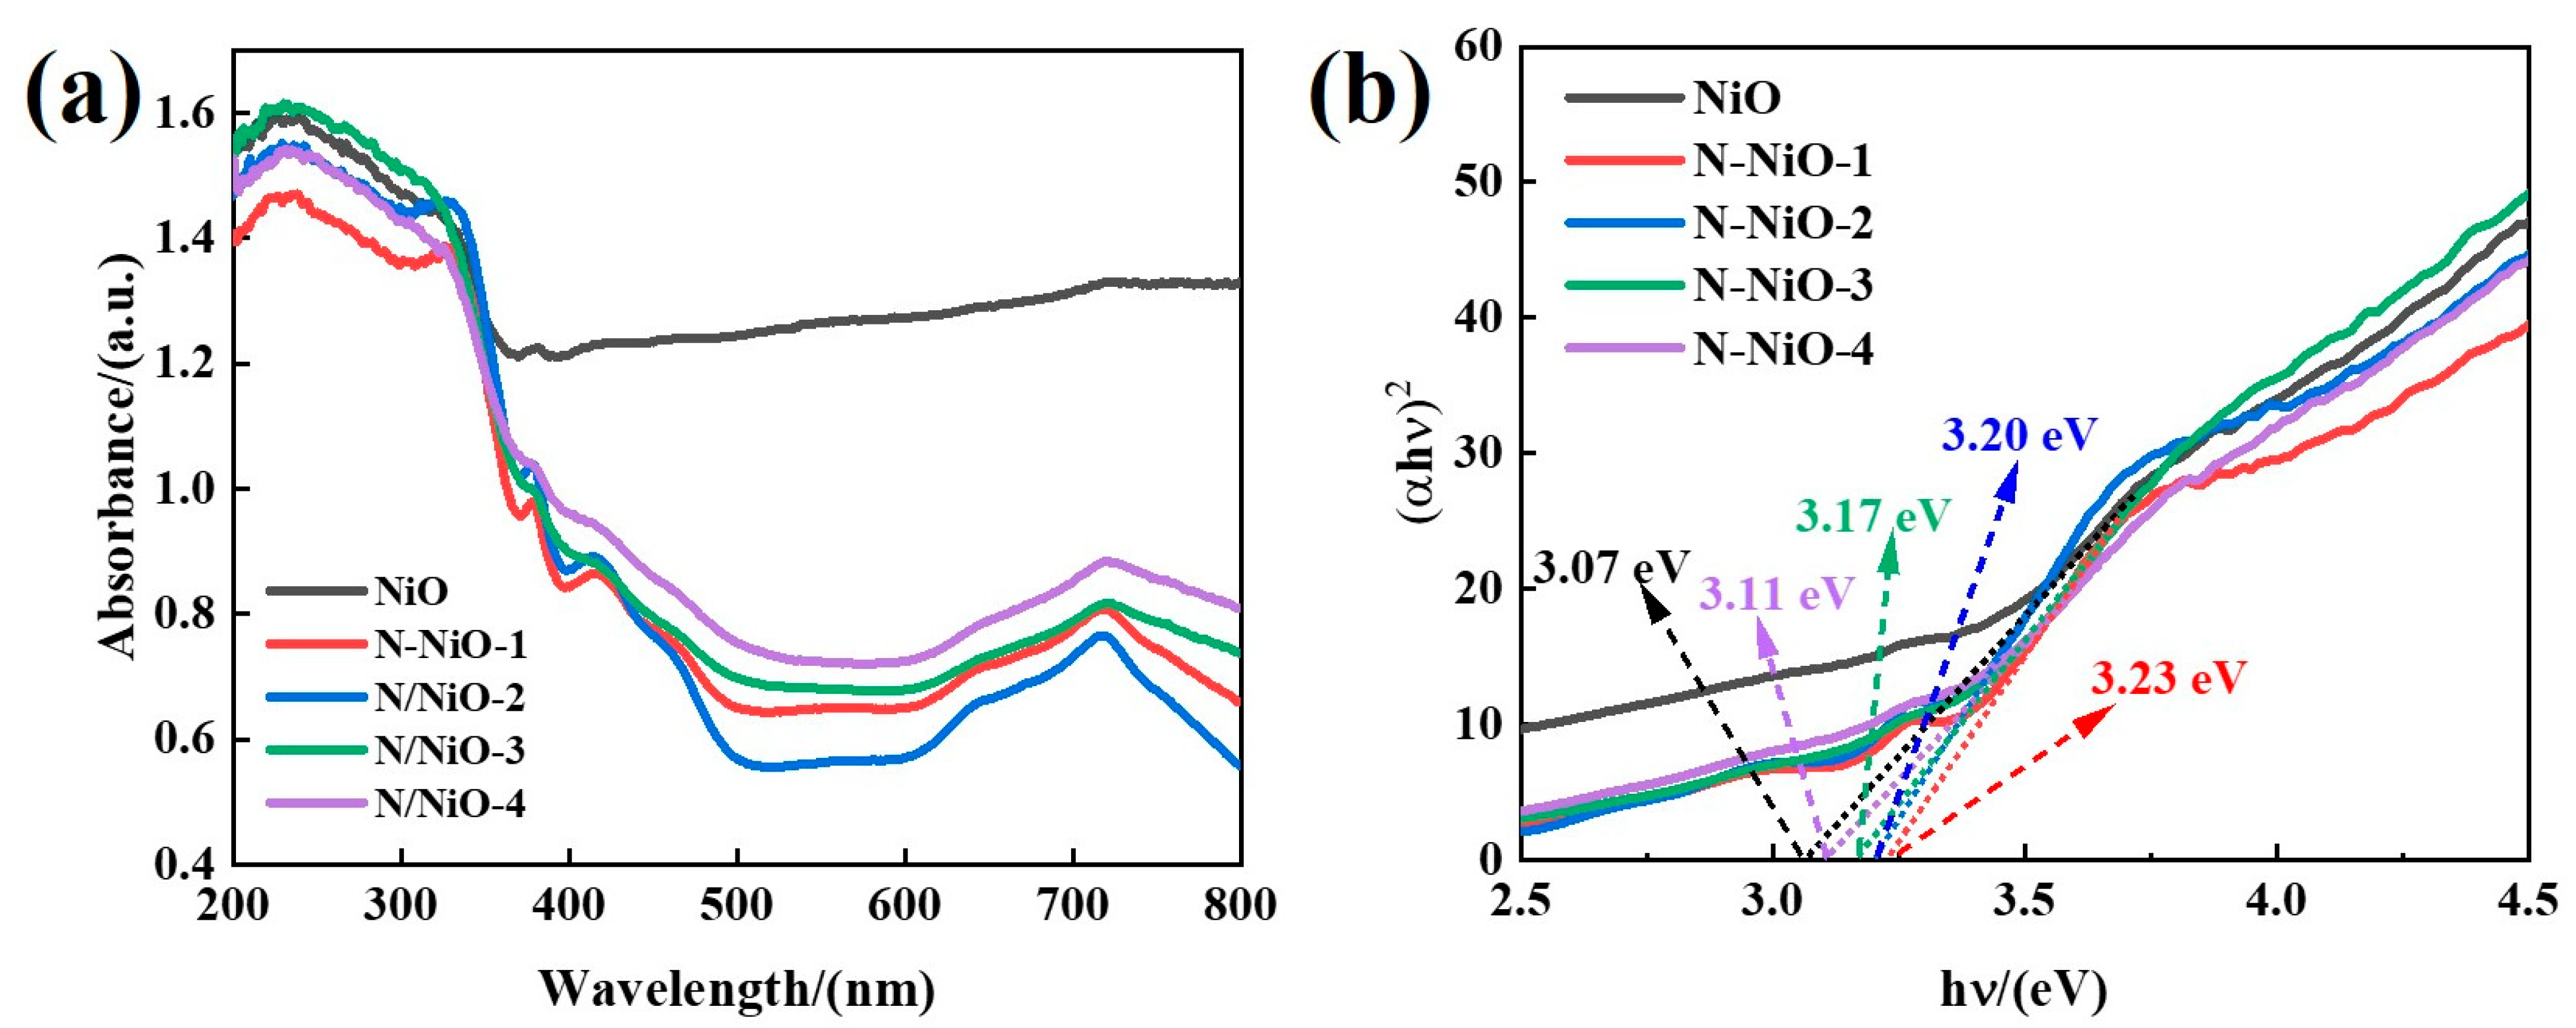
2.3. Optical Properties

The optical absorption spectrum was used to characterize the absorption characteristics of the sample to different wavelengths of light. In general, the larger the maximum absorption wavelength, the wider the spectral response of the semiconductor, but this causes the narrowing of the band gap of the semiconductor, which may further lead to a reduction in the redox performance in the photocatalytic process [34]. Therefore, it was necessary to balance the excitation wavelength and redox performance of the light-excited semiconductor. As shown in Figure 3a, the DRS showed that the maximum absorbance of all the samples was concentrated within a range of 200–350 nm. However, after the N doping, the original black NiO was transformed into yellowish brown N-NiO-x (Figure S1); thus, the absorption of the N-NiO-x in the visible range was weakened. In addition, the absorption peaks of the N-NiO-x at about 390 nm and 470 nm were attributed to the N 2p band introduced by the N doping [35]. The weak absorption band around 600 nm belonged to the defect band [36]. The other absorption peaks at 380–500 nm and the peak around 720 nm correspond to the NiO itself [37].
The band gap of the sample can be calculated according to the Kubelka–Munk equation [38]:
(αhv)1/n = A(hvEg),
where α is the absorption coefficient, hv is the light energy, A is a constant, Eg is the band gap, the direct band-gap semiconductor n is 1/2, and the indirect band-gap semiconductor n is 2. According to the literature, NiO is a direct band-gap semiconductor, and n is 1/2. Through drawing a (αhv)2-hv diagram and linearly fitting the curve from the intercept to estimate the Eg of the sample, the results were obtained and they are shown in Figure 3b. It can be seen that the optical absorption of the NiO weakened after the introduction of the N doping into the NiO lattice; on the other hand, the doping of N made the band-gap value of the NiO change from 3.07 to 3.23 eV, and the wider band gap improved the reduction performance of the NiO.

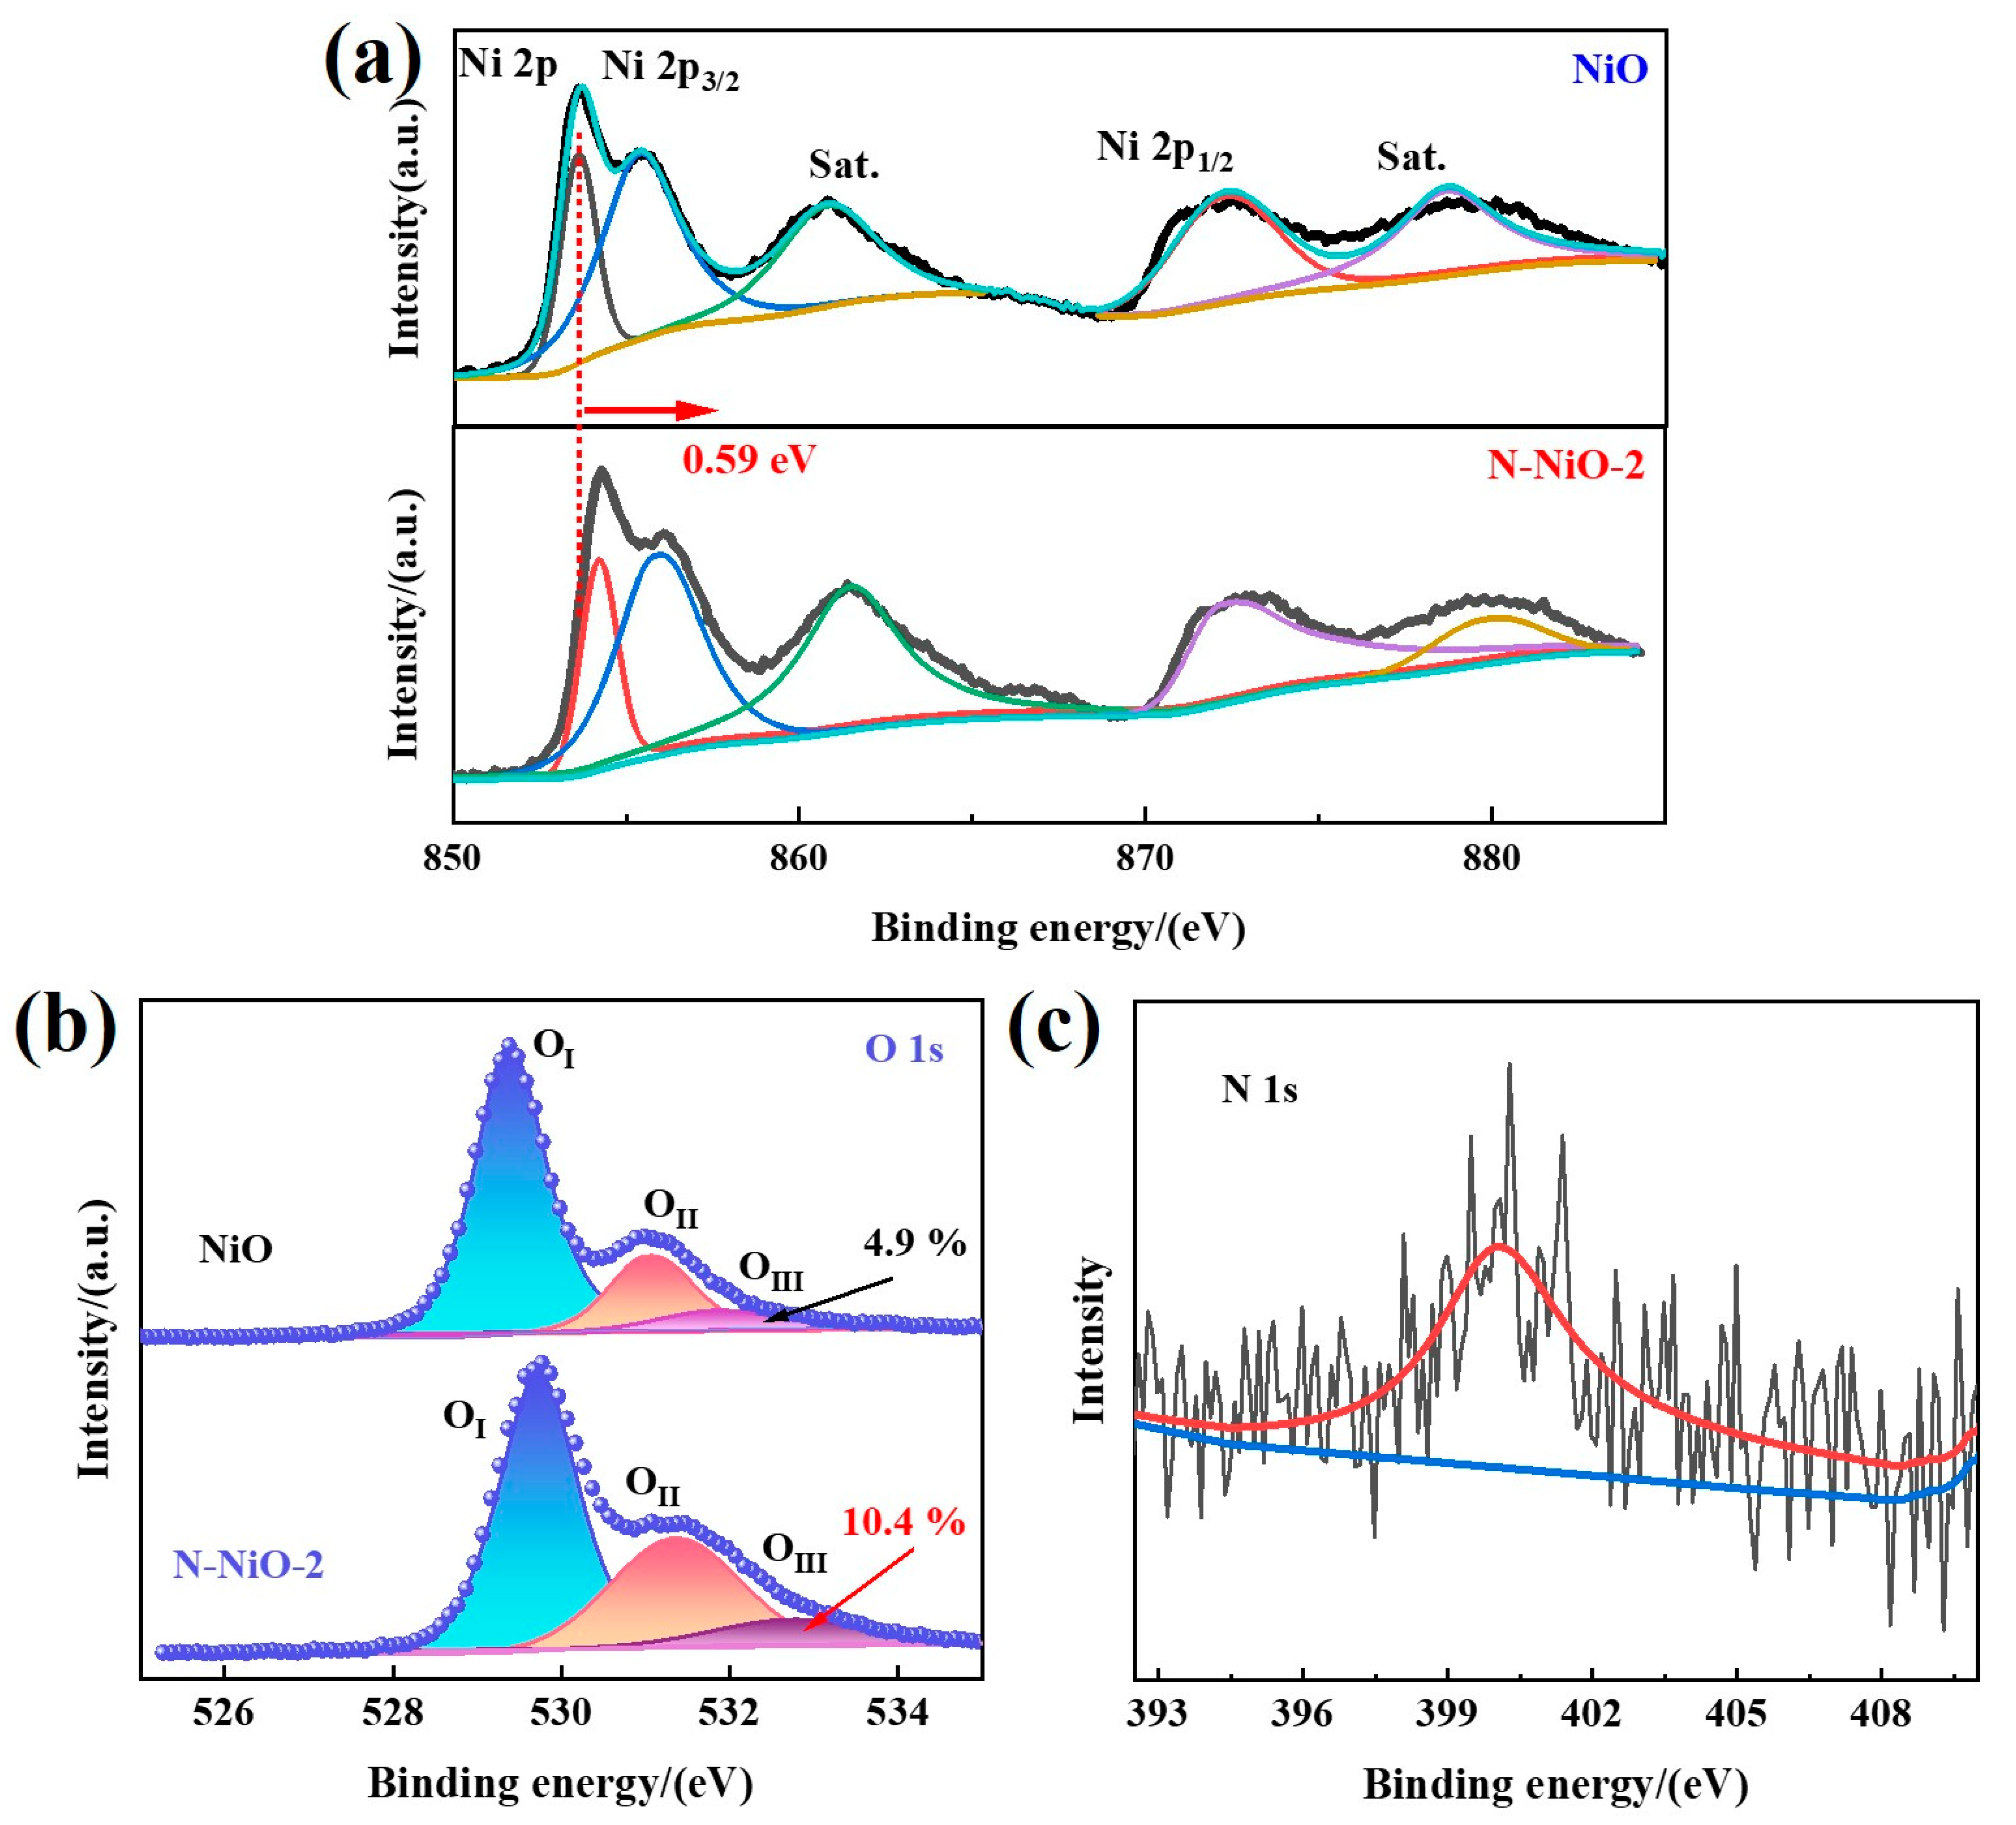
2.4. Surface Chemical States

In the XPS full spectra of the N-NiO-2 shown in Figure S2a, Ni and O elements were present, and no obvious N element was found, which may have been due to the low doping amount. In the C 1s spectrum (Figure S2b), the peaks at 284.8 eV, 286.2 eV, and 288.8 eV corresponded to the C-C, C-O, and C=O of the external carbon source, respectively. Figure 4a corresponds to the energy spectrum of the Ni element. The characteristic peaks of the NiO at the binding energies of 853.6 and 872.0 eV corresponded to Ni 2p3/2 and Ni 2p1/2, respectively, corresponding to Ni2+. In addition, the binding energies of 860.6 and 870.7 eV corresponded to the satellite peaks of Ni 2p [39]. However, compared with the NiO, the Ni 2p characteristic peak of N-NiO-2 shifted 0.59 eV in the direction of increased binding energy, indicating a decrease in the electron-cloud density of the Ni element [40]. This may have been due to the fact that the electronegativity of N is larger than that of Ni, and electrons are more easily attracted by the N element. In addition, it can be seen in Figure 4b that the O 1s were fitted to the three peaks of OI, OII, and OIII with binding energies of 529.2 eV, 531.2 eV, and 531.9 eV, respectively, corresponding to Ni-O lattice oxygen, the hydroxyl oxygen of the adsorbed water on the sample surface and oxygen defects, respectively [41,42,43]. Compared with the NiO, the oxygen defects of the N-NiO-2 increased from 4.9% to 10.4% (Table 1). The increased oxygen defects were more conducive to electron capture, thereby promoting the separation of photogenerated charges [44]. Moreover, the binding energy of 400.0 eV (Figure 4c) corresponded to the N 1s peak, indicating the successful doping of the N element [45].

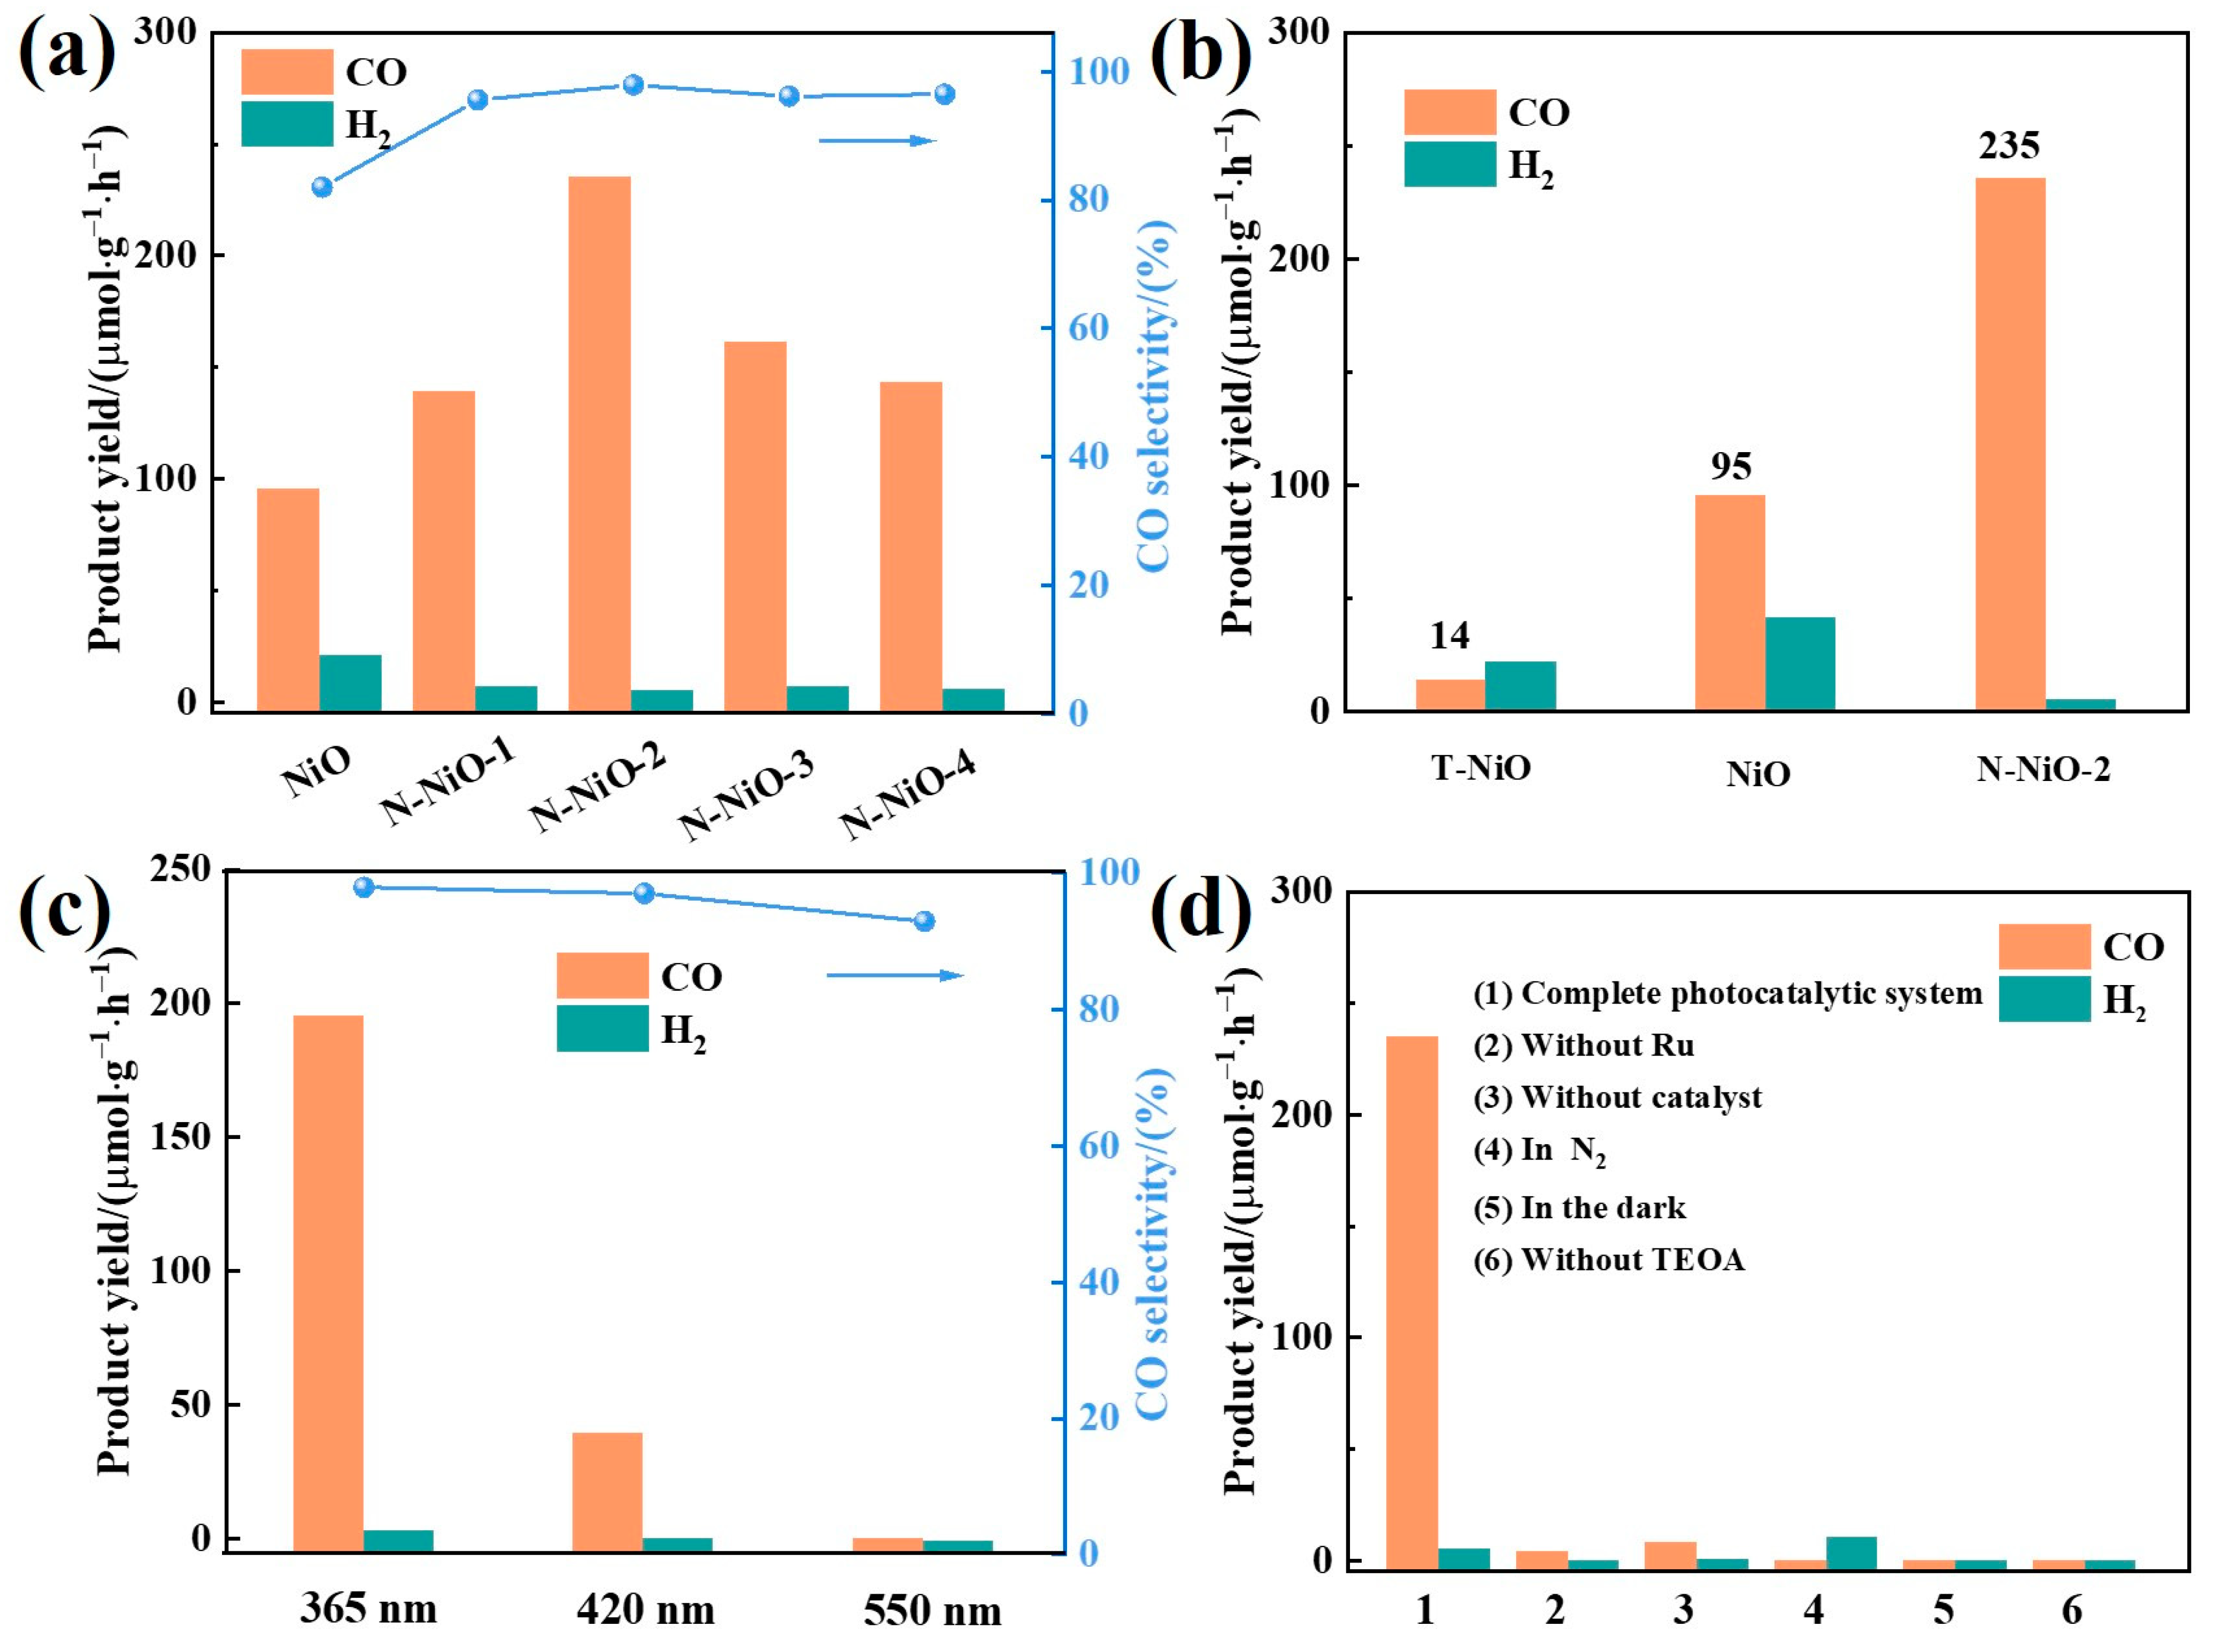
2.5. CO2-Photoreduction Performance

Using a LED lamp as the light source, the prepared samples were tested for CO2-photoreduction activities. As shown in Figure 3, it was found by liquid chromatography and gas chromatography that the product had no substances other than CO and H2. As shown in Figure 5b, the T-NiO exhibited extremely low CO2-reduction activity under 365 nm of light, with a CO yield of 14 μmol·g−1·h−1 and a selectivity of 39%, while the prepared NiO exhibited higher CO yield (95 μmol·g−1·h−1) and selectivity (82%) under molten-salt conditions. Furthermore, when N-doping was introduced into the NiO, the CO yield increased to 235 μmol·g−1·h−1 and the selectivity increased to 98%. As shown in Figure 5a, with the increase in the N content, the yield and selectivity of the CO increased gradually and reached its maximum on the N-NiO-2. In addition, in order to research the photon-utilization rate of the prepared samples, the activity tests were carried out under 420-nanometer and 550-nanometer light sources, and the results are shown in Figure 5c. In order to investigate the necessary conditions of the reaction system in the catalytic process, a control experiment was also carried out. It can be seen from Figure 5d that only trace products were detected under the conditions of no Ru, no catalyst, the use of N2 instead of CO2, no light, and no TEOA, indicating that the CO did arise from the reduction of CO2 in the system, not from the decomposition of the catalyst, and any changes in the reaction system greatly affected the catalytic activity.
In order to further explore the light-utilization efficiency of the system under the irradiation of different wavelengths of light, the 2-hour CO yield of the N-NiO-2, the calculated apparent quantum efficiency (AQE) value, and the optical power of the corresponding wavelength were determined, and they are listed in Table 2. It can be seen from the table that the AQE reached 2.4% at 365 nm, indicating that the activity corresponded to the energy of the light.

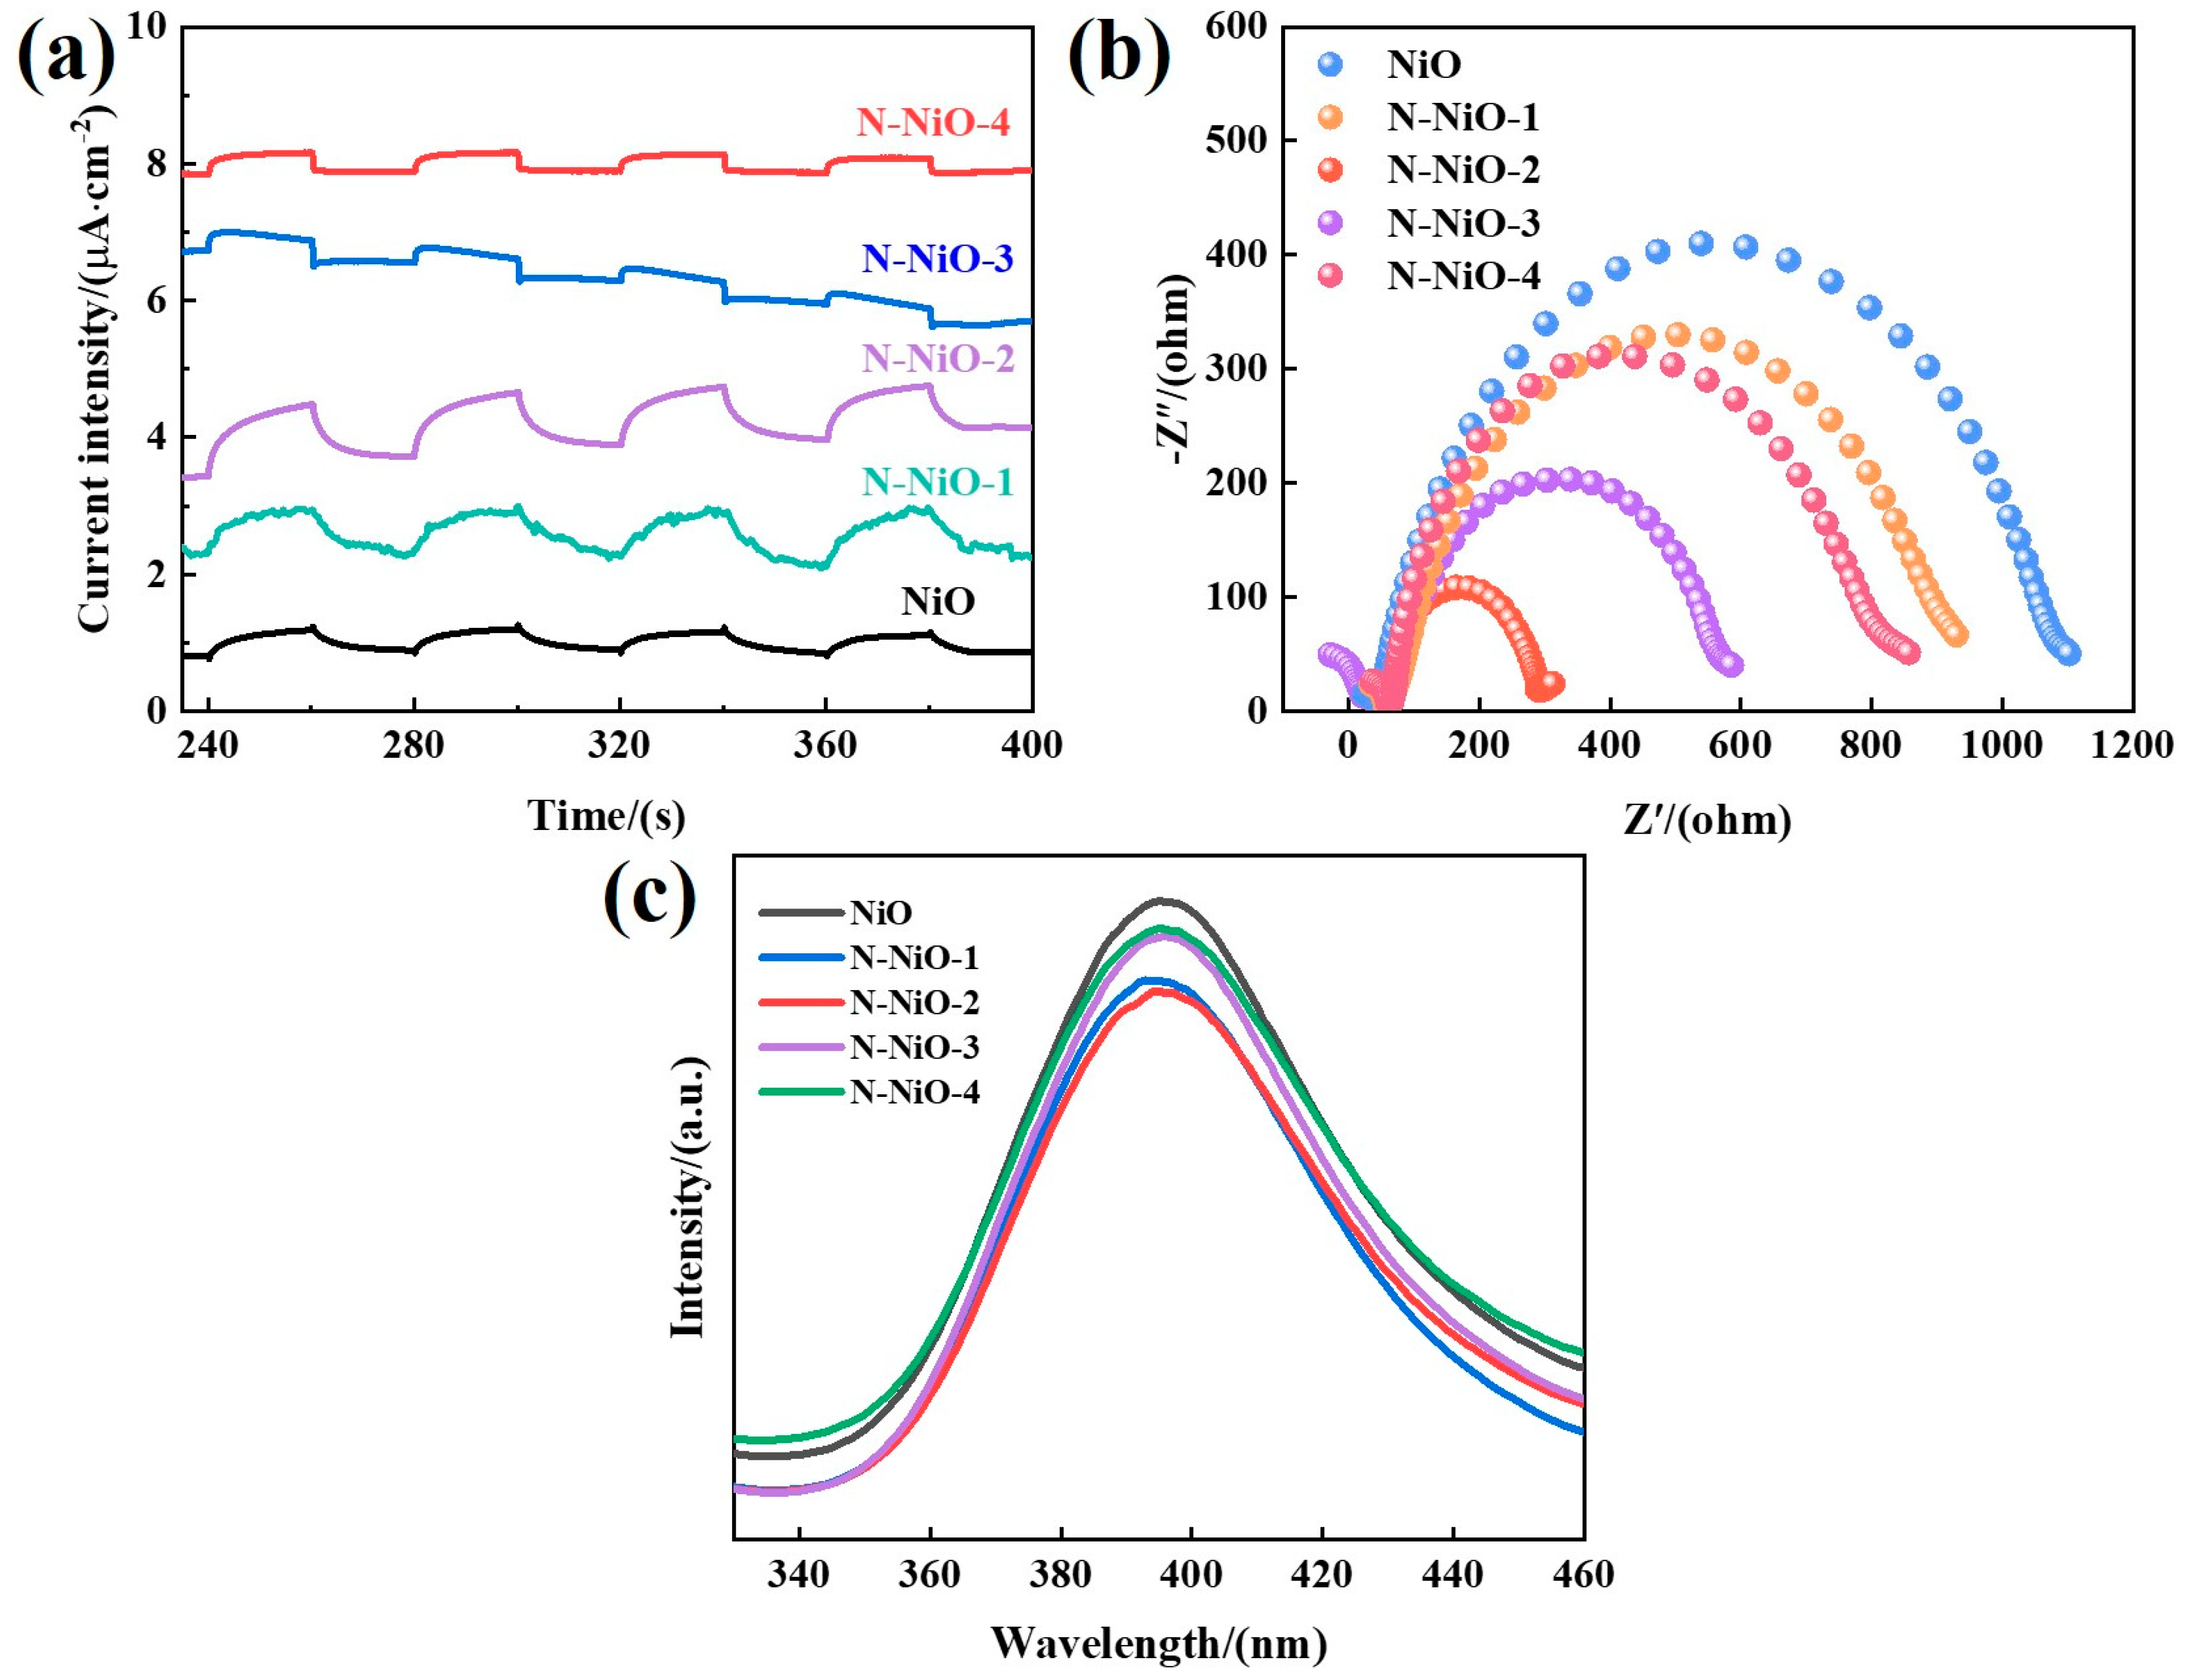
2.6. Evaluating the Separation Performance of Photogenerated Carriers

In order to explore the photogenerated charge-separation abilities of the prepared samples and investigate the resistance during charge transport, photoelectrochemical tests were carried out. As shown in Figure 6a, the N-NiO-x exhibited an enhanced photocurrent response, indicating that the N doping increased the separation of the photogenerated carriers [46]. On the other hand, the electrochemical impedance spectra of the samples (Figure 6b) showed that the doping made the charge-transfer resistance of the NiO smaller, so that the electrons participated in the catalytic reaction more efficiently [47]. In addition, the laws of the photocurrent and the impedance were consistent with the activity law, which also indicated that the charge transfer was the decisive factor in the catalytic activity. Furthermore, the photoluminescence spectra of the prepared samples are shown in Figure 6c. At the excitation wavelength of 250 nm, all the samples showed emission peaks at about 400 nm, which came from the composite luminescence of the photogenerated carriers. The fluorescence-response values of the N-doped samples were weakened, indicating that the degree of recombination of the photogenerated electrons and holes reduced, resulting in more effectively separated electrons, improving the catalytic performance of the photocatalytic reduction system [48].
The EPR spectra of the samples at room temperature (Figure 7) revealed the presence of defects in the samples. The Lorentzian linear resonance peaks at g = 2.002 indicated the presence of unpaired electrons in the samples [49,50,51]. The results of the EPR and XPS showed that there were oxygen defects in the samples. The higher Lorentz resonance signal indicated that the N-NiO-2 had more oxygen defects than the NiO, which indicated that the molten-salt system effectively introduced oxygen defects into the NiO, and the presence of N could further increase the formation of oxygen defects. The presence of oxygen defects formed an electron-capture trap in the semiconductor, which encouraged the separation of electrons and holes [52]. The CO2 combined with the accumulated electrons in the defects and was reduced to support the improvement in the reaction performance.

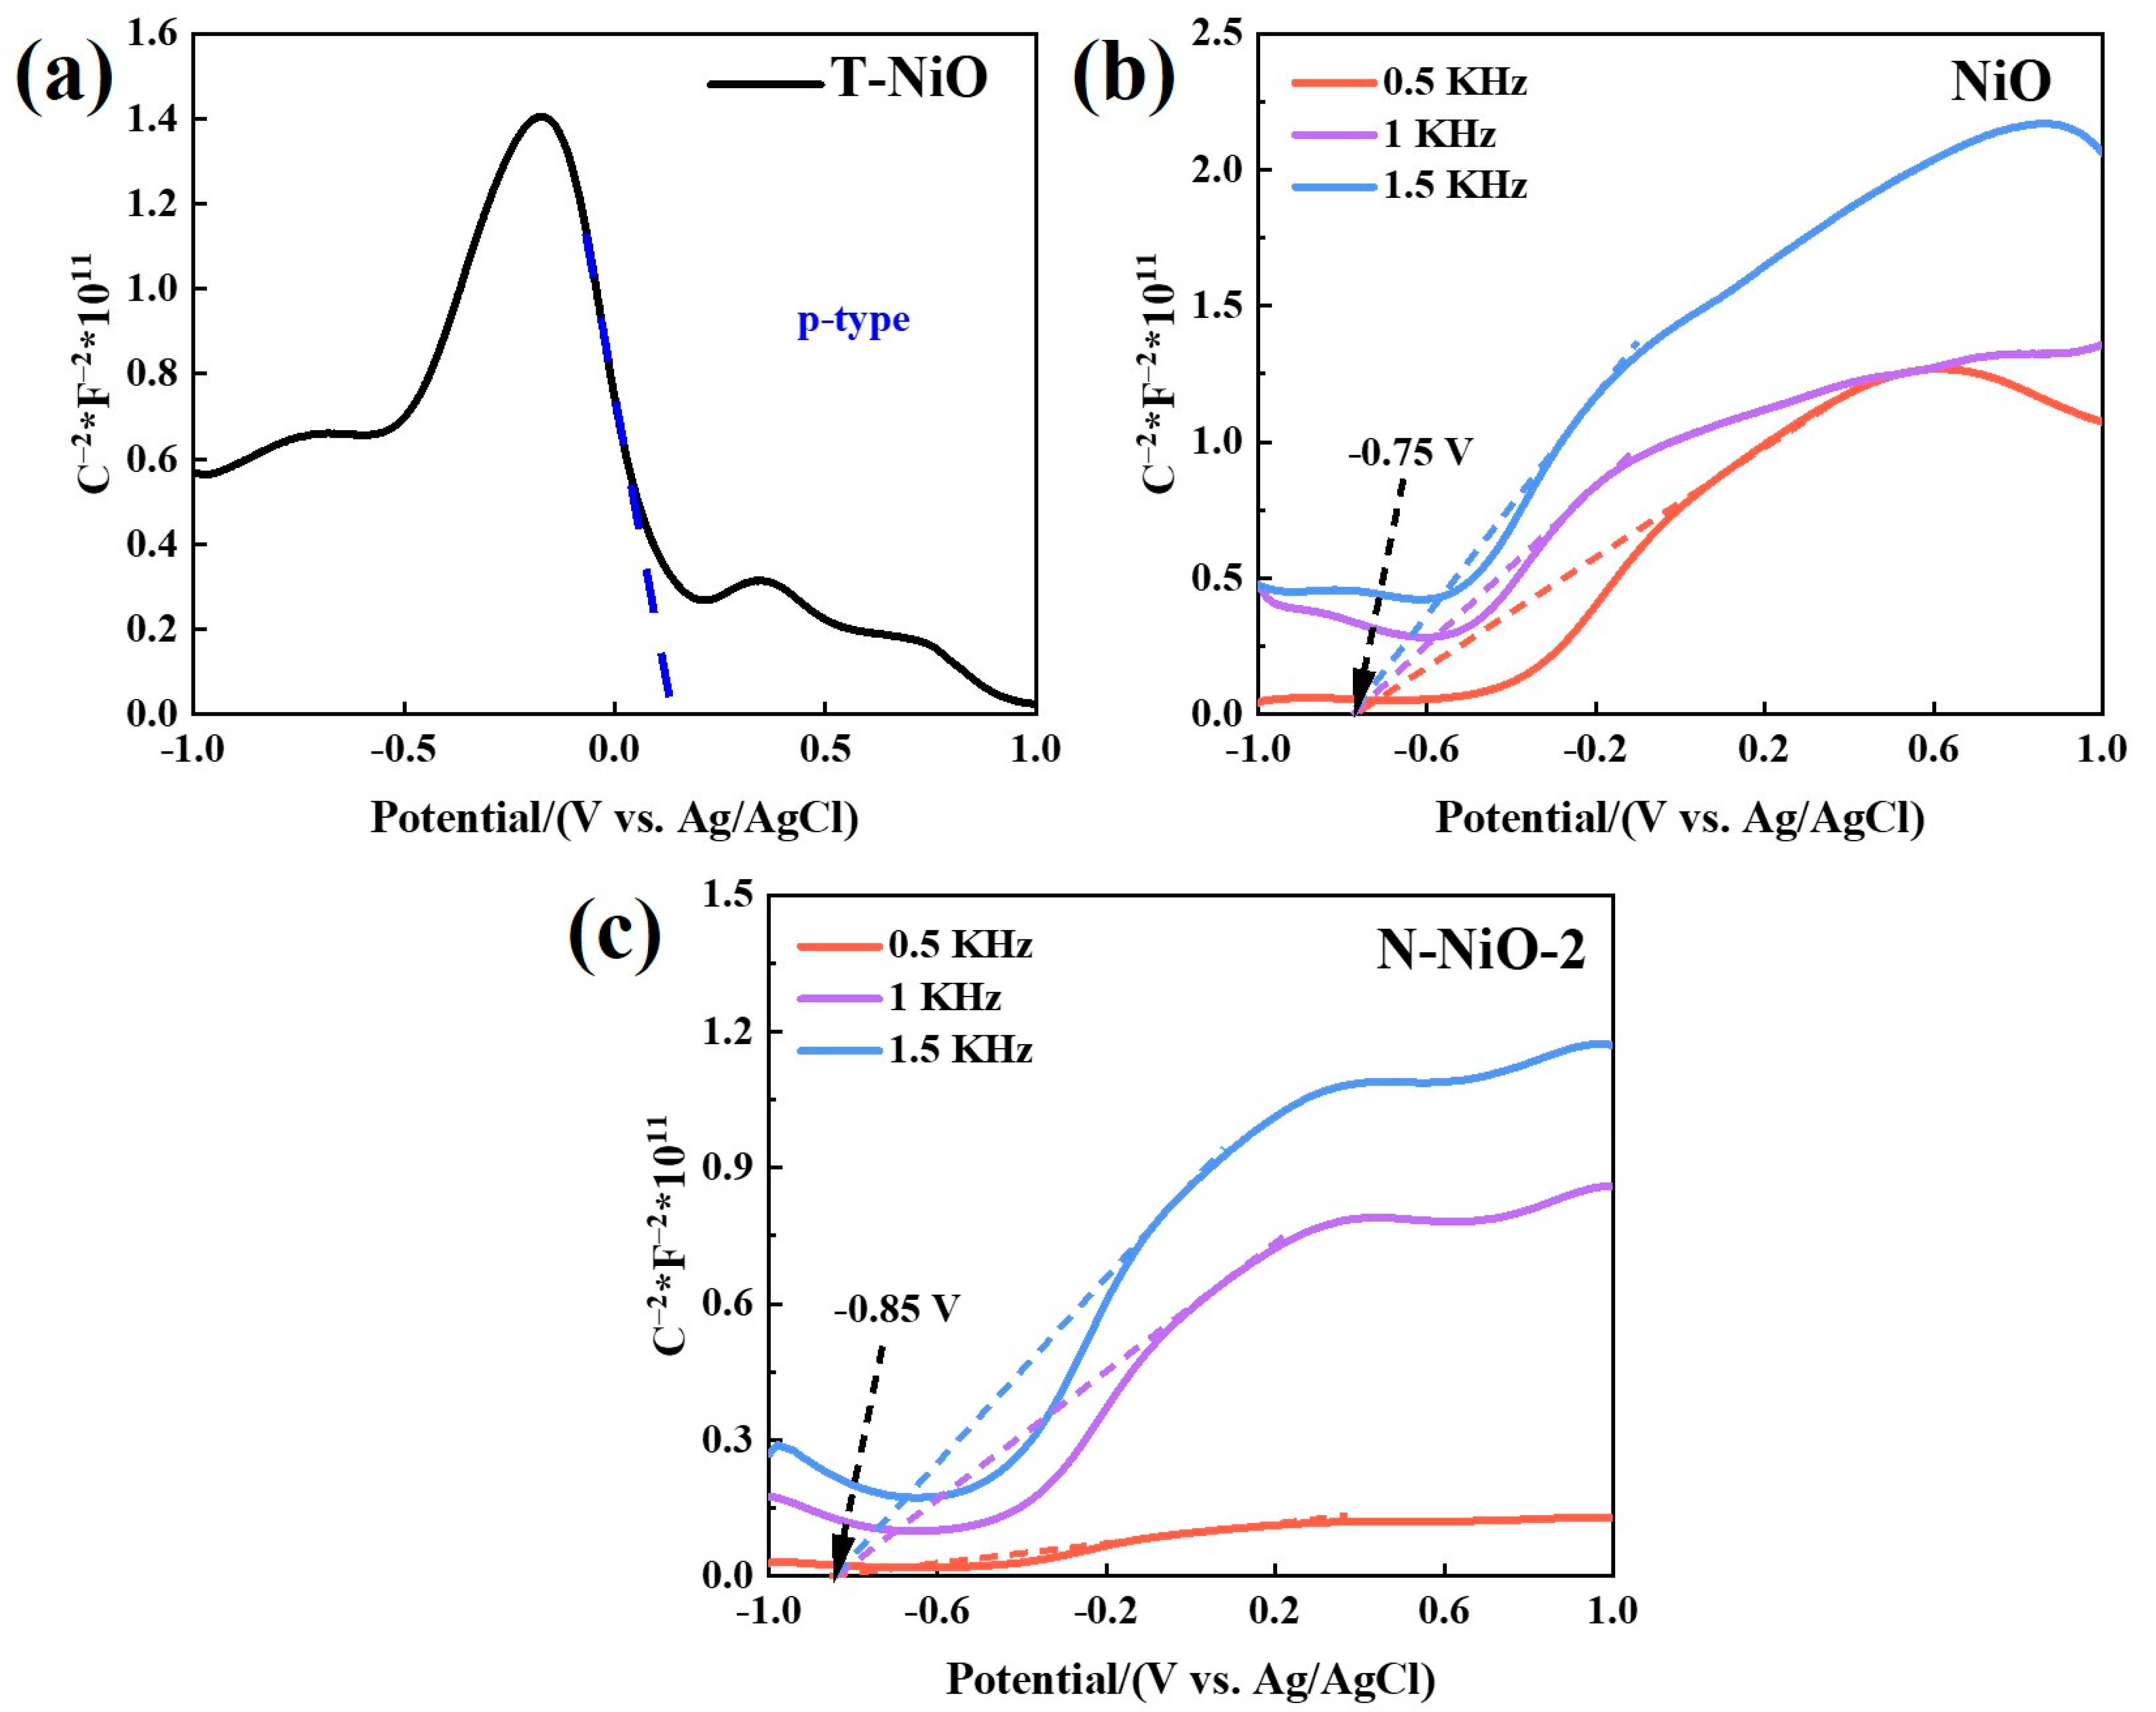
2.7. Energy-Band Structure

In order to study the energy-band structures and redox properties of the prepared samples, the flat band potentials of the samples were tested via photoelectrochemical Mott–Schottky (M–S) analysis. As shown in Figure 8a, the T-NiO exhibited the characteristics of a p-type semiconductor [53], while the NiO in a molten-salt environment (Figure 8b) exhibited the characteristics of an n-type semiconductor [54], indicating that the molten salt encouraged the transformation of the NiO semiconductor type. The surface of the T-NiO itself was rich in holes, so it showed p-type characteristics. The reduction environment in the molten-salt atmosphere encouraged the formation of oxygen vacancies on the surface of the NiO, further enriching it with surface electrons to realize electron doping. Furthermore, the flat-band potentials of the NiO and N-NiO-2 were −0.75 V and −0.85 V (vs. Ag/AgCl pH = 7), respectively, which corresponded to −0.55 V and −0.65 V (vs. NHE pH = 7), respectively, as shown in Figure 8b,c. In general, the conduction band of the n-type semiconductors was about 0.1 V more negative than the flat-band potential [55], so the conduction band of the N-NiO-2 was reduced from −0.65 V to −0.75 V (vs. NHE pH = 7). This indicates that the N doping reduced the conduction-band position of the NiO and enhanced the reducibility of the reaction. In addition, the valence-band position of the N-NiO-2 was 2.45 V, according to the band-gap diagram obtained through the optical absorption spectrum.

2.8. Possible Reaction Mechanism

Figure 9 shows the physical adsorption isotherms of the CO2 on the prepared samples. Compared with the pure NiO, the adsorption capacity of the N-NiO-x materials for the CO2 increased first and then decreased with the increase in the N content, and it reached a maximum with the N-NiO-2 sample, which was consistent with the order of reactivity. These results show that the N doping increased the adsorption of CO2 on the surface of the NiO, and the combination of electrons with CO2 on the surface of the NiO facilitated the photoreduction performance of the CO2, indicating that the adsorption of CO2 was the decisive factor in the activity.
The possible mechanism of the whole reaction is shown in Figure 10. Under illumination, the N-NiO-x semiconductor became excited, and it produced electron–hole pairs (e–h+). Subsequently, the excited electrons in the conduction band of the N-NiO-x transferred to the defect energy level and accumulated there. The holes accumulated in the valence band were consumed by triethanolamine (TEOA), and the TEOA oxidized to diethanolamine and glycolaldehyde. At the same time, Ru(bpy)32+ activated to the excited state of Ru(bpy)32+* under light irradiation and was then quenched by the TEOA to form Ru(bpy)3+. Subsequently, the electrons of the Ru(bpy)3+ were transferred to the conduction band of the NiO, and further accumulated at the defect level, and the Ru(bpy)3+ was oxidized to the initial state, Ru(bpy)32+. Furthermore, CO2 molecules combined with the excited-state electrons accumulated at the N-NiO-x defect level and protons in water and converted into the product, CO.

3. Experimental Section

3.1. Materials

The used chemicals were nickel nitrate hexahydrate (Ni(NO3)2·6H2O, Sinopharm Chemical Reagent Co., Ltd., Shanghai, China), sodium hydroxide (NaOH, Shanghai Aladdin Biochemical Technology Co., Ltd., Shanghai, China), anhydrous lithium chloride (LiCl, Shanghai McLean Biochemical Technology Co., Ltd., Shanghai, China), potassium chloride (KCl, Xilong Science Co., Ltd., Shantou, China), urea (CH4N2O, Shanghai McLean Biochemical Technology Co., Ltd., Shanghai, China), [Ru(bpy)3]Cl2·6H2O(Shanghai McLean Biochemical Technology Co., Ltd., Shanghai, China), triethanolamine (TEOA, Xilong Science Co., Ltd., Shantou, China) and acetonitrile (MeCN, Xilong Science Co., Ltd., Shantou, China). All chemicals were analytically pure and could be used directly without purification after purchase.

3.2. Synthesis of Precursor Ni(OH)2

Precursor Ni(OH)2 was prepared by a simple precipitation method: a total of 10 mmol Ni(NO3)2·6H2O was dissolved in 40 mL of deionized (DI) water under magnetic stirring, after which 20 mmol of NaOH was added when the solid was completely dissolved. After 30 min of stirring, the precipitate was collected by filtration, washed once with 10 mL of deionized (DI) water and anhydrous ethanol, and dried at 60 °C for 8 h to obtain precursor Ni(OH)2.

3.3. Synthesis of NiO

The 5 mmol of precursor Ni(OH)2 was fully ground with 2.7 g of LiCl and 3.3 g of KCl and then calcined at 400 °C for 3 h. After the reaction, the bulk was fully dissolved in DI water and filtered, after which it was washed several times with DI water and ethanol alternately before drying at 60 °C for 8 h to obtain NiO. For comparison, traditional P-type NiO (T-NiO) was obtained by directly calcining Ni(OH)2.

3.4. Synthesis of N-NiO-x

With urea as the nitrogen-doping source, excessive urea was added to the reaction to reduce the effect of volatilization. The preparation process of nitrogen-doped NiO was as follows: a total of 5 mmol of precursor Ni(OH)2, m g urea (m = 0.2,0.3,0.4,0.5), 2.7 g of LiCl, and 3.3 g of KCl were fully ground and then calcined at 400 °C for 3 h. The bulk after reaction was fully dissolved in appropriate DI water and filtered, after which it was washed several times with DI water and ethanol alternately and dried at 60 °C for 8 h to obtain N-NiO-x (x is 1, 2, 3, 4). Nitrogen and oxygen contents over N-NiO-2 were determined by inert-gas-fusion technique using a nitrogen-and-oxygen elemental analyzer (LECO Corp., TC-436AR, St. Joseph, USA). The carbon content was obtained by carbon–sulfur analyzer. The ratio of C over N-NiO-2 was 0.02 wt% (probable error), which was negligible compared with 2.03 wt% N and 19.21 wt% (Table S2).

3.5. Photocatalytic CO2 Reduction

In this research, the catalytic performances of the samples were evaluated for CO2-reduction activity. The light source was an 80-watt LED lamp (illumination wavelengths were 365 nm, 420 nm, 550 nm, Zhenjiang Yinzhu Chemical Technology Co., Ltd., Zhenjiang, China). Typically, 30 mg of the catalyst, 5 mg of [Ru(bpy)3]Cl2·6H2O (denoted as Ru), 3 mL of MeCN, 2 mL of H2O, and 1 mL of TEOA were added to a 50-milliliter quartz reactor. Before the start of the reaction, the reactor was first vented with pure CO2 for 30 min in the dark, in order to make the reaction system reach the adsorption saturation of CO2; next, 1 mL of gas was extracted every 2 h under illumination and injected into a chromatographic system (H2 and CO were detected by thermal-conductivity detector and flame-ionization detector, respectively).
The CO selectivity was calculated using the following formula:
CO   Selectivity   ( S CO ) =   Y C O Y C O + Y H 2    
where YCO and YH2 represent the yields of CO and H2, respectively.
Furthermore, the optical powers at different wavelengths were measured via an optical power meter, with a probe area of 1 × 1 cm2 to contact light. The light-irradiation area was 2.5 × 2.5 cm2. The apparent quantum efficiency (AQE) was calculated using the following formula:
A O E = 2 × t h e   n u m b e r   o f   e v o l v e d   C O   m o l e c u l e s N
N = E λ h c  
where
N: the number of incident photons;
E: the accumulated light energy in the given area (J);
  λ : the wavelength of the light;
h: Planck’s constant (6.626 × 10⁻³⁴ J·s);
c: the velocity of light (3 × 10⁸ m·s−1).

3.6. Characterizations

The phase structure of the material was measured using X-ray diffraction (XRD, Cu , λ = 0.15406 nm, Bruker D8 Advance). The microstructure and element distributions of the prepared samples were evaluated using scanning-electron microscopy (SEM, FESEM ZEISS sigma 500, Oberkochen, Batenwerburg, GER), transmission-electron microscopy (TEM, JEM-2100F), and energy-dispersive X-ray spectroscopy (EDX). The X-ray photoelectron spectra (XPS, Thermo Fisher, K-Alpha, Waltham, MA, USA) were examined to study the chemical states of the elements. The UV–Vis diffuse-reflectance spectra (DRS, Shimadzu UV-2600, Kyoto, Japan) were examined using BaSO4 as the reference standard, in order to study the optical absorption properties of the samples. The vacancy-defect state in the photocatalyst was analyzed with electron paramagnetic resonance (EPR, Bruker ER200-SLC, Billerica, MA, USA) measurement at room temperature. The CO2 adsorption at 273 K under ice–water-mixture conditions was studied on an automatic physical adsorption instrument (ASAP 2020, Norcross, Georgia, USA). Steady-state fluorescence (PL) spectra detected the reintegration of exposed electron–hole pairs at an excitation wavelength of 250 nm with a fluorescence spectrometer (FLS 980, Edinburgh, Scotland). Photoelectrochemical measurements were carried out in a three-electrode system on an electrochemical workstation (Shanghai Chenhua CHI-660E, Shanghai, China) using 0.1 mol/L Na2SO4 or 0.1 mol/L K3Fe(CN)6/K4Fe(CN)6 buffer solution as the electrolyte solution, Ag/AgCl as the reference electrode, Pt wire as the auxiliary electrode, and indium-tin-oxide conductive glass (ITO) as the working electrode (10 mg of the sample was dissolved in 3 drops of ethanol, including 10 μL of nafion solution, after which the solution was subjected to ultrasound for 40 min to completely disperse the sample, with an effective loading area of 0.25 cm2).

4. Conclusions

In summary, NiO semiconductors doped with non-metallic nitrogen were successfully prepared using a molten-salt method. Compared with the p-type NiO, the reduction performance of the n-type NiO was improved. Furthermore, the photoreduction of CO2 by the n-type NiO was more efficient with N doping. The improvement in the photocatalytic performance of the NiO semiconductor doped with non-metallic nitrogen was mainly due to three factors: (1) the molten-salt atmosphere increased the transformation of the p-type NiO to n-type and the conduction-band position met the potential requirements for CO2 reduction, thus enhancing the reduction performance; (2) the nitrogen doping increased the adsorption and activation of CO2 on the surface of the NiO semiconductor, and realized the rapid conversion of CO2; 3) the defect-energy level induced by the oxygen defects increased the transfer and separation of electrons, and the CO2 obtained electrons at the oxygen defects more easily and reduced. This research provides a new reference for solving the insufficient reduction performance of p-type NiO, as well as a new control method for inhibiting the photogenerated charge recombination of n-type NiO semiconductors.

Supplementary Materials

The following supporting information can be downloaded at: https://www.mdpi.com/article/10.3390/molecules28062435/s1, Table S1: Average particle diameters of the samples; Table S2: The contents of C and N obtained by carbon-sulfur analyzer and nitrogen-oxygen elemental analyzer; Figure S1: Photos of NiO and NiO-x; Figure S2: XPS survey spectra (a) and C 1s spectra (b) of N-NiO-2; Figure S3: TCD (a) and FID (b) of gas chromatogram; (c) Liquid chromatogram.

Author Contributions

Conceptualization, F.W. and K.Y.; methodology, Z.Y.; XRD, DRS, SEM and TEM analysis, X.L. and K.S.; XPS analysis, K.L.; resources, W.H.; data curation, K.L.; writing—original draft preparation, F.W.; writing—review and editing, K.Y. and C.Y.; supervision, K.Y. and C.Y.; funding acquisition, K.Y. and C.Y. All authors have read and agreed to the published version of the manuscript.

Funding

This research was funded by the National Natural Science Foundation of China (21962006, 22272034), Jiangxi Provincial Academic and Technical Leaders Training Program—Young Talents (20204BCJL23037), Program of Qingjiang Excellent Young Talents, JXUST (JXUSTQJBJ2020005), Ganzhou Young Talents Program of Jiangxi Province (204301000111), Postdoctoral Research Projects of Jiangxi Province in 2020 (204302600031), Jiangxi Province “Double Thousand Plan” (Yang Kai, Hou Yang), Guangdong Province Universities and Colleges Pearl River Scholar Funded Scheme (2019), Jiangxi Provincial Natural Science Foundation (20224BAB203018, 20212BAB213016), and the Foundation Engineering Research Center of Tungsten Resources High-Efficiency Development and Application Technology of the Ministry of Education (W-2021YB003).

Institutional Review Board Statement

Not applicable.

Informed Consent Statement

Not applicable.

Data Availability Statement

Not applicable.

Conflicts of Interest

The authors declare no conflict of interest.

Sample Availability

Samples of the compounds are not available from the authors.

References

  1. Tang, J.; Guo, R.; Zhou, W.; Huang, C.; Pan, W. Ball-Flower like NiO/g-C3N4 Heterojunction for Efficient Visible Light Photocatalytic CO2 Reduction. Appl. Catal. B-Environ. 2018, 237, 802–810. [Google Scholar] [CrossRef]
  2. Chen, S.; Yu, J.; Zhang, J. Enhanced Photocatalytic CO2 Reduction Activity of MOF-Derived ZnO/NiO Porous Hollow Spheres. J. CO2 Util. 2018, 24, 548–554. [Google Scholar] [CrossRef]
  3. Han, C.; Zhang, R.; Ye, Y.; Wang, L.; Ma, Z.; Su, F.; Xie, H.; Zhou, Y.; Wong, P.K.; Ye, L. Chainmail Co-Catalyst of NiO Shell-Encapsulated Ni for Improving Photocatalytic CO2 Reduction over g-C3N4. J. Mater. Chem. A 2019, 7, 9726–9735. [Google Scholar] [CrossRef]
  4. Hiragond, C.B.; Lee, J.; Kim, H.; Jung, J.W.; Cho, C.H.; In, S.I. A Novel N-Doped Graphene Oxide Enfolded Reduced Titania for Highly Stable and Selective Gas-Phase Photocatalytic CO2 Reduction into CH4: An in-Depth Study on the Interfacial Charge Transfer Mechanism. Chem. Eng. J. 2021, 416, 127978. [Google Scholar] [CrossRef]
  5. Bie, C.; Zhu, B.; Xu, F.; Zhang, L.; Yu, J. In Situ Grown Monolayer N-Doped Graphene on CdS Hollow Spheres with Seamless Contact for Photocatalytic CO2 Reduction. Adv. Mater. 2019, 31, 1902868. [Google Scholar] [CrossRef]
  6. Wang, L.; Zhu, B.; Cheng, B.; Zhang, J.; Zhang, L.; Yu, J. In-Situ Preparation of TiO2/N-Doped Graphene Hollow Sphere Photocatalyst with Enhanced Photocatalytic CO2 Reduction Performance. Chin. J. Catal. 2021, 42, 1648–1658. [Google Scholar] [CrossRef]
  7. Neațu, Ș.; Maciá-Agulló, J.; Garcia, H. Solar Light Photocatalytic CO2 Reduction: General Considerations and Selected Bench-Mark Photocatalysts. Int. J. Mol. Sci. 2014, 15, 5246–5262. [Google Scholar] [CrossRef] [PubMed] [Green Version]
  8. Mao, J.; Li, K.; Peng, T. Recent Advances in the Photocatalytic CO2 Reduction over Semiconductors. Catal. Sci. Technol. 2013, 3, 2481. [Google Scholar] [CrossRef]
  9. Kong, X.; Lv, F.; Zhang, H.; Yu, F.; Wang, Y.; Yin, L.; Huang, J.; Feng, Q. NiO Load K2Fe4O7 Enhanced Photocatalytic Hydrogen Production and Photo-Generated Carrier Behavior. J. Alloys Comp. 2022, 903, 163864. [Google Scholar] [CrossRef]
  10. Jiao, Z.F.; Tian, Y.M.; Zhang, B.; Hao, C.H.; Qiao, Y.; Wang, Y.X.; Qin, Y.; Radius, U.; Braunschweig, H.; Marder, T.B.; et al. High Photocatalytic Activity of a NiO Nanodot-Decorated Pd/SiC Catalyst for the Suzuki-Miyaura Cross-Coupling of Aryl Bromides and Chlorides in Air under Visible Light. J. Catal. 2020, 389, 517–524. [Google Scholar] [CrossRef]
  11. He, L.; Zhang, W.; Liu, S.; Zhao, Y. Three-Dimensional Palm Frondlike Co3O4@NiO/Graphitic Carbon Composite for Photocatalytic CO2 Reduction. J. Alloys Comp. 2023, 934, 168053. [Google Scholar] [CrossRef]
  12. Prajapati, P.K.; Singh, H.; Yadav, R.; Sinha, A.K.; Szunerits, S.; Boukherroub, R.; Jain, S.L. Core-Shell Ni/NiO Grafted Cobalt (II) Complex: An Efficient Inorganic Nanocomposite for Photocatalytic Reduction of CO2 under Visible Light Irradiation. Appl. Surf. Sci. 2019, 467–468, 370–381. [Google Scholar] [CrossRef]
  13. Kamata, R.; Kumagai, H.; Yamazaki, Y.; Sahara, G.; Ishitani, O. Photoelectrochemical CO2 Reduction Using a Ru(II)–Re(I) Supramolecular Photocatalyst Connected to a Vinyl Polymer on a NiO Electrode. ACS Appl. Mater. Interfaces 2019, 11, 5632–5641. [Google Scholar] [CrossRef] [PubMed]
  14. Tahir, M.; Tahir, B.; Amin, N.A.S.; Muhammad, A. Photocatalytic CO2 Methanation over NiO/In2O3 Promoted TiO2 Nanocatalysts Using H2O and/or H2 Reductants. Energy Convers. Manag. 2016, 119, 368–378. [Google Scholar] [CrossRef]
  15. Hong, W.; Zhou, Y.; Lv, C.; Han, Z.; Chen, G. NiO Quantum Dot Modified TiO2 toward Robust Hydrogen Production Performance. ACS Sustain. Chem. Eng. 2018, 6, 889–896. [Google Scholar] [CrossRef]
  16. Lan, D.; Pang, F.; Ge, J. Enhanced Charge Separation in NiO and Pd Co-Modified TiO2 Photocatalysts for Efficient and Selective Photoreduction of CO2. ACS Appl. Energy Mater. 2021, 4, 6324–6332. [Google Scholar] [CrossRef]
  17. Chen, W.; Liu, X.; Han, B.; Liang, S.; Deng, H.; Lin, Z. Boosted Photoreduction of Diluted CO2 through Oxygen Vacancy Engineering in NiO Nanoplatelets. Nano Res. 2021, 14, 730–737. [Google Scholar] [CrossRef]
  18. Haq, S.; Sarfraz, A.; Menaa, F.; Shahzad, N.; Din, S.U.; Almukhlifi, H.A.; Alshareef, S.A.; Al Essa, E.M.; Shahzad, M.I. Green Synthesis of NiO-SnO2 Nanocomposite and Effect of Calcination Temperature on Its Physicochemical Properties: Impact on the Photocatalytic Degradation of Methyl Orange. Molecules 2022, 27, 8420. [Google Scholar] [CrossRef]
  19. Wang, Z.; Cheng, B.; Zhang, L.; Yu, J.; Tan, H. BiOBr/NiO S-Scheme Heterojunction Photocatalyst for CO2 Photoreduction. Sol. RRL 2022, 6, 2100587. [Google Scholar] [CrossRef]
  20. Park, B.H.; Kim, M.; Park, N.K.; Ryu, H.J.; Baek, J.; Kang, M. Single Layered Hollow NiO–NiS Catalyst with Large Specific Surface Area and Highly Efficient Visible-Light-Driven Carbon Dioxide Conversion. Chemosphere 2021, 280, 130759. [Google Scholar] [CrossRef]
  21. Xiang, J.; Zhang, T.; Cao, R.; Lin, M.; Yang, B.; Wen, Y.; Zhuang, Z.; Yu, Y. Optimizing the Oxygen Vacancies Concentration of Thin NiO Nanosheets for Efficient Selective CO2 Photoreduction. Sol. RRL 2021, 5, 2100703. [Google Scholar] [CrossRef]
  22. Park, H.R.; Pawar, A.U.; Pal, U.; Zhang, T.; Kang, Y.S. Enhanced Solar Photoreduction of CO2 to Liquid Fuel over RGO Grafted NiO-CeO2 Heterostructure Nanocomposite. Nano Energy 2021, 79, 105483. [Google Scholar] [CrossRef]
  23. Wang, X.; Wang, J.; Li, Y.; Chu, K. Nitrogen-Doped NiO Nanosheet Array for Boosted Electrocatalytic N2 Reduction. ChemCatChem 2019, 11, 4529–4536. [Google Scholar] [CrossRef]
  24. Jaiswal, R.; Bharambe, J.; Patel, N.; Dashora, A.; Kothari, D.C.; Miotello, A. Copper and Nitrogen Co-Doped TiO2 Photocatalyst with Enhanced Optical Absorption and Catalytic Activity. Appl. Catal. B-Environ. 2015, 168–169, 333–341. [Google Scholar] [CrossRef]
  25. An, L.; Park, Y.; Sohn, Y.; Onishi, H. Effect of Etching on Electron–Hole Recombination in Sr-Doped NaTaO3 Photocatalysts. J. Phys. Chem. C 2015, 119, 28440–28447. [Google Scholar] [CrossRef] [Green Version]
  26. Qian, B.; Chen, Y.; Tade, M.O.; Shao, Z. BaCo0.6Fe0.3Sn0.1O3−δ Perovskite as a New Superior Oxygen Reduction Electrode for Intermediate-to-Low Temperature Solid Oxide Fuel Cells. J. Mater. Chem. A 2014, 2, 15078. [Google Scholar] [CrossRef]
  27. Wang, W.; Tadé, M.O.; Shao, Z. Nitrogen-Doped Simple and Complex Oxides for Photocatalysis: A Review. Prog. Mater. Sci. 2018, 92, 33–63. [Google Scholar] [CrossRef]
  28. Luo, L.; Wang, S.; Wang, H.; Tian, C.; Jiang, B. Molten-Salt Technology Application for the Synthesis of Photocatalytic Materials. Energy Technol. 2021, 9, 2000945. [Google Scholar] [CrossRef]
  29. Liu, M.; Mu, Y.F.; Yao, S.; Guo, S.; Guo, X.W.; Zhang, Z.M.; Lu, T.B. Photosensitizing single-site metal− organic framework enabling visible-light-driven CO2 reduction for syngas production. Appl. Catal. B-Environ. 2019, 245, 496–501. [Google Scholar] [CrossRef]
  30. Yang, J.; Wang, Z.; Jiang, J.; Chen, W.; Liao, F.; Ge, X.; Zhou, X.; Chen, M.; Li, R.; Xue, Z.; et al. In-Situ Polymerization Induced Atomically Dispersed Manganese Sites as Cocatalyst for CO2 Photoreduction into Synthesis Gas. Nano Energy 2020, 76, 105059. [Google Scholar] [CrossRef]
  31. Xiong, J.; Wang, X.; Wu, J.; Han, J.; Lan, Z.; Fan, J. In Situ Fabrication of N-Doped ZnS/ZnO Composition for Enhanced Visible-Light Photocatalytic H2 Evolution Activity. Molecules 2022, 27, 8544. [Google Scholar] [CrossRef]
  32. Zhang, J.; Wu, Y.; Xing, M.; Leghari, S.A.K.; Sajjad, S. Development of Modified N Doped TiO2 Photocatalyst with Metals, Nonmetals and Metal Oxides. Energy Environ. Sci. 2010, 3, 715. [Google Scholar] [CrossRef]
  33. Sarngan, P.P.; Lakshmanan, A.; Sarkar, D. Influence of Anatase-Rutile Ratio on Band Edge Position and Defect States of TiO2 Homojunction Catalyst. Chemosphere 2022, 286, 131692. [Google Scholar] [CrossRef] [PubMed]
  34. Sun, M.; Zhou, Y.; Yu, T. Synthesis of g-C3N4/NiO-Carbon Microsphere Composites for Co-Reduction of CO2 by Photocatalytic Hydrogen Production from Water Decomposition. J. Clean. Prod. 2022, 357, 131801. [Google Scholar] [CrossRef]
  35. Wang, J.; Yin, S.; Komatsu, M.; Zhang, Q.; Saito, F.; Sato, T. Photo-Oxidation Properties of Nitrogen Doped SrTiO3 Made by Mechanical Activation. Appl. Catal. B-Environ 2004, 52, 11–21. [Google Scholar] [CrossRef]
  36. Senobari, S.; Nezamzadeh-Ejhieh, A. A P-n Junction NiO-CdS Nanoparticles with Enhanced Photocatalytic Activity: A Response Surface Methodology Study. J. Mol. Liq. 2018, 257, 173–183. [Google Scholar] [CrossRef]
  37. Deng, C.; Hu, H.; Yu, H.; Wang, M.; Ci, M.; Wang, L.; Zhu, S.; Wu, Y.; Le, H. 1D Hierarchical CdS NPs/NiO NFs Heterostructures with Enhanced Photocatalytic Activity under Visible Light Irradiation. Adv. Powder Technol. 2020, 31, 3158–3167. [Google Scholar] [CrossRef]
  38. Hu, X.; Wang, G.; Wang, J.; Hu, Z.; Su, Y. Step-Scheme NiO/BiOI Heterojunction Photocatalyst for Rhodamine Photodegradation. Appl. Surf. Sci. 2020, 511, 145499. [Google Scholar] [CrossRef]
  39. Chen, J.; Wang, M.; Han, J.; Guo, R. TiO2 Nanosheet/NiO Nanorod Hierarchical Nanostructures: P–n Heterojunctions towards Efficient Photocatalysis. J. Colloid Interf. Sci. 2020, 562, 313–321. [Google Scholar] [CrossRef] [PubMed]
  40. Liang, R.; Wang, S.; Lu, Y.; Yan, G.; He, Z.; Xia, Y.; Liang, Z.; Wu, L. Assembling Ultrafine SnO2 Nanoparticles on MIL-101(Cr) Octahedrons for Efficient Fuel Photocatalytic Denitrification. Molecules 2021, 26, 7566. [Google Scholar] [CrossRef]
  41. Hao, X.; Cui, Z.; Zhou, J.; Wang, Y.; Hu, Y.; Wang, Y.; Zou, Z. Architecture of High Efficient Zinc Vacancy Mediated Z-Scheme Photocatalyst from Metal-Organic Frameworks. Nano Energy 2018, 52, 105–116. [Google Scholar] [CrossRef]
  42. Naik, K.M.; Hamada, T.; Higuchi, E.; Inoue, H. Defect-Rich Black Titanium Dioxide Nanosheet-Supported Palladium Nanoparticle Electrocatalyst for Oxygen Reduction and Glycerol Oxidation Reactions in Alkaline Medium. ACS Appl. Energy Mater. 2021, 4, 12391–12402. [Google Scholar] [CrossRef]
  43. Nosaka, Y.; Nosaka, A.Y. Generation and Detection of Reactive Oxygen Species in Photocatalysis. Chem. Rev. 2017, 117, 11302–11336. [Google Scholar] [CrossRef]
  44. Qi, K.; Liu, S.; Qiu, M. Photocatalytic Performance of TiO2 Nanocrystals with/without Oxygen Defects. Chin. J. Catal. 2018, 39, 867–875. [Google Scholar] [CrossRef]
  45. Qian, J.; Bai, X.; Xi, S.; Xiao, W.; Gao, D.; Wang, J. Bifunctional Electrocatalytic Activity of Nitrogen-Doped NiO Nanosheets for Rechargeable Zinc–Air Batteries. ACS Appl. Mater. Interfaces 2019, 11, 30865–30871. [Google Scholar] [CrossRef] [PubMed]
  46. Guo, F.; Wang, L.; Sun, H.; Li, M.; Shi, W. High-Efficiency Photocatalytic Water Splitting by a N-Doped Porous g-C3N4 Nanosheet Polymer Photocatalyst Derived from Urea and N,N-Dimethylformamide. Inorg. Chem. Front. 2020, 7, 1770–1779. [Google Scholar] [CrossRef]
  47. Ângelo, J.; Magalhães, P.; Andrade, L.; Mendes, A. Characterization of TiO2-Based Semiconductors for Photocatalysis by Electrochemical Impedance Spectroscopy. Appl. Surf. Sci. 2016, 387, 183–189. [Google Scholar] [CrossRef]
  48. Yu, Z.; Yang, K.; Yu, C.; Lu, K.; Huang, W.; Xu, L.; Zou, L.; Wang, S.; Chen, Z.; Hu, J.; et al. Steering Unit Cell Dipole and Internal Electric Field by Highly Dispersed Er Atoms Embedded into NiO for Efficient CO2 Photoreduction. Adv. Funct. Mater. 2022, 32, 2111999. [Google Scholar] [CrossRef]
  49. Zhu, S.; Liao, W.; Zhang, M.; Liang, S. Design of Spatially Separated Au and CoO Dual Cocatalysts on Hollow TiO2 for Enhanced Photocatalytic Activity towards the Reduction of CO2 to CH4. Chem. Eng. J. 2019, 361, 461–469. [Google Scholar] [CrossRef]
  50. Jiang, L.; Wang, K.; Wu, X.; Zhang, G. Highly Enhanced Full Solar Spectrum-Driven Photocatalytic CO2 Reduction Performance in Cu 2–xS/g-C3N4 Composite: Efficient Charge Transfer and Mechanism Insight. Sol. RRL 2021, 5, 2000326. [Google Scholar] [CrossRef]
  51. Liu, L.; Jiang, Y.; Zhao, H.; Chen, J.; Cheng, J.; Yang, K.; Li, Y. Engineering Coexposed {001} and {101} Facets in Oxygen-Deficient TiO2 Nanocrystals for Enhanced CO2 Photoreduction under Visible Light. ACS Catal. 2016, 6, 1097–1108. [Google Scholar] [CrossRef]
  52. Katal, R.; Masudy-Panah, S.; Sabbaghan, M.; Hossaini, Z.; Davood Abadi Farahani, M.H. Photocatalytic Degradation of Triclosan by Oxygen Defected CuO Thin Film. Sep. Purif. Technol. 2020, 250, 117239. [Google Scholar] [CrossRef]
  53. Tian, F.; Liu, Y. Synthesis of p-Type NiO/n-Type ZnO Heterostructure and Its Enhanced Photocatalytic Activity. Scr. Mater. 2013, 69, 417–419. [Google Scholar] [CrossRef]
  54. Jones, B.M.F.; Maruthamani, D.; Muthuraj, V. Construction of Novel n-Type Semiconductor Anchor on 2D Honey Comb like FeNbO4/RGO for Visible Light Drive Photocatalytic Degradation of Norfloxacin. J. Photochem. Photobiol. A Chem. 2020, 400, 112712. [Google Scholar] [CrossRef]
  55. Mu, P.; Zhou, M.; Yang, K.; Zhou, C.; Mi, Y.; Yu, Z.; Lu, K.; Li, Z.; Ouyang, S.; Huang, W.; et al. Sulfur Vacancies Engineered over Cd0.5Zn0.5S by Yb3+/Er3+ Co-Doping for Enhancing Photocatalytic Hydrogen Evolution. Sustain. Energy Fuels 2021, 5, 5814–5824. [Google Scholar] [CrossRef]
Figure 1. (a) The XRD patterns of the prepared samples; (b) local amplification diagram.
Molecules 28 02435 g001
Figure 2. (a) SEM images of NiO and (b) N-NiO-2; TEM (c,d), HR-TEM (e,f), and element-mapping spectra of N-NiO-2 (gj).
Molecules 28 02435 g002
Figure 3. (a) Optical absorption properties of samples and (b) corresponding (αhν)2-hν curves.
Molecules 28 02435 g003
Figure 4. (a) X-ray photoelectron spectra of NiO and N-NiO-2: (a) Ni 2p, (b) O 1s, and (c) N 1s.
Molecules 28 02435 g004
Figure 5. (a) Product yields and CO selectivity of NiO and N-NiO-x at 365 nm; (b) product yields of T-NiO, NiO, and N-NiO-2 at 365 nm; (c) product yield and CO selectivity of N-NiO-2 at different wavelengths; (d) product yields of N-NiO-2 under different reaction conditions.
Molecules 28 02435 g005
Figure 6. (a) Photocurrent-response curves; (b) electrochemical-impedance spectra; (c) steady-state PL spectra (excitation wavelength: 250 nm).
Molecules 28 02435 g006
Figure 7. The EPR spectra of NiO and N-NiO-2.
Molecules 28 02435 g007
Figure 8. The M–S diagrams of T-NiO (a), NiO (b), and N-NiO-2 (c) semiconductors.
Molecules 28 02435 g008
Figure 9. CO2-adsorption isotherms of NiO and N-NiO-x.
Molecules 28 02435 g009
Figure 10. Possible photoreduction mechanism of CO2 on N-NiO-x (* represents the excited state).
Molecules 28 02435 g010
Table 1. The XPS fitted peak area and oxygen-defect ratios on NiO and N-NiO-2.
Oxygen SpeciesNi–OO–HOVOV Ratio
Samples
NiO64,58744,18256354.9%
N-NiO-267,58673,29316,35210.4%
Table 2. Optical power, CO yield, and AQE of the N-NiO-2 at different wavelengths under 2 h of illumination.
Wavelength (nm)Optical Power (mW)CO Yield (μmol·g−1·h−1)AQE (%)
365456.4235.52.4
420358.748.20.5
55059.21.30.06
Disclaimer/Publisher’s Note: The statements, opinions and data contained in all publications are solely those of the individual author(s) and contributor(s) and not of MDPI and/or the editor(s). MDPI and/or the editor(s) disclaim responsibility for any injury to people or property resulting from any ideas, methods, instructions or products referred to in the content.

