Article

Cerium Synchronous Doping in Anatase for Enhanced Photocatalytic Hydrogen Production from Ethanol-Water Mixtures

1
College of Chemistry, Fuzhou University, Fuzhou 350116, China
2
CAS Key Laboratory of Design and Assembly of Functional Nanostructures, Fujian Provincial Key Laboratory of Nanomaterials, Fujian Institute of Research on the Structure of Matter, Chinese Academy of Sciences, Fuzhou 350002, China
3
Xiamen Key Laboratory of Rare Earth Photoelectric Functional Materials, Xiamen Institute of Rare-Earth Materials, Haixi Institutes, Chinese Academy of Sciences, Xiamen 361021, China
4
Fujian Science & Technology Innovation Laboratory for Optoelectronic Information of China, Fuzhou 350108, China
5
State Key Laboratory of Physical Chemistry of Solid Surfaces, College of Chemistry and Chemical Engineering, Xiamen University, Xiamen 361005, China
*
Authors to whom correspondence should be addressed.
Molecules 2023, 28(6), 2433; https://doi.org/10.3390/molecules28062433
Submission received: 14 February 2023 / Revised: 2 March 2023 / Accepted: 3 March 2023 / Published: 7 March 2023
(This article belongs to the Special Issue Multifunctional Metal Oxides: Synthesis and Applications)

Abstract

:
Cerium element with a unique electric structure can be used to modify semiconductor photocatalysts to enhance their photocatalytic performances. In this work, Ce-doped TiO2 (Ce/TiO2) was successfully achieved using the sol-gel method. The structural characterization methods confirm that Ce was doped in the lattice of anatase TiO2, which led to a smaller grain size. The performance test results show that the Ce doped in anatase TiO2 significantly enhances the charge transport efficiency and broadens the light absorption range, resulting in higher photocatalytic performance. The Ce/TiO2 exhibited a photocurrent density of 10.9 μA/cm2 at 1.0 V vs. Ag/AgCl, 2.5 times higher than that of pure TiO2 (4.3 μA/cm2) under AM 1.5 G light. The hydrogen (H2) production rate of the Ce/TiO2 was approximately 0.33 μmol/h/g, which is more than twice as much as that of the pure anatase TiO2 (0.12 μmol/h/g). This work demonstrates the effect of Ce doping in the lattice of TiO2 for enhanced photocatalytic hydrogen production.

1. Introduction

H2 energy, with its high calorific value and environmental friendliness, has been regarded as an alternative to unsustainable fossil fuels with the most potential [1,2,3]. Solar to H2 conversion is a promising technique for solving the energy crisis and environmental problems caused by continuously consuming nonrenewable fossil fuels [4,5]. Since Fujishima and Honda first discovered the photoelectrochemical splitting of water into H2 and O2 using TiO2 photoanode [6,7,8,9], TiO2 has been widely applied in photocatalysis due to the fact of its low cost, stability, and nontoxicity [10,11,12]. However, TiO2 only reacts to ultraviolet light due to the fact of its wide band gap of 3.2 eV, resulting in low quantum efficiency. In addition, the high-rate recombination of photogenerated electron/hole pairs causes the practical application of TiO2 for photocatalytic H2 production to be strictly confined. To address these drawbacks and boost the solar energy utilization efficiency of TiO2, considerable efforts have been devoted. Many strategies, for instance, metal doping, such as Ta and Fe doping [13,14]; nonmetal doping, such as N and C doping [15,16]; surface dye sensitization [17]; and noble Ag and Au doping [10,18], is often employed to modulate the electronic structure and photocatalytic activity of TiO2. In particular, introducing rare earth elements into TiO2 can effectively improve the electron–hole separation and extend the visible light response of TiO2 [19,20]. Among rare earth elements, cerium (Ce) shows the variable valence states Ce3+/Ce4+ with different electronic structures (4f15d0 and 4f05d0, respectively), which result in the facile formation of oxygen vacancies. Thus, the shuttling of electrons between two valence states largely facilitates the charge separation and the following photocatalytic reactions [21,22]. However, most research on Ce-doped titanium dioxide focuses on photocatalytic degradation, with few studies on photocatalytic water splitting.
In this work, a simple sol-gel method achieved Ce synchronous doping in the lattice of TiO2. The morphology and structure of the pure TiO2, Ce-doped TiO2 (Ce/TiO2), and CeO2-mixed TiO2 (CeO2-TiO2) samples were observed by X-ray diffraction (XRD), scanning electron microscopy (SEM), and transmission electron microscopy (TEM). The PEC performances of TiO2, Ce/TiO2, and CeO2-TiO2 were comprehensively investigated. The electron capture center formed by Ce doping into the TiO2 lattice dramatically improves the separation efficiency of photogenerated electrons and holes. In addition, the narrowed band gap of the Ce-doped TiO2 shows excellent visible light absorption and photocurrent response. The Ce/TiO2 samples realized high photocurrent density and incident photon-to-current efficiency (IPCE) values thanks to the Ce doping. The Ce doping also hugely improved the photocatalytic H2 production of the TiO2 electrode. This work offers a practical strategy and significant reference for preparing and understanding efficient visible-light-activated rare-earth-doped photocatalysts.

2. Results

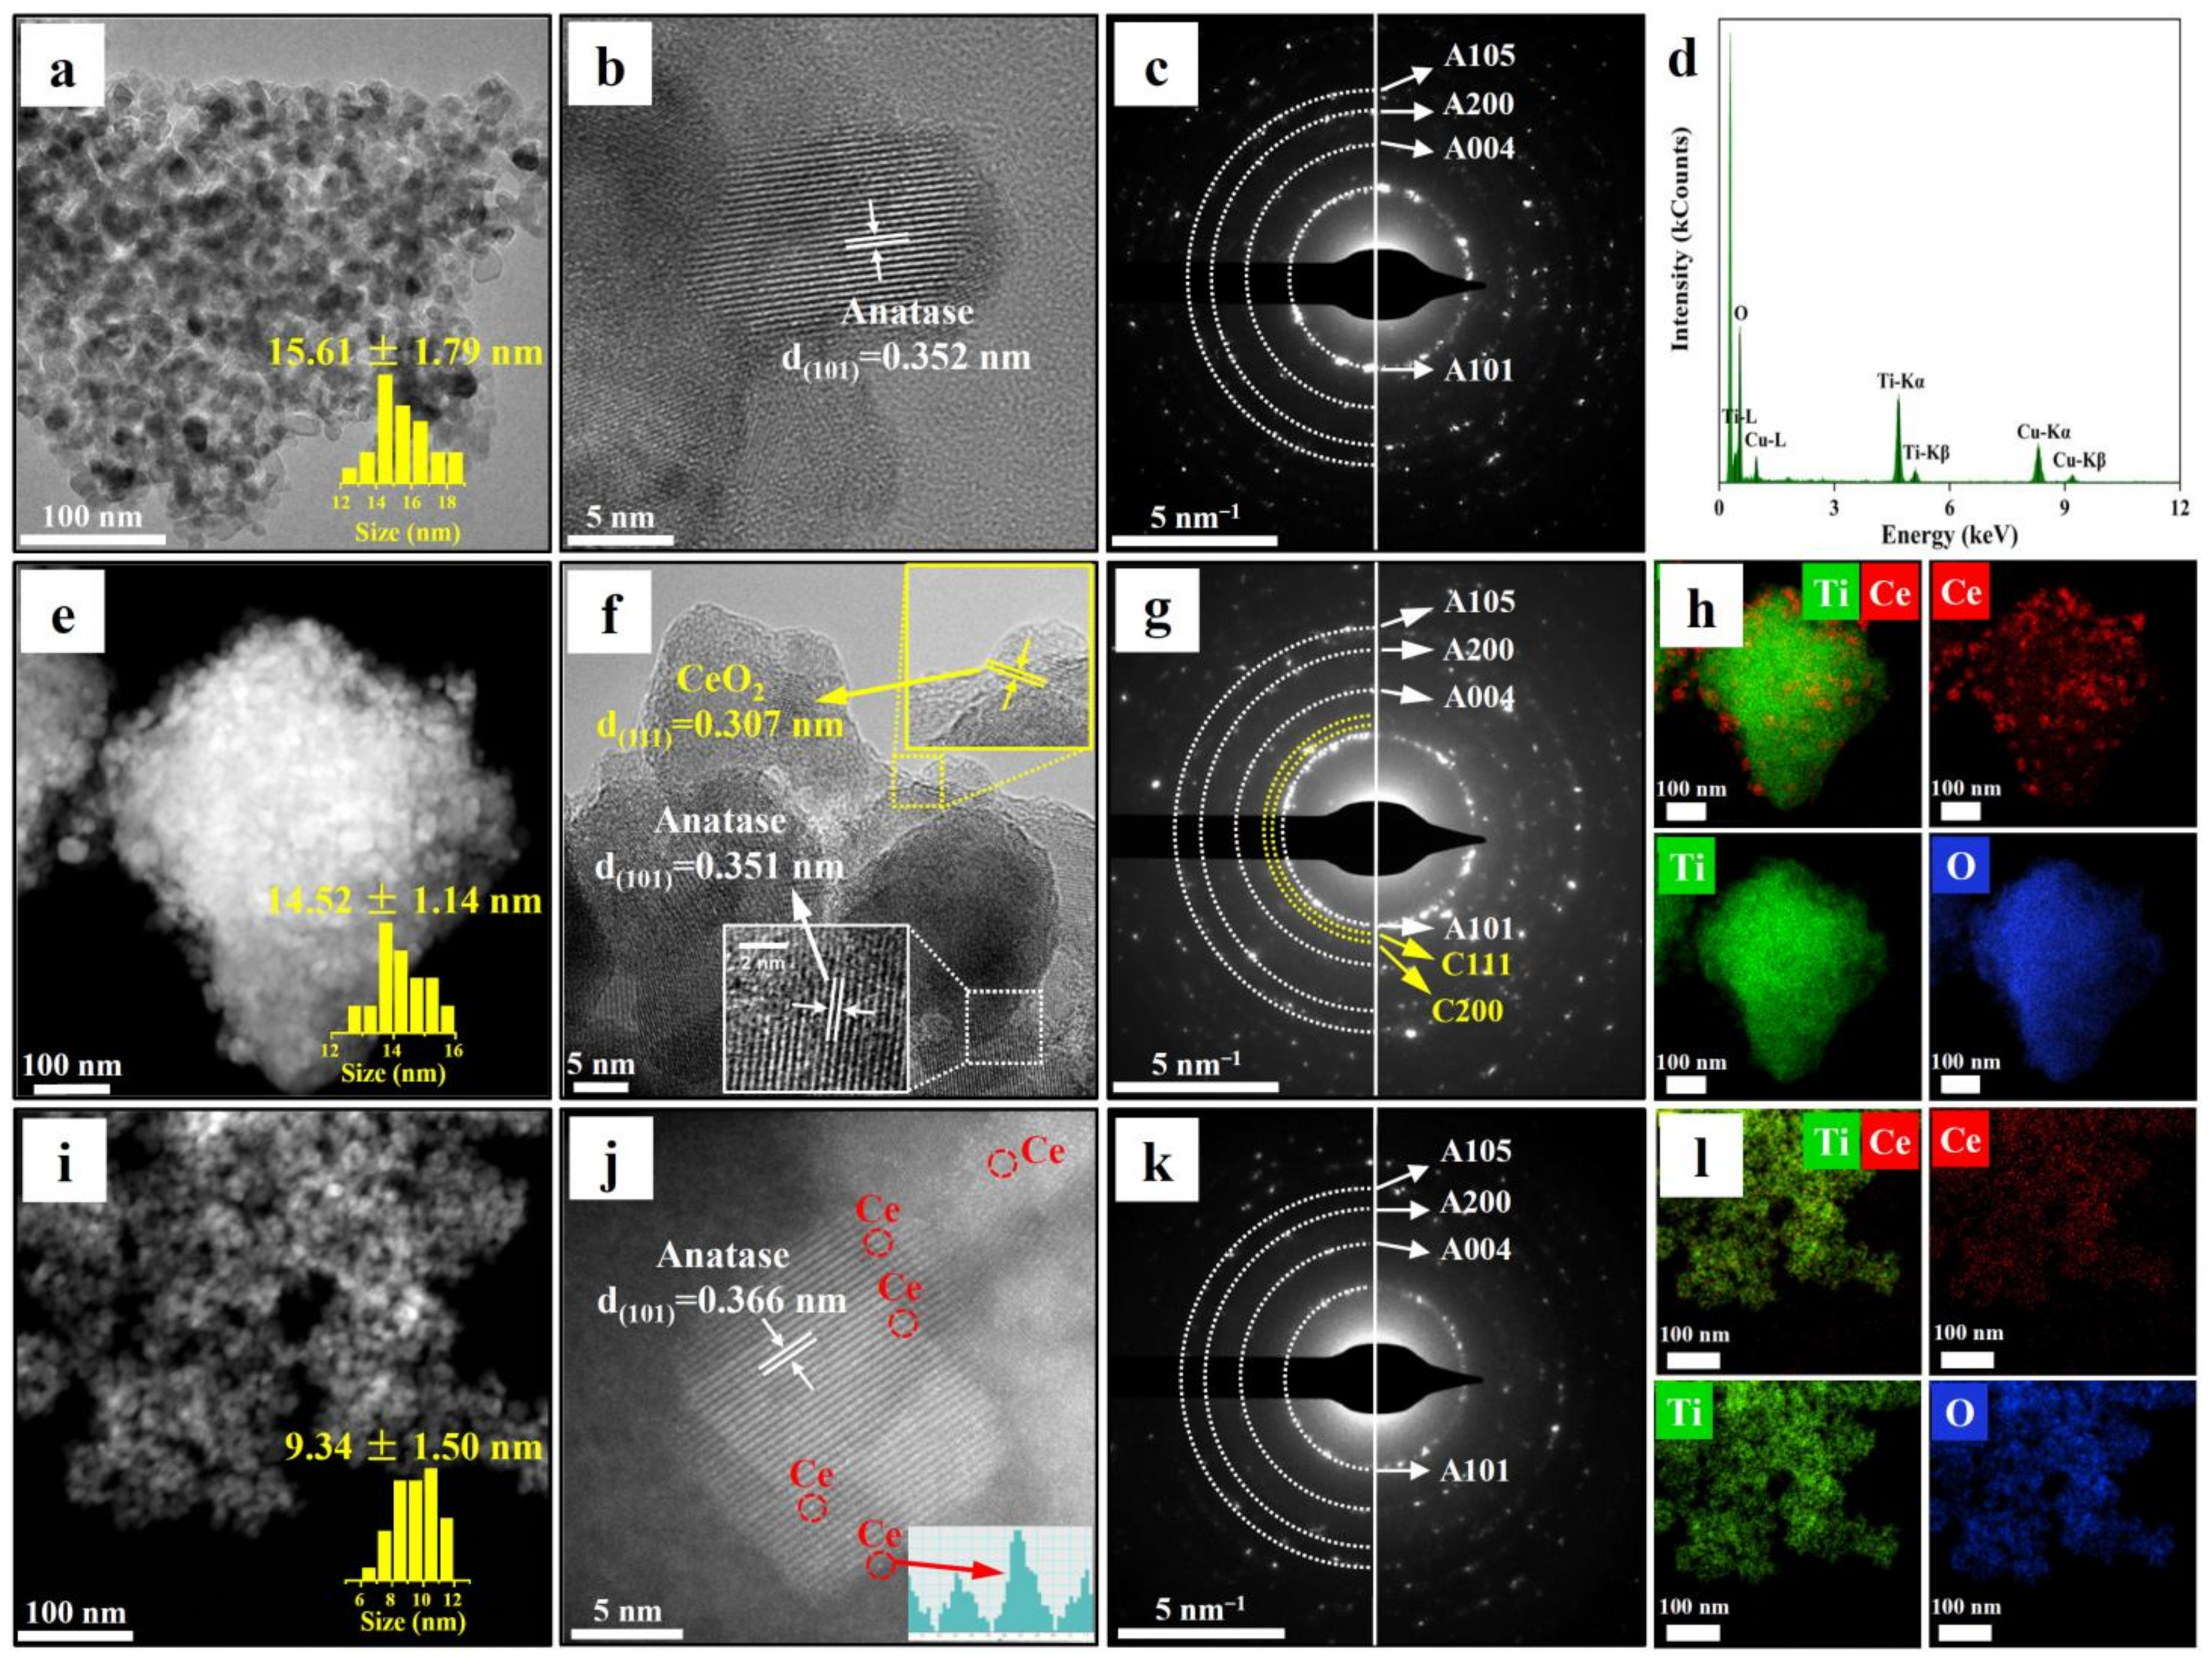
2.1. Structure and Morphology

The surface morphology of the pure TiO2, Ce-doped TiO2 (Ce/TiO2, 0.5% Ce), and CeO2-mixed TiO2 (CeO2-TiO2) samples were observed by SEM, and their crystal structures were identified by XRD measurement, as shown in Figure 1. The elemental mapping results of the as-prepared Ce/TiO2 sample demonstrated a uniform distribution of Ce in TiO2, as shown in Figure 1d. As shown in the SEM and EDS mapping images, Ce/TiO2 consists of TiO2 nanoparticles with a homogeneous distribution of Ce elements. The relative amount of the Ce element in Ce/TiO2 is close to that in CeO2-TiO2, as shown in Table S1.
The crystal structures of these obtained samples were identified by XRD, as shown in Figure 1e,f. The pure TiO2, CeO2-TiO2, and Ce/TiO2 powders comprised the anatase phase dominantly. The samples of pure TiO2 and CeO2-TiO2 still had a rutile phase with a peak at 27.4° corresponding to the (110) plane of the rutile TiO2. However, the growth of the rutile phase in the pure TiO2 was inhibited after doping with Ce. In addition, the peak intensity of the anatase TiO2 in the Ce-doped TiO2 samples decreased when the Ce content increased. Excessive Ce ions stay at the particle surface or the grain boundaries, suppressing the anatase crystal growth [23,24]. From the high-resolution plots of the prominent peak (101) at 25.48°, as shown in Figure 1b, the crystal sizes of the pure TiO2, 0.5%Ce/TiO2, 3%Ce/TiO2, and 5%Ce/TiO2 were calculated to be 13.92, 12.03, 12.09, and 12.14 nm, respectively, according to the Scherrer formula [22]. The peaks of the anatase (101) crystal plane in the Ce-doped TiO2 samples shifted towards a lower diffraction angle compared to those of the pure TiO2 and CeO2-TiO2. The interplanar spacing of the (101) crystal plane increased due to the Ce doping [24]. No prominent characteristic peaks of CeO2 were observed in the Ce-doped TiO2 samples due to the low doping contents.
As shown in Figure 2, the internal microstructures of the pure TiO2, Ce/TiO2 (0.5%Ce/TiO2), and CeO2-TiO2 were explored by TEM, HRTEM, SAED, and EDS mapping, respectively. As shown in the TEM images, the Ce/TiO2 consisted of TiO2 nanoparticles with a homogeneous distribution of Ce elements. The pure TiO2 mainly consisted of anatase nanoparticles, as shown in Figure 2a–d. The HRTEM image (Figure 2b) shows a lattice spacing of 0.350 nm, corresponding to the (101) plane of anatase. The composite of the CeO2-TiO2 nanoparticles, with an average size of 14.52 nm, aggregated together, as observed by TEM (Figure 2e,f). The HRTEM image (Figure 2f) of CeO2-TiO2 indicates the lattice lines of the anatase (101) plane and the crystal plane (111) of CeO2, highlighted by yellow boxes and enlarged in yellow boxes. Figure 2g shows both the anatase plane and the CeO2 plane. From the EDS mapping image, as shown in Figure 2h, it is clear that the Ce elements are distributed unevenly in the composite structure of CeO2-TiO2. However, in the sample of the Ce-doped TiO2 (0.5%Ce/TiO2), the nanoparticle size was smaller than that of the composite CeO2-TiO2, which is consistent with the results of the XRD and SEM. The HRTEM Image (Figure 2j) of Ce/TiO2 shows that the lattice spacing of the anatase (101) plane increased to 0.366 nm. In addition, several bright spots distributed in the anatase lattice are highlighted by the red circles, indicating Ce atoms doping into the lattice of the TiO2. The SAED patterns in Figure 2k also confirm the single crystallinity of the anatase TiO2 in the Ce-doped TiO2. The elemental mapping results shown in Figure 2l further verify the uniform distribution of Ce element in the lattice structure of TiO2 in Ce/TiO2. Therefore, the sol-gel method successfully doped the Ce in the lattice of TiO2.

2.2. Chemical Composition and Surface Information

For obtaining the chemical composition and valence state of the Ce-doped TiO2, X-ray photoelectron spectroscopy (XPS) measurements were conducted, as shown in Figure 3. The pure TiO2, Ce/TiO2, and CeO2-TiO2 were all composed of O, Ti, and C, as shown in the survey spectra (Figure 3a). The Ti 2p peaks at 458.28 eV and 463.98 eV are attributed to Ti 2p3/2 and Ti 2p1/2, respectively, indicating the Ti4+ state in the Ce/TiO2, as shown in Figure 3b. A slight shift in the Ti 2p in the Ce-doped TiO2 towards a lower value compared to that of pure TiO2 could be due to the interaction between Ti4+ and Ce3+ or Ce4+ species [25]. In Figure 3c, the O 1s peak at 529.73 eV corresponds to the lattice oxygen of TiO2, while the peak at 531.48 eV corresponds to the surface-adsorbed oxygen species [26]. The O 1s spectrum of the Ce/TiO2 had a smaller peak area at 532.78 eV compared to that of pure TiO2, which indicates a reduction in oxygen vacancies. In addition, the O 1s peak slightly shifted towards the lower binding energy region due to the Ce doping. The Ce 3d spectra (Figure 3d) show eight fitting peaks, where a and b correspond to the two spin orbitals (Ce 3d5/2 and Ce 3d3/2) in the Ce/TiO2, respectively [27]. The peaks a2 and b2 are attributed to Ce3+, while the others correspond to Ce4+. The relative content of Ce ions can be calculated from the ratio of the fitting peak area. The relative content of Ce3+ in the Ce/TiO2 (30.4%) was higher than that of the CeO2-TiO2 (24.6%), indicating that more Ce3+ ions were retained in the synchronous doping process. The higher content of Ce3+ in Ce/TiO2 plays a key role in the formation of oxygen defects and improves the redox conversion between Ce3+ and Ce4+ [28].
The UV-Vis absorbance spectra in Figure 4a show the redshift of the absorption edge to the visible region in TiO2 after Ce doping, which may be due to the Ce 4f intermediate energy level inside the band gap of TiO2 [25]. The Tauc plot extracted from the UV-Vis absorbance spectra exhibits the band gap of the samples, as shown in Figure 4b. The band gaps of the pure TiO2, CeO2-TiO2, and Ce/TiO2 were 2.96 eV, 2.91 eV, and 2.15 eV, respectively.
For further study of the separation of the photogenerated electron/hole pairs, fluorescence (FL) spectroscopy was conducted, as shown in Figure S1. The luminous signal was generated in the region of 375–450 nm, with the longest signal at 420 nm, indicating the generation of * OH radicals in the reaction process. Generally, a higher intensity of FL suggests a higher recombination of the photogenerated carriers [29]. Pure TiO2 had a stronger spectral signal than that of the Ce-doped TiO2, indicating the high recombination rate of the photogenerated carriers in the pure TiO2. The Ce doping effectively improved the charge separation in the TiO2. However, the FL intensities of 3% Ce/TiO2 and 5% Ce/TiO2 increased compared to that of the 0.5% Ce/TiO2. The excessive Ce doping could form a new electron–hole recombination center, resulting in a lowered efficiency of charge separation. Therefore, 0.5% of Ce doping in TiO2 could provide better efficiency for charge separation and photocatalytic reactions compared to pure TiO2 and other Ce-doped TiO2 samples with high Ce doping contents.

3. Discussion

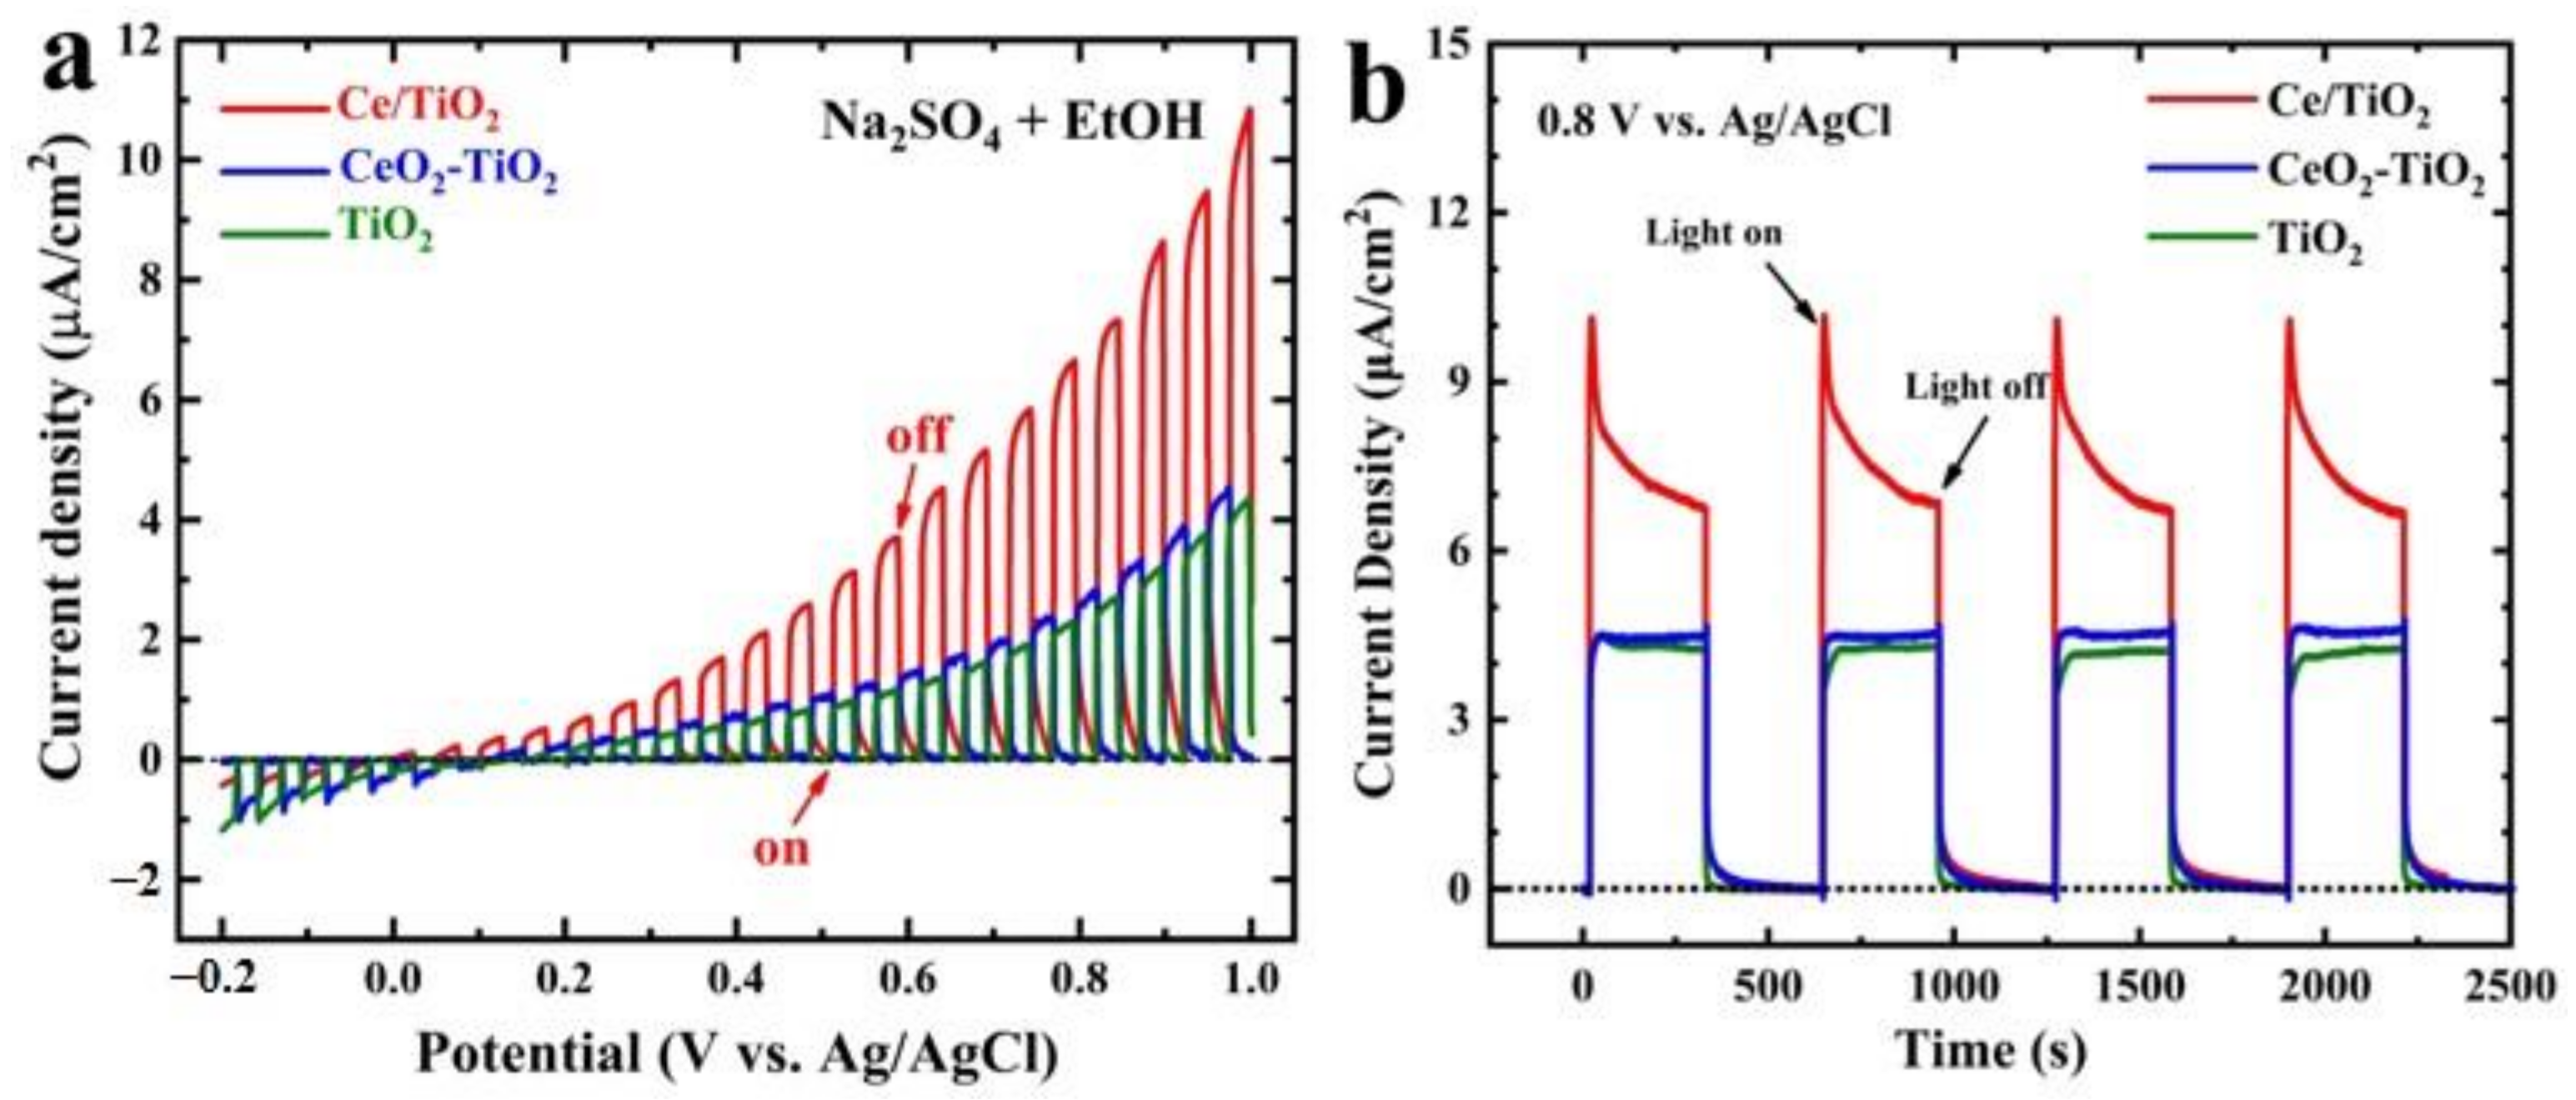
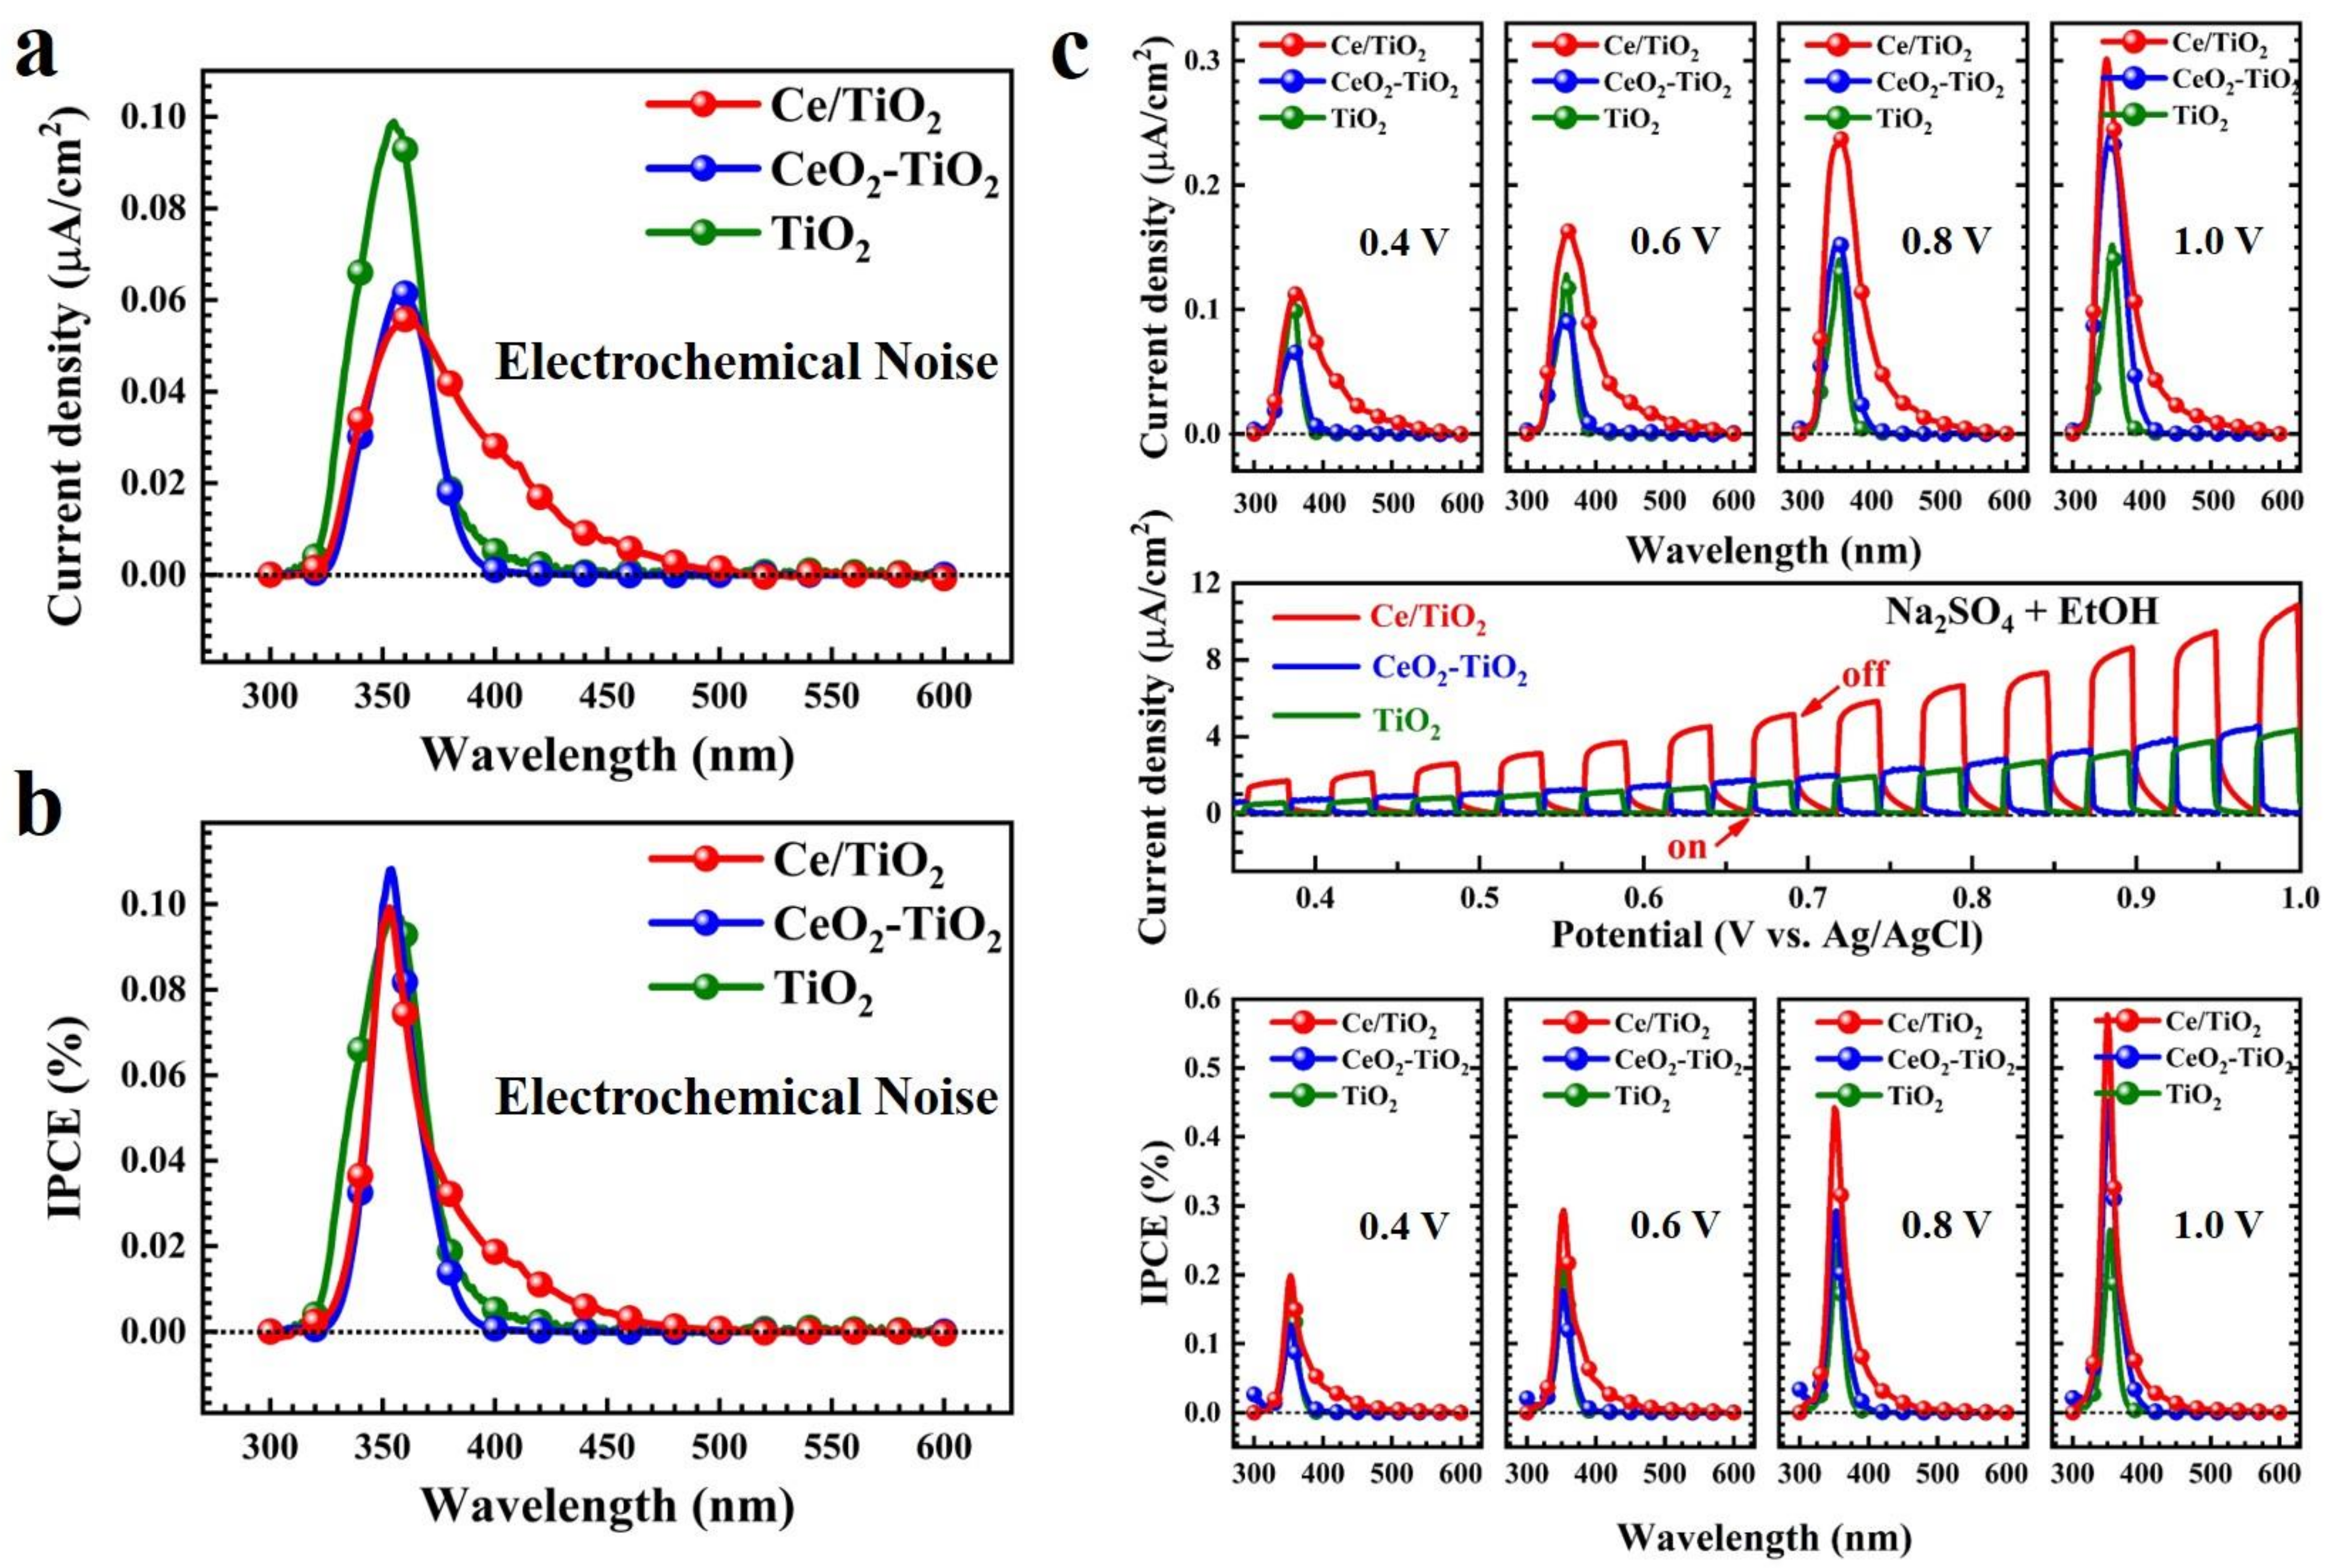
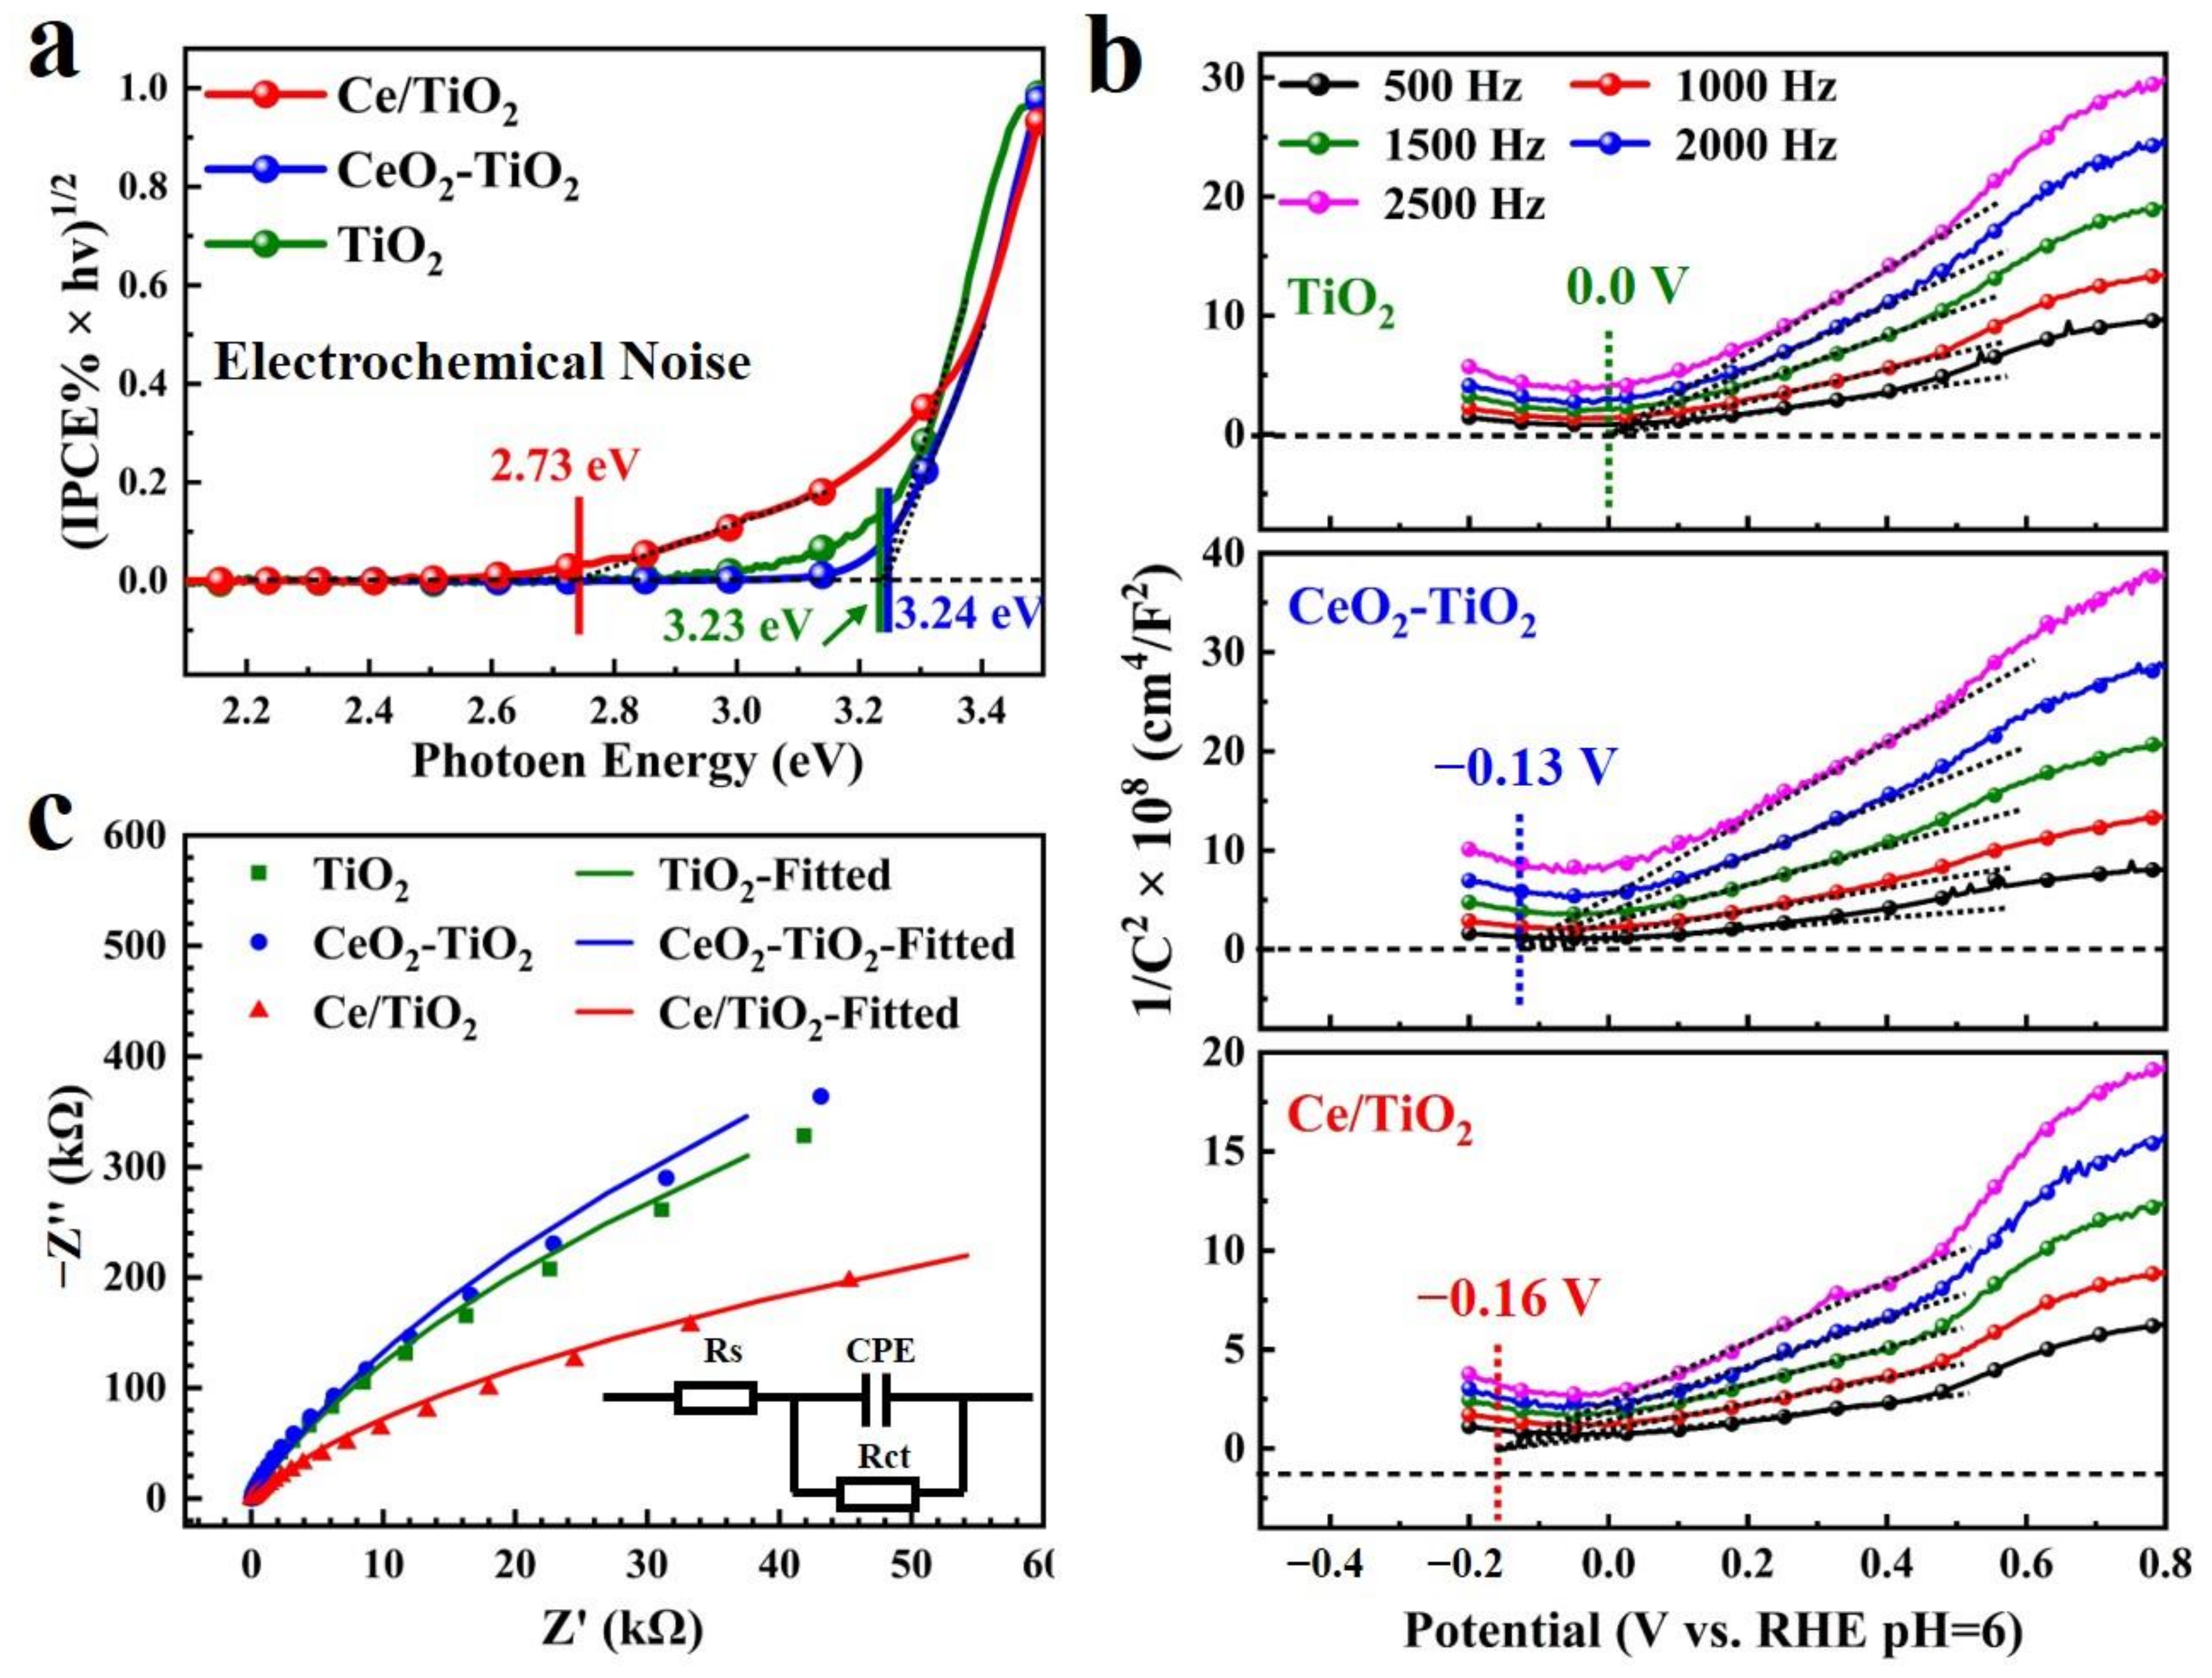
3.1. Photoelectrochemical Performance

The PEC performance of these as-prepared samples was further investigated. Under chopping irradiation, a linear sweep voltammetry (LSV) measurement was carried out under AM 1.5 G light, as presented in Figure 5a. Ce/TiO2 shows a photocurrent density of 10.9 μA/cm2 at 1.0 V vs. Ag/AgCl, which is 2.5 and 2.4 times higher than that of pure TiO2 (4.3 μA/cm2) and CeO2-TiO2 (4.5 μA/cm2), respectively. The highly increased photocurrent of Ce/TiO2 mainly originates from the efficient charge separation. Ce doping in TiO2 enhances the efficiency of photogeneration and separation of electron-hole pairs, resulting in a high photocurrent response of Ce/TiO2. Figure S2 presents the chopped LSV curves of the as-prepared TiO2 samples, which were modified with different Ce loadings or were annealed at different temperatures.
Chronoamperometry measurement was used to investigate the chemical stability of the samples at 0.8 V vs. Ag/AgCl, as presented in Figure 5b. The CeO2-TiO2 showed a higher photocurrent density than the pure TiO2, which resulted from the heterojunction between TiO2 and CeO2. The maximum photocurrent densities of the pure TiO2, CeO2-TiO2, and Ce/TiO2 were 3.2, 4.5, and 8.0 μA/cm2 at 0.8 V vs. Ag/AgCl, respectively. These results indicate that Ce doping into the crystal lattice of TiO2 is beneficial to the separation of photogenerated electrons and holes. Ce ions in TiO2 form an intermediate energy level, which results in the formation of oxygen vacancies. Under light radiation, the absorbed oxygen on the surface of the photocatalyst generates hydroxyl radicals and superoxide radicals, improving the photocatalyst’s activity. The Ce/TiO2 sample exhibited steady photocurrent densities during the long cycling, implying that its photostability significantly improved.
The onset potential of the photocurrents indicates the photocatalytic activity and the flat band potential of the photoanodes. A high onset potential implies a low utilization efficiency of solar energy [30]. As shown in Figure 6, the onset potential of the Ce/TiO2 (0.0 V) was more negative compared to that of the pure TiO2 (0.159 V) and CeO2-TiO2 (0.103 V). The low onset potential of the Ce/TiO2 indicates an efficient carrier transfer process in the Ce-doped TiO2 [31].
The photocurrent densities versus the monochromatic light of the samples were measured in electrochemical noise (ECN) mode, which is a nondestructive and in situ monitoring technique to investigate the spontaneous electrochemical reactions of photoanodes [16,32], as shown in Figure 7a. The photocurrent density of the Ce/TiO2 was slightly lower than that of the pure TiO2 under the UV light region. It is worth noting that the Ce/TiO2 showed visible light absorption up to 500 nm, while the pure TiO2 and CeO2-TiO2 exhibited no obvious response under the visible light region. The successful Ce doping highly improves the visible light utilization efficiency of TiO2. The incident photon-to-current efficiencies (IPCEs) spectra were obtained from the photocurrent–wavelength curves, as shown in Figure 7b. The Ce/TiO2 had the highest IPCE value of 0.10% in the region of 350 nm and an obvious visible light response. The Ce/TiO2 still exhibited an IPCE value of 0.02% at 400 nm. The photocurrents and IPCE versus monochromatic light of Ce/TiO2 under applied voltages are shown in Figure 7c. The photocurrent response of the Ce/TiO2 increased with bias, which is consistent with the results of the LSV curves.
The band gap energy Eg of these samples can be calculated from the IPCE spectra by a Tauc plot of (IPCE % × hv)1/2 versus photon energy (hv) [16,33,34,35], as illustrated in Figure 8a. The band gaps of the pure TiO2, CeO2-TiO2, and Ce/TiO2 were 3.23, 3.24, and 2.73 eV, respectively. The band gap of the pure TiO2 is consistent with the reported data. The Ce/TiO2 had a lower Eg than pure TiO2 owing to the formation of oxygen defect levels above the valence band of TiO2. Thus, Ce doping in TiO2 narrows the band gap and enhances the visible light absorption of TiO2.
The charge transport in the pure TiO2, CeO2-TiO2, and Ce/TiO2 was also studied by electrochemical impedance spectroscopy (EIS), as shown in Figure 8c. The Ce/TiO2 sample shows a smaller arc in the Nyquist plot, indicating a lower charge transfer resistance at the electrode interface [36]. Ce doping introduces a new electronic state within the band gap of TiO2 near the conduction band, facilitating the charge separation and reducing the recombination rate of photogenerated electron/hole pairs.
Furthermore, the Mott-Schottky (M-S) measurement was used to determine the flat band potential (Vfb) of these samples, as illustrated in Figure 8b. The curve slopes of the three samples are all positive, indicating their n-type semiconductor properties. The flat band potential can be regarded as the conduction band (CB) potential of n-type semiconductors, which is calculated by intercepting the slopes with the potential axis according to the M-S equation [25,34]. The values of Vfb of pure TiO2, CeO2-TiO2, and Ce/TiO2 are about 0.0, −0.13, and −0.16 V vs. RHE, respectively. The negative shift in the flat band potential of the Ce/TiO2 compared to the pure TiO2 implies a decrease in the transfer energy barrier of the interfacial electrons and the charge transfer resistance after Ce doping in TiO2 [35]. In addition, the slope of the M-S plot of the Ce/TiO2 is significantly smaller than that of the pure TiO2, indicating an increase in the charge carrier density according to the M-S equation.

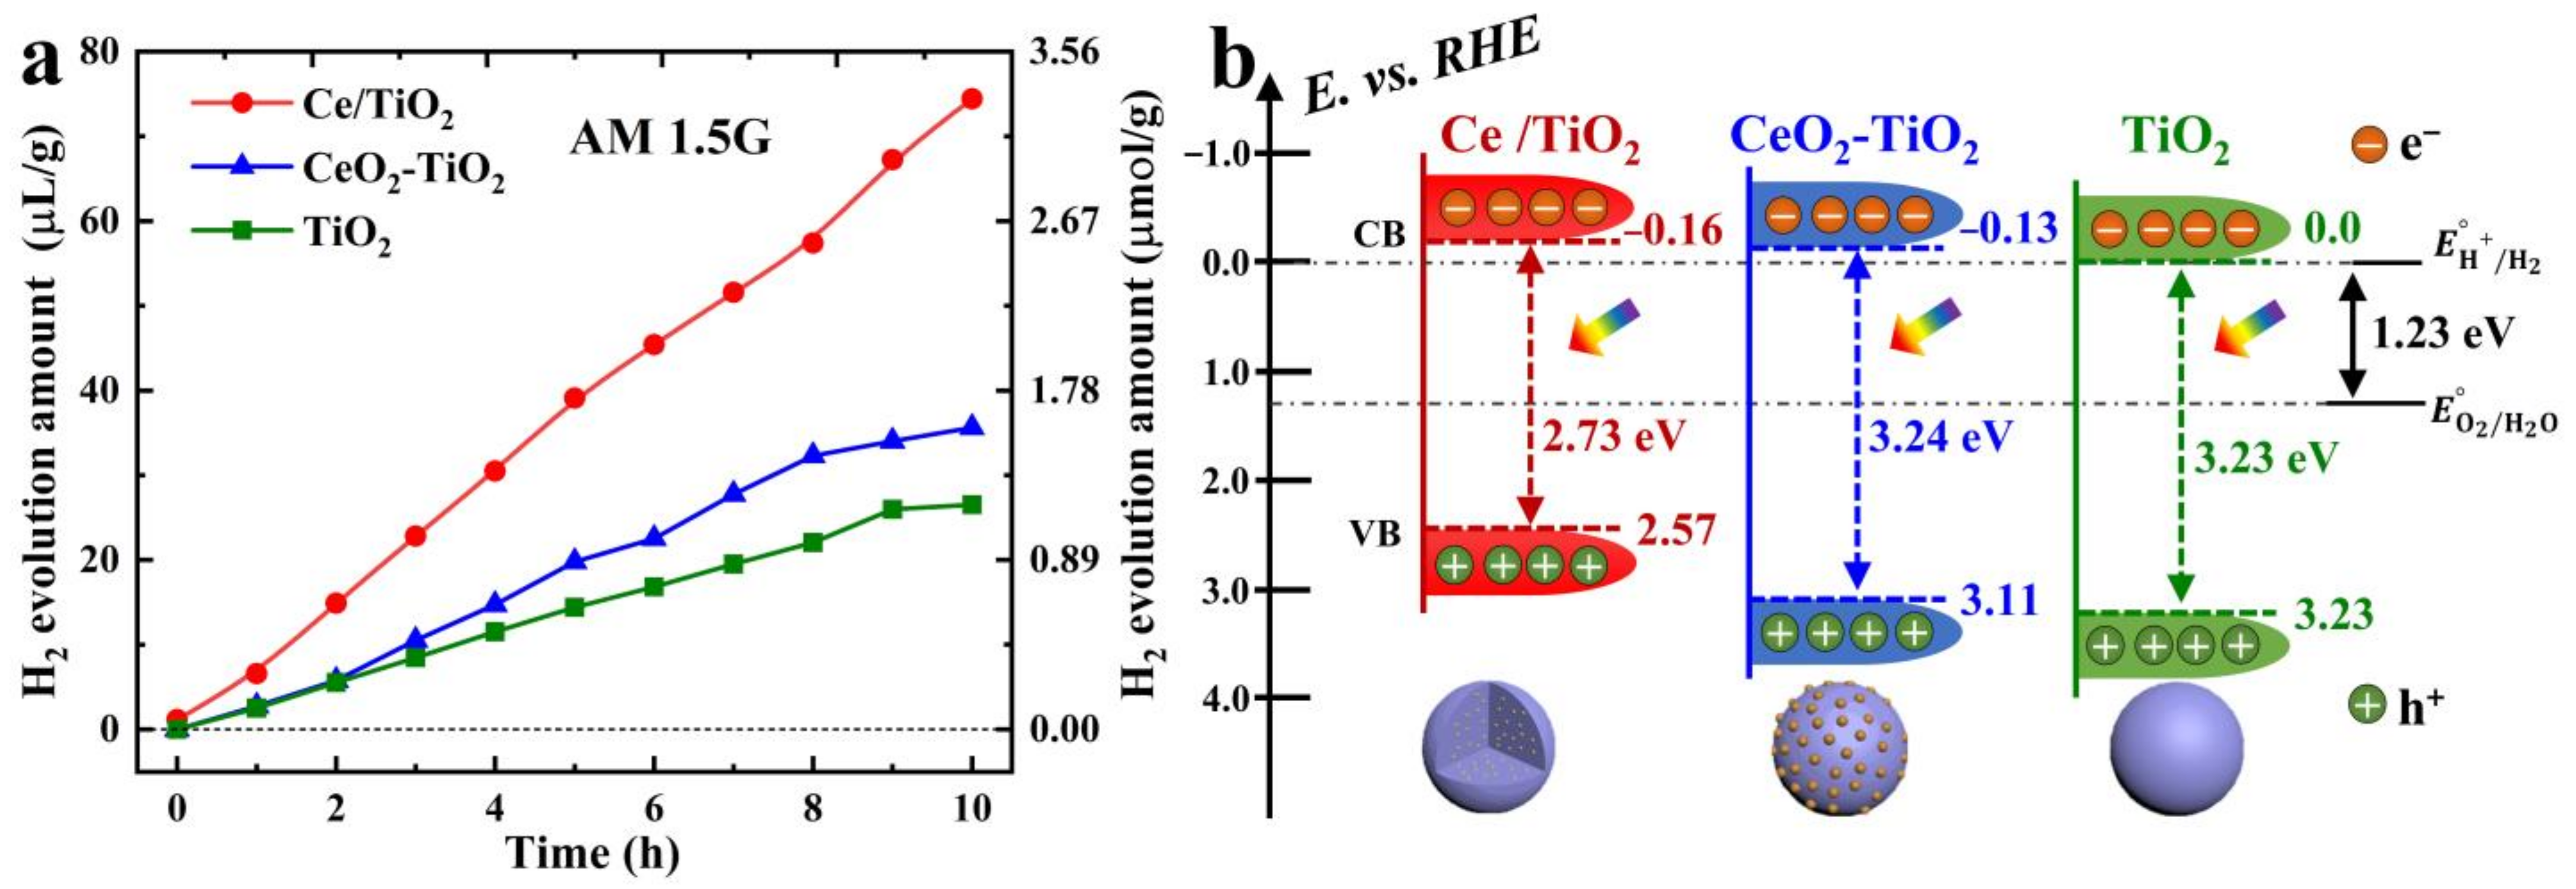
3.2. PC H2 Evolution Performance and Mechanism for Water Splitting under Solar Light

The photocatalytic H2 evolution of the pure TiO2, CeO2-TiO2, and Ce/TiO2 was evaluated under simulated solar light, as shown in Figure 9a. The H2 evolution rate of Ce/TiO2 was approximately 0.33 μmol/h/g, which is more than twice that of the pure TiO2 (0.12 μmol/h/g) and CeO2-TiO2 (0.16 μmol/h/g). Moreover, Ce/TiO2 also showed superior photostability for the photocatalytic H2 evolution over 10 h. The good performance in the water splitting of the Ce/TiO2 resulted from the narrow band gap and the effective separation of the photogenerated carriers. Ce doping in the lattice of TiO2 highly improves the photocatalytic performance of TiO2. The unique energy level structure of the Ce element provides doping levels in TiO2, facilitating electron transfer and charge separation.
Based on the above results, the mechanism of Ce doping in TiO2 for an improved photocatalytic performance was proposed. The energy band diagram of the pure TiO2, CeO2-TiO2, and Ce/TiO2 is illustrated in Figure 9b. Ce doping in the lattice of TiO2 narrows the band gap of TiO2, resulting in a visible-light response. The negatively shifted conduction band in Ce/TiO2 improves the carrier transfer process and reduces the recombination of photogenerated electron/hole pairs. Therefore, Ce/TiO2 exhibits a high photocatalytic performance for H2 evolution from water splitting.

4. Materials and Methods

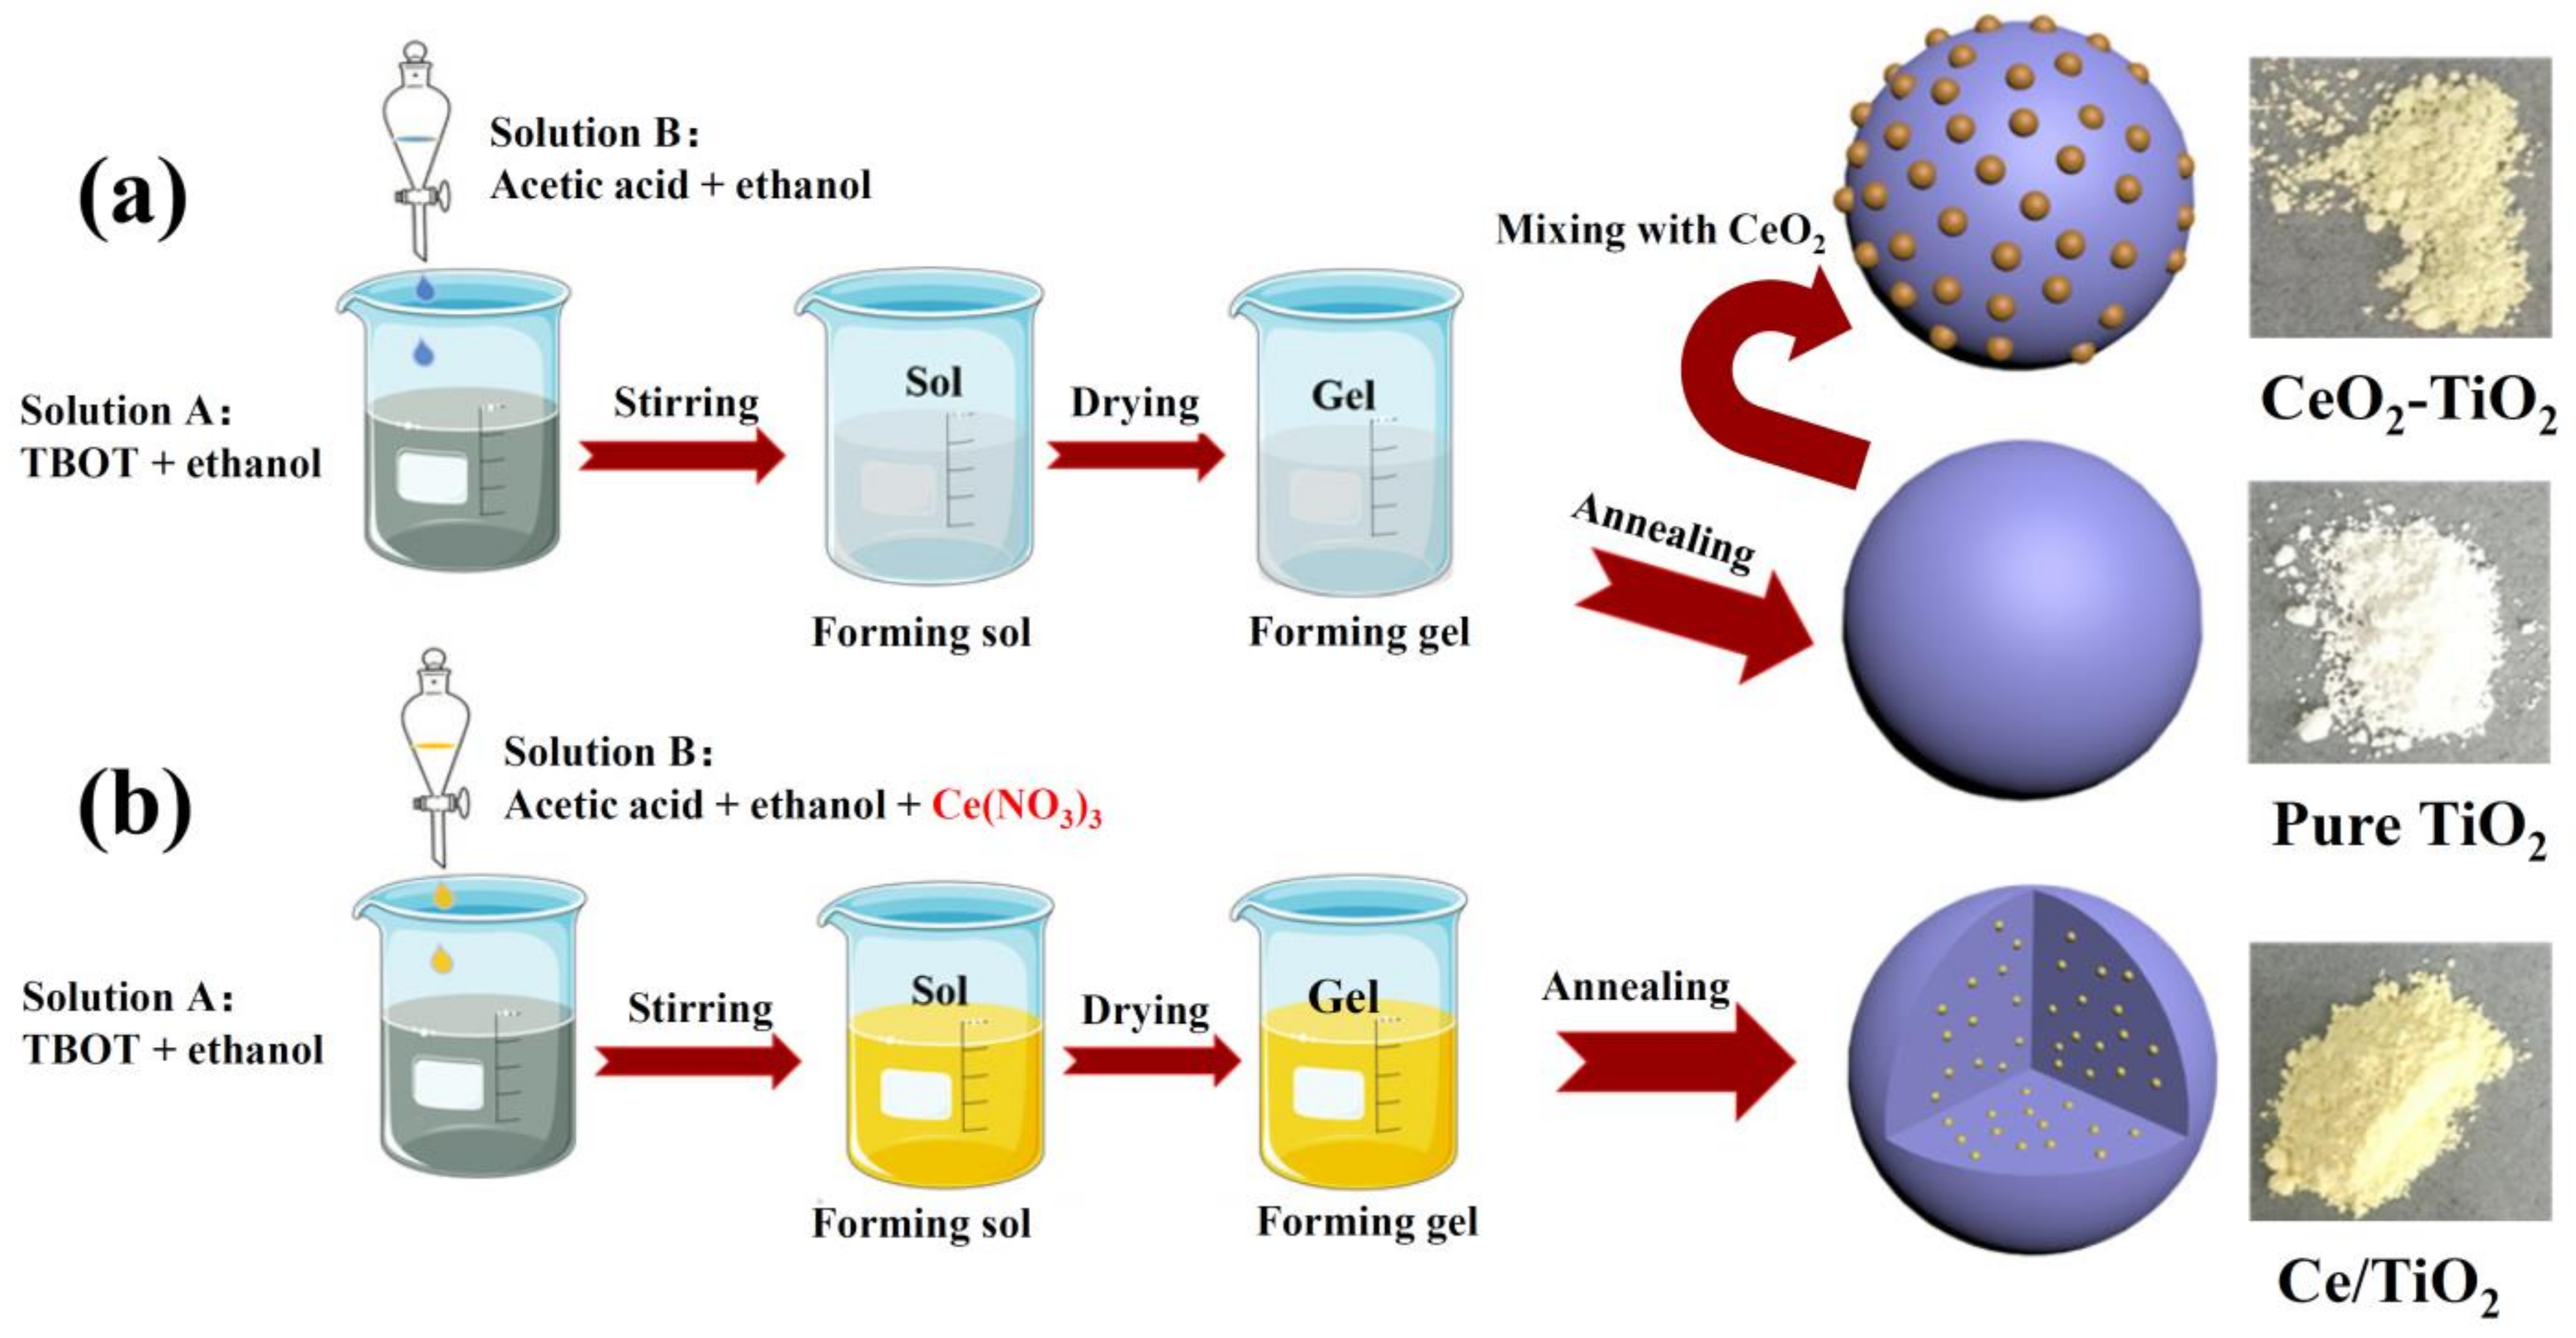
4.1. Materials and Synthesis Methods

In the experiment, tetrabutyl titanate (TBOT), ethanol absolute, acetic acid, cerium nitrate hexahydrate (Ce(NO3)3·6H2O), and cerium oxide (CeO2) were all of analytical grade and purchased from commercial sources. Deionized water was used in all experiments.
The process of sample preparation was conducted using the sol-gel method. Firstly, the mixed solution of tetrabutyl titanate (8.5 mL) and ethanol absolute (20 mL) was prepared under magnetic stirring and recorded as solution A. Solution B, which contained 8.5 mL of deionized water, 7.5 mL of acetic acid, 20 mL of ethanol absolute, and a specific amount of Ce(NO3)3·6H2O, was prepared. Then, solution B was slowly dropped into the vigorously stirred solution A at a rate of one drop every 2 s, resulting in the formation of TiO2 sol, which was further heated at 70 °C for 4 h and dried at 70 °C for 10 h. Finally, the above gel was annealed at 500 °C for 5 h in the air. The obtained powders were marked as X% Ce/TiO2, where “X” represents the theoretical molar percentage of Ce in the product (0.5, 3.0, and 5.0%).
For convenience, the Ce/TiO2 label mentioned below stands for the sample of 0.5% Ce/TiO2 with the best performance by default. TiO2 without Ce was prepared under the same conditions. For comparison, the TiO2 powders obtained by the sol-gel method were mixed with commercial CeO2 powders in a certain proportion (0.5% Ce), and the resulting powders were designated as CeO2-TiO2. The sample synthesis diagram is illustrated in Scheme 1.

4.2. Electrochemistry (EC) and Photoelectrochemical (PEC) Testing

All EC and PEC performances of the Ce/TiO2, CeO2-TiO2, and pure TiO2 were carried out in a standard three-electrode configuration with a side quartz window in which a mixture solution of 0.1 M Na2SO4 and ethanol (1:1 in volume, pH = 6.5) was the supporting electrolyte, and it was deaerated by bubbling high-purity Ar for 15 min before the EC/PEC measurements. A platinum plate and an Ag/AgCl electrode (saturated KCl) served as the counter electrode and reference electrode, respectively.
The working electrodes were fabricated on fluorine-doped conductive (FTO) glass plates (30 × 35 × 2.2 mm) for the PEC measurements. After being sonicated in soap suds and acetone, the FTO glass plates were rinsed with deionized water and then dried in an N2 atmosphere. A mixed solution, including 5 mg of the as-prepared photocatalyst powders, 1 mL of absolute ethanol, and 20 μL of 5 wt.% naphthol solution, was sonicated for 90 min and used for spinning casting onto the conductive surface of the FTO glass plates with a speed of 3000 r/min. The exposed area of the FTO glass was controlled to 1.0 cm2 (10 × 10 mm) by utilizing tape. After, the electrodes were dried at 80 °C for 2 h.
The linear sweep voltammetry (LSV) and chronoamperometry (I-t) curves of the samples were carried out in a three-electrode side window electrolytic cell, which was measured on a CHI760E electrochemical workstation under a high uniformity integrated Xenon light source (PLS-FX300HU, Beijing Perfectlight, Beijing, China) with an AM 1.5 G filter (100 mW/cm2).
An LSV measurement was typically carried out over a potential range of −0.2 to 1.0 V (vs. Ag/AgCl), and the scanning speed was 5 mV s−1 with the light cut off by a 5 s−1 shutter. An I-t measurement was performed under alternating illumination at 0.8 V (vs. Ag/AgCl). During the test, the working electrode was guaranteed to have an illuminated area of 1 cm2 and completely submerged in the electrolyte. The calculated voltage can be changed to a reversible hydrogen electrode (RHE) scale using the Nernst equation:
E RHE = E Ag/AgCl + 0.0592 × pH + E Ag/AgCl 0
where E Ag/AgCl 0 = 0.1976 V vs. Ag/AgCl at room temperature.
The incident photo-to-current efficiency (IPCE) test system was composed of an electrochemical workstation (CS350H, CorrTest, Wuhan, China), a 300 W xenon lamp light source (PLS-SXE300D, Beijing Perfectlight, Beijing, China), and a grating monochromator (7ISU, SOFN Instruments Co., Ltd., Beijing, China) with filters to remove higher order diffraction, which is calculated using the following equation:
IPCE % = 1240 × J λ × I 0 × 100 %
where J is the photocurrent density measured at a specific wavelength, λ is the specific wavelength, and I0 is the intensity of the incident light.
Electrochemical impedance spectroscopy (EIS) and Mott-Schottky (M-S) plots were measured in the dark, using an electrochemical workstation (Squidstat Plus, Admiral Instruments, Tempe, AZ, USA). The fitted circuit can be obtained from the EIS curve, where the CPE element is calculated. The impedance of the CPE in an AC circuit is:
CPE = σ ω m cos m π 2 j sin m π 2
where σ is the prefactor of the CPE, ω is the angular frequency, m is the CPE index (0 ≤ m ≤ 1), and j is an imaginary number j = 1 ; if m = 1, then the CPE denotes the ideal capacitor C. The electrochemical analyzer works over a frequency range of 0.01 to 100,000 Hz, with voltage increments of 0.005 V and an AC amplitude of 10 mV. In a typical M-S measurement, the working electrodes were tested at 500, 1000, 1500, 2000, and 2500 Hz.

4.3. Photocatalytic (PC) Performances Testing

The PC splitting of the ethanol-water mixtures to generate the H2 measurement was carried out in the MCP-WS1000 photochemical workstation (Beijing Perfectlight Technology Co., Ltd., Beijing, China) equipped with a 50 mL quartz-made reactor under artificial solar irradiation. Specifically, 20 mg of as-prepared photocatalysts was ultrasonically dispersed (30 min) into a solution consisting only of 15 mL ethanol and 15 mL water (pH = 7), which were deaerated by vacuuming for 10 min before the H2 evolution measurements. The full spectrum source was simulated sunlight consisting of 9 LED lamps (365, 385, 420, 450, 485, 535, 595, and 630 nm and one white light LED, which was 420–750 nm), and the power of the total light irradiation was approximately 100 mW/cm2. The visible light source consisted of 9 white light LED lamps (420–750 nm) with a total visible light irradiation power of 100 mW/cm2. The temperature of the reaction was controlled by circulating condensed water at 5 °C throughout the reaction process using a water-cooling system. The produced hydrogen was calculated by the external standard method using the peak area obtained by the PLD-CGA1000 composite gas analyzer (Beijing Perfectlight Technology Co., Ltd., Beijing, China).

4.4. Materials Characterization

The morphology of the samples was observed by a scanning electron microscope with an operating voltage of 10 kV (SEM, Apreo S LoV ac, Thermo Fisher Scientific, Waltham, MA, USA).
The X-ray diffraction data were taken using an X-ray diffractometer with CuK radiation and a measurement range of 20–80°, (XRD, Miniflex 600, Akishima, Rigaku, Tokyo, Japan).
The transmission electron microscopy and selected area electron diffraction images were obtained from an FEI Talos F200s transmission electron microscope, operated at 200 kV (TEM, SAED, Thermo Fisher Scientific, Waltham, MA, USA).
High-resolution transmission electron microscopy was carried out on an FEI Titan Themis Z G3 30–300 spherical aberration-corrected transmission electron microscope, operated at 300 kV, equipped with both image and probe aberration (HRTEM, Thermo Fisher Scientific, Waltham, MA, USA).
X-ray photoelectron spectroscopy was used to characterize the atomic composition and state at the surface of the samples, using Al Ka rays as the excitation source (XPS, Thermo Scientific K-Alpha, Waltham, MA, USA).
The UV-Vis absorbance spectra were collected by a Cary 5000 spectrophotometer, (UV-Vis, Agilent, Santa Clara, CA, USA).
The photoluminescence spectra were acquired using a fluorescence spectroscopy test system (PL, FLS980, Edinburgh Instruments Ltd., Livingston, UK).

5. Conclusions

Ce synchronous doping in the lattice of anatase TiO2 was successfully achieved using a facile sol-gel method. The Ce doping suppressed the rutile phase and crystal growth of the anatase TiO2, leading to smaller grain size and a higher specific surface area compared to pristine TiO2. Ce doping in the lattice structure of TiO2 was also demonstrated by HRTEM and XPS. The charge recombination in the TiO2 was successfully reduced by Ce doping. The Ce-doped TiO2 showed a negative shift in the flat band potential and a lower carrier transport resistance. In addition, Ce doping narrowed the band gap of TiO2, leading to a visible light response. Therefore, Ce-doped TiO2 exhibits an enhanced photocurrent density and an excellent photocatalytic performance. The Ce-doped TiO2 showed superior photocatalytic performance for H2 production under solar light. Rare earth elements have great potential in the application of solar energy conversion. Ce doping in the lattice of TiO2 provides a new strategy for designing photocatalysts for photocatalytic water splitting.

Supplementary Materials

The following supporting information can be downloaded at: https://www.mdpi.com/article/10.3390/molecules28062433/s1. Figure S1. Fluorescence spectra of the pure TiO2, 0.5%Ce/TiO2, 3%Ce/TiO2, and 5%Ce/TiO2; Figure S2. Chopped Linear sweep voltammetry (LSV) curves in 0.1M Na2SO4 under AM 1.5 G light: (a) pure TiO2, Ce-doped TiO2, and CeO2-TiO2; (b) 3%Ce/TiO2 annealed under different temperatures; Table S1. The relative amount of Ce element obtained from the ICP test.

Author Contributions

Conceptualization, Y.-X.C.; methodology, M.-H.T. and T.-M.W.; investigation, S.-W.L. and G.L.; validation, Q.-Q.Z. and R.C.; formal analysis, X.J.; data curation, H.-G.L.; writing—original draft preparation, M.-H.T. and T.-M.W.; writing—review and editing, Y.-X.C. and C.-Z.L.; supervision, Y.-X.C. and C.-Z.L.; project administration, Y.-X.C. and C.-Z.L.; funding acquisition, Y.-X.C., H.-G.L. and C.-Z.L. All authors have read and agreed to the published version of the manuscript.

Funding

This research was funded by the Youth Innovation Foundation of Xiamen City (3502Z20206085); Opening Project of PCOSS, Xiamen University (201907); Strategic Priority Research Program of the Chinese Academy of Sciences (XDB20000000); National Natural Science Foundation of China (21805280, 22275185, 21962006, U22A20396, 22288102, and 32101217); Major Research Project of Xiamen (3502Z20191015); Fujian Science and Technology Innovation Laboratory for Optoelectronic Information of China (2021ZR132 and 2021ZZ115); Natural Science Foundation of Fujian Province (2006L2005); Key Program of Frontier Science, CAS (QYZDJ-SSW-SLH033); and Fundamental Research Funds for the Central Universities (20720220009).

Institutional Review Board Statement

Not applicable.

Informed Consent Statement

Not applicable.

Data Availability Statement

Not applicable.

Conflicts of Interest

The authors declare no conflict of interest.

Sample Availability

Samples of the compounds are available from the authors.

References

  1. Fu, C.F.; Wu, X.; Yang, J. Material design for photocatalytic water splitting from a theoretical perspective. Adv. Mater. 2018, 30, 1802106. [Google Scholar] [CrossRef] [PubMed]
  2. Dholam, R.; Patel, N.; Adami, M.; Miotello, A. Hydrogen production by photocatalytic water-splitting using Cr- or Fe-doped TiO2 composite thin films photocatalyst. Int. J. Hydrog. Energy 2009, 34, 5337–5346. [Google Scholar] [CrossRef]
  3. Park, J.H.; Kim, S.; Bard, A.J. Novel carbon-doped TiO2 nanotube arrays with high aspect ratios for efficient solar water splitting. Nano Lett. 2006, 6, 24–28. [Google Scholar] [CrossRef]
  4. Kumaravel, V.; Mathew, S.; Bartlett, J.; Pillai, S.C. Photocatalytic hydrogen production using metal doped TiO2: A review of recent advances. Appl. Catal. B Environ. 2019, 244, 1021–1064. [Google Scholar] [CrossRef]
  5. Ni, M.; Leung, M.K.H.; Leung, D.Y.C.; Sumathy, K. A review and recent developments in photocatalytic water-splitting using TiO2 for hydrogen production. Renew. Sust. Energ. Rev. 2007, 11, 401–425. [Google Scholar] [CrossRef]
  6. Fujishima, A.; Honda, K. Electrochemical photolysis of water at a semiconductor electrode. Nature 1972, 238, 37–38. [Google Scholar] [CrossRef]
  7. Yao, T.; An, X.; Han, H.; Chen, J.Q.; Li, C. Photoelectrocatalytic materials for solar water splitting. Adv. Energy Mater. 2018, 8, 1800210. [Google Scholar] [CrossRef]
  8. Lianos, P. Review of recent trends in photoelectrocatalytic conversion of solar energy to electricity and hydrogen. Appl. Catal. B Environ. 2017, 210, 235–254. [Google Scholar] [CrossRef]
  9. Chiarello, G.L.; Dozzi, M.V.; Selli, E. TiO2-based materials for photocatalytic hydrogen production. J. Energy Chem. 2017, 26, 250–258. [Google Scholar] [CrossRef]
  10. Zhang, Z.; Zhang, L.; Hedhili, M.N.; Zhang, H.; Wang, P. Plasmonic gold nanocrystals coupled with photonic crystal seamlessly on TiO2 nanotube photoelectrodes for efficient visible light photoelectrochemical water splitting. Nano Lett. 2013, 13, 14–20. [Google Scholar] [CrossRef]
  11. Jiang, C.; Moniz, S.J.A.; Wang, A.; Zhang, T.; Tang, J. Photoelectrochemical devices for solar water splitting—Materials and challenges. Chem. Soc. Rev. 2017, 46, 4645–4660. [Google Scholar] [CrossRef] [Green Version]
  12. Guo, Q.; Ma, Z.; Zhou, C.; Ren, Z.; Yang, X. Single Molecule Photocatalysis on TiO2 Surfaces. Chem. Rev. 2019, 119, 11020–11041. [Google Scholar] [CrossRef] [PubMed]
  13. Altomare, M.; Lee, K.; Killian, M.S.; Selli, E.; Schmuki, P. Ta-doped TiO2 nanotubes for enhanced solar-light photoelectrochemical water splitting. Chemistry 2013, 19, 5841–5844. [Google Scholar] [CrossRef]
  14. Liu, Q.; He, J.; Yao, T.; Sun, Z.; Cheng, W.; He, S.; Xie, Y.; Peng, Y.; Cheng, H.; Sun, Y.; et al. Aligned Fe2TiO5-containing nanotube arrays with low onset potential for visible-light water oxidation. Nat. Commun. 2014, 5, 5122. [Google Scholar] [CrossRef] [PubMed] [Green Version]
  15. Hoang, S.; Guo, S.; Hahn, N.T.; Bard, A.J.; Mullins, C.B. Visible light driven photoelectrochemical water oxidation on nitrogen-modified TiO2 nanowires. Nano Lett. 2012, 12, 26–32. [Google Scholar] [CrossRef]
  16. Wang, Y.; Chen, Y.-X.; Barakat, T.; Wang, T.-M.; Krief, A.; Zeng, Y.-J.; Laboureur, M.; Fusaro, L.; Liao, H.-G.; Su, B.-L. Synergistic effects of carbon doping and coating of TiO2 with exceptional photocurrent enhancement for high performance H2 production from water splitting. J. Energy Chem. 2021, 56, 141–151. [Google Scholar] [CrossRef]
  17. Tismanar, I.; Obreja, A.C.; Buiu, O.; Duta, A. VIS-active TiO2–graphene oxide composite thin films for photocatalytic applications. Appl. Surf. Sci. 2021, 538, 147833. [Google Scholar] [CrossRef]
  18. Wang, S.; Zeng, B.; Li, C. Effects of Au nanoparticle size and metal-support interaction on plasmon-induced photocatalytic water oxidation. Chin. J. Catal. 2018, 39, 1219–1227. [Google Scholar] [CrossRef]
  19. Reszczyńska, J.; Grzyb, T.; Sobczak, J.W.; Lisowski, W.; Gazda, M.; Ohtani, B.; Zaleska, A. Visible light activity of rare earth metal doped (Er3+, Yb3+ or Er3+/Yb3+) titania photocatalysts. Appl. Catal. B Environ. 2015, 163, 40–49. [Google Scholar] [CrossRef]
  20. Štengl, V.; Bakardjieva, S.; Murafa, N. Preparation and photocatalytic activity of rare earth doped TiO2 nanoparticles. Mater. Chem. Phys. 2009, 114, 217–226. [Google Scholar] [CrossRef]
  21. Tong, T.; Zhang, J.; Tian, B.; Chen, F.; He, D.; Anpo, M. Preparation of Ce-TiO2 catalysts by controlled hydrolysis of titanium alkoxide based on esterification reaction and study on its photocatalytic activity. J. Colloid Interface Sci. 2007, 315, 382–388. [Google Scholar] [CrossRef]
  22. Fu, X.Y.; Liang, X.H. Effect of the Ce-doped TiO2 on the photocatalysis degradation of MB. Appl. Mech. Mater. 2013, 320, 220–225. [Google Scholar] [CrossRef]
  23. Cano-Franco, J.C.; Álvarez-Láinez, M. Effect of CeO2 content in morphology and optoelectronic properties of TiO2-CeO2 nanoparticles in visible light organic degradation. Mat. Sci. Semicon. Proc. 2019, 90, 190–197. [Google Scholar] [CrossRef]
  24. Zhang, J.; Peng, W.; Chen, Z.; Chen, H.; Han, L. Effect of cerium doping in the TiO2 photoanode on the electron transport of dye-sensitized solar cells. J. Phys. Chem. C 2012, 116, 19182–19190. [Google Scholar] [CrossRef]
  25. Dey, S.; Roy, S.C. Influence of Ce doping on morphology, crystallinity and photoelectrochemical charge transfer characteristics of TiO2 nanorod arrays grown on conductive glass substrate. J. Alloys Compd. 2021, 881, 160481–160490. [Google Scholar] [CrossRef]
  26. Li, L.L.; Zhang, L.; Ma, K.L.; Zou, W.X.; Cao, Y.; Xiong, Y.; Tang, C.J.; Dong, L. Ultra-low loading of copper modified TiO2/CeO2 catalysts for low-temperature selective catalytic reduction of NO by NH3. Appl. Catal. B Environ. 2017, 207, 366–375. [Google Scholar] [CrossRef]
  27. Bêche, E.; Charvin, P.; Perarnau, D.; Abanades, S.; Flamant, G. Ce 3d XPS investigation of cerium oxides and mixed cerium oxide (CexTiyOz). Surf. Interface Anal. 2008, 40, 264–267. [Google Scholar] [CrossRef]
  28. Zahra, S.; Fariborz, H.; Chang-Seo, L. Surface fluorinated Ce-doped TiO2 nanostructure photocatalyst: A trap and remove strategy to enhance the VOC removal from indoor air environment. Chem. Eng. J. 2008, 401, 125932–125948. [Google Scholar] [CrossRef]
  29. Gao, Y.; Xu, J.; Shi, S.; Dong, H.; Cheng, Y.; Wei, C.; Zhang, X.; Yin, S.; Li, L. TiO2 nanorod arrays based self-powered UV photodetector: Heterojunction with NiO nanoflakes and enhanced UV photoresponse. ACS Appl. Mater. Interfaces 2018, 10, 11269–11279. [Google Scholar] [CrossRef] [PubMed]
  30. Liu, G.Q.; Yang, Y.; Li, Y.; Wu, L.; Xu, Q.; Zhu, J.F.; Yu, S.H. Band structure engineering toward low-onset-potential photoelectrochemical hydrogen production. ACS Mater. Lett. 2020, 2, 1555–1560. [Google Scholar] [CrossRef]
  31. Hamilton, J.W.J.; Byrne, J.A.; Dunlop, P.S.M.; Dionysiou, D.D.; Pelaez, M.; O’Shea, K.; Synnott, D.; Pillai, S.C. Evaluating the mechanism of visible light activity for N,F-TiO2 using photoelectrochemistry. J. Phys. Chem. C 2014, 118, 12206–12215. [Google Scholar] [CrossRef]
  32. Bertocci, U.; Huet, F. Noise analysis applied to electrochemical systems. Corros. Sci. 1995, 51, 131–144. [Google Scholar] [CrossRef]
  33. Chen, Z.; Dinh, H.N.; Miller, E. Photoelectrochemical water splitting. Springer 2013, 344, 6–15. [Google Scholar] [CrossRef]
  34. Jiang, X.; Chen, Y.X.; Zhou, J.W.; Lin, S.W.; Lu, C.Z. Pollen carbon-based rare-earth composite material for highly efficient photocatalytic hydrogen production from ethanol-water mixtures. ACS Omega 2022, 7, 30495–30503. [Google Scholar] [CrossRef]
  35. Yan, D.H.; Tao, J.; Kisslinger, K.; Cen, J.J.; Wu, Q.Y.; Orlov, A.; Liu, M.Z. The role of the domain size and titanium dopant in nanocrystalline hematite thin films for water photolysis. Nanoscale 2015, 7, 18515–18523. [Google Scholar] [CrossRef]
  36. Pan, X.; Zhao, Y.; Liu, S.; Korzeniewski, C.L.; Wang, S.; Fan, Z.Y. Comparing graphene-TiO2 nanowire and graphene-TiO2 nanoparticle composite photocatalysts. ACS Appl. Mater. Interfaces 2012, 4, 3944–3950. [Google Scholar] [CrossRef] [PubMed]
Figure 1. SEM images of (a) pure TiO2, (b) CeO2-TiO2, and (c) Ce/TiO2; (d) element mapping images of Ti, O, and Ce in the Ce/TiO2 sample; (e) XRD patterns of the CeO2, pure TiO2, CeO2-TiO2 mixture, and Ce/TiO2 samples with different Ce doping contents; (f) 23.5–25.0° refined XRD spectrums of (e).
Molecules 28 02433 g001
Figure 2. TEM images, HRTEM images, SAED patterns, and elemental mapping of (ad) pure TiO2; (eh) CeO2-TiO2; (il) Ce/TiO2, respectively.
Molecules 28 02433 g002
Figure 3. XPS spectra of the pure TiO2, Ce/TiO2, and CeO2-TiO2: (a) survey spectra; (b) Ti 2p; (c) O 1s; (d) Ce 3d.
Molecules 28 02433 g003
Figure 4. (a) UV-Vis absorbance spectra and (b) the corresponding Tauc plot of the pure TiO2, CeO2-TiO2, and Ce/TiO2.
Molecules 28 02433 g004
Figure 5. (a) Chopped linear sweep voltammetry (LSV) curves of the pure TiO2, CeO2-TiO2, and Ce/TiO2; (b) chronoamperometry data plots of the pure TiO2, CeO2-TiO2, and Ce/TiO2 at 0.8 V vs. Ag/AgCl.
Molecules 28 02433 g005
Figure 6. LSV curves for the onset potential from the low-potential region of the pure TiO2, CeO2-TiO2, and Ce/TiO2.
Molecules 28 02433 g006
Figure 7. (a) Photocurrent density versus the monochromatic light in the electrochemical noise mode; (b) derived IPCE (%) spectra from the photocurrent density versus the monochromatic light; (c) photocurrent density and IPCE (%) spectra versus the monochromatic light at an increased applied voltage (V vs. Ag/AgCl).
Molecules 28 02433 g007
Figure 8. (a) The band gap determination extracted from the IPCE spectra as a function of (IPCE% × hv)1/2 vs. hv; (b) Mott–Schottky plots; (c) EIS Nyquist plots with the fitted equivalent circuit.
Molecules 28 02433 g008
Figure 9. (a) Photocatalytic hydrogen evolution of the pure TiO2, CeO2-TiO2, and Ce/TiO2; (b) proposed band structures of the pure TiO2, CeO2-TiO2, and Ce/TiO2.
Molecules 28 02433 g009
Scheme 1. Synthesis diagram of (a) pure TiO2 and CeO2-TiO2; (b) Ce/TiO2.
Molecules 28 02433 sch001
Disclaimer/Publisher’s Note: The statements, opinions and data contained in all publications are solely those of the individual author(s) and contributor(s) and not of MDPI and/or the editor(s). MDPI and/or the editor(s) disclaim responsibility for any injury to people or property resulting from any ideas, methods, instructions or products referred to in the content.

