
Flavonoids and Terpenoids with PTP-1B Inhibitory Properties from the Infusion of Salvia amarissima Ortega

 ,
,  ,
,
Abstract
:
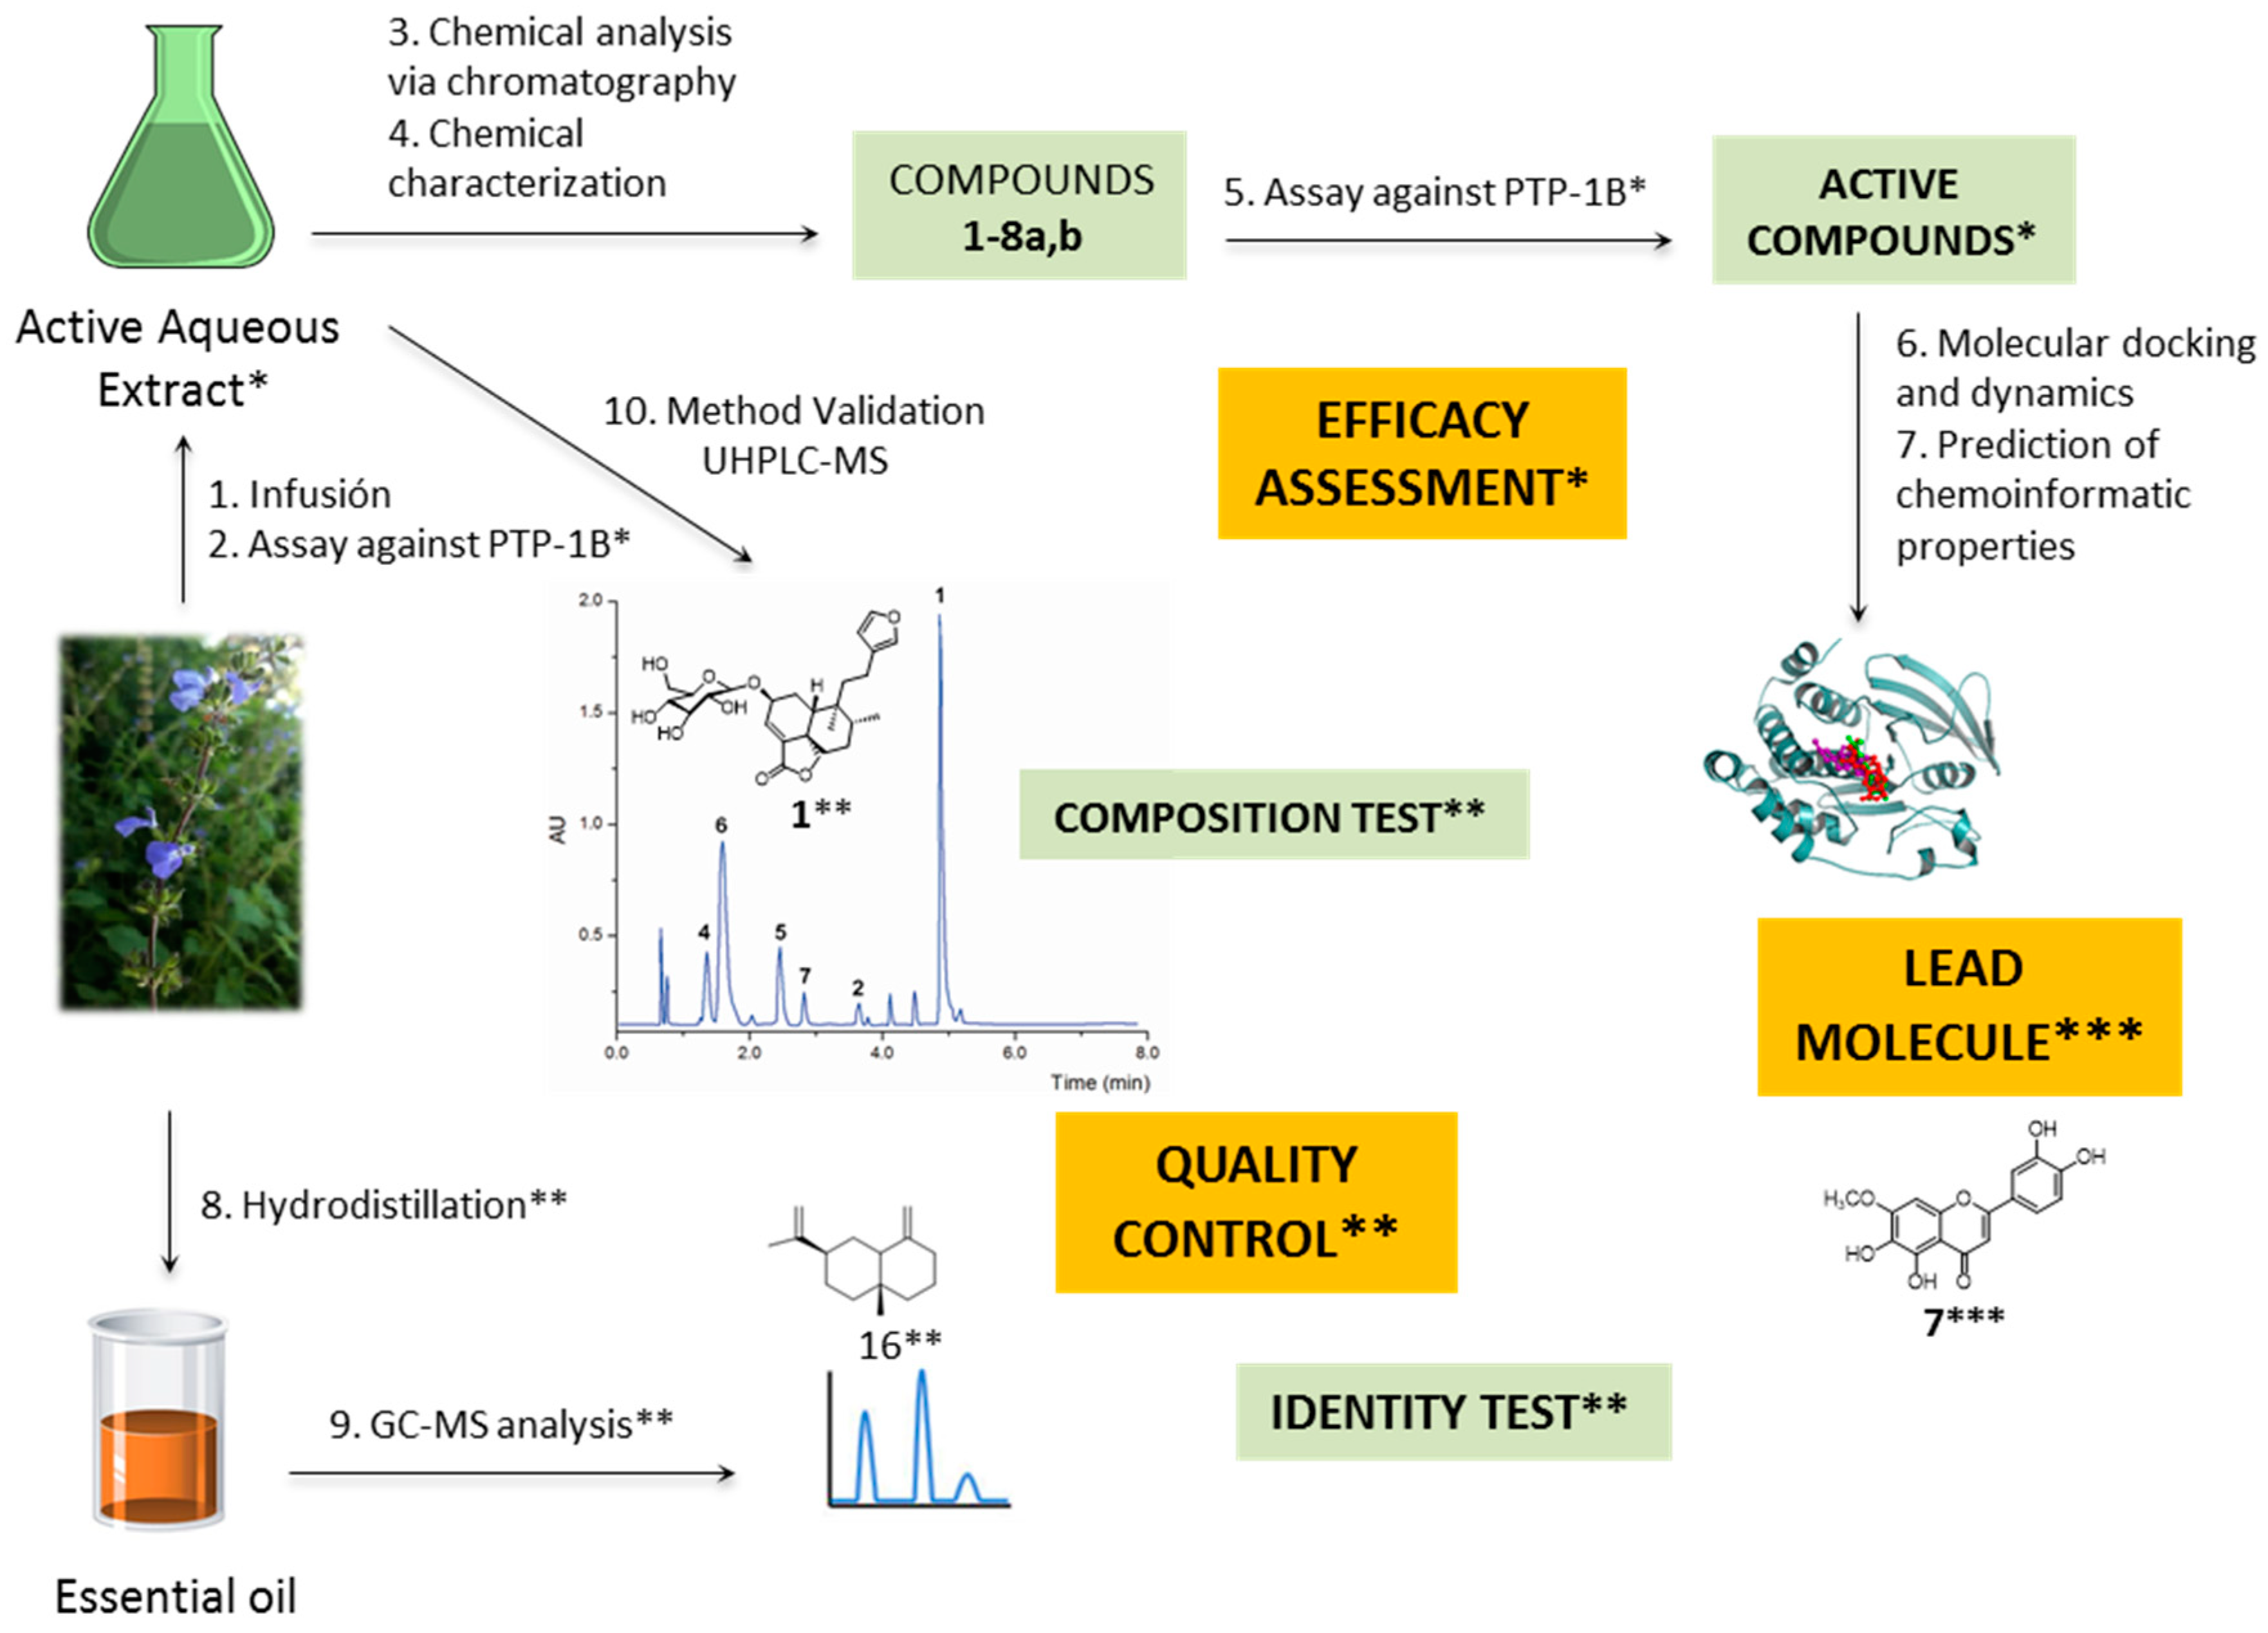
1. Introduction
2. Results and Discussion
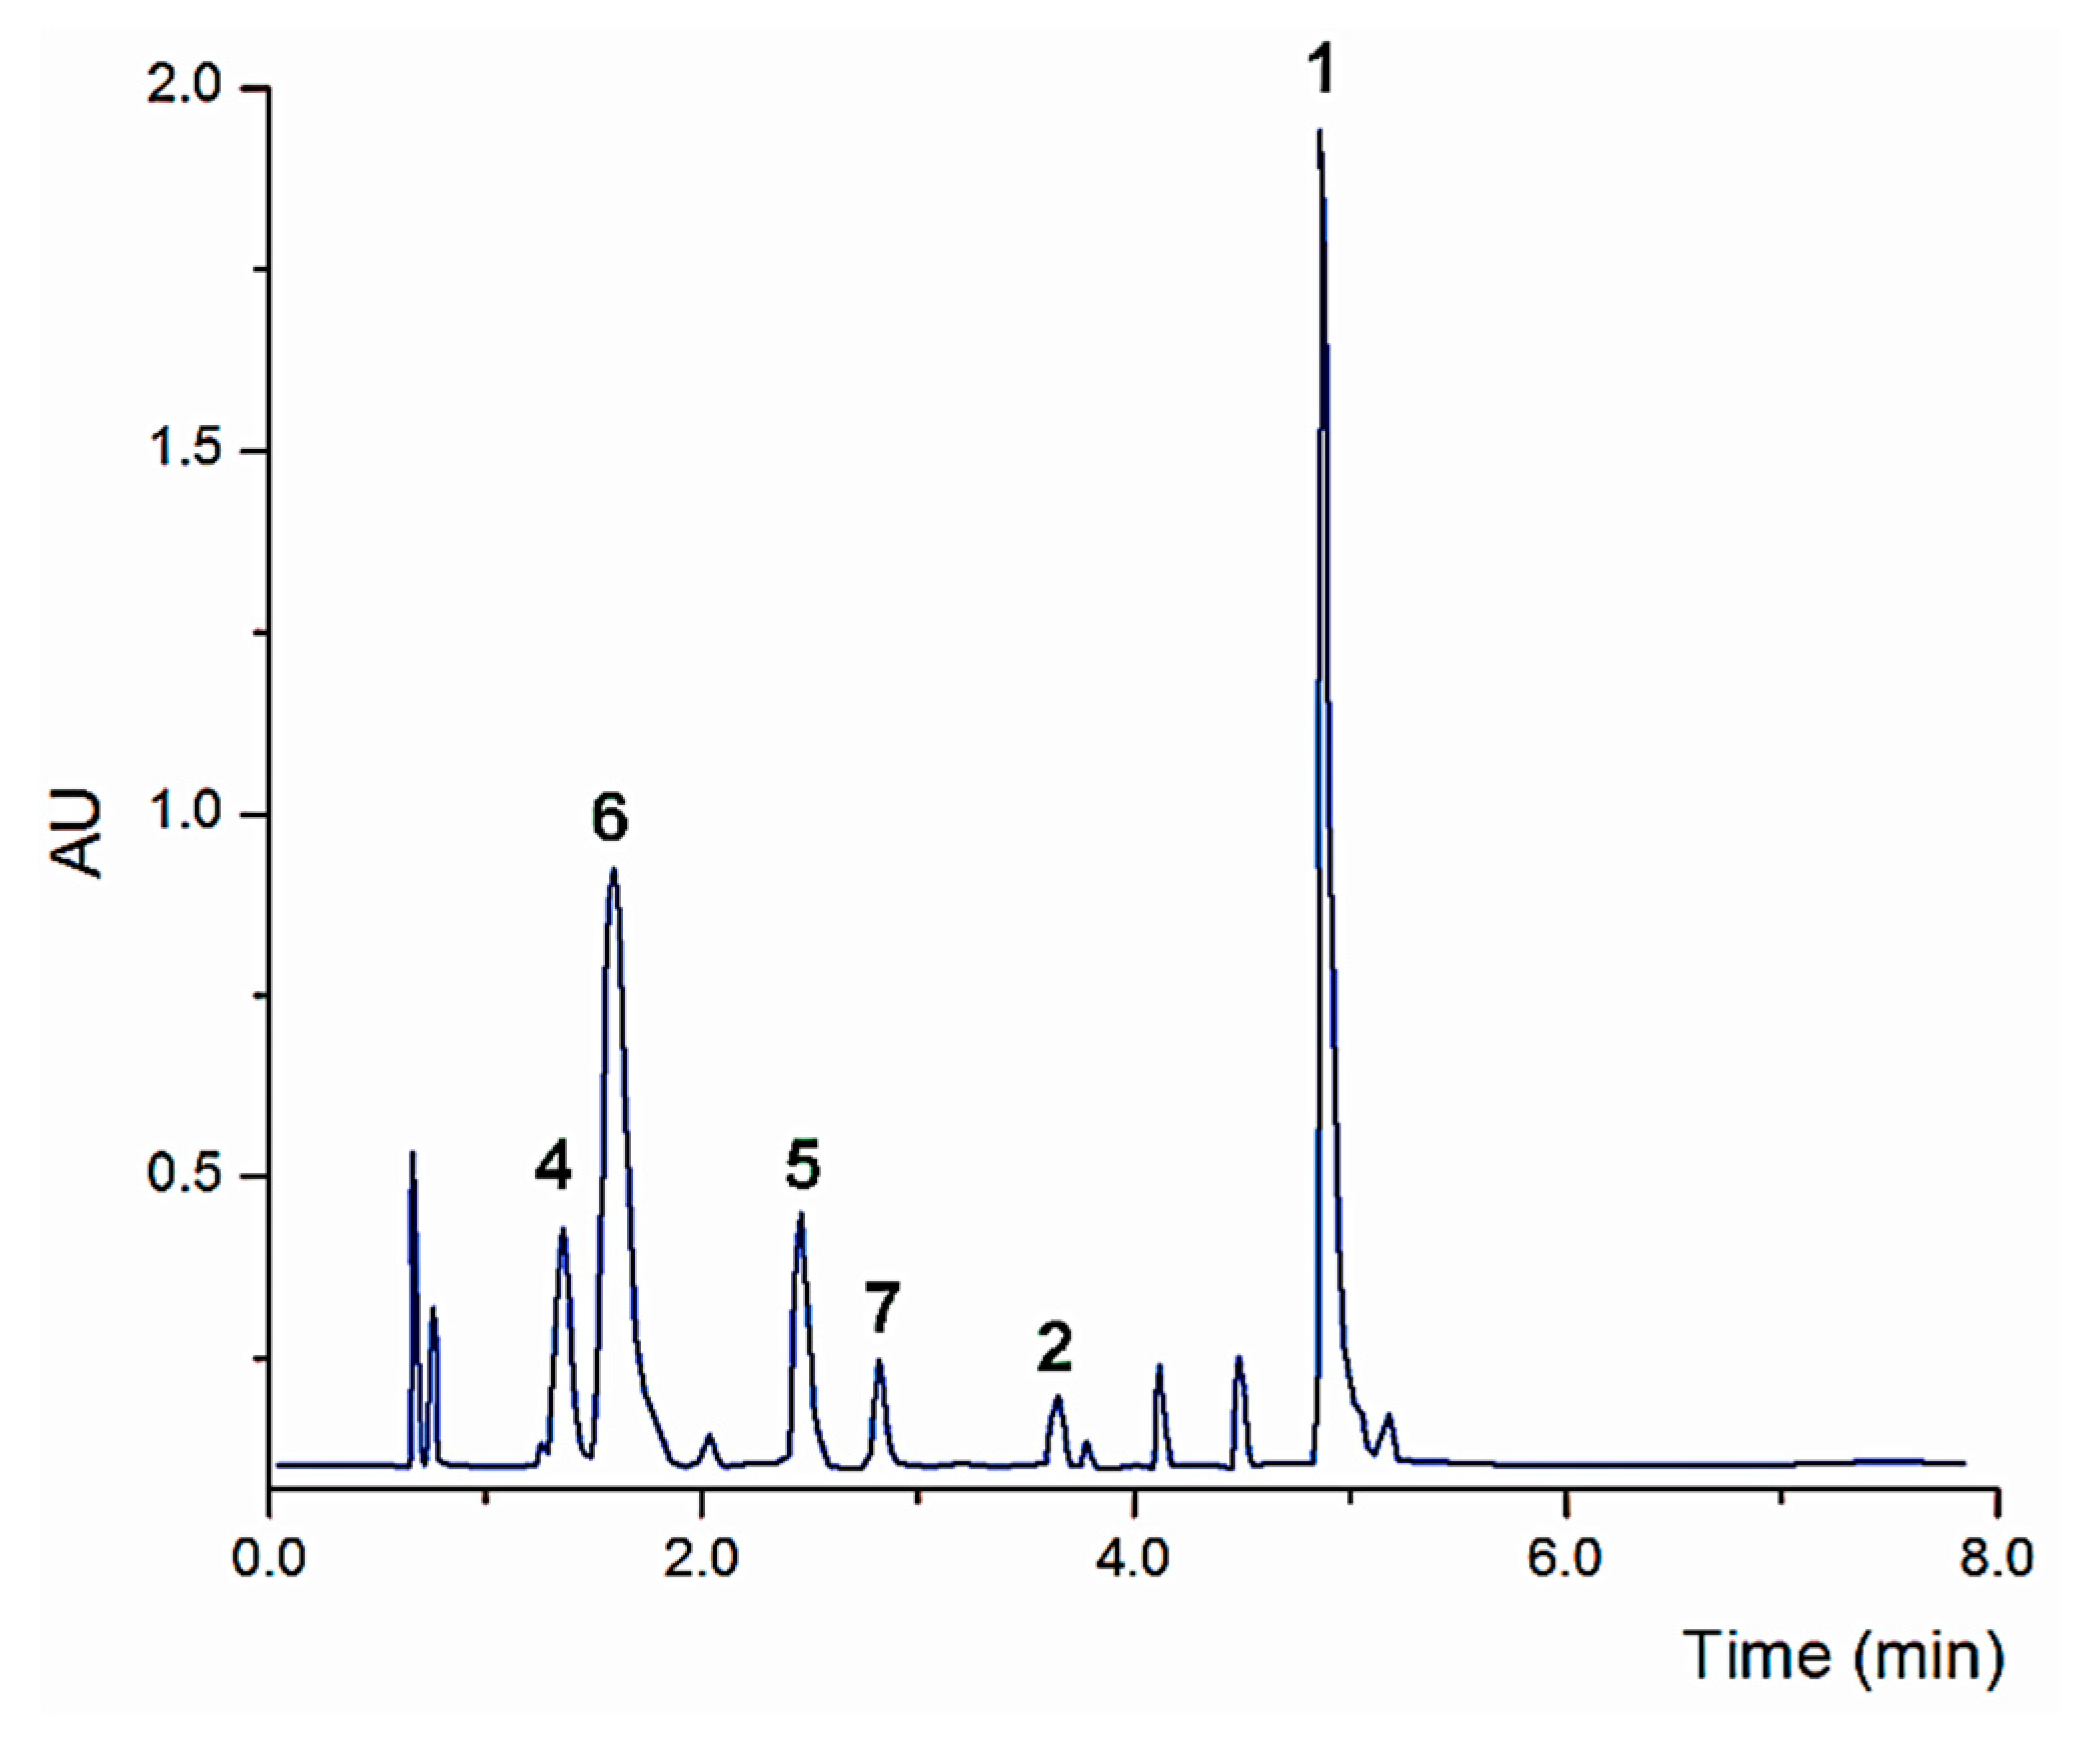
2.1. Chemical Constituents of the Aqueous Extract
2.2. Chemical Constituents of the Essential Oil
2.3. Evaluation of Compounds 1–8a,b on the PTP-1B Inhibitory Activity
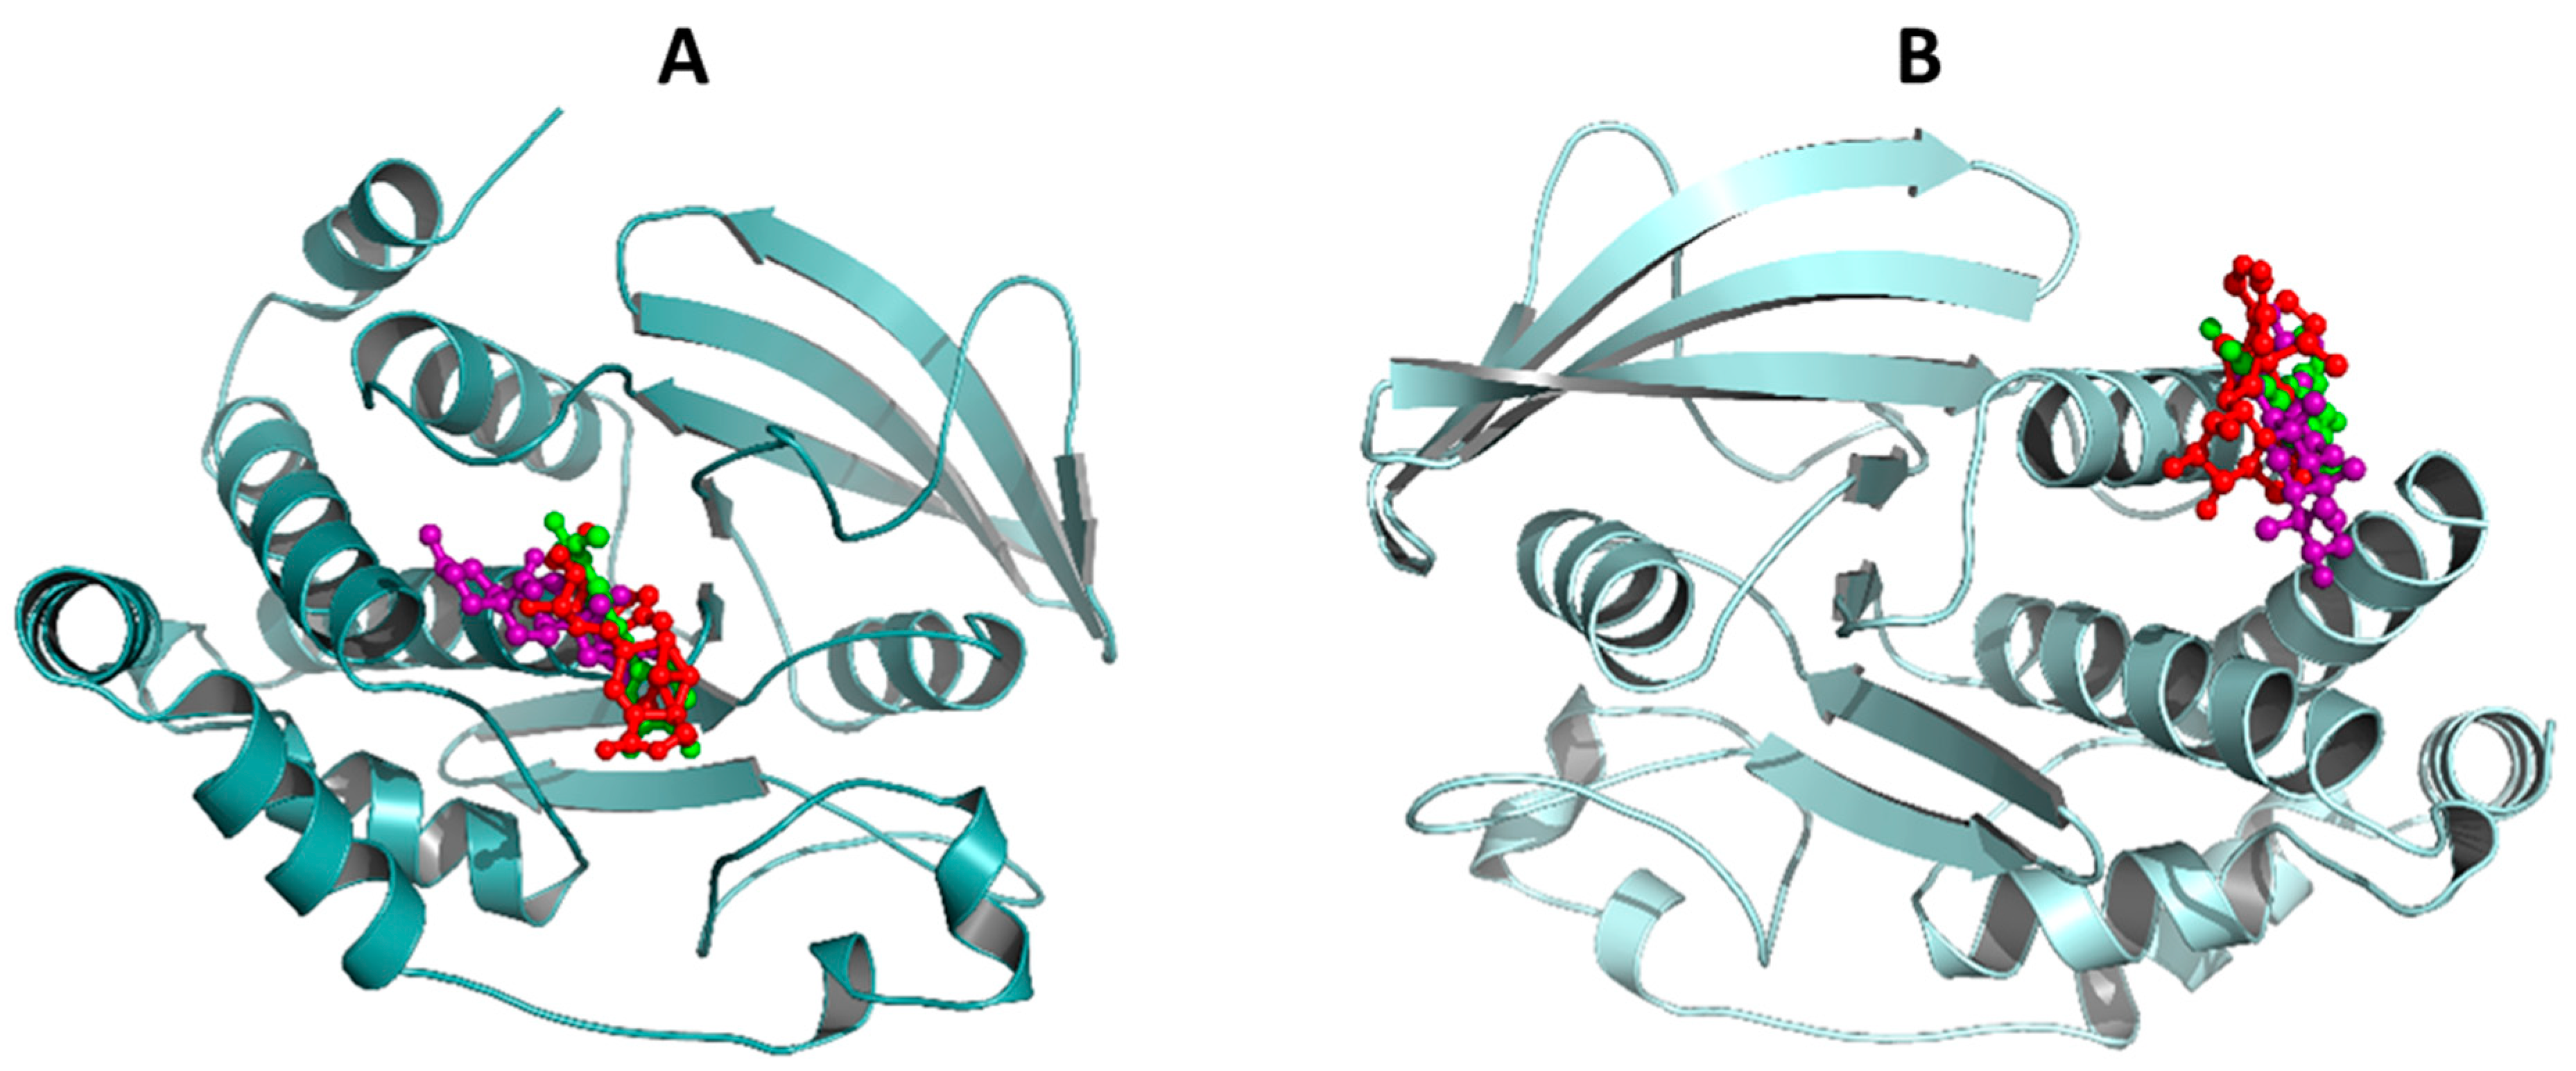
2.4. Docking Study
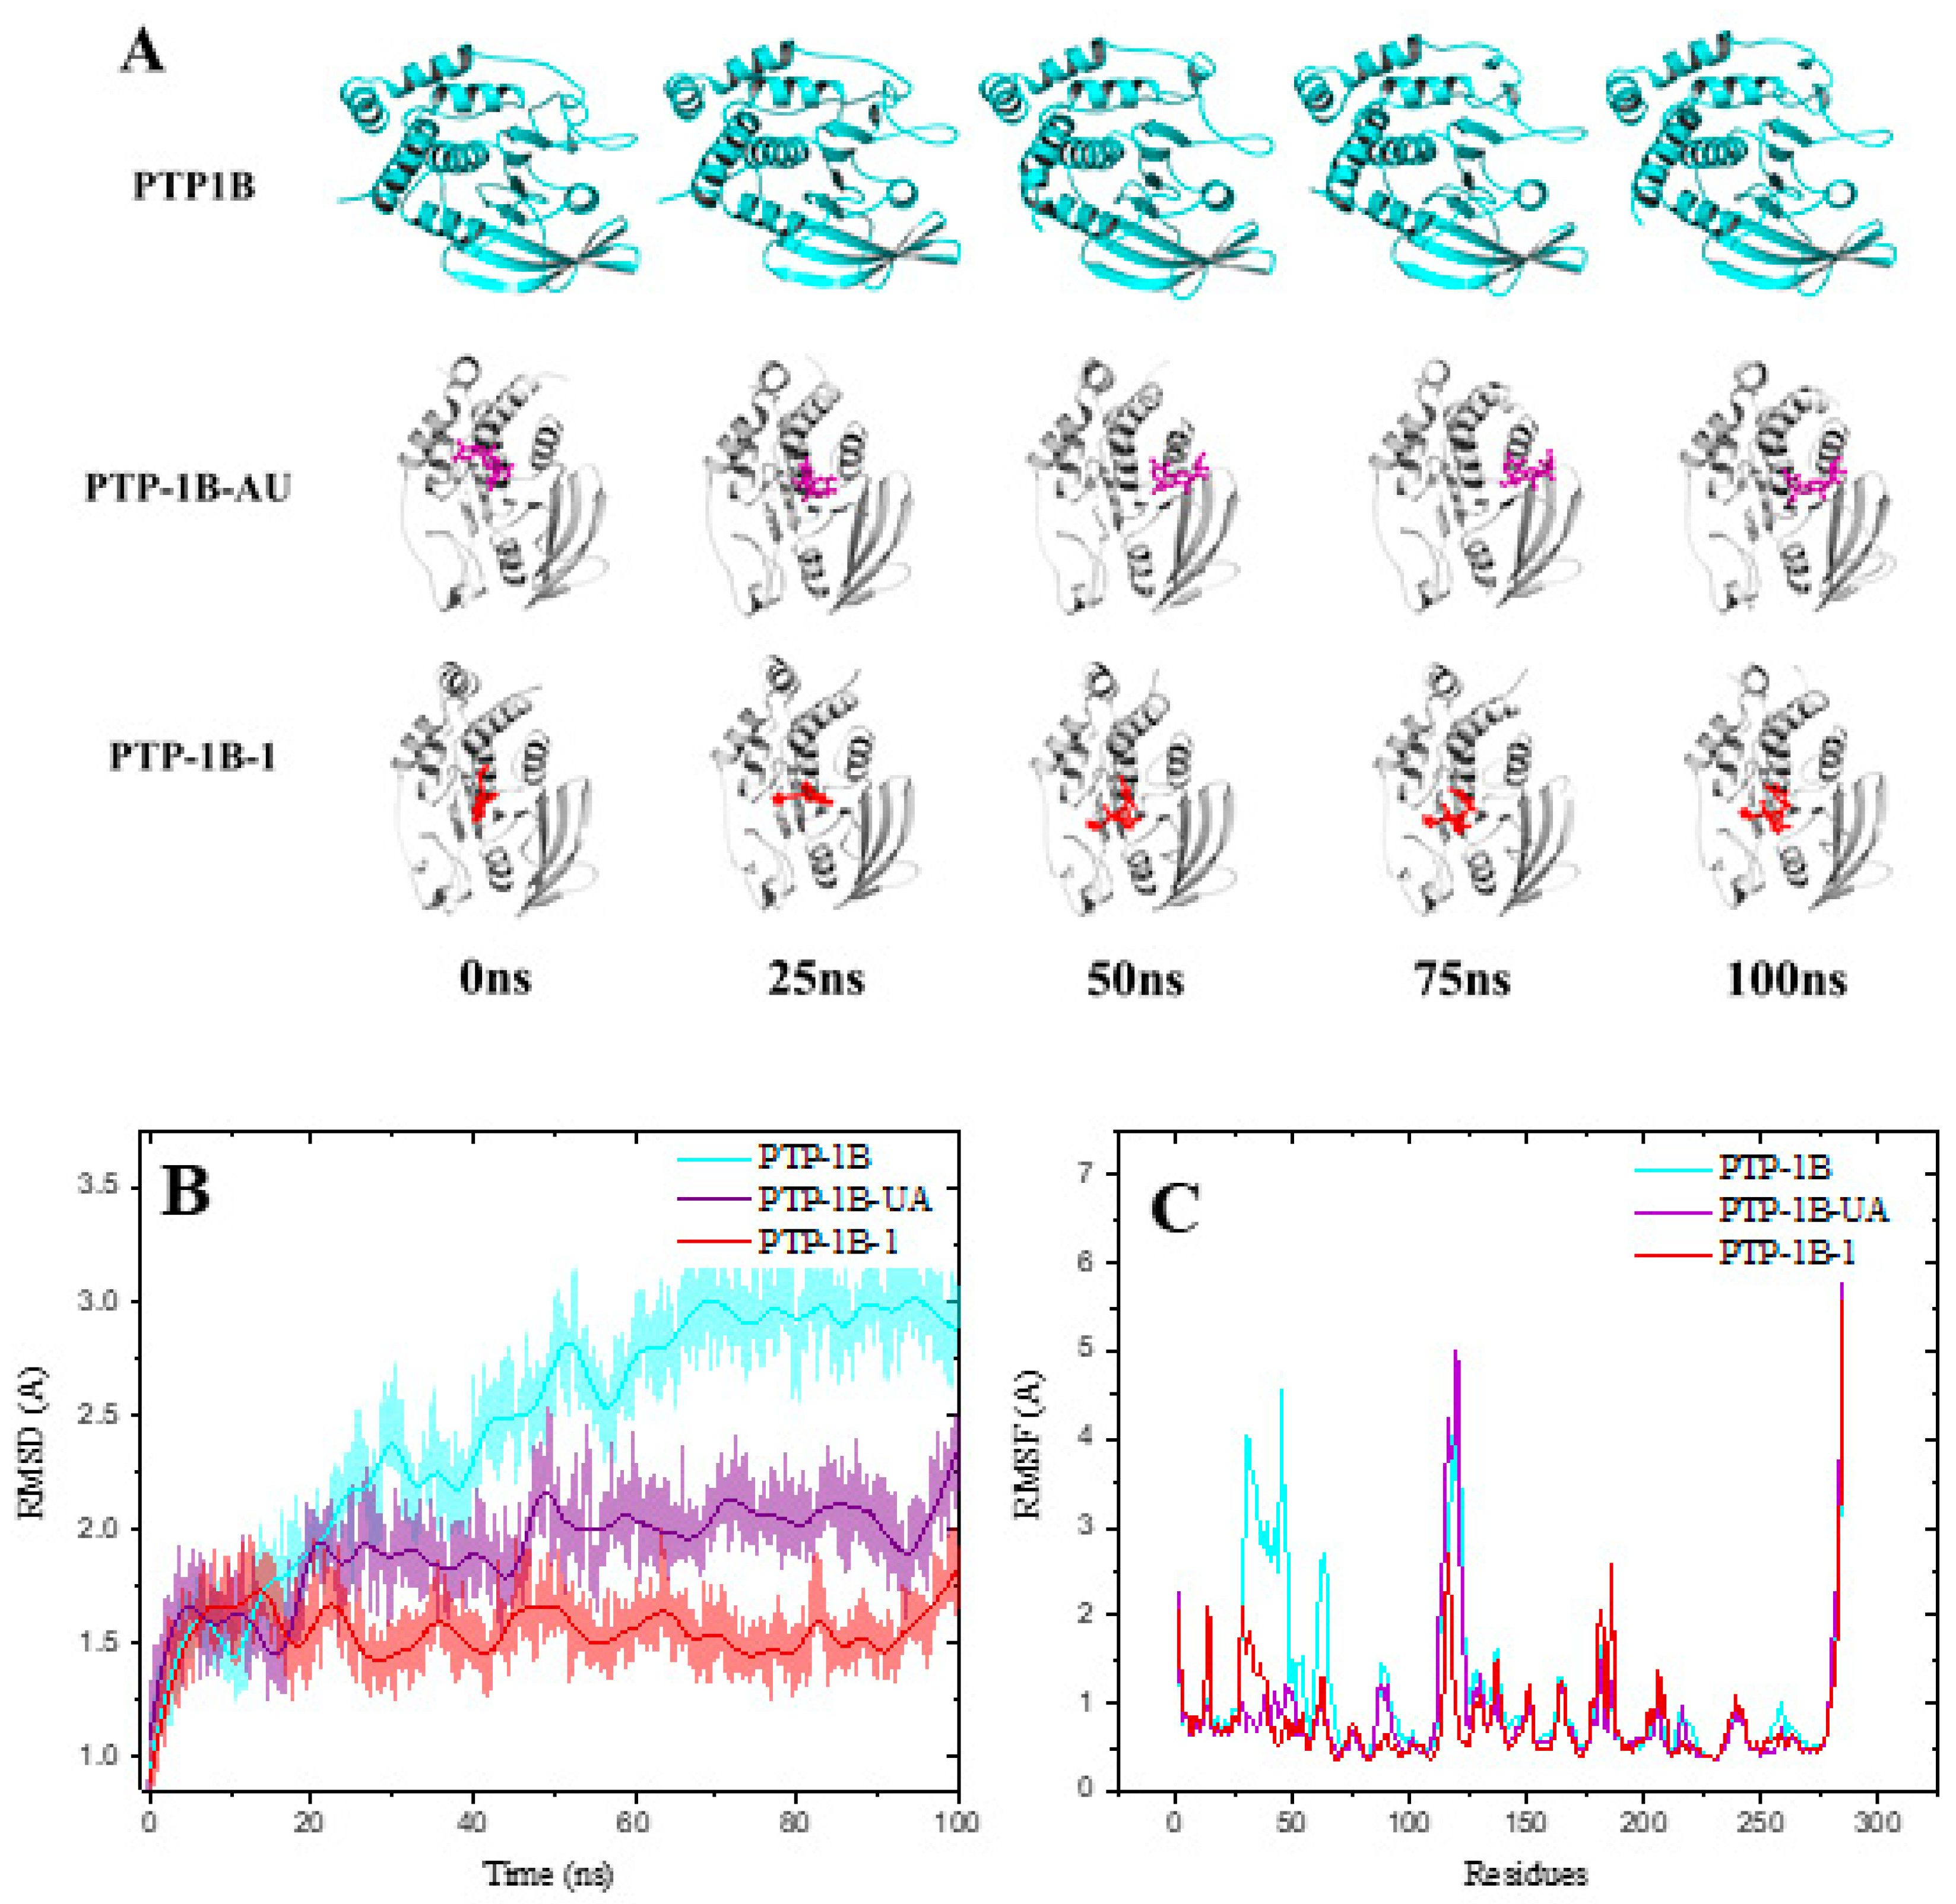
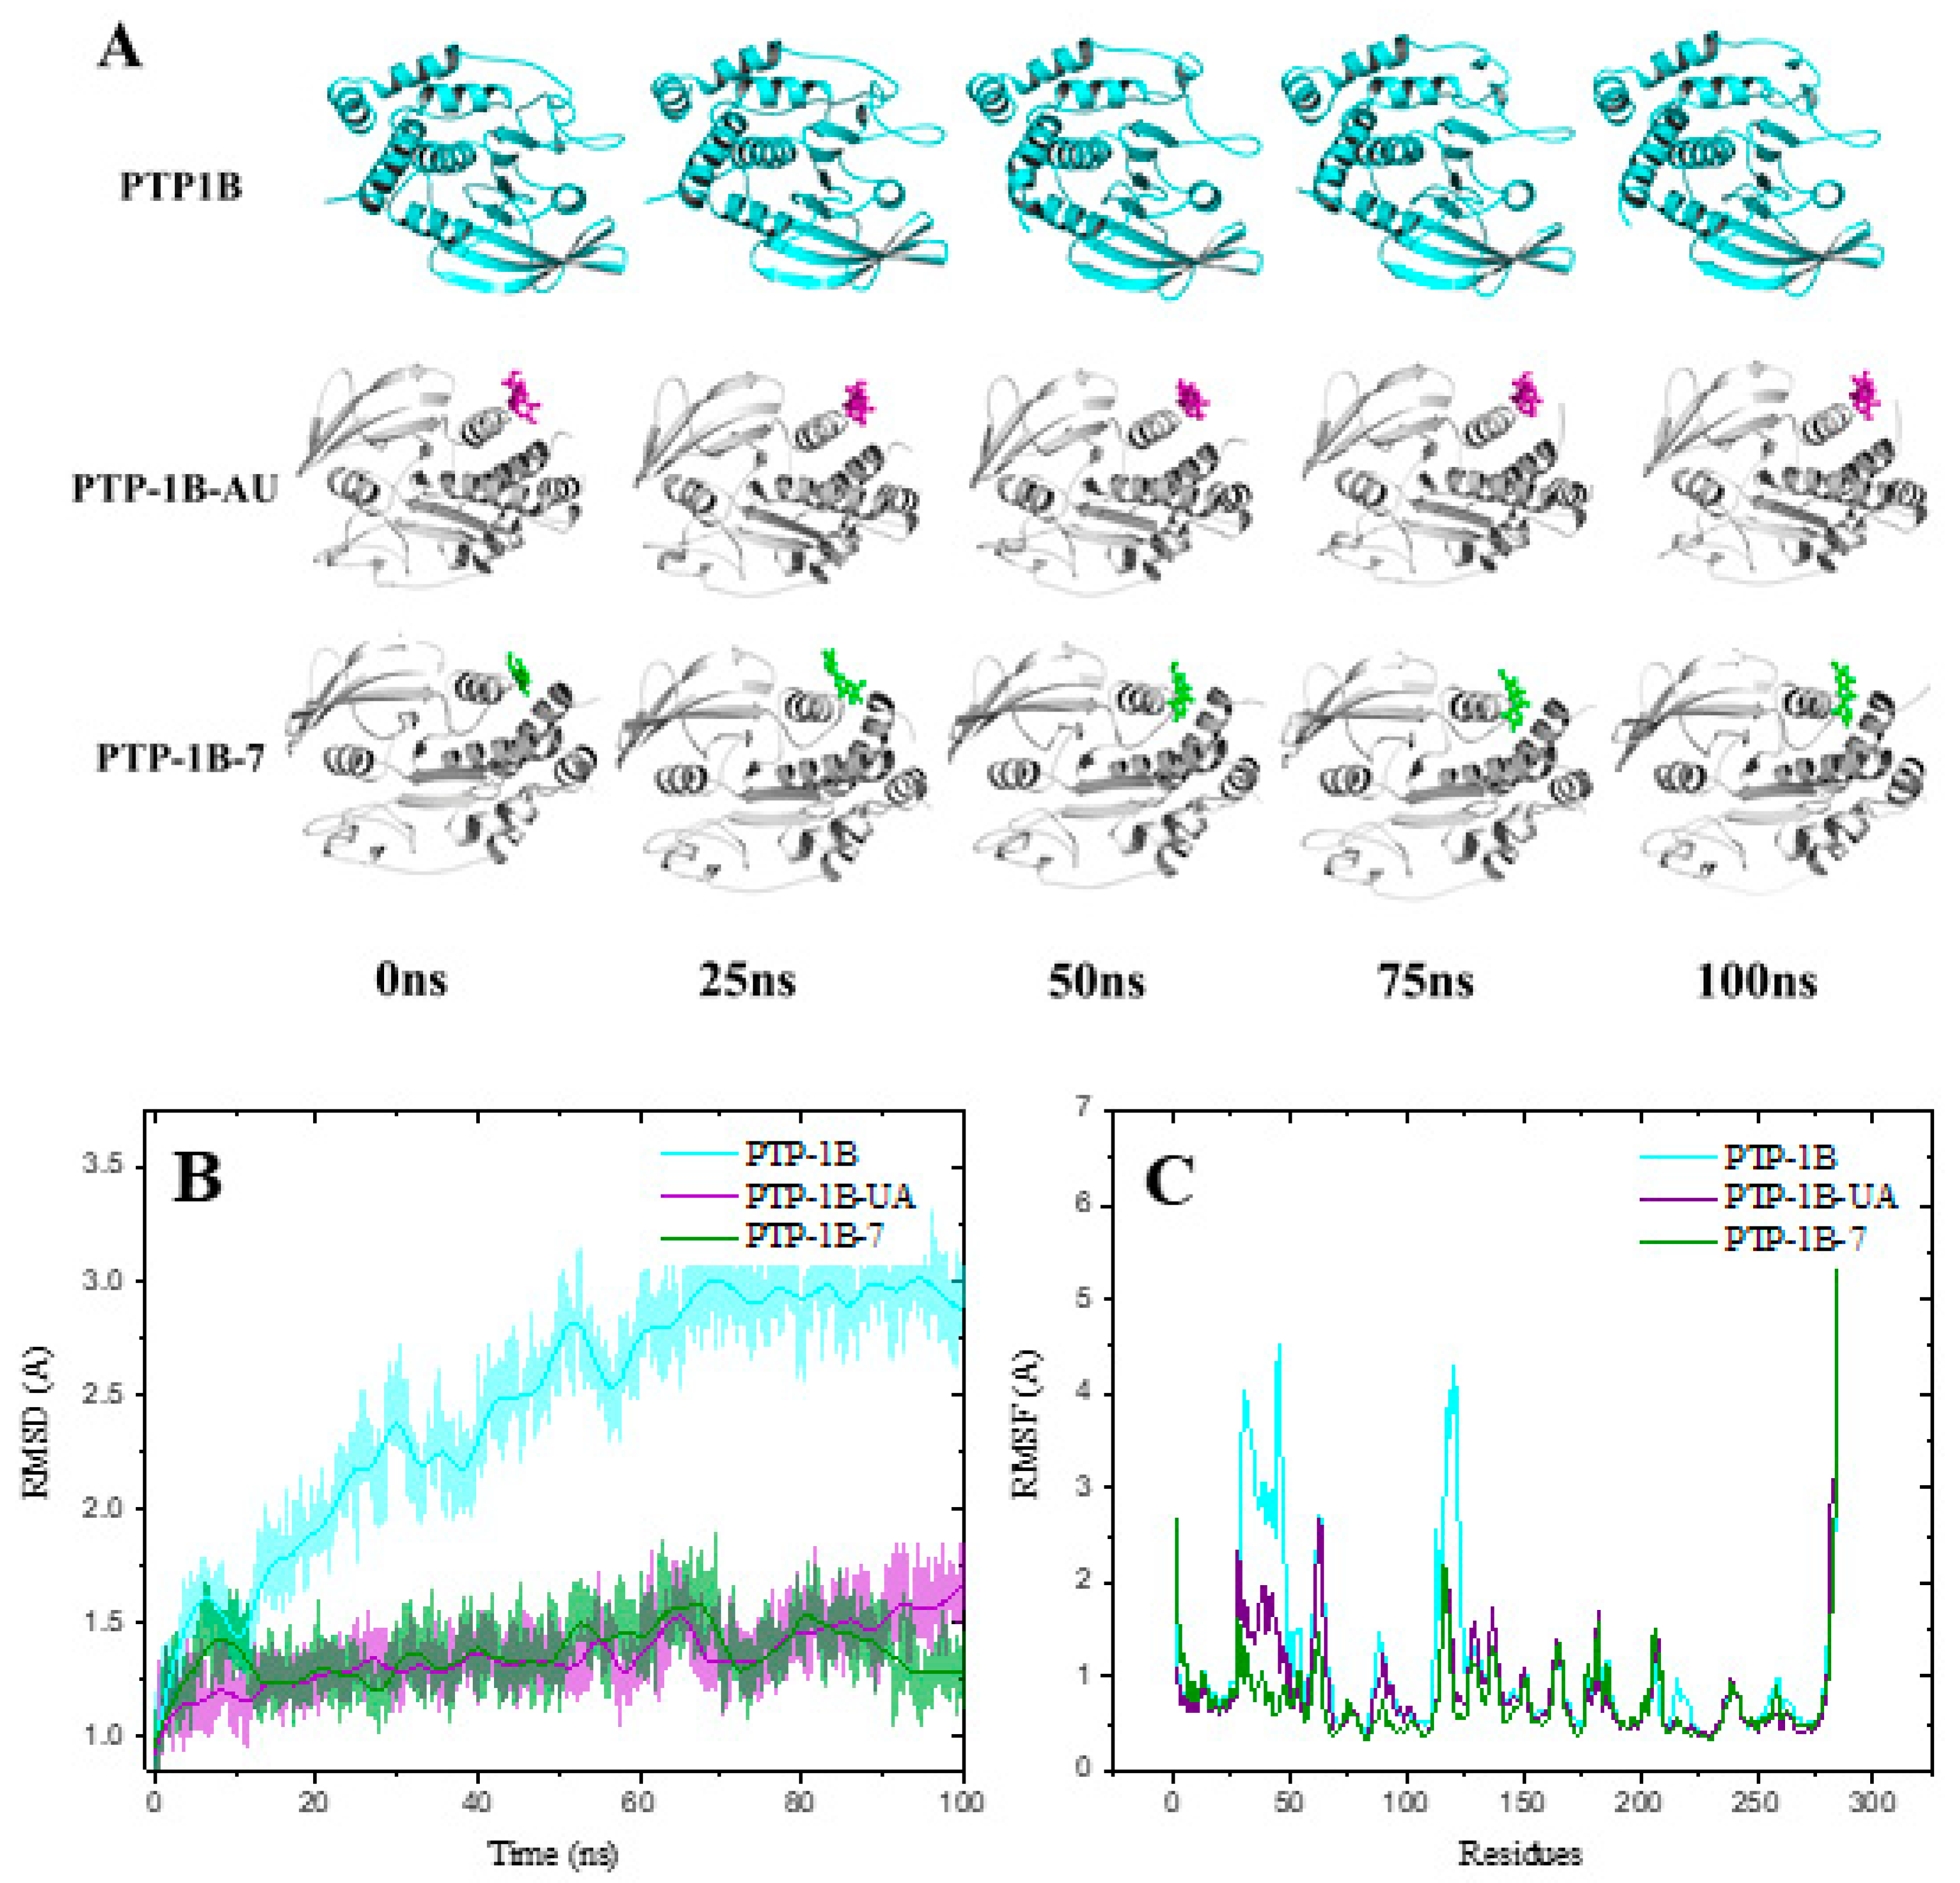
2.5. Molecular Dynamics of PTP-1B-Compounds 1, 7 and UA Complexes
2.6. Drug Likeness for Compounds 1, 7 and UA
2.7. Development and Validation of an UHPLC-MS Method for Quantifying 1
3. Materials and Methods
3.1. General Procedures
3.2. Plant Material
3.3. Extracts and Essential Oils Preparation
3.4. Separation of Active Compounds from the Ethyl Acetate Soluble Fraction
3.5. Separation of Active Compounds from AE
3.6. Enzymatic Hydrolysis of 8a,b
3.7. UHPLC-MS Analysis and Method Validation
3.8. GC-MS Analysis of the Essential Oils
3.9. Protein Tyrosine Phosphatase 1B Inhibition Assay
3.10. Docking Studies
3.11. Molecular Dynamics Simulation
3.12. Chemoinformatic Properties of Compounds 1, 7 and AU
4. Conclusions
Supplementary Materials
Author Contributions
Funding
Acknowledgments
Conflicts of Interest
References
- International Diabetes Federation (IDF). Diabetes Atlas, 9th ed. Available online: http://www.diabetesatlas.org (accessed on 13 March 2020).
- Mata, R.; Figueroa, M.; Navarrete, A.; Rivero-Cruz, I. Chemistry and Biology of Selected Mexican Medicinal Plants. In Progress in the Chemistry of Organic Natural Products; Kinghorn, A.D., Falk, H., Gibbons, S., Kobayashi, J., Asakawa, Y., Liu, J.K., Eds.; Springer Nature Switzerland AG: Cham, Switzerland, 2019; Volume 108, pp. 1–142. [Google Scholar]
- Efferth, T.; Greten, H.J. Quality control for medicinal plants. Med. Aromat. Plants 2012, 1, 1000e131. [Google Scholar]
- Calderón, R.G.; Rzedowski, J. Flora Fanerogámica del Valle de México, 2nd ed.; Instituto de Ecología, A.C. y Comisión Nacional para el Conocimiento y Uso de la Biodiversidad, Pátzcuaro: Mexico City, Mexico, 2010; pp. 1–1406. [Google Scholar]
- López, F.C.E.; Sánchez, D.G.; Arrieta, B.D.; Román, G.J.H. Estudio preliminar fitoquímico y de la actividad antimicrobiana de Salvia amarissima Ortega. Cienc. y Tecnol. 2010, 9, 67–76. [Google Scholar]
- Maldonado, E.; Cárdenas, J.; Bojórquez, H.; Escamilla, E.M.; Ortega, A. Amarisolide, a neo-clerodane diterpene glycoside from Salvia amarissima. Phytochemistry 1996, 42, 1105–1108. [Google Scholar] [CrossRef]
- Bautista, E.; Fragoso-Serrano, M.; Ortiz-Pastrana, N.; Toscano, R.A.; Ortega, A. Structural elucidation and evaluation of multidrug-resistance modulatory capability of amarissinins A-C, diterpenes derived from Salvia amarissima. Fitoterapia 2016, 114, 1–6. [Google Scholar] [CrossRef] [PubMed]
- Flores-Bocanegra, L.; González-Andrade, M.; Bye, R.; Linares, E.; Mata, R. α-Glucosidase inhibitors from Salvia circinata. J. Nat. Prod. 2017, 80, 1584–1593. [Google Scholar] [CrossRef] [PubMed]
- Fragoso-Serrano, M.; Ortiz-Pastrana, N.; Luna-Cruz, N.; Toscano, R.A.; Alpuche-Solis, A.G.; Ortega, A.; Bautista, E. Amarisolide F, an acylated diterpenoid glucoside and related terpenoids from Salvia amarissima. J. Nat. Prod. 2019, 82, 631–635. [Google Scholar] [CrossRef]
- Bautista, E.; Fragoso-Serrano, M.; Toscano, R.A.; García-Peña, M.R.; Ortega, A. Teotihuacanin, a diterpene with an unusual spiro-10/6 system from Salvia amarissima with potent modulatory activity of multidrug resistance in cancer cells. Org. Lett. 2015, 17, 3280–3282. [Google Scholar] [CrossRef]
- Calzada, F.; Bautista, E. Plants used for the treatment of diarrhoea from Mexican Flora with amoebicidal and giadicidal activity, and their phytochemical constituents. J. Ethnopharmacol. 2020, 253, 1–49. [Google Scholar] [CrossRef]
- Moreno-Pérez, G.F.; González-Trujano, M.E.; Martínez-Gordillo, M.J.; San Miguel-Chávez, R.; Basurto-Peña, F.A.; Dorazco-Gozález, A.; AguirreHernández, E. Amarisolide A and pedalitin as bioactive compounds in the antinociceptive effects of Salvia circinata. Bot. Sci. 2019, 97, 355–365. [Google Scholar] [CrossRef]
- Klaman, L.D.; Boss, O.; Peroni, O.D.; Kim, J.K.; Martino, J.L.; Zabolotny, J.M.; Moghal, N.; Lubkin, M.; Kim, Y.B.; Sharpe, A.H. Increased energy expenditure, decreased adiposity, and tissue-specific insulin sensitivity in protein-tyrosine phosphatase 1B-deficient mice. Mol. Cell. Biol. 2000, 20, 5479–5489. [Google Scholar] [CrossRef] [Green Version]
- Voirin, B.; Viricel, M.R.; Favre-Bonvin, J.; Van den Broucke, C.O.; Lemli, J. 5,6,4′-Trihydroxy-7,3′-dimethoxyflavone and other methoxylated flavonoids isolated from Thymus satureiodes. Planta Med. 1985, 51, 523–525. [Google Scholar] [CrossRef] [PubMed]
- Airoldi, C.; Sironi, E.; Dias, C.; Marcelo, F.; Martins, A.; Rauter, A.P.; Nicotra, F.; Jimenez-Barbero, J. Natural compounds against Alzheimer’s disease: Molecular recognition of Aβ1-42 peptide by Salvia sclareoides extract and its major component, rosmarinic acid, as investigated by NMR. Chem. Asian, J. 2013, 8, 596–602. [Google Scholar] [CrossRef] [PubMed]
- Bagci, E.; Kocak, A. Essential oil composition of the aerial parts of two Salvia, L. (S. multicaulis Vahl. Enum and S. tricochlada Bentham) species from east Anatolian region (Turkey). Int. J. Sci. Tech. 2008, 3, 13–18. [Google Scholar]
- Salehi, P.; Tolami, L.B.; Sefidkon, F. Essential oil composition of Salvia xanthocheila Boiss. ex Benth. from Iran. J. Essent. Oil Res. 2005, 17, 442–443. [Google Scholar] [CrossRef]
- Sonboli, A.; Babakhani, B.; Mehrabian, A.R. Antimicrobial activity of six constituents of the essential oil from Salvia. Z. Naturforsch. 2006, 61, 160–164. [Google Scholar] [CrossRef]
- Zhao, B.T.; Le, D.D.; Nguyen, P.H.; Ali, M.Y.; Choi, J.S.; Min, B.S.; Shin, H.M.; Rhee, H.I.; Woo, M.H. PTP1B, α glucosidase, and DPP-IV inhibitory effects for chromene derivatives from the leaves of Smilax china L. Chem. Biol. Interact. 2016, 253, 27–37. [Google Scholar] [CrossRef]
- Xu, J.; Wang, X.; Yue, J.; Sun, Y.; Zhang, X.; Zhao, Y. Polyphenols from a corn leaves (Quercus liaotungensis) protect pancreatic beta cells and their inhibitory activity against α-glucosidase and protein tyrosine phosphatase 1B. Molecules 2018, 23, 2167. [Google Scholar] [CrossRef] [Green Version]
- Ngoa, Y.L.; Lau, C.H.; Chua, L.S. Review on rosmarinic acid extraction, fractionation and its anti-diabetic potential. Food Chem. Toxicol. 2018, 121, 687–700. [Google Scholar] [CrossRef]
- Oh, J.; Choe, S.; Kim, D.W.; Lee, S.H.; Na, M.K. Rhododendric acid A, a new ursane-type PTP1B inhibitor from the endangered plant Rhododendron brachycarpum G. Don. Bioorg. Med. Chem. Lett. 2012, 22, 6116–6119. [Google Scholar]
- Al-Ishaq, R.K.; Abotaleb, M.; Kubatka, P.; Kajo, K.; Busselberg, D. Flavonoids and their anti-diabetic effects: Cellular mechanisms and effects to improve blood sugar levels. Biomolecules 2019, 9, 430. [Google Scholar] [CrossRef] [Green Version]
- Wiesmann, C.; Barr, J.J.; Kung, J.; Zhu, J.; Erlanson, D.A.; Shen, W.; Fahr, B.J.; Zhong, M.; Taylor, L.; Randal, M.; et al. Allosteric Inhibition of Protein Tyrosine Phosphatase 1B. Nat. Struct. Mol. Biol. 2004, 11, 730–737. [Google Scholar] [CrossRef] [PubMed]
- Shrestha, S.; Seong, S.H.; Park, S.G.; Min, B.S.; Jung, A.H.; Chi, J.S. Insight into the PTP1B inhibitory activity of arylbenzofurans: An in vitro and in silico study. Molecules 2019, 24, 2893. [Google Scholar] [CrossRef] [PubMed] [Green Version]
- Gohlke, H.; Klebe, G. Approaches to the description and prediction of the binding affinity of small-molecule ligands to macromolecular receptors. Angew. Chem. Int. Ed. Engl. 2002, 41, 2644–2676. [Google Scholar] [CrossRef]
- Ramírez, D.; Caballero, J. Is it reliable to take the molecular docking top scoring position as the best solution without considering available structural data? Molecules 2018, 23, 1038. [Google Scholar] [CrossRef] [PubMed] [Green Version]
- Zhang, X.-Y.; LI, W.; Wang, J.; Li, N.; Ccheng, M.S.; Koike, K. Protein tyrosine phosphatase 1B inhibitory activities of ursane-type triterpenes from Chinese raspberry, fruits of Rubus chingii. Chin. J. Nat. Med. 2019, 17, 15–21. [Google Scholar]
- Khan, T.; Lawrence, A.J.; Azad, I.; Raza, S.; Joshi, S.; Khan, A.R. Computational drug designing and prediction of important parameters using in silico methods- A review. Curr. Comput. Aided Drug. Des. 2019, 15, 384–397. [Google Scholar] [CrossRef]
- International Conference on Harmonization (ICH) Q2(R1): Validation of Analytical Procedures: Text and Methodology. In ICH: International Council for Harmonisation of Technical Requirements for Pharmaceuticals for Human Use. Geneva, Switzerland, 1 November 2005. Available online: http://academy.gmp-compliance.org/guidemgr/files/Q2(R1).pdf (accessed on 17 June 2020).
- Van den Dool, H.; Kratz, P.D. Generalization of the retention index system including linear temperature programmed Gas-Liquid partition Chromatography. J. Chromatogr. A. 1963, 11, 463–471. [Google Scholar] [CrossRef]
- Adams, R.P. Identification of Essential Oil Components by Gas Chromatography/Mass Spectrometry, 4th ed.; Allured Publishing Corporation: Carol Stream, IL, USA, 2007; pp. 1–804. [Google Scholar]
- Rangel-Grimaldo, M.; Macías-Rubalcava, M.L.; González-Andrade, M.; Raja, H.; Figueroa, M.; Mata, R. α-Glucosidase and protein tyrosine phosphatase 1B inhibitors from Malbranchea circinata. J. Nat. Prod. 2020, 83, 675–683. [Google Scholar] [CrossRef]
- Trott, O.; Olson, A.J. AutoDock Vina: Improving the speed and accuracy of docking with a new scoring function, efficient optimization, and multithreading. J Comput. Chem. 2010, 31, 455–461. [Google Scholar] [CrossRef] [Green Version]
- DeLano, W.L. Use of PYMOL as a communications tool for molecular science. Abstr. Pap. A.C.S. 2004, 228, U313–U314. [Google Scholar]
- Case, D.A.; Betz, R.M.; Cerutti, D.S.; Cheatham, T.E., III; Darden, T.A.; Duke, R.E.; Giese, T.J.; Gohlke, H.; Goetz, A.W.; Homeyer, N.; et al. AMBER. 2015. Available online: http://ambermd.org/doc12/Amber16.pdf (accessed on 31 July 2020).
- Case, D.A.; Cheatham, T.E., III; Darden, T.; Gohlke, H.; Luo, R.; Merz, K.M., Jr.; Onufriev, A.; Simmerling, C.; Wang, B.; Woods, R.J. The Amber biomolecular simulation programs. J. Comp. Chem. 2005, 26, 1668. [Google Scholar] [CrossRef] [PubMed] [Green Version]
- Walker, R.C.; Crowley, M.F.; Case, D.A. The implementation of a fast and accurate QM/MM potential method in Amber. J. Comp. Chem. 2008, 29, 1019. [Google Scholar] [CrossRef] [PubMed] [Green Version]
- Tian, C.; Kasavajhala, K.; Kellon, A.; Belfon, K.; Raguette, L.; Huang, H.; Migues, A.N.; Bickel, J.; Wang, Y.; Pincay, J.; et al. ff19SB: Amino-acid specific protein backbone parameters trained against quantum mechanics energy surfaces in solution. J. Chem. Theory Comput. 2020, 16, 528–552. [Google Scholar] [CrossRef] [PubMed]
- Salomon-Ferrer, R.; Gotz, A.W.; Poole, D.; Le Grand, S.; Walker, R.C. Routine microsecond molecular dynamics simulations with AMBER on GPUs. 2. Explicit solvent particle mesh Ewald. J. Chem. Theory Comput. 2013, 9, 3878–3888. [Google Scholar] [CrossRef] [PubMed]
- Roe, D.R.; Cheatham, T.E., III. PTRAJ and CPPTRAJ: Software for processing and analysis of molecular dynamics trajectory data. Cheatham. J. Chem. Theory Comput. 2013, 9, 3084–3095. [Google Scholar] [CrossRef] [PubMed]
- Bhal, S.K. LogP-making sense of the value; Advanced Chemistry Development, Inc. (ACD/LABS): Toronto, ON, Canada, 2007; pp. 1–4. [Google Scholar]
Sample Availability: Samples of the compounds are not available from the authors. |


| Position | δH a (J/Hz) | δC b |
|---|---|---|
| 1 | α: 1.35 dd (13.6, 3.2) | 26.3 |
| β: 1.81 brd (13.7) | ||
| 2 | 4.44–4.49 m | 70.0 |
| 3 | 6.66 d (6.4) | 131.1 |
| 4 | 143.0 | |
| 5 | 45.4 | |
| 6 | α: 1.72 td (12.7,3.3) | 33.8 |
| β: 1.22–1.26 m | ||
| 7 | α: 1.53–1.58 m β: 1.65−1.70 m | 27.6 |
| 8 | 1.65–1.70 m | 36.2 |
| 9 | 37.8 | |
| 10 | 2.21 d (15.1) | 40.5 |
| 11 | 1.59–1.64 m | 27.6 |
| 12 | α: 1.71–1.74 m | 33.8 |
| β: 1.53–1.64 m | ||
| 13 | 171.4 | |
| 14 | α: 5.90 brs β: 6.05 brs | 99.4 99.9 |
| 15 | 171.9 | |
| 16 | 5.96 brs | 116.1 |
| 17 | 0.80 d (6.5) | 15.9 |
| 18 | 169.2 | |
| 19a | 4.39 d (8.2) | 70.9 |
| 19b | 4.02 d (8.2) | |
| 20 | 0.57 s | 17.7 |
| 1′ | 4.31 d (7.7) | 102.8 |
| 2′ | 2.96–3.05 m | 74.1 |
| 3′ | 3.13–3.16 m | 77.2 |
| 4′ | 2.96–3.05 m | 70.7 |
| 5′ | 3.13–3.16 m | 77.4 |
| 6′ | α: 3.43–3.47 m β: 3.63–3.69 m | 61.6 |
| 14-OH | 7.75 brs | |
| 2′-OH | 4.92 brs | |
| 3′-OH | 4.92 brs | |
| 4′-OH | 4.92 brs | |
| 6′-OH | 3.33 s |
| Compound | CAS Number | Peak Area (%) | ||
|---|---|---|---|---|
| RI [a] | Sa-Batch 1 | Sa-Batch 2 | ||
| 3-Methoxy-p-cymene (9) | 1076-56-8 | 1219 | 4.40 | |
| (E)-Pinocarvyl acetate (10) | 1686-15-3 | 1313 | 5.98 | 2.10 |
| δ-Elemene (11) | 20307-84-0 | 1329 | 1.99 | |
| α-Bourbonene (12) | 5208-58-2 | 1378 | 4.24 | 4.11 |
| β-Caryophyllene (13) | 87-44-5 | 1413 | 15.05 | 21.27 |
| α-Caryophyllene (14) | 1139-30-6 | 1447 | 7.68 | 4.21 |
| Germacrene D (15) | 37839-63-7 | 1476 | 25.09 | 24.26 |
| β-Selinene (16) | 17066-67-0 | 1491 | 28.35 | 30.16 |
| Spathulenol (17) | 6750-60-3 | 1576 | 11.59 | 9.45 |
| Total peak area (%) | 99.97 | 99.96 | ||
| μg/mL ± SD | μM ± SD | |
|---|---|---|
| 1 | 137.9 ± 12.8 | 279.9 ± 26.0 |
| 2 | 62.5 ± 2.3 | 189.4 ± 7.0 |
| 3 | 24.2 ± 0.7 | 80.1 ± 2.2 |
| 4 | 197.3 ± 10.1 | 323.4 ± 16.6 |
| 5 | 49.4 ± 6.7 | 137.1 ± 18.7 |
| 6 | 120.7 ± 14.7 | 259.9 ± 31.7 |
| 7 | 19.6 ± 1.3 | 62.0 ± 4.1 |
| 8a,b | 269.7 ± 3.6 | 514.2 ± 6.8 |
| UA [a] | - | 28.1 ± 1.2 |
| Catalytic Site | Allosteric Site | |||||||
|---|---|---|---|---|---|---|---|---|
| Ki (μM) 1 | BE (kcal/mol) | RMSD (Å) 3 | Residues 2 | Ki (μM) 1 | BE (kcal/mol) | RMSD (Å) 3 | Residues 2 | |
| 1 | 0.55 | −8.5 | 2.89 | Tyr46, Asp48, Val49, Phe182, Gly183, Cys215, Ser216, Ala217, Gly220, Arg221, Gln262, Thr263 and Gln266 | 8.39 | −6.8 | 2.15 | Phe196, Lys197, Arg199, Glu200, Gly277, Phe280 and Ile281 |
| 7 | 9.94 | −6.8 | 2.73 | Tyr46, Asp48, Val49, Trp179, Asp181, Phe182, Gly183, Ala217, Ile219, Arg221, Gln262 and Gln 266 | 2.16 | −7.7 | 2.27 | Ala189, Leu192, Glu276, Gly277, Phe280, Phe196, Lys197 and Glu200 |
| UA | 2.56 | −7.6 | 1.35 | Phe182, Gly183, Cys215, Ala217, Gly218, Ile219, Gly220, Arg221, Gln262, Thr263 and Gln266 | 0.78 | −8.3 | 1.73 | Asn193, Phe196, Asp263, Phe280, Leu192 and Ile281 |
| Complex. | ∆Evdw | ∆Eele | ∆GGB | ∆GNP | ∆Gsolv | ∆Gbind |
|---|---|---|---|---|---|---|
| PTP-1B-UA 1 | −21.88 ± 0.44 | −20.02 ± 1.08 | 27.60 ± 1.63 | −41.91 ± 1.26 | 25.39 ± 1.04 | −16.51 ± 0.36 |
| PTP-1B-UA 2 | −28.67 ± 0.23 | −1.21 ± 0.46 | 10.89 ± 0.42 | −27.78 ± 0.48 | 7.73 ± 4.21 | −20.05 ± 0.21 |
| PTP-1B-1 | −36.22 ± 0.47 | −18.53 ± 0.77 | 41.62 ± 0.55 | −54.76 ± 1.00 | 36.84 ± 0.53 | −17.92 ± 0.61 |
| PTP-1B-7 | −35.95 ± 0.45 | −4.27 ± 0.31 | 12.90 ± 0.33 | −40.22 ± 0.55 | 9.06 ± 0.33 | −31.16 ± 0.46 |
| 1 | 7 | UA | |
|---|---|---|---|
| LogP | 1.01 | 1.92 | 6 |
| Solubility (LogS) | −3.48 | −2.58 | −6.11 |
| Molecular weight | 492.56 | 316.26 | 456.71 |
| Druglikeness | −2.96 | 1.8 | −3.66 |
| H bond acceptor | 9 | 7 | 3 |
| H bond donor | 4 | 4 | 2 |
| Nb stereocenters | 10 | 0 | 10 |
| Nb rotable bonds | 6 | 2 | 1 |
| Drug score | 0.40 | 0.52 | 0.26 |
© 2020 by the authors. Licensee MDPI, Basel, Switzerland. This article is an open access article distributed under the terms and conditions of the Creative Commons Attribution (CC BY) license (http://creativecommons.org/licenses/by/4.0/).
Share and Cite
Salinas-Arellano, E.; Pérez-Vásquez, A.; Rivero-Cruz, I.; Torres-Colin, R.; González-Andrade, M.; Rangel-Grimaldo, M.; Mata, R. Flavonoids and Terpenoids with PTP-1B Inhibitory Properties from the Infusion of Salvia amarissima Ortega. Molecules 2020, 25, 3530. https://doi.org/10.3390/molecules25153530
Salinas-Arellano E, Pérez-Vásquez A, Rivero-Cruz I, Torres-Colin R, González-Andrade M, Rangel-Grimaldo M, Mata R. Flavonoids and Terpenoids with PTP-1B Inhibitory Properties from the Infusion of Salvia amarissima Ortega. Molecules. 2020; 25(15):3530. https://doi.org/10.3390/molecules25153530
Chicago/Turabian StyleSalinas-Arellano, Eric, Araceli Pérez-Vásquez, Isabel Rivero-Cruz, Rafael Torres-Colin, Martín González-Andrade, Manuel Rangel-Grimaldo, and Rachel Mata. 2020. "Flavonoids and Terpenoids with PTP-1B Inhibitory Properties from the Infusion of Salvia amarissima Ortega" Molecules 25, no. 15: 3530. https://doi.org/10.3390/molecules25153530