Article

Phytochemical Composition and Antioxidant Activities of Two Different Color Chrysanthemum Flower Teas

Advanced Radiation Technology Institute, Korea Atomic Energy Research Institute, Jeongeup-si, Jeollabuk-do 56212, Korea
*
Author to whom correspondence should be addressed.
Molecules 2019, 24(2), 329; https://doi.org/10.3390/molecules24020329
Submission received: 26 December 2018 / Revised: 10 January 2019 / Accepted: 16 January 2019 / Published: 17 January 2019
(This article belongs to the Special Issue Tea Chemistry)

Abstract

:
Chrysanthemum morifolium Ramat is a perennial flowering plant widely cultivated for use in a tea infusion and as a popular beverage. To identify and evaluate the tea infusion made with a γ-irradiated mutant chrysanthemum cultivar with dark purple petals (cv. ARTI-Dark Chocolate), its phytochemical composition and antioxidant activity were tested and compared with those of the commercially available chrysanthemum cultivar with yellow petals (cv. Gamguk) by HPLC-DAD-ESIMS, as well as DPPH and ABTS radical scavenging assays. The purple chrysanthemum tea contained anthocyanins and linarin, which were not detected in the yellow chrysanthemum tea and the content of chlorogenic acid, acacetin-7-O-β-glucoside, and luteolin was higher compared with the yellow chrysanthemum tea. In contrast, the yellow chrysanthemum tea had higher luteolin-7-O-β-glucoside, 3,5-dicaffeoylquinic acid, apigenin-7-O-β-glucoside, and apigenin contents in comparison with the purple chrysanthemum tea. In addition, the content and antioxidant activity of the two chrysanthemum teas were investigated according to different water temperatures and infusing time. The yellow chrysanthemum tea did not show any significant differences according to infusing time and temperature, while the purple chrysanthemum tea was more influenced by the infusing time than water temperature, showing the highest total compound content in the infusing condition of 100 °C and 4 min. Moreover, the floral scent volatiles of the two chrysanthemum tea sources were analyzed using HS-SPME-GC-MS. In the DPPH radical scavenging assay, the purple chrysanthemum tea broadly showed greater antioxidant activity than did the yellow chrysanthemum tea, corresponding to the high content of anthocyanins known as the powerful antioxidant. Further, both chrysanthemum flower teas exhibited strong ABTS radical scavenging effects ranging from 76% to 61% under all infusing conditions. Therefore, the purple chrysanthemum cultivar, ARTI-Dark Chocolate, is worthy of breeding as a new tea cultivar.

1. Introduction

In Asia, chrysanthemum flower tea prepared from the flowers of Chrysanthemum morifolium Ramat. (Asteraceae) is a popular beverage due to its desirable taste and aroma. Further, it has reported health benefits as chrysanthemum flowers possess anti-inflammatory, anti-pyretic, sedative, anti-arthritic, and anti-hypertensive effects [1]. Chrysanthemum flowers have also been demonstrated to produce various types of flavonoids [2,3,4,5], phenolic acids [2,6,7,8], and lignans [9], which have exhibited diverse biological activities such as antioxidant [3,6], anti-inflammatory [4], antitumor [5], neuroprotective [7,9], and anti-allergic activities [10]. The properties and concentrations of such constituents are responsible for the functional characteristics of chrysanthemum and are important from a commercial point of view.
Although chrysanthemum flowers with yellow petals (e.g., Gamguk and Sanguk) are usually used for tea material and make the greatest contribution of an antioxidant and a coolant to the Korean herb tea market according to their frequency of consumption, there has been little research on the development of chrysanthemum tea using various colors of chrysanthemum flowers. Therefore, evaluation of new tea plants using active compound profiles that affect tea quality is an important method for new tea plant breeding and commercialization.
Recent γ-irradiated mutation breeding studies on chrysanthemum cultivars performed at the Advanced Radiation Technology Institute (Republic of Korea) resulted in the development of a chrysanthemum flower with dark purple petals (cv. ARTI-Dark Chocolate), which obtained a plant variety protection right (registration No. 4996) on April 15, 2014, through examination by the Korea Seed and Variety Service. In the present study, to identify and evaluate the two different color varieties, ARTI-Dark Chocolate (ADC) and Gamguk (GG), tea infusion samples were prepared according to different temperatures and times (Figure 1). The content and composition of bioactive compounds in the samples were analyzed using high performance liquid chromatography-diode array detector-electrospray ionization mass spectrometry (HPLC-DAD-ESIMS) and their antioxidant properties were tested using the 1,1-diphenyl-2-picryl-hydrazyl (DPPH) and 2,2-azino-bis-3-ethylbenzothiazoline-6-sulfonic acid (ABTS) radical scavenging assays. In addition, we performed headspace solid-phase microextraction coupled with gas chromatography-mass spectrometry (HS-SPME-GC-MS) to analyze the floral scent volatiles from the two different color varieties using dried flower materials in ADC and GG tea bags. The aim of our investigation was not only to identify the advantages of this new chrysanthemum cultivar as a tea ingredient, but also to provide a new viewpoint for its further application.

2. Results and Discussion

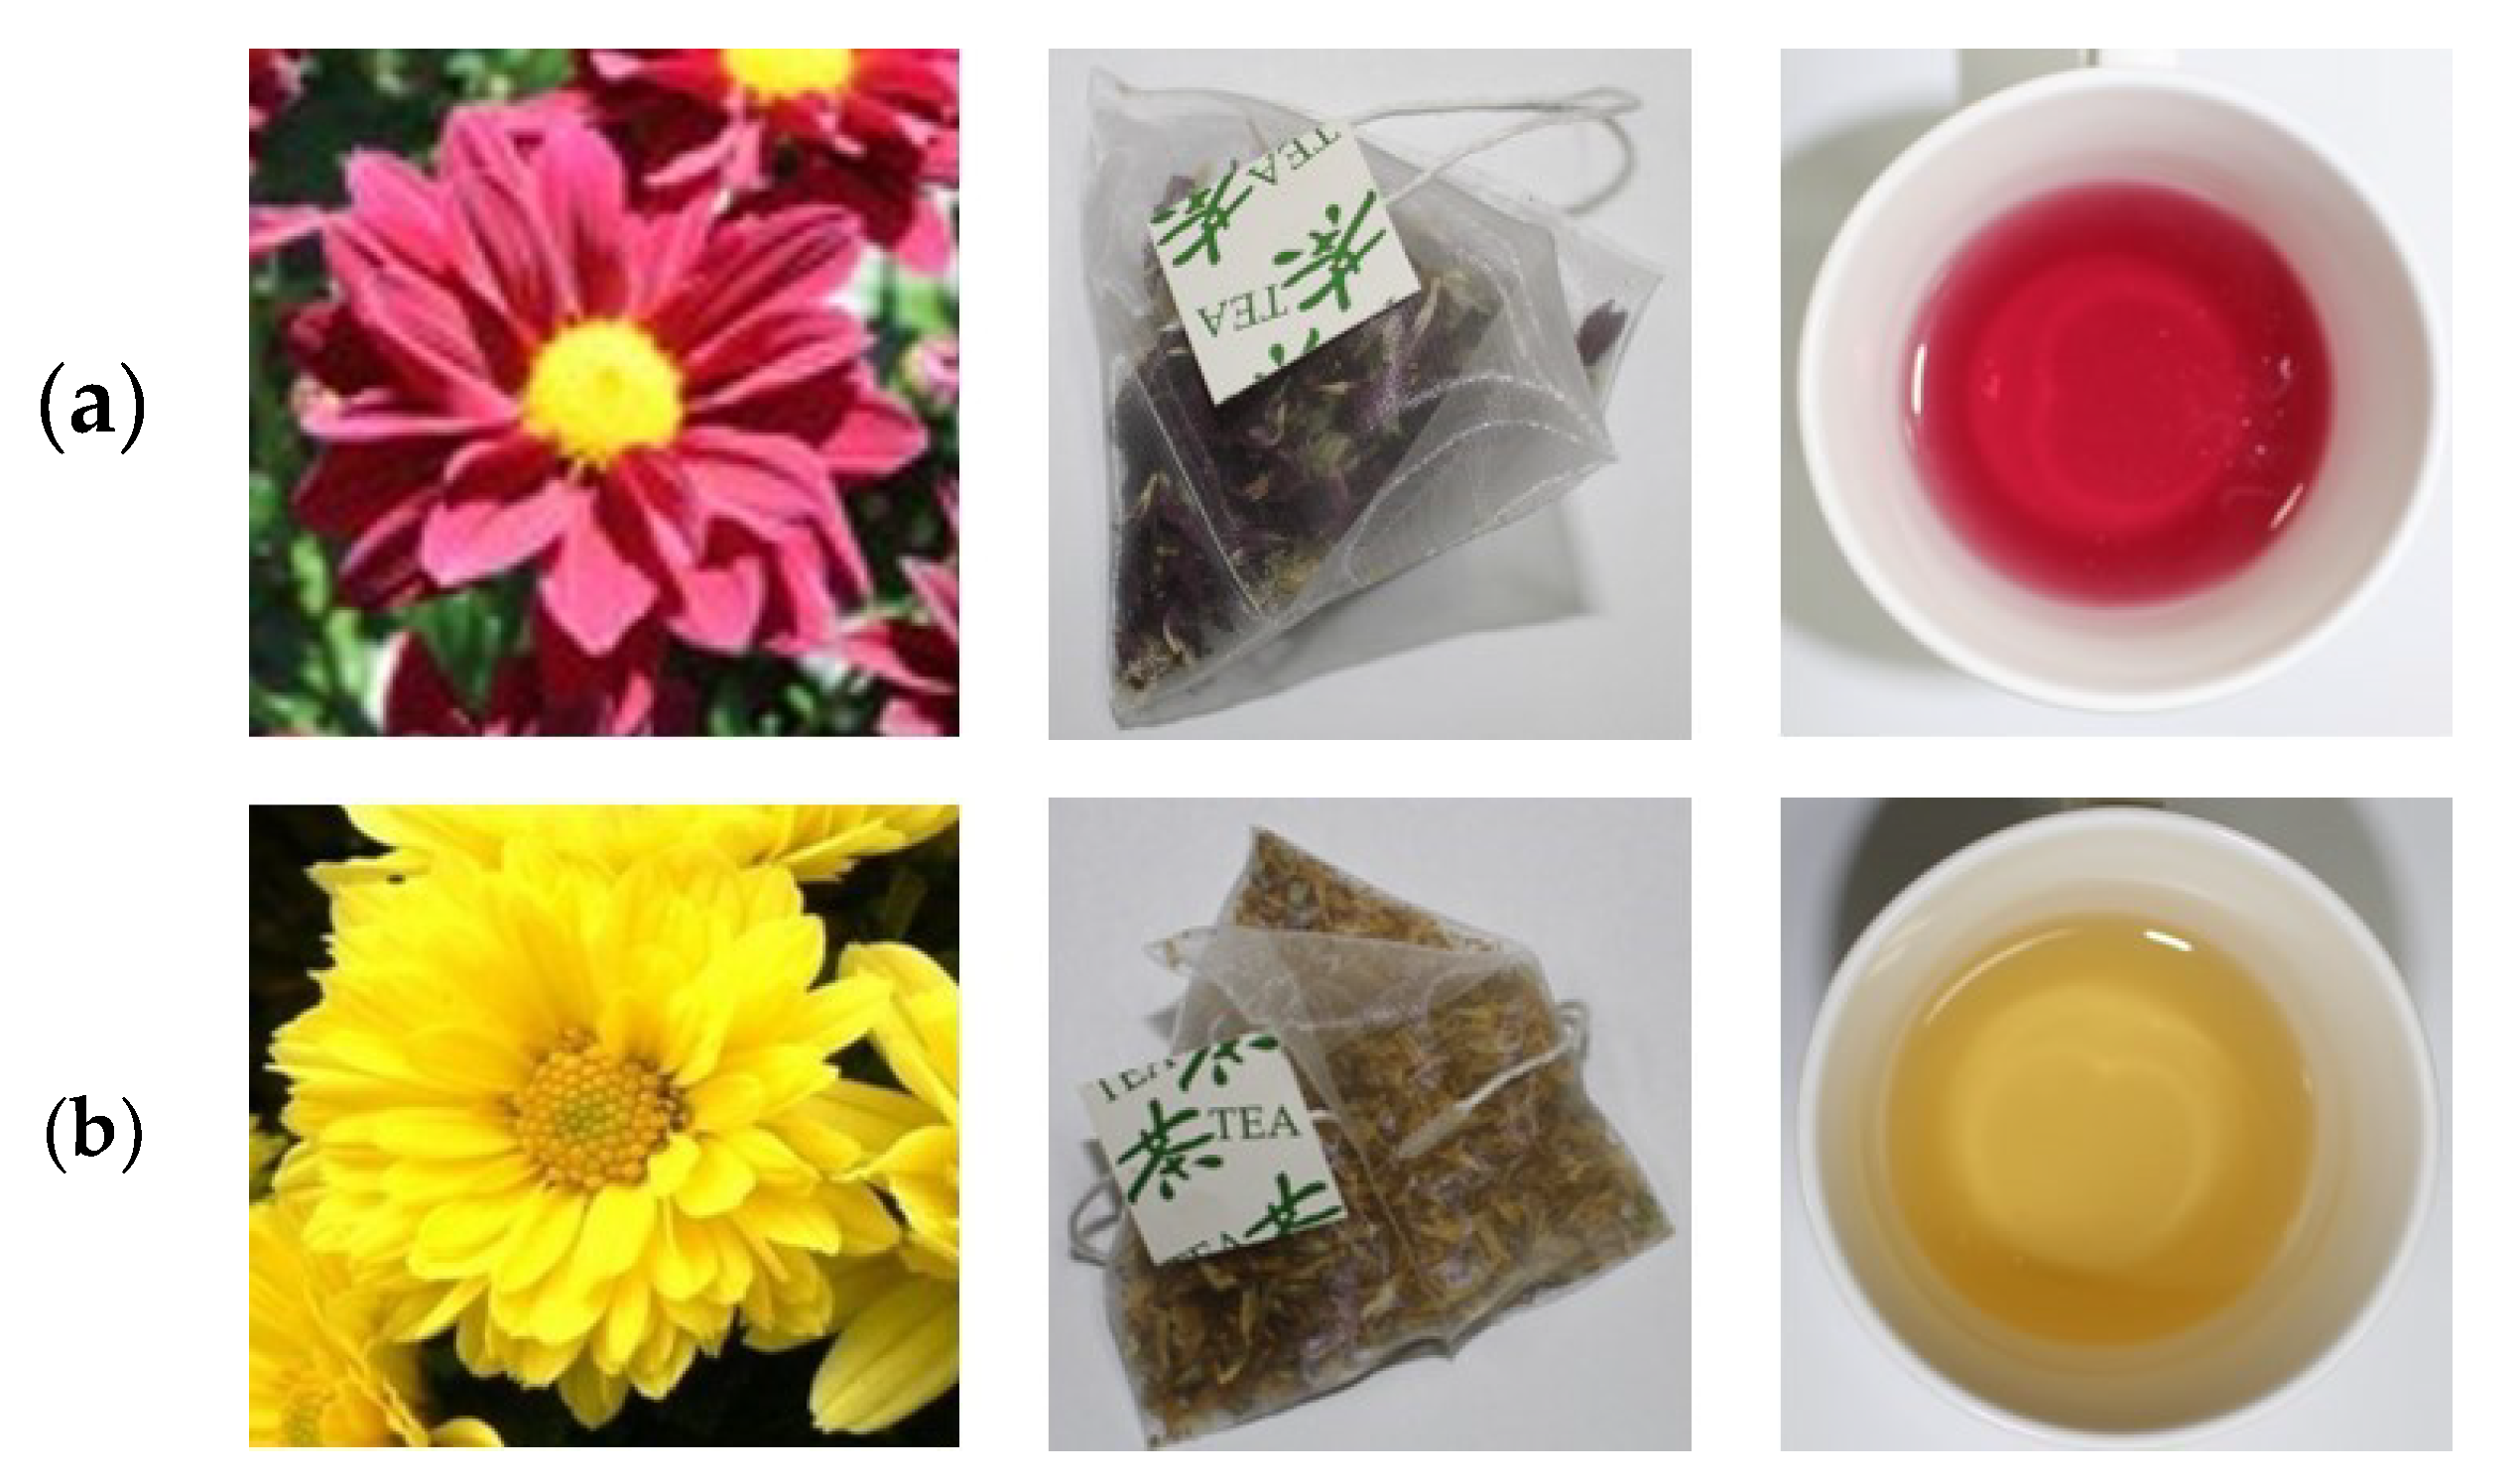
2.1. Identification of Phytochemical Components in Two Different Color Chrysanthemum Flower Teas

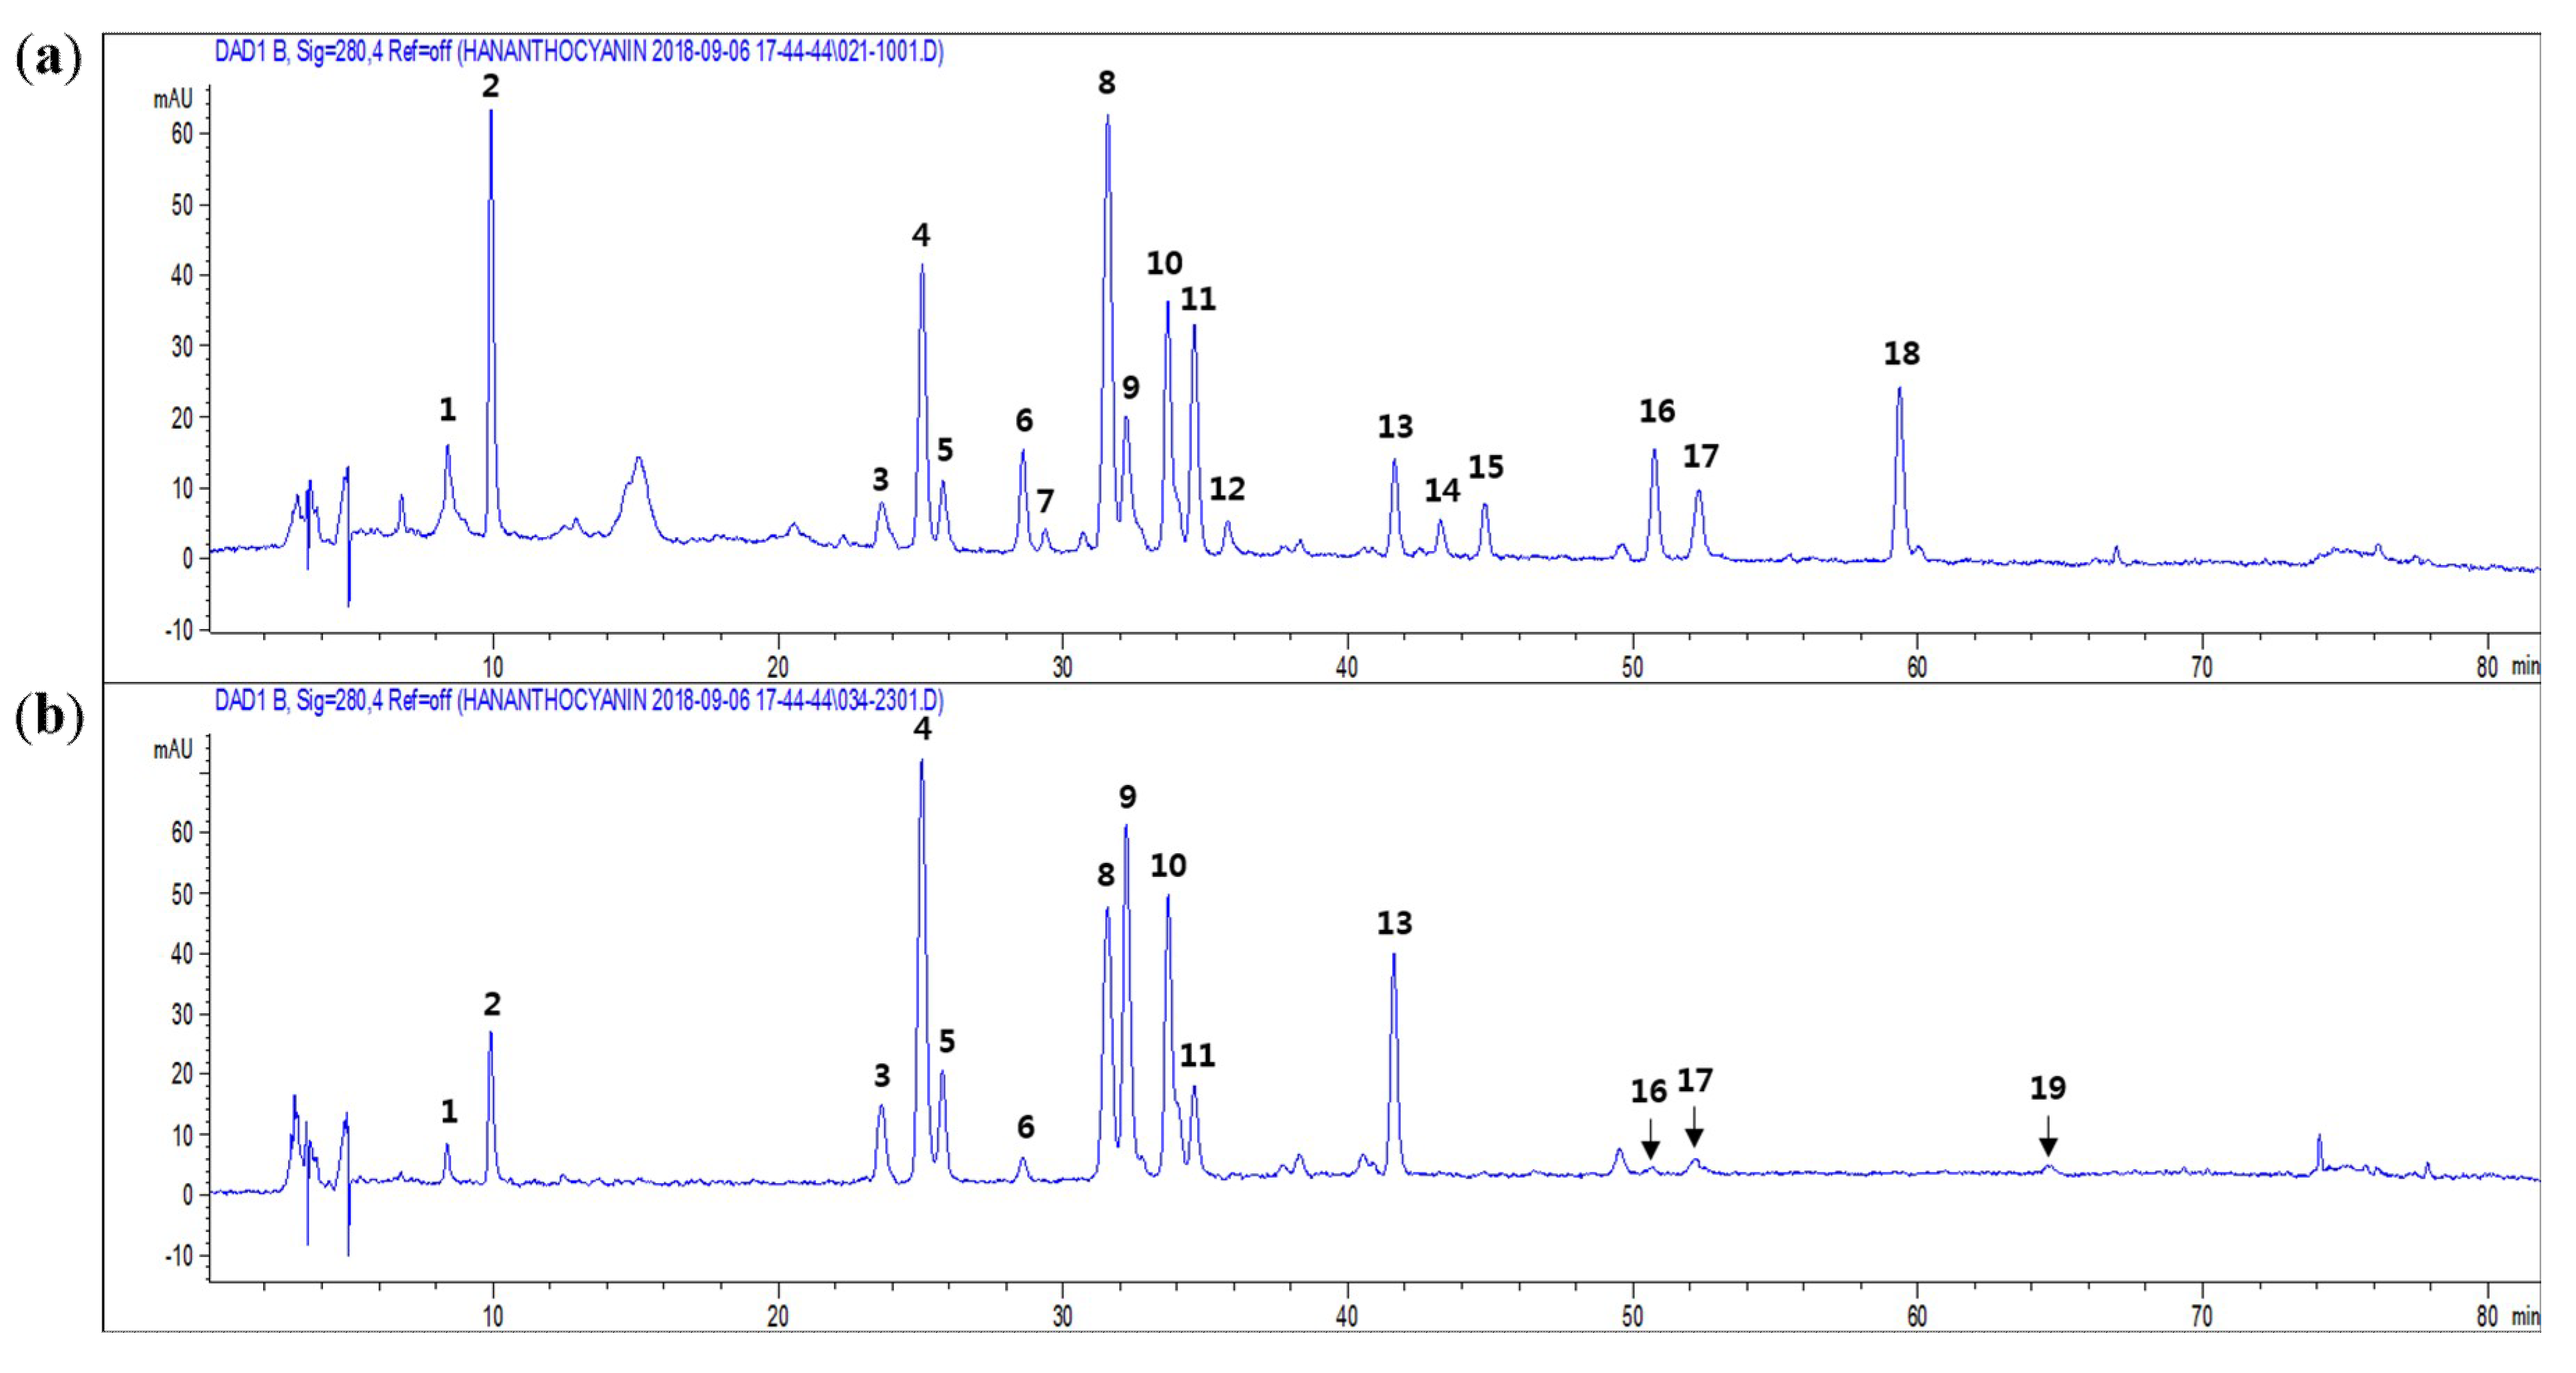
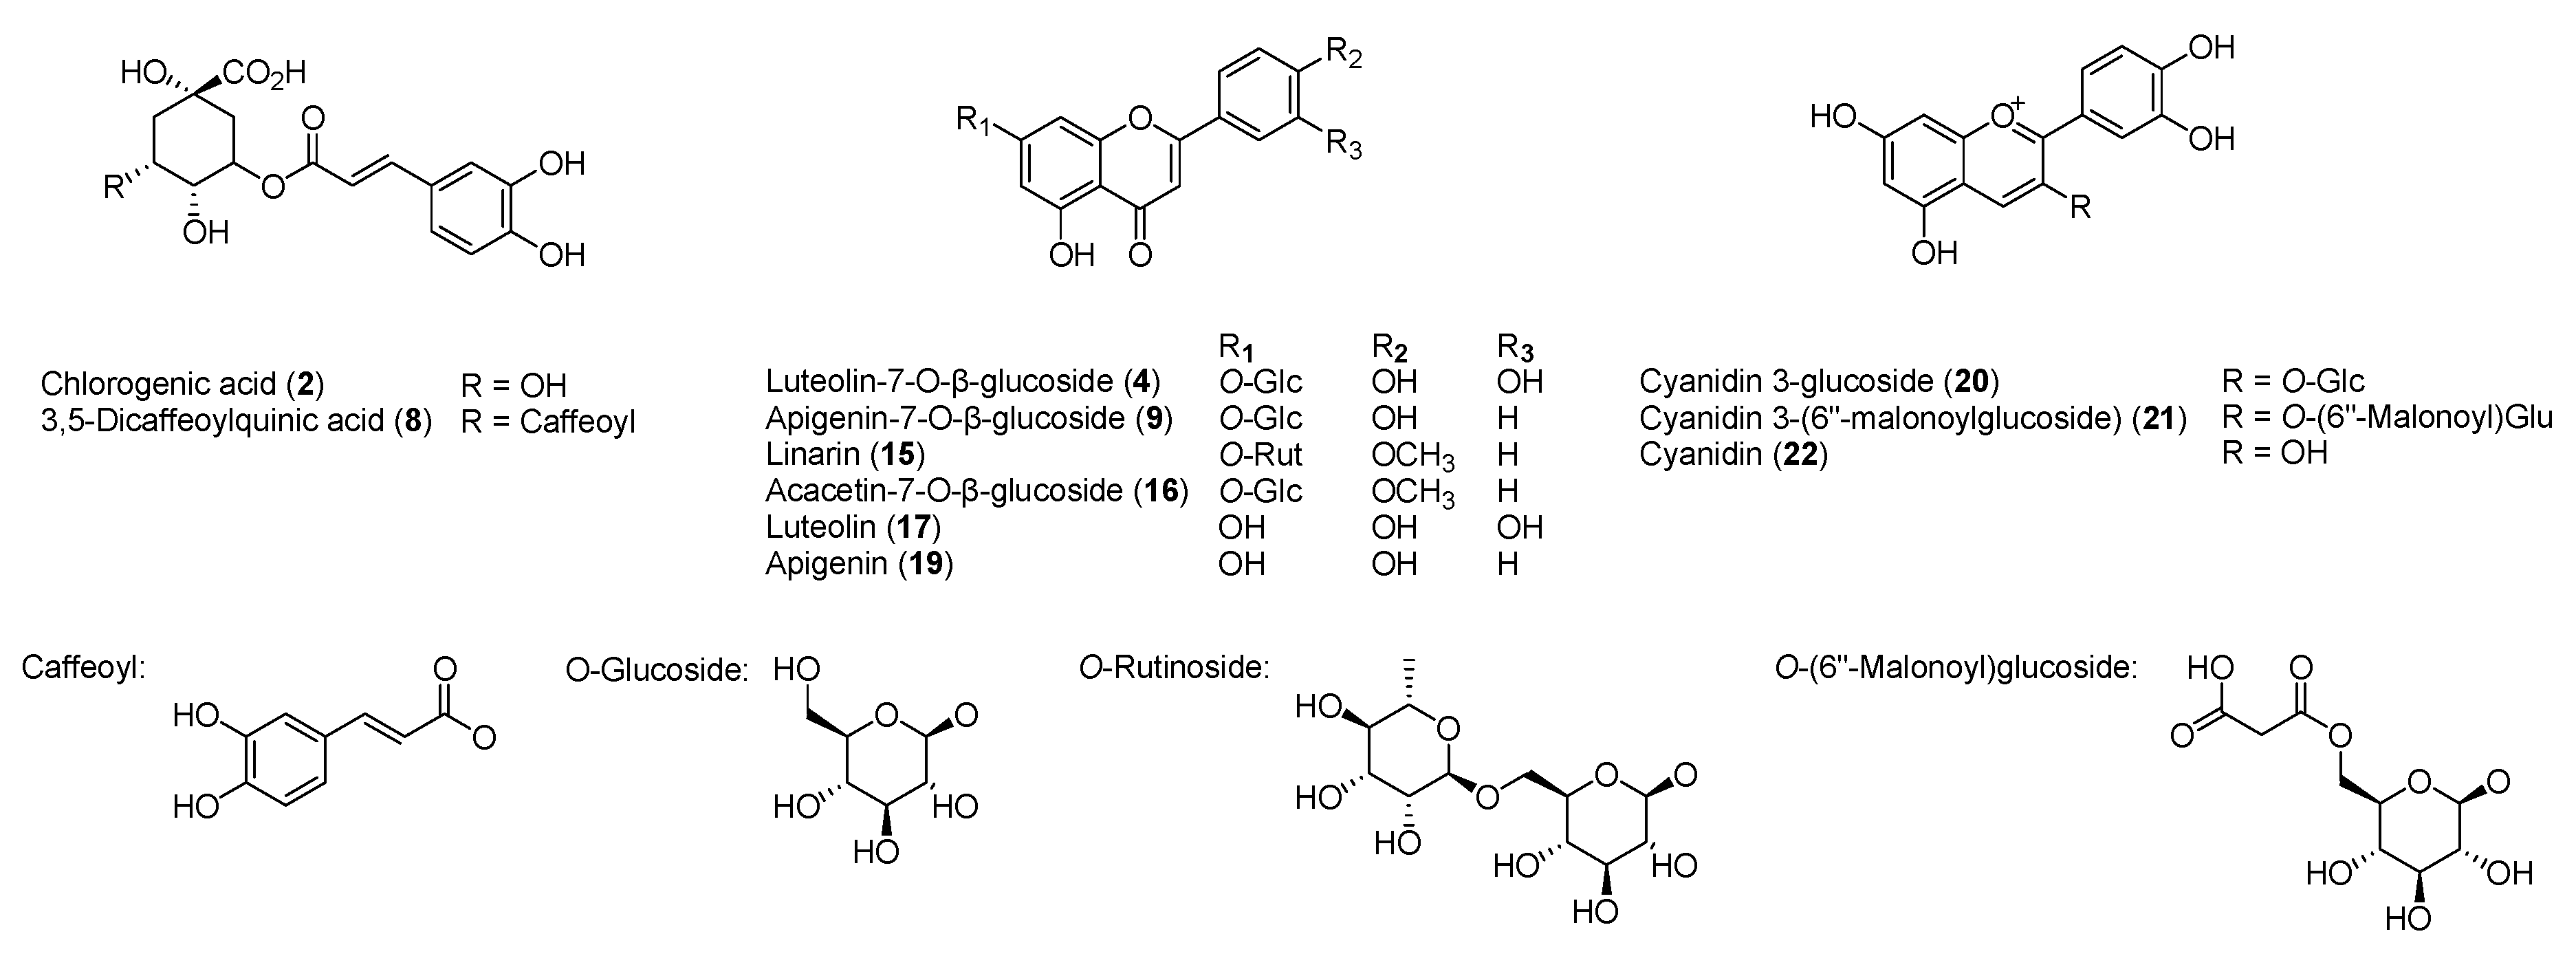
2.1.1. Flavonoids and Phenolic Acids
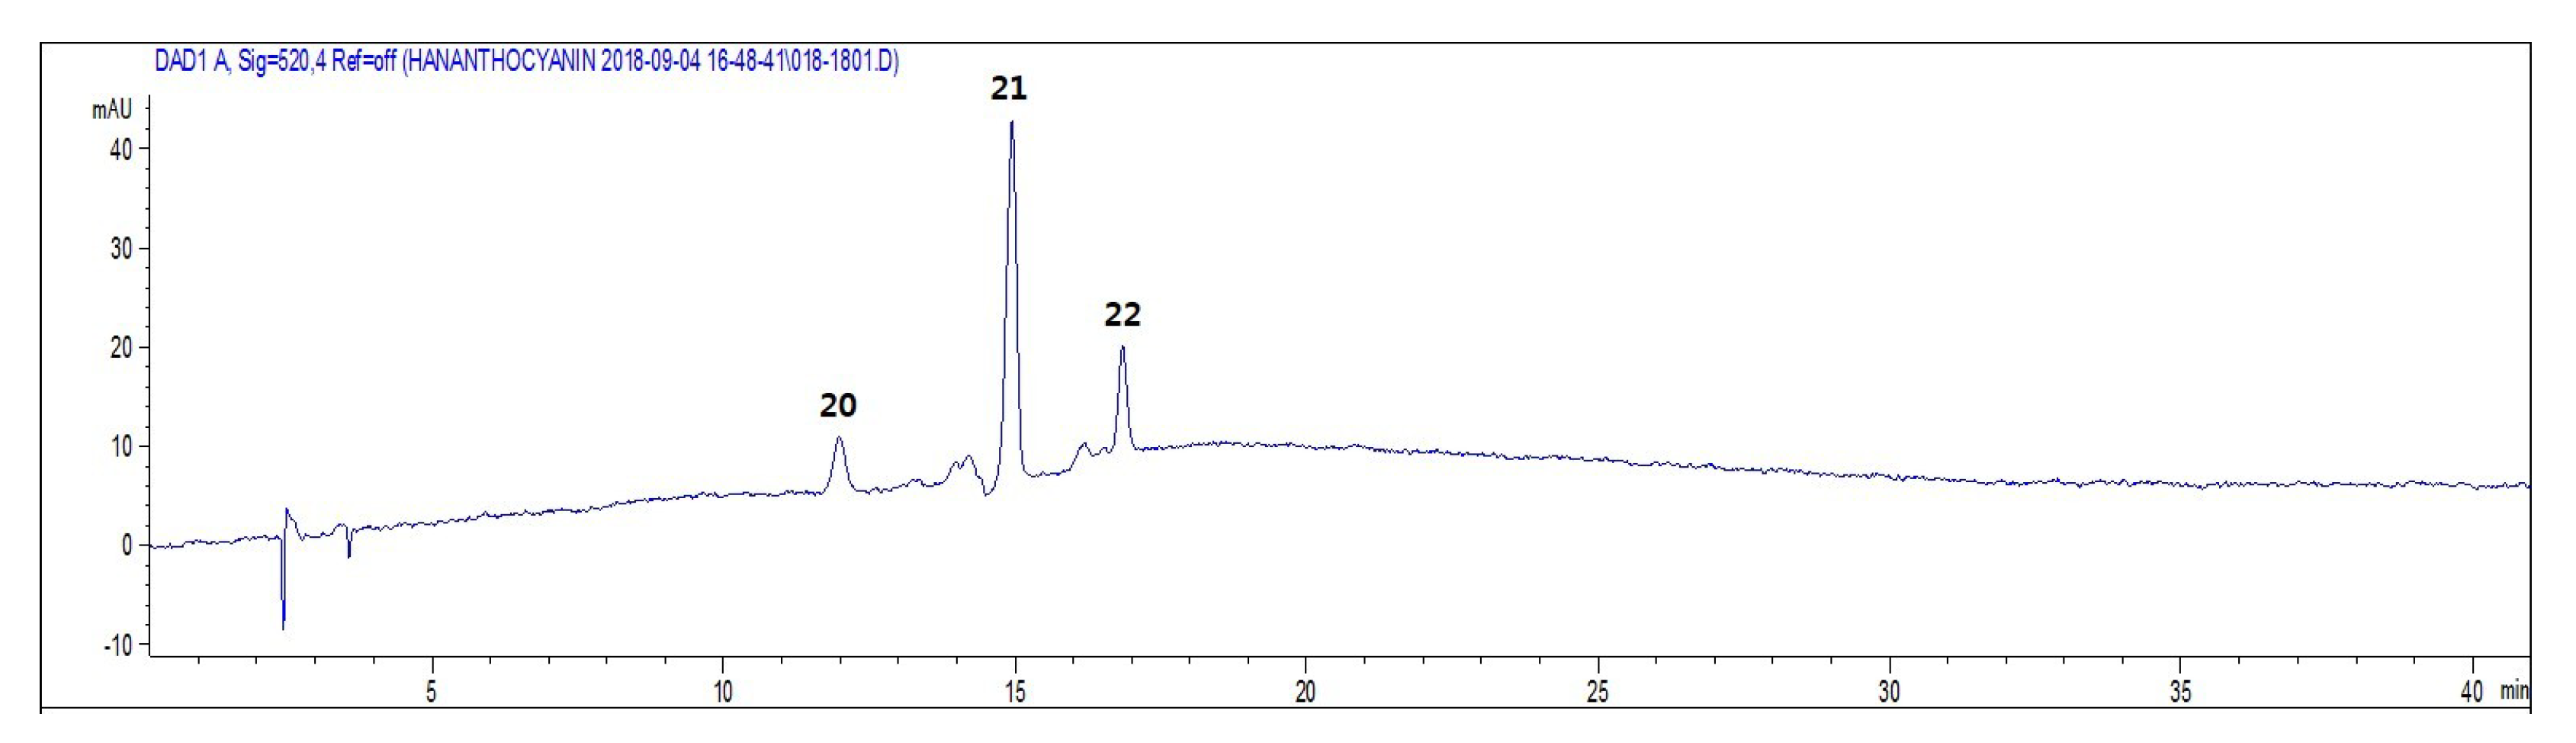
To characterize flavonoids and phenolic acids, the freeze-dried concentrates of infusions from two different color chrysanthemum flowers were subjected to HPLC-DAD-ESIMS analysis. Nineteen peaks were separated in the HPLC chromatograms (Figure 2). These peaks were characterized by typical UV absorptions obtained from the diode array detector, with the maximum absorptions at 250–270 and 330–350 nm for flavonoids and at 220 and 325 nm for phenolic acids (Table 1). Compounds corresponding to nine of the peaks were identified as chlorogenic acid (peak 2), luteolin-7-O-β-glucoside (peak 4), 3,5-dicaffeoylquinic acid (peak 8), apigenin-7-O-β-glucoside (peak 9), linarin (peak 17), acacetin-7-O-β-glucoside (peak 18), luteolin (peak 19), apigenin (peak 20), and acacetin (peak 22), by comparison of the retention time, UV spectra, and positive molecular ions with those of the compounds isolated or purchased in our previous study [11] (Table 1). The remaining peaks were unknown compounds and were tentatively identified by molecular ion and fragment ion assignment together with the characteristic UV absorption using published reports [2,8,9] (Table 1). Peaks 1, 3, 5, 10, 12, 13, 14, and 19 showed UV absorptions of flavonoids at 265–275 and 325–335 nm. Further, MS chromatograms exhibited a positive molecular ion at m/z 449 [M + H]+ for peak 1, a positive molecular ion at m/z 465 [M + H]+ for peak 3, a positive molecular ion at m/z 463 [M + H]+ for peak 5, a positive molecular ion at m/z 535 [M + H]+ for peak 10, a positive molecular ion at m/z 477 [M + H]+ for peak 12, a positive molecular ion at m/z 519 [M + H]+ for peak 13, a positive molecular ion at m/z 549 [M + H]+ for peak 14, and a positive molecular ion at m/z 533 [M + H]+ for peak 18, suggesting that they were luteolin-glucoside (peak 1), quercetin-glucoside (peak 3), luteolin-glucuronide (peak 5), luteolin-malonylglucoside (peak 10), diosmetin-glucuronide (peak 12), apigenin-malonylglucoside (peak 13), diosmetin-malonyglucoside (peak 14), and acacetin-malonylglucoside (peak 18). Peaks 6 and 11 had UV absorptions at 220–225 and 325 nm and a positive molecular ion at m/z 517 [M + H]+ and a fragment ion at m/z 499 (loss of H2O group 18 mass unit) and 163 (loss of chlorogenic acid group 354 mass unit), suggesting dicaffeoylquinic acid (peaks 6 and 10). However, the substituted positions and configuration of dicaffeoyl groups could not be determined by UV and MS spectral data analysis. UV maxima absorptions at these wavelengths of such flavonoids and phenolic acids were not observed in peak 7 but its mass spectra showed positive molecular ions at m/z 551 [M + H]+ and a fragment ion at m/z 295. A significant difference in the HPLC-DAD profiles between the two different color chrysanthemum flower teas is that peaks 7, 12, 14, and 15 were clearly detected in the purple chrysanthemum flower tea, but not in the yellow chrysanthemum flower tea. In contrast, the LC chromatogram of the yellow flower tea showed a clear detection of apigenin (peak 19), which was not detected in the purple flower tea.

2.1.2. Anthocyanins

Identification of anthocyanins was made based on comparison of retention times and UV/Vis and mass spectra for either authentic standards (Figure 3 and Table 2). The anthocyanin peaks were characterized by typical UV absorptions at 520 nm and corresponded to cyanidin-3-O-glucoside (peak 20), cyanidin 3-O-(6″-malonylglucoside) (peak 21), and cyanidin (peak 22) by retention time. Their MS chromatograms also exhibited a positive molecular ion at m/z 449 [M + H]+ for peak 20, m/z 535 [M + H]+ for peak 21, and m/z 287 [M + H]+ for peak 22. These cyanidin 3-O-glucoside, cyanidin 3-O-(6″-malonylglucoside), and cyanidin peaks were clearly detected in the purple chrysanthemum flower tea LC chromatograms, but not in those of the yellow chrysanthemum flower tea.

2.2. Quantitative Analysis of Phytochemical Components in Two Different Color Chrysanthemum Flower Teas

Using the HPLC-DAD method, quantification of the two phenolic acids, six flavonoids, and three anthocyanins that were identified from infusions of two different color chrysanthemum flowers through comparison with standards (Figure 4) was performed.
The compound number was given the same as the peak number shown in Table 1 and Table 2 and Figure 2 and Figure 3. The detection wavelength for quantification of these compounds was chosen as 280 nm for the phenolic acids and flavonoids and 520 nm for the anthocyanins by comparison of the sample solution chromatograms at different wavelengths. Good linear calibration curves were obtained with the 11 tested standard compounds (Table 3).
Owing to the unsatisfactory separation of the 1,4-, 1,5-, and 3,5-dicaffeoylquinic acids, their total content was calculated by calibration of 3,5-dicaffeoylquinic acid. The contents of 11 compounds in infusions of two different color chrysanthemum flowers with different infusion conditions were summarized in Table 4. The ADC flower infusions had higher contents of chlorogenic acid (1), linarin (5), acacetin-7-O-β-glucoside (6), and luteolin (7) than the GG flower infusions, while the contents of luteolin-7-O-β-glucoside (2), 3,5-dicaffeoylquinic acid (3), apigenin-7-O-β-glucoside (4), and apigenin (8) were higher in the GG flower infusions. Compared with the total amount of phenolic acids and flavonoids, the ADC flower infusions had their contents ranging from 16 to 39 mg/g, while the GG flower infusions contained larger amounts ranging from 32 to 41 mg/g. Anthocyanins, cyanidin-3-O-glucoside (9), cyanidin 3-O-(6″-malonylglucoside) (10), and cyanidin (11), which were not contained in the GG flower infusions were present in the ADC flower infusions at a total content of 2–12 mg/g. Thus, it is considered that anthocyanins were extracted from the ADC flowers instead of phenolic acids and flavonoids relatively, inferred from the color of the ADC flowers.
To identify for the optimum infusing condition to extract the bioactive compounds, two chrysanthemum flowers were infused at different temperatures and times. The comparison of the amount of extracted compounds according to the infusing temperature-time relation is summarized in Table 4. In the ADC flower tea infusions, the content of compounds, apart from 4, 21, and 22, increased slightly when the infusing time increased from 2 min to 4 min at 75 °C, and the contents of 4, 21, and 22 increased about 1.2, 3, and 2 times, respectively. At 100 °C, all compound contents almost doubled as the infusing time increased. When the infusing time was equal to 2 min and the infusing temperature increased from 75 °C to 100 °C, the contents of all compounds tended to be almost the same or slightly decreased. When infused for 4 min, the contents of all compounds increased almost twice or more than two times as the infusing temperature increased. Unlike the ADC flower tea, the GG flower tea showed no significant variation in the content of compounds according to the infusing temperature and time, although the total phenolic acid and flavonoid contents were higher than those of the ADC flower tea. However, when infused at 100 °C for 4 min, the ADC flower tea contained a higher amount of total phenolic acids compared with the GG flower tea. Comprehensively, when infused at 75 °C for 2 min and 4 min and at 100 °C for 2 min, the active compound contents extracted from the GG flower tea were higher than those of the ADC flower tea including the total anthocyanin content detected only in the ADC flower tea. When infused at 100 °C for 4 min, large amounts of anthocyanins and phenolic compounds were extracted from the ADC flower tea, thus its total compound content was higher than that of the GG flower tea. The GG flower tea did not show any significant differences according to infusing time and temperature, while the ADC flower tea was influenced by the infusing time rather than water temperature, showing the highest total compound content in the infusing condition of 100 °C and 4 min.

2.3. Antioxidant Activities of Two Different Color Chrysanthemum Flower Teas

The two different color chrysanthemum flower teas were evaluated for their antioxidant activity using the ATBS and DPPH radical scavenging assays. As shown in Table 5, the purple chrysanthemum cultivar ADC flower tea showed higher DPPH radical scavenging activity than did the yellow chrysanthemum cultivar GG flower tea and its infusion at 100 °C for 4 min had greater activity than that of a positive control, ascorbic acid. In the ATBS radical scavenging test results, the two chrysanthemum flower teas exhibited strong inhibitory effects ranging from 61% to 76% under all infusing conditions.

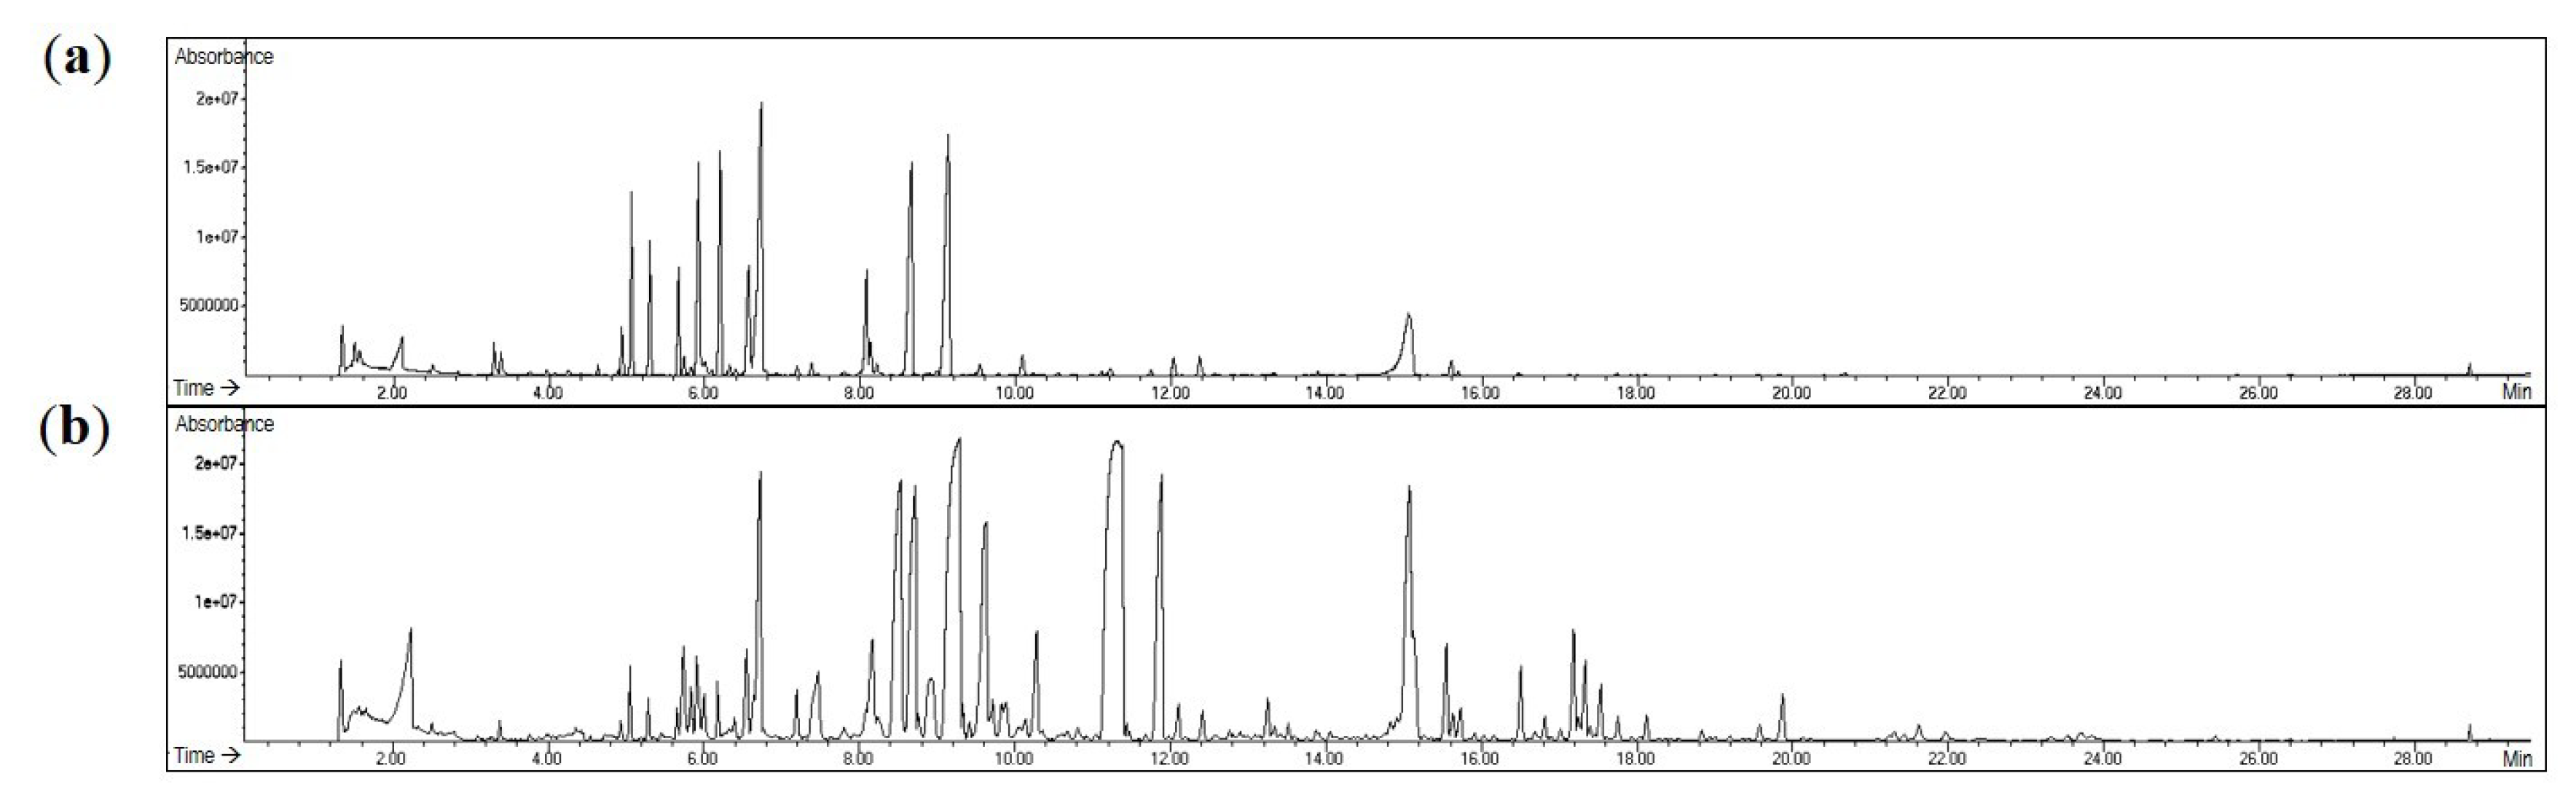
2.4. Identification of Floral Scent in Two Different Color Chrysanthemum Flower Tea Bags

Floral scent volatiles in the dried flower materials of ADC and GG tea bags were extracted by headspace solid-phase microextraction (HS-SPME) and identified by gas chromatography-mass spectrometry (GC-MS) (Figure 5). HS-SPME allows for simple and rapid extraction of volatile compounds and a high reproducibility under the same conditions. The volatile compounds were affected by sample weight, different temperatures, type of extraction fibers, extraction time, and balance periods. By referring to several previous studies on the analysis of the volatile compounds in chrysanthemum flowers [12,13,14], we performed HS-SPME-GC-MS experiments by modifying their conditions (see Section 3.5). The relative contents of volatile compounds were detected by % of total area (Table 6). A total of 29 compounds were identified from ADC tea material, which accounted for 82.74% of total volatile compounds. The components with the highest contents were as follows: eucalyptol (16.25%), (+)-2-bornanone (14.33%), chrysanthenone (11.34%), β-myrcene (7.44%), and α-phellandrene (6.65%). In the GC-MS analysis of GG tea material, 49 compounds were identified, which accounted for 74.93% of total latile compounds. The components with the highest contents were as follows: Trans-verbenyl acetate (16.24%), (+)-2-bornanone (12.28%), β-elemene (7.02%), pseudo-cyclocitral (6.22%), and chrysanthnone (5.49%). The proposed HS-SPME-GC-MS can be considered at least as an alternative scenery quality assessment tool for the aroma evaluation of chrysanthemum tea materials.

3. Materials and Methods

3.1. General Procedures

Analytical HPLC-DAD-ESIMS was carried out on an Agilent 1200 series system and an Agilent 6120 quadrupole MS system (Agilent Technologies Co., Santa Clara, CA, USA) equipped with a YMC-Triart C18 column (5 μm, 250 mm × 4.6 mm, YMC Co., Tokoy, Japan). A [60Co] γ-irradiator (150 TBq capacity; ACEL, MDS Nordion, ON, Canada) was used for γ-irradiation. Standards of anthocyanins (cyanidin chloride and cyanidin 3-O-glucoside chloride) were purchased from Sigma (St Louis, MO, USA). Cyanidin 3-O-(6″-malonylglucoside) was obtained from Cfm Oskar Tropitzsch GmbH (Marktredwitz, Germany). Chlorogenic acid and 1,4-dicaffeoylquinic acid were purchased from Wuhan ChemFaces Biochemical Co., Ltd. (Wuhan, Hubei, China). 1,5- and 3,5- dicaffeoylquinic acid were obtained from Chengdu Biopurify Phytochemicals Ltd. (Chengdu, China). Flavonoids (apigenin, acacetin, luteolin, apigenin-7-O-glucoside, acacetin-7-O-glucoside, luteolin-7-O-glucoside, linarin) were isolated from the flowers of C. morifolium cv. ARTI-Dark Chocolate in our previous study [11]. 2,2-Diphenyl-1-picrylhydrazyl (DPPH), 2,20-azino-bis(3-ethylbenzthiazoline-6-sulphonic acid) (ABTS), and ascorbic acid were obtained from Sigma Chemical Co. (St. Louis, MO, USA). Dulbecco’s Modified Eagle’s Medium (DMEM) and fetal bovine serum (FBS) were purchased from Hyclone (Logan, UT, USA). All other chemicals and solvents used in this study were of analytical grade.

3.2. Plant Materials

A purple chrysanthemum flower with single dark purple petals (cv. ARTI-Dark Chocolate; ADC) was developed by γ-irradiation (50 Gy) from a 60Co source on stem cuttings of the Noble Wine cultivar with single white petals with purple stripes, followed by selection of petal-color variants and examination of stable phenotype inheritance for 4 years (2009–2012) at the Advanced Radiation Technology Institute, an affiliated institute of the Korea Atomic Energy Research Institute. Fully-open flowers, including the calyxes, were harvested on 25 August 2017. Commercially-marketed yellow chrysanthemum flower tea bags in Korea are produced using the Gamguk cultivar (GG) with all-doubled or single yellow petals. And it is the progenies of natural hybrids of C. morifolium. The two different chrysanthemum flowers were dried using a cold air drying method (air conditioned at a temperature of 15 °C and relative humidity of 20%). Dried chrysanthemum flowers of ADC and GG weighing approximately 1 g each were randomly selected and then made into tea bag pouches.

3.3. Preparation of Sample and Standard Solutions

Each chrysanthemum flower tea bag (1 g) was infused in 100 mL of distilled water at different temperatures and times. Distilled water was heated at 75 (the temperature of the water purifier) and 100 °C and each tea sample was brewed for 2 and 4 min. Each tea sample was prepared in triplicate. The infusions were evaporated in vacuo and freeze-died to afford dryness to each (ADC1 (75 °C, 2 min), 105.2 mg, w/w 10.52%; ADC2 (75 °C, 2 min), 100.6 mg, w/w 10.06%; ADC3 (75 °C, 2 min), 123.3 mg, w/w 12.33%; ADC1 (75 °C, 4 min), 134.6 mg, w/w 13.46%; ADC2 (75 °C, 4 min), 111.2 mg, w/w 11.12%; ADC3 (75 °C, 4 min), 124.1 mg, w/w 12.41%; ADC1 (100 °C, 2 min), 89.0 mg, w/w 8.9%; ADC2 (100 °C, 2 min), 108.9 mg, w/w 10.89%; ADC3 (100 °C, 2 min), 110.0 mg, w/w 11%; ADC1 (100 °C, 4 min), 191.1 mg, w/w 19.11%; ADC2 (100 °C, 4 min), 175.5 mg, w/w 17.55%; ADC3 (100 °C, 4 min), 140.8 mg, w/w 14.08%; GG1 (75 °C, 2 min), 187.5 mg, w/w 18.75%; GG2 (75 °C, 2 min), 270.5 mg, w/w 27.05%; GG3 (75 °C, 2 min), 148.7 mg, w/w 14.87%; GG1 (75 °C, 4 min), 205.6 mg, w/w 20.56%; GG2 (75 °C, 4 min), 217.3 mg, w/w 21.73%; GG3 (75 °C, 4 min), 208.7 mg, w/w 20.87%; GG1 (100 °C, 2 min), 177.0 mg, w/w 17.7%; GG2 (100 °C, 2 min), 166.3 mg, w/w 16.63%; GG3 (100 °C, 2 min), 164.8 mg, w/w 16.48%; GG1 (100 °C, 4 min), 180.5 mg, w/w 18.05%; GG2 (100 °C, 4 min), 210.5 mg, w/w 21.05%; GG3 (100 °C, 4 min), 222.6 mg, w/w 22.26%). All samples were weighed accurately and dissolved in 50% MeOH at 2 mg/mL. The sample solution was filtered through a syringe filter (0.45 μm) for LC-MS analysis. The standards were weighed accurately and dissolved in MeOH at 1.0 mg/mL. The stock solutions were diluted to yield a series of standard solutions at different concentrations for quantitative analysis.

3.4. Analysis of Chemical Composition Using HPLC-DAD-ESIMS

Analysis of the chemical composition of the samples was conducted using the Agilent 1200 series LC system coupled on-line with an Agilent 6120 quadrupole single mass spectrometer detector. Data acquisition and processing were performed using the ChemStation software, with an YMC-Triart C18 column (5 μm, 250 mm × 4.6 mm, YMC Co.). Binary gradient elution with 0.1% formic acid in water (v/v, solvent A) and 0.1% formic acid in acetonitrile (v/v, solvent B) was performed as follows: 0–60 min, 15–35% B; 60–70 min, 35–60% B; 70–71 min, 60–95% B; 71–80 min, 95% B; 80–81 min, 95–15% B; 81–90 min, 15% B. The total flow rate was maintained at 0.8 mL/min and the injection volume was 10 μL. Chromatograms were acquired at 265, 280, 330, and 360 nm by the DAD detector. Mass spectra were measured between m/z 100 and 1000 in positive ionization mode (ESI+) at a scan rate of 1.06 s/cycle and monitored by a diode array detector. The mass spectrometric conditions were as follows: capillary voltage = 4000 V; drying gas flow = 10 L/min (N2); nebulizer pressure = 30 psig; drying gas temperature = 350 °C.

3.5. Analysis of Floral Scent Using HP-SPME-GC-MS

A 50/30 μm divinylbenzene/carboxen/polydimethylsiloxane coated SPME fiber (Supelco Inc., Bellefonte, PA, USA) attached to a multipurpose SPME autosampler (MPS 2, Gerstel, Mühlheim, Germany) was used to extract floral volatiles. The SPME fiber was conditioned at 250 °C for 5 min before use and also between the analyses. A sample (1 g) was placed in a headspace vial (22.5 × 75 mm, PTFE/silicone septum, screwed aluminum cap). The tightly capped vial was stirred for 20 min in a thermostatic bath (50 °C) and fibers were exposed to the headspace of the vial for 20 min. Then SPME fibers were injected into the port of a GC-MS system (Agilent GC 6890, Agilent Technologies Inc., Palo Alto, CA, USA) coupled to a mass-selective detector (Agilent GC 6890), and retained for thermal desorption at 250 °C for 2 min. A HP-5MS capillary column (30 m × 0.25 mm, 0.25 μm film thickness, Agilent Technologies Co., Santa Clara, CA, USA.) was used with an oven temperature programmed at 40 °C for 1 min, increased to 80 °C at a rate of 20 °C /min, then to 60 °C at 5 °C /min, then to 270 °C at 20 °C /min, and held at 270 °C for 1 min. Helium was used as a carrier gas at a flow rate of 1 mL/min. The MS interface temperature was set at 250 °C, the ion source temperature was 230 °C, the MS quadrupole temperature was 150 °C, and the transfer line temperature was 280 °C. The peaks in the chromatogram were tentatively identified based on comparisons with those in the Wiley 7 NIST 0.5 Library mass spectral search program, version 5.0 (National Institute of Standards and Technology, Gaithersburg, MD, USA).

3.6. Evaluation of DPPH Free Radical Scavenging and ABTS Radical Cation Scavenging Activities

The DPPH of each sample was determined by Brand-Williams’s method [15]. Briefly, each sample was suspended in distilled water and 40 μL of the sample was reacted with 160 μL of 0.2 mM DPPH solution. Absorbance measurements were taken 6 min after the reaction at 517 nm using a Benchmark Plus ELISA reader (Bio-Rad, Hercules, CA, USA). The ABTS of each sample was evaluated using the method published by Re et al. [16]. In brief, the ABTS was measured by pre-formed radical monocation. The mixtures, along with 7.4 mM ABTS solution and 2.6 mM potassium persulfate, were incubated at room temperature in the dark for 24 h. The ABTS solution was diluted with phosphate-buffered saline (pH 7.4) to achieve an absorbance of 0.7 ± 0.02 at 734 nm. Each sample was suspended in distilled water and 40 μL of the sample was reacted with 160 μL of the ABTS solution. Absorbance was taken 6 min after the reaction at 734 nm using the Benchmark Plus ELISA reader (Bio-Rad, Hercules, CA, USA).

3.7. Statistical Aalysis

Each experiment was done in triplicate and all data are presented as the mean ± standard deviation (SD). Multiple comparisons were carried out using Duncan’s multiple range tests for the content of 11 standard compounds. The significant level was set at p < 0.05.

4. Conclusions

In the present study, bioactive compounds such as flavonoids, phenolic acids, and anthocyanins were profiled and quantified in two different color chrysanthemum flowers. As a result of comparative research between them, the infusion of ADC, which had dark purple colored petals, was a prominent source of anthocyanins because of its high anthocyanin content, which were not detected in the commercial yellow chrysanthemum cultivar GG flower tea. In contrast, the GG infusion was considered a good source of flavonoids owing to a very high content of luteolin-7-O-β-glucoside. The differences in the extraction of bioactive compounds by infusing time and temperature showed that GG tea was not significantly affected by them, but ADC tea was much affected by infusing time. As the fragrance ingredient is also important for the flower tea, their volatile compounds were analyzed and compared, and their distribution and content were found to be different. Although differences between the teas were detected, they both showed strong ABTS radical scavenging activity and moderate DPPH radical scavenging activity (ADC tea had slightly higher activity than GG tea). Taken together, both ADC and GG are good breeding materials for high quality tea cultivars. Furthermore, as a new tea cultivar with potent antioxidants, anthocyanin and a distinctive color and aroma, the worthy of breeding of ADC can be enhanced. The present study may be a reference for understanding the differences in bioactive compounds and floral scents for purple and yellow chrysanthemum flowers, and for exploring a method of identifying and evaluating flower tea cultivars.

Author Contributions

Conceptualization, A.-R.H., C.H.J., and S.H.K.; methodology, A.-R.H., B.-S.S., C.H.J.; software, A.-R.H., B.N., B.-R.K., and K.-C.L.; validation, A.-R.H., B.N., B.-R.K., and K.-C.L.; formal analysis, A.-R.H.; investigation, A.-R.H., B.N., B.-R.K., K.-C.L., C.H.J.; resources, S.H.K. and J.-B.K.; data curation, A.-R.H., B.N., and B.-R.K.; writing—original draft preparation, A.-R.H.; writing—review and editing, A.-R.H.; visualization, A.-R.H.; supervision, A.-R.H.; project administration, C.H.J. and J.-B.K.; funding acquisition, C.H.J. and J.-B.K.

Funding

This research was supported by Radiation Technology R&D program (No. 2017M2A2A6A05018541) through the National Research Foundation of Korea (NRF) funded by the Ministry of Science, ICT & Future Planning.

Conflicts of Interest

The authors declare no conflict of interest.

References

  1. Bensky, D.; Clavey, S.; Stöger, E. Chinese Herbal Medicine: Materia Medica, 3rd ed.; Eastland Press: Seattle, WA, USA, 2004; pp. 58–61. ISBN 978-0939616824. [Google Scholar]
  2. Lai, J.-P.; Lim, Y.H.; Su, J.; Shen, H.-M.; Ong, C.N. Identification and characterization of major flavonoids and caffeoylquinic acids in three Compositae plants. J. Chromatogr. B 2007, 848, 215–225. [Google Scholar] [CrossRef]
  3. Dongxu, H.; Xiaochen, R.; Lei, W.; Yuechun, W.; Huidi, J.; Iain, C.B.; Jian, J.; Xin, M.; Qiang, X. Total flavonoids of Flos Chrysanthemi protect arterial endothelial cells against oxidative stress. J. Ethnopharmacol. 2012, 139, 68–73. [Google Scholar] [CrossRef]
  4. Kim, S.J.; Lee, K.-T.; Choi, H.-E.; Ha, T.J.; Nam, J.H.; Hong, S.Y.; Chang, D.C.; Kim, K.S. Anti-inflammatory effects of flavonoids in Korean Chrysanthemum species via suppression of inducible nitric oxide synthase and cyclooxygenase-2 in LPS-induced RAW 264.7 macrophages. Food Sci. Biotechnol. 2015, 24, 975–985. [Google Scholar] [CrossRef]
  5. Xie, Y.-Y.; Yuan, D.; Yang, J.-Y.; Wang, L.-H.; Wu, C.-F. Cytotoxic activity of flavonoids from the flowers of Chrysanthemum morifolium on human colon cancer Colon205 cells. J. Asian Nat. Prod. Res. 2009, 11, 771–778. [Google Scholar] [CrossRef] [PubMed]
  6. Kim, H.J.; Lee, Y.S. Identification of new dicaffeoylquinic acids from Chrysanthemum morifolium and their antioxidant activities. Planta Med. 2005, 71, 871–876. [Google Scholar] [CrossRef] [PubMed]
  7. Yang, P.-F.; Feng, Z.-M.; Yang, Y.-N.; Jiang, J.-S.; Zhang, P.-C. Neuroprotective caffeoylquinic acid derivatives from the flowers of Chrysanthemum morifolium. J. Nat. Prod. 2017, 80, 1028–1033. [Google Scholar] [CrossRef] [PubMed]
  8. Lin, L.-Z.; Harnly, J.M. Identification of the phenolic components of chrysanthemum flower (Chrysanthemum morifolium Ramat). Food Chem. 2010, 120, 319–326. [Google Scholar] [CrossRef]
  9. Yang, P.-F.; Yang, Y.-N.; Feng, Z.-M.; Jiang, J.-S.; Zhang, P.-C. Six new compounds from the flowers of Chrysanthemum morifolium and their biological activities. Bioorg. Chem. 2019, 82, 139–144. [Google Scholar] [CrossRef] [PubMed]
  10. Xie, Y.-Y.; Qu, J.-L.; Wang, Q.-L.; Yoshikawa, M.; Yuan, D. Comparative evaluation of cultivars of Chrysanthemum morifolium flowers by HPLC-DAD-ESI/MS analysis and antiallergic assay. J. Agric. Food Chem. 2012, 60, 12574–12583. [Google Scholar] [CrossRef] [PubMed]
  11. Han, A.-R.; Kim, H.Y.; So, Y.; Nam, B.; Lee, I.S.; Nam, J.W.; Jo, Y.D.; Kim, S.H.; Kim, J.-B.; Kang, S.Y.; Jin, C.H. Quantification of antioxidant phenolic compounds in a new chrysanthemum cultivar by high-performance liquid chromatography with diode array detection and electrospray ionization mass spectrometry. Int. J. Anal. Chem. 2017, 2017, 1254721. [Google Scholar] [CrossRef] [PubMed]
  12. Wu, Y.; Yan, Z.; Zhao, J.; Zhu, Y. Headspace solid-phase microextraction and gas chromatography-mass spectrometry of volatile components of Chrysanthemum morifolium Ramat. Trop. J. Pharm. Res. 2016, 15, 2241–2244. [Google Scholar] [CrossRef]
  13. Choi, H.-S. Headspace analyses of Chrysanthemum indicum by solid-phase microextraction. Anal. Chem. Lett. 2011, 1, 16–24. [Google Scholar] [CrossRef]
  14. Wu, Q.; Deng, C.; Shen, S.; Song, G.; Hu, Y.; Fu, D.; Chen, J.; Zhang, X. Solid-phase microextraction followed by gas chromatography-mass spectrometry analysis of the volatile components of Flos Chrysanthemi indici in different growing areas. Chromatographia 2004, 59, 763–767. [Google Scholar] [CrossRef]
  15. Brand-Williams, W.; Cuvelier, M.E.; Berset, C. Use of a free radical method to evaluate antioxidant activity. LWT-Food Sci. Technol. 1995, 28, 28–30. [Google Scholar] [CrossRef]
  16. Re, R.; Pellegrini, M.; Proteggente, A.; Pannala, A.; Yang, M.; Rice-Evans, C. Antioxidant activity applying an improved ABTS radical cation decolorization assay. Free Radic. Biol. Med. 1999, 26, 1231–1237. [Google Scholar] [CrossRef]
Sample Availability: Not available.
Figure 1. Photos of chrysanthemum flowers in different colors. (a) Dark purple chrysanthemum cultivar (ARTI-Dark Chocolate, ADC), its manufactured tea bag, and its infusion; (b) Common yellow chrysanthemum cultivar (Gamguk, GG), its manufactured tea bag, and its infusion.
Molecules 24 00329 g001
Figure 2. HPLC chromatograms of (a) the dark purple chrysanthemum cultivar (ARTI-Dark Chocolate) infusion and (b) the yellow chrysanthemum cultivar (Gamguk) infusion detected at 280 nm. See Table 1 for the peak numbers and Materials and Methods for the HPLC-DAD-ESIMS conditions.
Molecules 24 00329 g002
Figure 3. HPLC chromatograms of the dark purple chrysanthemum cultivar (ARTI-Dark Chocolate) infusion detected at 520 nm. See Table 2 for the peak numbers and Materials and Methods for the HPLC-DAD-ESIMS conditions.
Molecules 24 00329 g003
Figure 4. Structures of 11 standard compounds identified in two different color chrysanthemum flowers.
Molecules 24 00329 g004
Figure 5. GC chromatograms of (a) the dark purple chrysanthemum cultivar (ARTI-Dark Chocolate) tea material and (b) the yellow chrysanthemum cultivar (Gamguk) tea material. See Table 1 for the peak identification and Materials and Methods for the HS-SPME-GC-MS conditions.
Molecules 24 00329 g005
Table 1. Flavonoids and phenolic acids identified from the infusions of two different color chrysanthemum flowers by HPLC-DAD/ESIMS methods.
PeaktR (min)λmax (nm)[M + H]+ (m/z)MSn (m/z)Identification
18.4275, 350449nd 3Luteolin-glucoside 1
29.9220, 325355163Chlorogenic acid 2
323.7285, 350465nd 3Quercetin-glucoside 1
425.1270, 350449nd 3Luteolin-7-O-β-glucoside 2
525.8265, 350463nd 3Luteolin-glucuronide 1
628.6225, 325517499/163Dicaffeoylquinic acid 1
729.4265, 350551295unknown
831.5220, 325517499/1633,5-Dicaffeoylquinic acid 2
932.2265, 340433nd 3Apigenin-7-O-β-glucoside 2
1033.7255, 350535nd 3Luteolin-malonylglucoside 1
1134.6225, 325517499/163Dicaffeoylquinic acid 1
1235.8265, 350477nd 3Diosmetin-glucuronide 1
1341.6265, 335519nd 3Apigenin-malonylglucoside 1
1443.3250, 350549nd 3Diosmetin-malonyglucoside 1
1544.8265, 330593nd 3Linarin 2
1650.8265, 330447nd 3Acacetin-7-O-β-glucoside 2
1752.3265, 350287nd 3Luteolin 2
1859.3270, 335533nd 3Acacetin-malonylglucoside 1
1964.6250, 260, 350271nd 3Apigenin 2
1 Provisionally identified from UV/Vis and mass spectra data. 2 Identification was confirmed by comparison with standards. 3 Not detected.
Table 2. Anthocyanins identified from purple color chrysanthemum flower (ADC) infusions by HPLC-DAD/ESIMS methods.
PeaktR (min)λmax (nm)[M]+ (m/z)MSn (m/z)Identification
2011.9520449nd 1Cyanidin-3-O-glucoside
2114.9520535nd 1Cyanidin 3-O-(6″-malonylglucoside)
2216.8520287nd 1Cyanidin
1 Not detected.
Table 3. Calibrations and detection limits for 11 standard compounds.
CompsCalibration Curve 1Correlation Coefficient (r2)Linear Range (μg/mL)LOD 2 (μg/mL)LOQ 3 (μg/mL)
2y = 18.675x − 17.9070.999425–1000.1780.539
4y =14.105x − 16.1800.999325–1000.2670.811
8y = 22.766x − 25.320.999125–1000.6011.822
9y = 33.317x − 9.1700.999225–1000.5421.644
15y = 21.849x − 21.3400.999425–1000.7162.168
16y = 14.277x + 20.1200.999125–1000.2060.624
17y = 23.094x + 5.2200.999525–1000.2440.738
19y = 36.953x − 46.9800.999225–1000.5751.742
20y = 44.087x − 46.9800.996310–2500.3741.134
21y = 32.221x − 120.130.999310–2500.3070.931
22y = 44.603x − 381.80.995710–2500.4441.345
1y and x are peak area and concentration (μg/mL), respectively. 2 LOD was defined as the concentration that could be detected at a signal-to-noise ratio of 3. 3 LOQ was defined as the concentration that could be detected at a signal-to-noise ratio of 10.
Table 4. Content (mg/g) of standard compounds in the infusions of two different color chrysanthemum flowers.
CompoundsInfusion Condition
ADC 1 75 °C 2 minADC 75 °C 4 minADC 100 °C 2 minADC 100 °C 4 minGG 1 75 °C 2 minGG 75 °C 4 minGG 100 °C 2 minGG 100 °C 4 min
24.073 ± 0.540bc 44.678 ± 0.699b4.221 ± 0.573b8.034 ± 1.374a3.050 ± 0.786c3.587 ± 0.292bc3.094 ± 0.915c3.795 ± 0.551bc
44.478 ± 0.586d5.617 ± 0.518d5.458 ± 1.003d11.867 ± 1.778c15.627 ± 3.786b18.206 ± 0.923ab16.134 ± 4.219b20.827 ± 5.393a
84.900 ± 1.508d5.178 ± 0.558cd5.260 ± 0.666cd9.561 ± 2.078a7.279 ± 1.724b8.110 ± 0.530ab7.058 ± 2.113bc8.640 ± 2.015ab
90.713 ± 0.137d0.979 ± 0.134d0.978 ± 0.192d2.106 ± 0.402c4.319 ± 0.980b5.125 ± 0.198ab4.585 ± 1.318b5.961 ± 1.243a
150.630 ± 0.327b0.668 ± 0.104b0.732 ± 0.138b1.294 ± 0.219and 3 cnd 3 cnd 3 cnd 3 c
161.252 ± 0.202c1.847 ± 0.302b2.176 ± 0.753b5.077 ± 0.815a1.130 ± 0.196c1.082 ± 0.366c1.263 ± 0.160c0.964 ± 0.323c
171.146 ± 0.353b1.146 ± 0.185b0.885 ± 0.550b1.747 ± 0.466a0.253 ± 0.137c0.341 ± 0.215c0.535 ± 0.196c0.478 ± 0.288c
19nd 3 bnd 3 bnd 3 bnd 3 b0.400 ± 0.135a0.403 ± 0.081a0.360 ± 0.079a0.346 ± 0.038a
200.531 ± 0.075b0.763 ± 0.110b0.673 ± 0.247b1.975 ± 0.216and 3 cnd 3 cnd 3 cnd 3 c
210.947 ± 0.173c3.680 ± 0.640b2.623 ± 0.934bc8.850 ± 2.114and 3 dnd 3 dnd 3 dnd 3 d
220.535 ± 0.103c1.151 ± 0.158b0.710 ± 0.251c2.054 ± 0.178and 3 dnd 3 dnd 3 dnd 3 d
TPA28.973 ± 2.0489.856 ± 1.2589.480 ± 1.23817.595 ± 3.45310.328 ± 2.51011.696 ± 0.82210.152 ± 3.02912.435 ± 2.566
TF27.919 ± 1.60510.257 ± 1.24510.229 ± 2.63622.090 ± 3.68021.728 ± 5.23425.157 ± 1.78322.877 ± 5.97228.576 ± 7.286
TA21.994 ± 0.3515.594 ± 0.9094.006 ± 1.43312.879 ± 2.508nd 3Nd 3nd 3nd 3
TT218.185 ± 4.00425.707 ± 3.41123.716 ± 5.30752.564 ± 9.64132.057 ± 7.74436.853 ± 2.60533.029 ± 9.00141.011 ± 9.852
1 ADC and GG represent the dark purple chrysanthemum cultivar (ARTI-Dark Chocolate) and yellow chrysanthemum cultivar (Gamguk), respectively. 2 TPA, TF, TA, and TT represent the sum quantities of phenolic acids, flavonoids, anthocyanins, and total compounds, respectively. 3 Not detectable. 4 Lowercase letters indicated statistical significance−samples not sharing a letter differed significantly according to Duncan’s multiple range test (p < 0.05).
Table 5. Antioxidant activities of the infusions of two different color chrysanthemum flowers.
Sample—Infusion Condition (200 μg/mL)ABTS (% Inhibition)DPPH (% Inhibition)
ADC—75 °C, 2 min72.60 ± 0.9851.10 ± 3.05
ADC—75 °C, 4 min74.92 ± 7.7154.92 ± 0.92
ADC—100 °C, 2 min67.94 ± 7.6362.07 ± 3.16
ADC—100 °C, 4 min67.42 ± 1.7766.20 ± 5.08
GG—75 °C, 2 min69.91 ± 6.7030.19 ± 1.39
GG—75 °C, 4 min61.46 ± 5.0437.97 ± 2.98
GG—100 °C, 2 min76.24 ± 4.9247.18 ± 1.40
GG—100 °C, 4 min71.53 ± 2.9543.40 ± 4.81
Ascorbic acid 194.56 ± 0.1258.99 ± 0.42
1 Ascorbic acid was used as a positive control.
Table 6. Identification of floral scent volatile compounds in two different color chrysanthemum flower tea bags.
ADC 1GG 1
tR (min)IdentificationFormulaM.W.% of TotaltR (min)IdentificationFormulaM.W.% of Total
1.50LactamideC3H7NO2891.593.38HexanalC6H12O1000.14
2.50PentanalC5H10O890.263.761,6-Dimethylhepta-1,3,5-trieneC9H141220.04
3.291-OcteneC8H161120.754.93β-ThujeneC10H161360.14
3.38HexanalC6H12O1000.645.05α-PineneC10H161360.44
3.972,6-Dimethyl-3,5-heptadien-2-olC9H16O1400.115.741-Octen-3-olC8H16O1281.27
4.252-Methyl-acetate 1-butanolC7H14O21300.175.83SulcatoneC8H14O1260.49
4.63Santolina trieneC10H161360.215.92β-MyrceneC10H161360.93
4.89TricycleneC10H161360.126.001-Ethyl-3-methyl-benzeneC9H121200.47
4.94β-ThujeneC10H161361.076.19α-PhellandreneC10H161360.42
5.06α-PineneC10H161364.296.55o-CymeneC10H141340.99
5.29CampheneC10H161363.116.72EucalyptolC10H18O1543.93
5.664(10)-ThujeneC10H161362.487.19γ-TerpineneC10H161360.52
5.73β-PineneC10H161360.527.47β-TerpineolC10H18O1541.61
5.82SulcatoneC8H14O1260.297.81γ-PyroneneC10H161360.25
5.92β-MyrceneC10H161367.448.16γ-TerpinenolC10H18O1542.47
6.20α-PhellandreneC10H161366.658.52Pseudo-cyclocitralC10H16O1526.22
6.333,4-Dimethyl-styreneC10H121320.378.71ChrysanthnoneC10H14O1505.49
6.40α-TerpineneC10H161360.209.26(+)-2-BornanoneC10H16O15212.28
6.56o-CymeneC10H141344.439.71cis-VerbenolC10H16O1520.48
6.72EucalyptolC10H18O15416.259.88Terpinen-4-olC10H18O1540.94
7.19γ-TerpineneC10H161360.2910.13D-VerbenoneC10H14O1500.57
7.37β-TerpineolC10H18O1540.3910.27α-TerpineolC10H18O1541.55
7.80γ-PyroneneC10H161360.2011.31trans-Verbenyl acetateC12H18O219416.24
8.082-Methyl butyl ester butanoic acidC10H20O21723.4712.10IsopiperitenoneC10H14O1500.44
8.13ChrysanthenoneC10H14O1501.0712.41Bornyl acetateC12H20O21960.33
8.221-Octenyl acetateC10H18O21700.3013.251,6-Dimethylhepta-1,3,5-trieneC9H141220.49
8.66ChrysanthenoneC10H14O15011.3413.512-Methyl-heptyl ester butanoic acidC12H24O22000.24
9.13(+)-2-BornanoneC10H16O15214.3315.07β-ElemeneC15H242047.02
9.54(−)-BorneolC10H18O1540.4015.542,3,3-Trimethyl-2-(3-methyl-buta-1,3-dienyl)-cyclohexanoneC14H22O2061.02
15.632-Pinen-4-oneC10H14O1500.26
15.73CaryophylleneC15H242040.36
16.50cis-β-FarneseneC15H242040.78
16.69Limonen-6-ol, pivalateC15H24O22360.14
16.814-(2,2-Dimethyl-6-methylenecyclohexylidene)-3-methylbutan-2-oneC14H22O2060.28
17.024,11-SelinadieneC15H242040.13
17.18α-CurcumeneC15H222021.37
17.33β-SelineneC15H242041.04
17.53α-SelineneC15H242040.61
17.76β-BisaboleneC15H242040.27
18.12β-SesquiphellandreneC15H242040.31
18.83Isoaromadendrene epoxideC15H24O2200.12
19.58Caryophyllene oxideC15H24O2200.20
19.87LongifolenaldehydeC15H24O2200.58
21.31LongipinocarvoneC15H22O2180.20
21.62Ledene oxide-(II)C15H24O2200.32
21.97trans-LongipinocarveolC15H24O2200.18
23.71Aromadendrene oxide-(2)C15H24O2200.17
23.84Isoaromadendrene epoxideC15H24O2200.14
25.44cis-Z-α-Bisabolene epoxideC15H24O2200.05
1 ADC and GG represent the dark purple chrysanthemum cultivar (ARTI-Dark Chocolate) and yellow chrysanthemum cultivar (Gamguk), respectively.

