Article

Hydroxyl-Group Identification Using O K-Edge XAFS in Porous Glass Fabricated by Hydrothermal Reaction and Low-Temperature Foaming

Graduate School of Engineering, Osaka University, 2-1 Yamadaoka, Suita, Osaka 565-0871, Japan
*
Author to whom correspondence should be addressed.
Molecules 2019, 24(19), 3488; https://doi.org/10.3390/molecules24193488
Submission received: 30 August 2019 / Revised: 20 September 2019 / Accepted: 25 September 2019 / Published: 26 September 2019
(This article belongs to the Special Issue Advances in Porous Materials)

Abstract

:
Porous glass was prepared by the hydrothermal reaction of sodium borosilicate glass, and oxygen-ion characterization was used to identify the hydroxyl groups in its surface area. A substantial amount of “water” was introduced into the ionic structure as either OH groups or H2O molecules through the hydrothermal reaction. When the hydrothermally treated glass was reheated at normal pressures, a porous structure was formed due to the low-temperature foaming resulting from the evaporation of H2O molecules and softening of the glass. Although it was expected that the OH groups would remain in the porous glass, their distribution required clarification. Oxygen K-edge X-ray absorption fine structure (XAFS) spectroscopy enables the bonding states of oxygen ions in the surface area and interior to be characterized using the electron yield (EY) and fluorescence yield (FY) mode, respectively. The presence of OH groups was detected in the O K-edge XAFS spectrum of the porous glass prepared by hydrothermal reaction with a corresponding pre-edge peak energy of 533.1 eV. In addition, comparison of the XAFS spectra obtained in the EY and FY modes revealed that the OH groups were mainly distributed in the surface area (depths of several tens of nanometers).

1. Introduction

Metallurgical processes produce a large amount of slag and waste glass as by-products, which consist of various oxide components such as SiO2, CaO, Al2O3, and Na2O. Although these materials are currently recycled in road or concrete materials, additional value should be added to them for further beneficial use.
“Exergy” determines the value of a material to be used (Exergy = Δ H T 0 · Δ S , Δ H : enthalpy of the material, Δ S : entropy of the material, T 0 : room temperature). It is easily assumed that waste slag and glass possess quite low exergies because the enthalpy of oxides is much lower than that of reduced metals and the entropy of a mixture of components is significantly higher than that of purified materials. However, the authors have proposed that the introduction of “interfaces” enhances the exergy of even waste slag and glass [1,2], which means that these reagents with low exergies could be transformed into value-added porous ceramic materials such as heat insulators, water-retentive materials, or filters for liquid or gas purification.
Among various processes used to produce ceramic materials, hydrothermal reaction is a promising approach to fabricate porous glass materials as it can be operated with low energy consumption and the use of only water as an eco-friendly reactant [1,2,3,4,5,6,7]. Matamoros-Veloza et al. [3,4] previously proposed porous glass fabrication by the hydrothermal reaction as follows: first, highly pressurized water or steam at 473–573 K is used to dissolve sodium silicate glass components, which results in H2O-bearing glass production. Second, reheating of the H2O-bearing glass at normal pressures spontaneously creates a porous structure in the glass via the foaming phenomenon, which occurs after the vaporization of H2O incorporated in the glass and the softening of the glass structure. In general, softening of the glass occurs above the glass-transition temperature. Nakamoto and one of the authors [5,6] observed that the glass-transition temperature of sodium silicate glass significantly decreases as the apparent H2O content in the glass increases after hydrothermal reaction. They also reported that the B2O3-added glass exhibited the highest apparent H2O solubility and thus the lowest glass-transition temperature of all the glasses ever examined. Then, Yoshikawa and one of the authors showed that porous glass was successfully obtained by the hydrothermal reaction of the sodium borosilicate glass at 473 K and reheating of the H2O-bearing glass above 473 K because of its low-temperature foaming behavior [7,8]. To date, the authors have proposed several applications of the above porous glass as a carrier for ultrafine metal particles [9] or hydrate crystals [10,11]. Besides, there have been many works that applied hydrothermal treatment for glass recycling to fabricate advanced materials [12,13,14] and surface structure modification of glass materials [15,16,17].
Because the porosity and pore distribution of the above porous glass significantly depend on the apparent H2O content in the hydrothermally treated glass, it is important to clarify the mechanism of H2O incorporation in the ionic structure of sodium borosilicate glass during the hydrothermal reaction. Generally, the ionic structure of silicate glass consists of the linkage of SiO4 tetrahedra connected with each other through bridging oxygen ions (O0) and partially broken by non-bridging oxygen ions (O) bonded with basic cations such as Na+ [18,19]. It is known that B2O3 contributes to enhance the linkage in the silicate glass ionic structure as BO3 triangles or BO4 tetrahedra [20]. In terms of H2O incorporation into the glass, however, it has only been reported for sodium silicate glass that H2O exists in the ionic structure either as OH groups coordinated with SiO4 tetrahedra (e.g., Si–OH) or isolated H2O molecules [21]. Although a substantial amount of H2O is introduced into the sodium borosilicate glass under the hydrothermal reaction, the population of the OH groups and H2O molecules and their distribution in the ionic structure of the glass have not yet been clarified. The OH groups in the glass ionic structure promote the softening of the glass as they disconnect the linkage of SiO4 or BO4 tetrahedra, whereas the interstitial H2O molecules are vaporized to form the porous structure when the H2O-bearing glass is reheated. In addition, neither the existence of residual OH groups nor its dispersion in the porous glass microstructure has been clarified.
Mid-infrared (mid-IR) absorption spectroscopy is normally used for identification of the hydroxyl (OH) groups bonded with SiO4 tetrahedra and water molecules (H2O) in ceramic and glass materials [22,23]. However, it is difficult to distinguish them in the mid-IR spectrum because of the small difference between the corresponding absorption bands. In contrast, it has been confirmed that near-IR absorptions associated with the OH group or with the isolated H2O molecule are widely separated with each other and thus clearly recognizable [24], although reported trials of near-IR absorption spectroscopy of oxide materials are limited because of its low sensitivity.
The aim of the present study was to identify the hydroxyl group and its in-depth distribution in the porous glass made by the foaming of the H2O-bearing glass prepared by the hydrothermal reaction of the sodium borosilicate glass using both near-IR and oxygen K-edge soft X-ray absorption near-edge structure (XANES) spectroscopies. O K-edge XANES as well as O 1s X-ray photoelectron spectroscopy (XPS) have been previously used to identify the bonding state of oxygen ions with surrounding ions in oxide glass and crystals [25,26,27,28,29]. The O K-edge XANES spectrum of an oxide material provides not only the classification of O0 and O ions but detailed information on the bonding and coordination states of oxygen ions using the absorbed X-ray energy for electron excitation, while O 1s XPS does only former of the above using the corresponding binding energies. In addition, O K-edge XANES has been used for hydroxyl group speciation adsorbed on the surface of minerals, metals, and nanocrystals [30,31,32,33,34]. The hydroxyl group involved in the silicate network structure (Si–OH) can be classified as a non-bridging oxygen partially associated with the hydrogen cation, which could be recognized as an independent X-ray absorption in the O K-edge XANES spectrum with high resolution. Furthermore, the soft X-ray absorption measurements in both electron yield (EY) and florescence yield (FY) modes enable structural information in the surface and bulk areas to be separately obtained.

2. Results

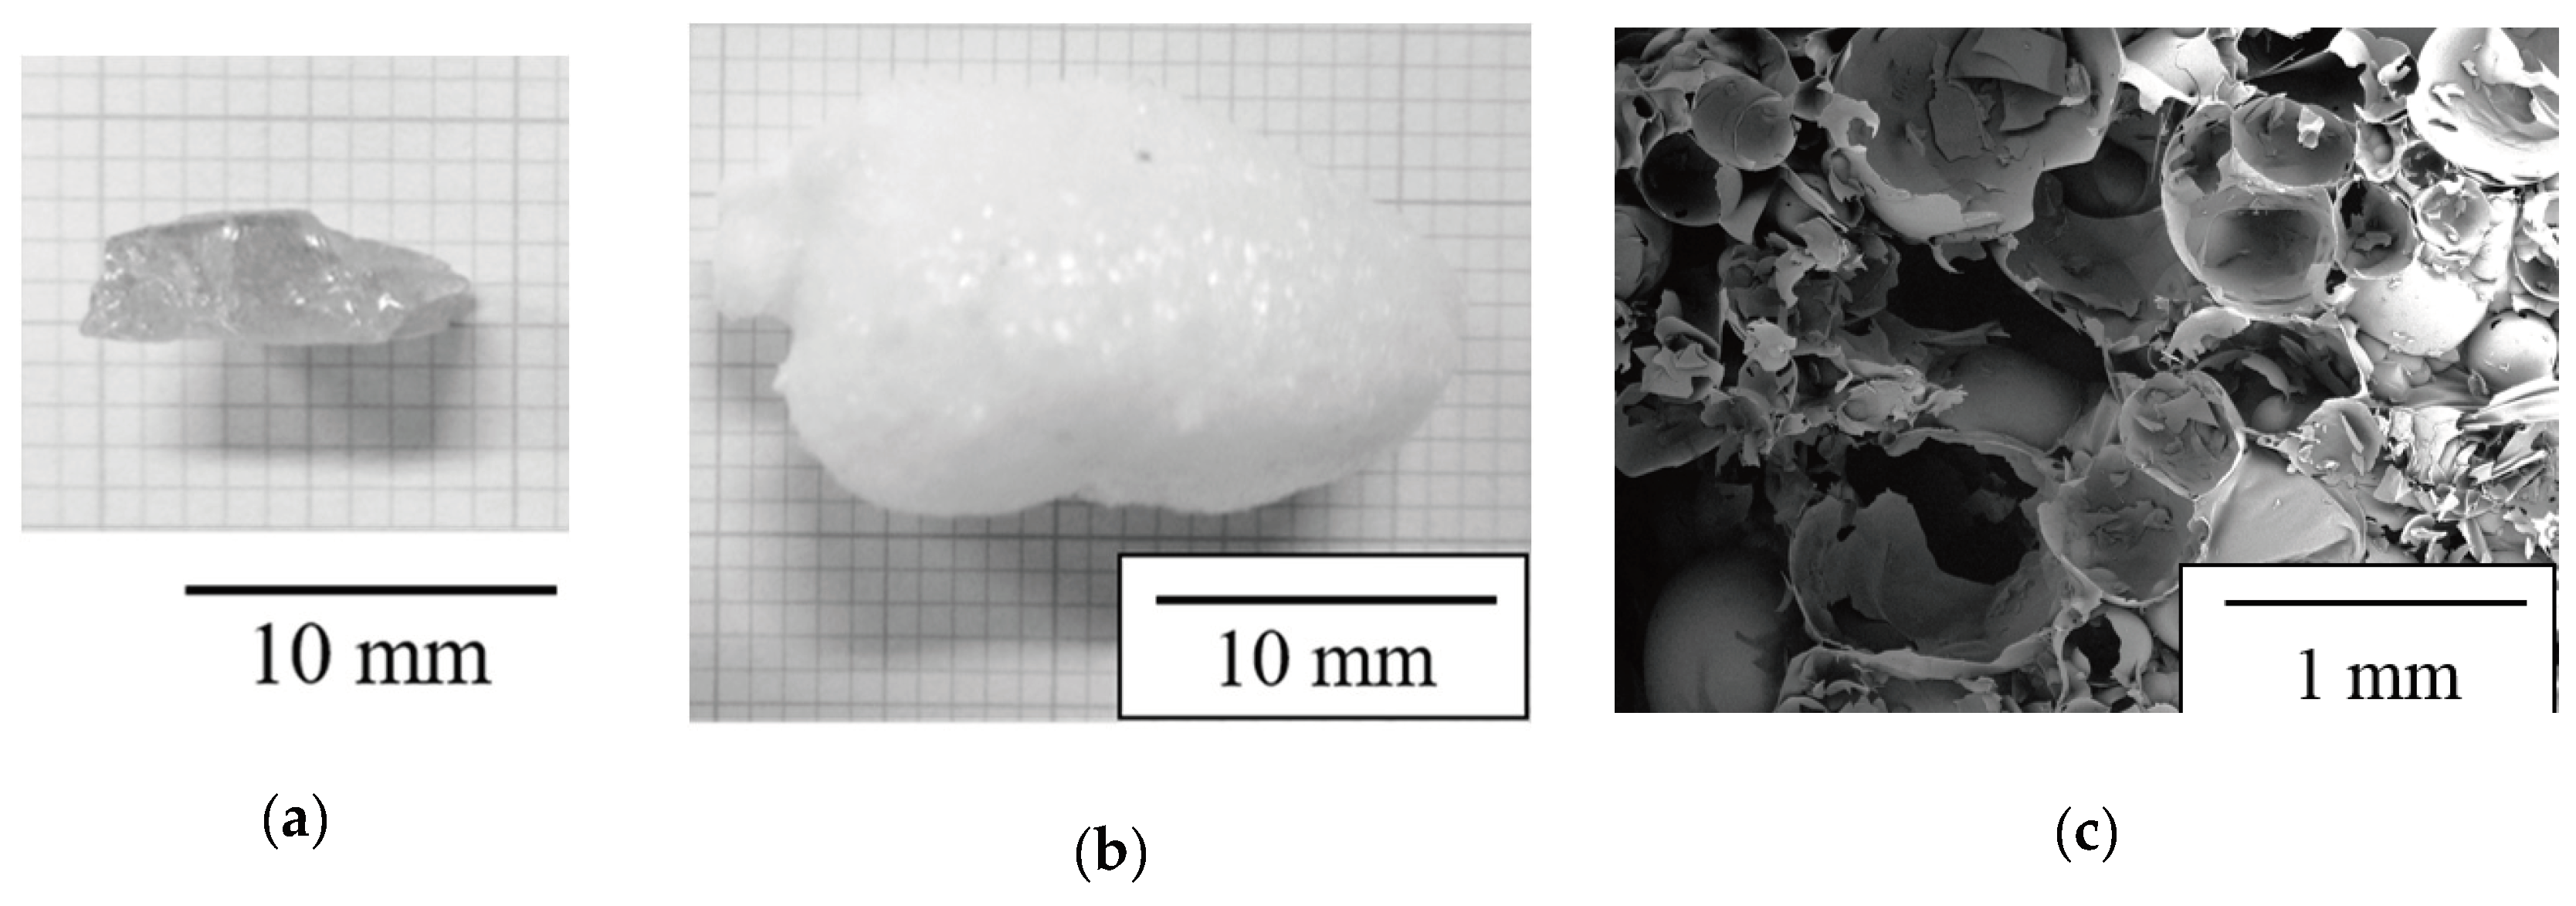
2.1. Preparation of H2O-Bearing Glass by Hydrothermal Reaction and Fabrication of Porous Glass by Low-Temperature Foaming

Figure 1a shows the appearance of the H2O-bearing glass prepared by the hydrothermal reaction of the sodium borosilicate glass (see Section 4 for chemical composition of the original glass and detailed hydrothermal conditions). The sodium borosilicate glass components reacted with the highly pressurized H2O vapor (the partial pressure of H2O was approximately 1.6 MPa at 473 K according to the H2O phase diagram) to form a homogeneous aqueous solution. After drying the sample to remove excess condensed water, the solidified transparent H2O-bearing glass species was obtained. Approximately 30 mass % of weight increase was observed after the hydrothermal treatment, which was partially due to the H2O incorporation into the glass.
Figure 1b shows the appearance of the porous glass obtained by reheating the H2O-bearing glass in a microwave oven. When reheated, the H2O-bearing glass largely expanded to form a porous structure because of the foaming behavior caused by both the softening of the H2O-bearing glass and the vaporization of H2O inside the glass (see Figure S1 in supplementary materials as an evidence of interstitial H2O emission from the hydrothermally treated glass).
Figure 1c shows the cross-sectional microstructure of the porous glass. A three-dimensional broken-bubble structure is observed, with the size of the bubbles varying from ten to several hundred of micrometers in diameter. The shells of the bubbles are made of the sodium borosilicate glass containing H2O, and the walls of broken bubbles are partially interconnected to form the porous structure.

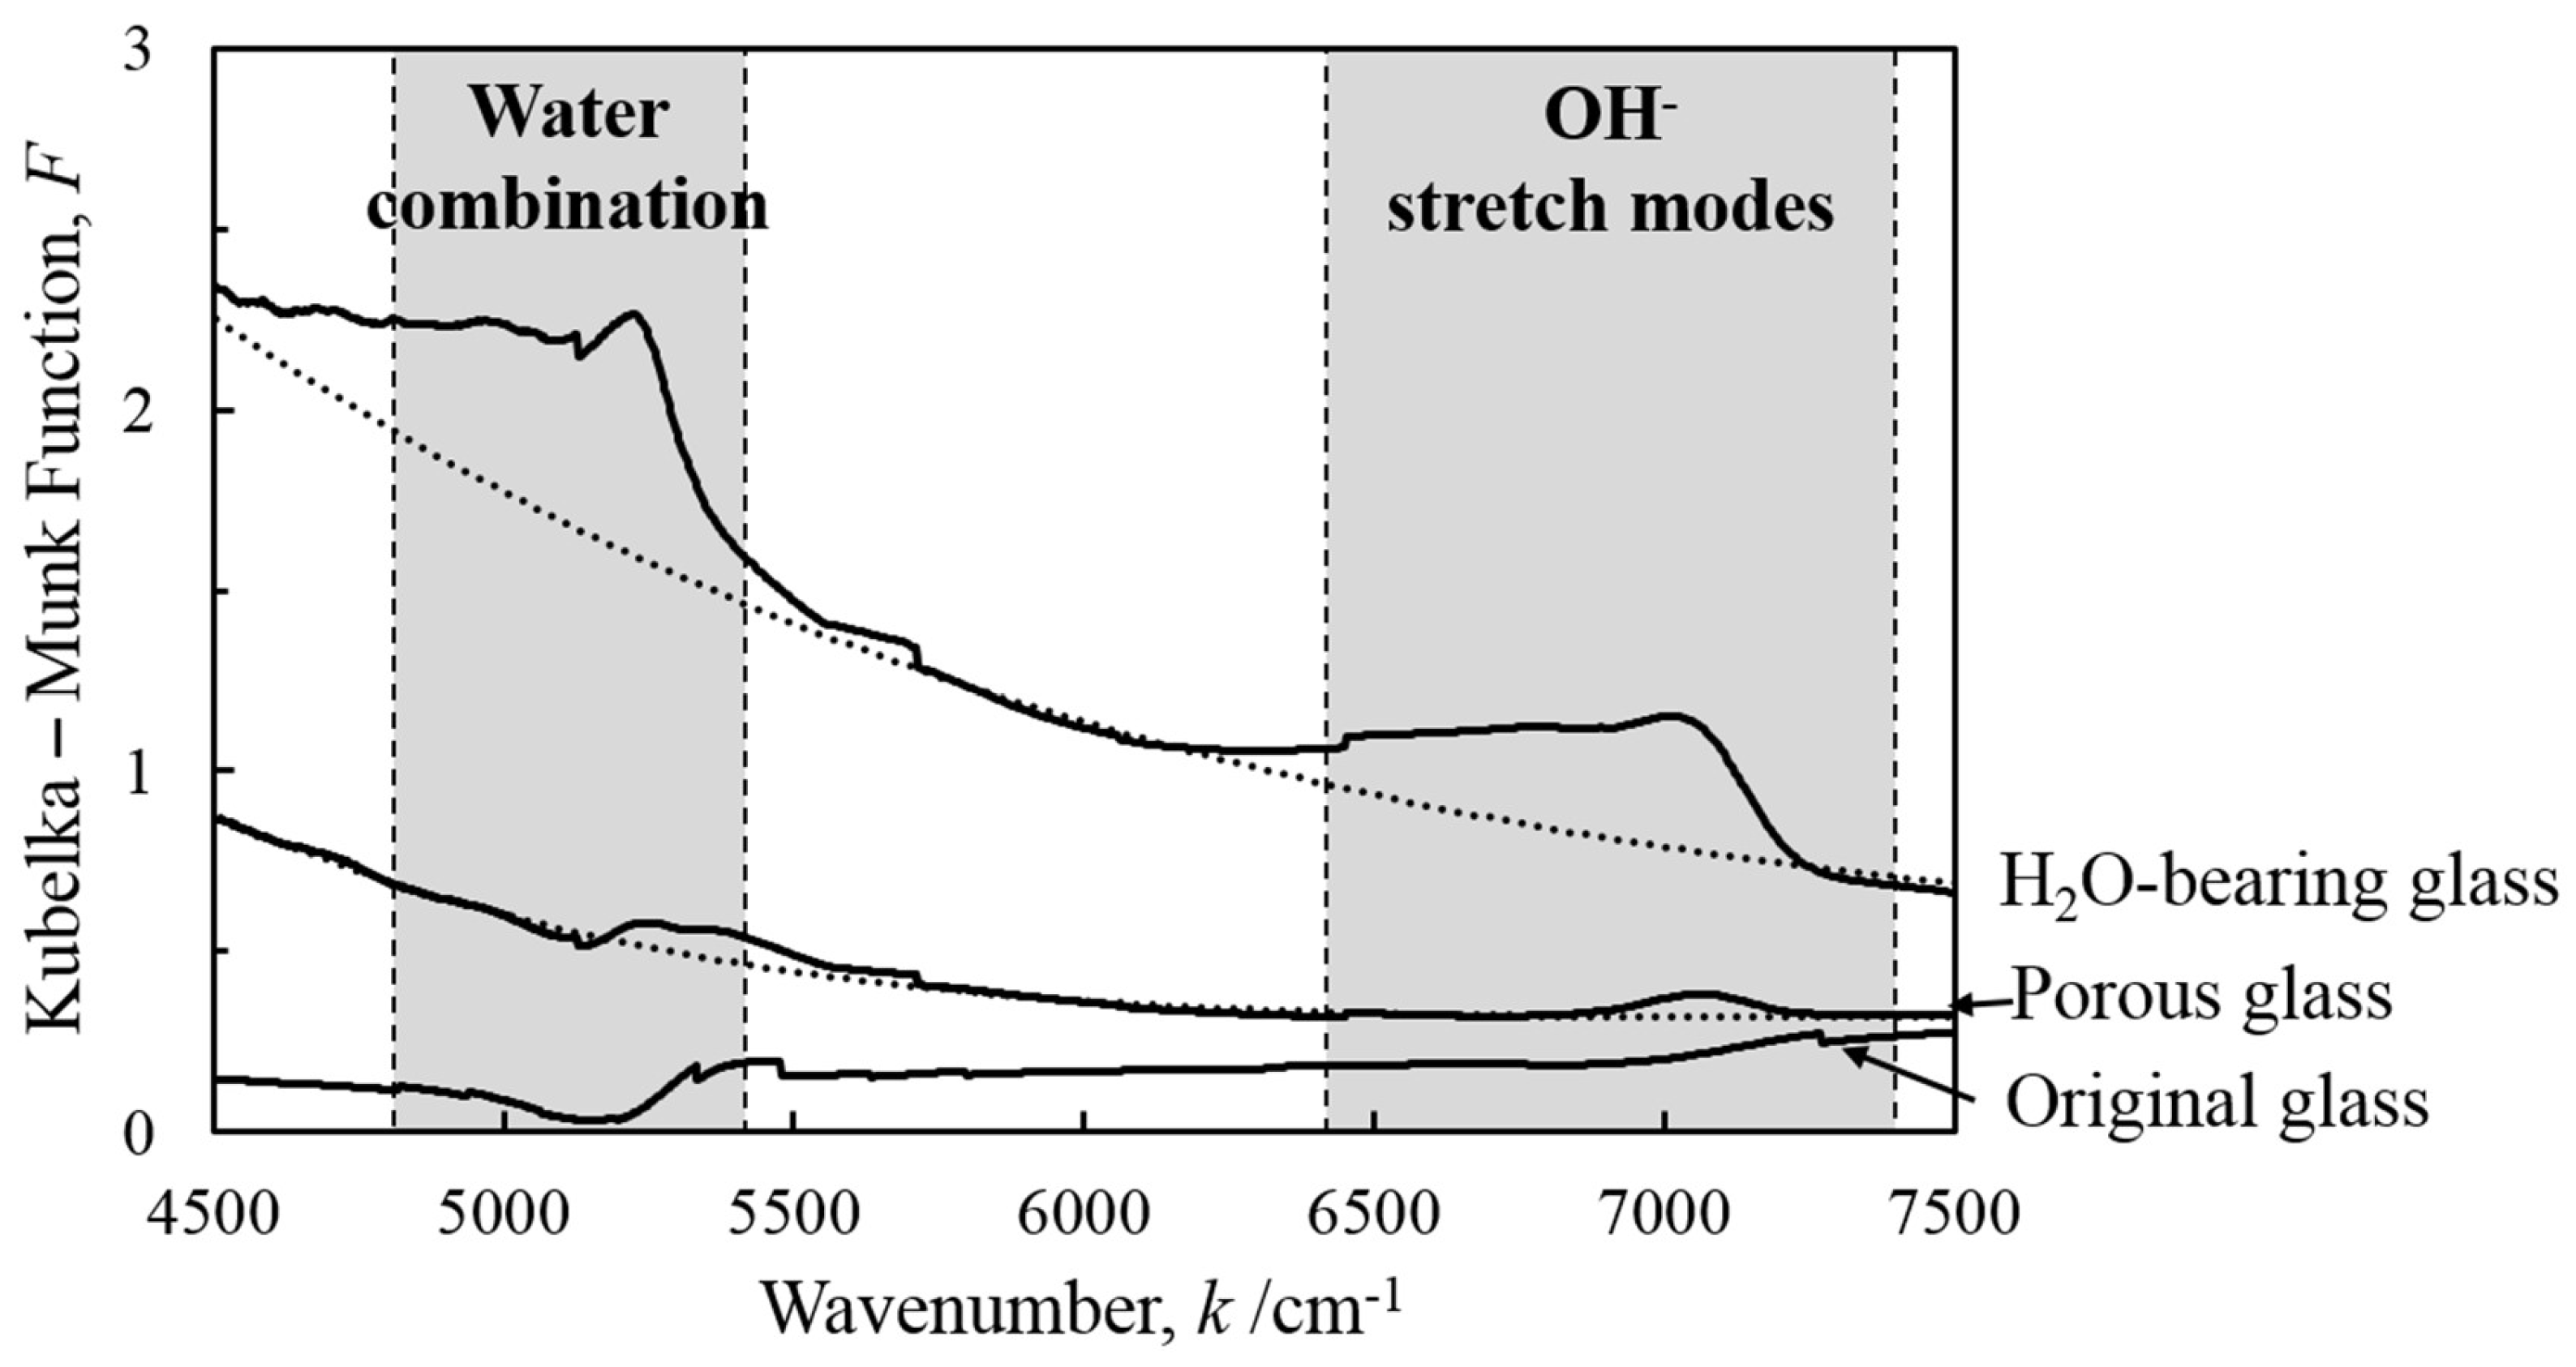
2.2. Near-IR Absorption Spectroscopy for Identification of OH Groups and H2O Molecules in Porous Glass

The near-IR absorption of the original sodium borosilicate glass, H2O-bearing glass, and porous glass was examined using diffuse reflectance spectra. Figure 2 presents the near-IR absorbance spectra as a function of wavenumber of incoming light. The Kubelka–Munk function F denotes the ratio of the absorption and reflection degrees:
F = ( 1 R ) 2 2 R
where R represents the absolute spectral reflectivity of the material. An increase of F directly corresponds to an increase of absorbance.
It has been mentioned that the absorptions in the wavenumbers between 6400 and 7400 cm−1 are associated with the first overtone of the hydroxyl stretching modes (OH groups), whereas those between 4800 and 5400 cm−1 correspond to water combination modes (H2O molecules) [24]. The near-IR spectrum for the original sodium borosilicate glass did not indicate the presence of either OH groups or H2O molecules. In contrast, the spectrum for the H2O-bearing glass clearly exhibited both of the IR absorptions associated with hydroxyl groups and H2O molecules. For the porous glass obtained by reheating the H2O-bearing glass, decreased absorptions associated with the OH group were observed in the spectrum, whereas the IR absorption corresponding to the H2O molecules present was too small to be clearly recognized. Thus, it was verified that the H2O-bearing glass contained many OH groups and H2O molecules in its ionic structure, and that most of the H2O molecules and partial OH groups were removed from the porous glass after reheating.

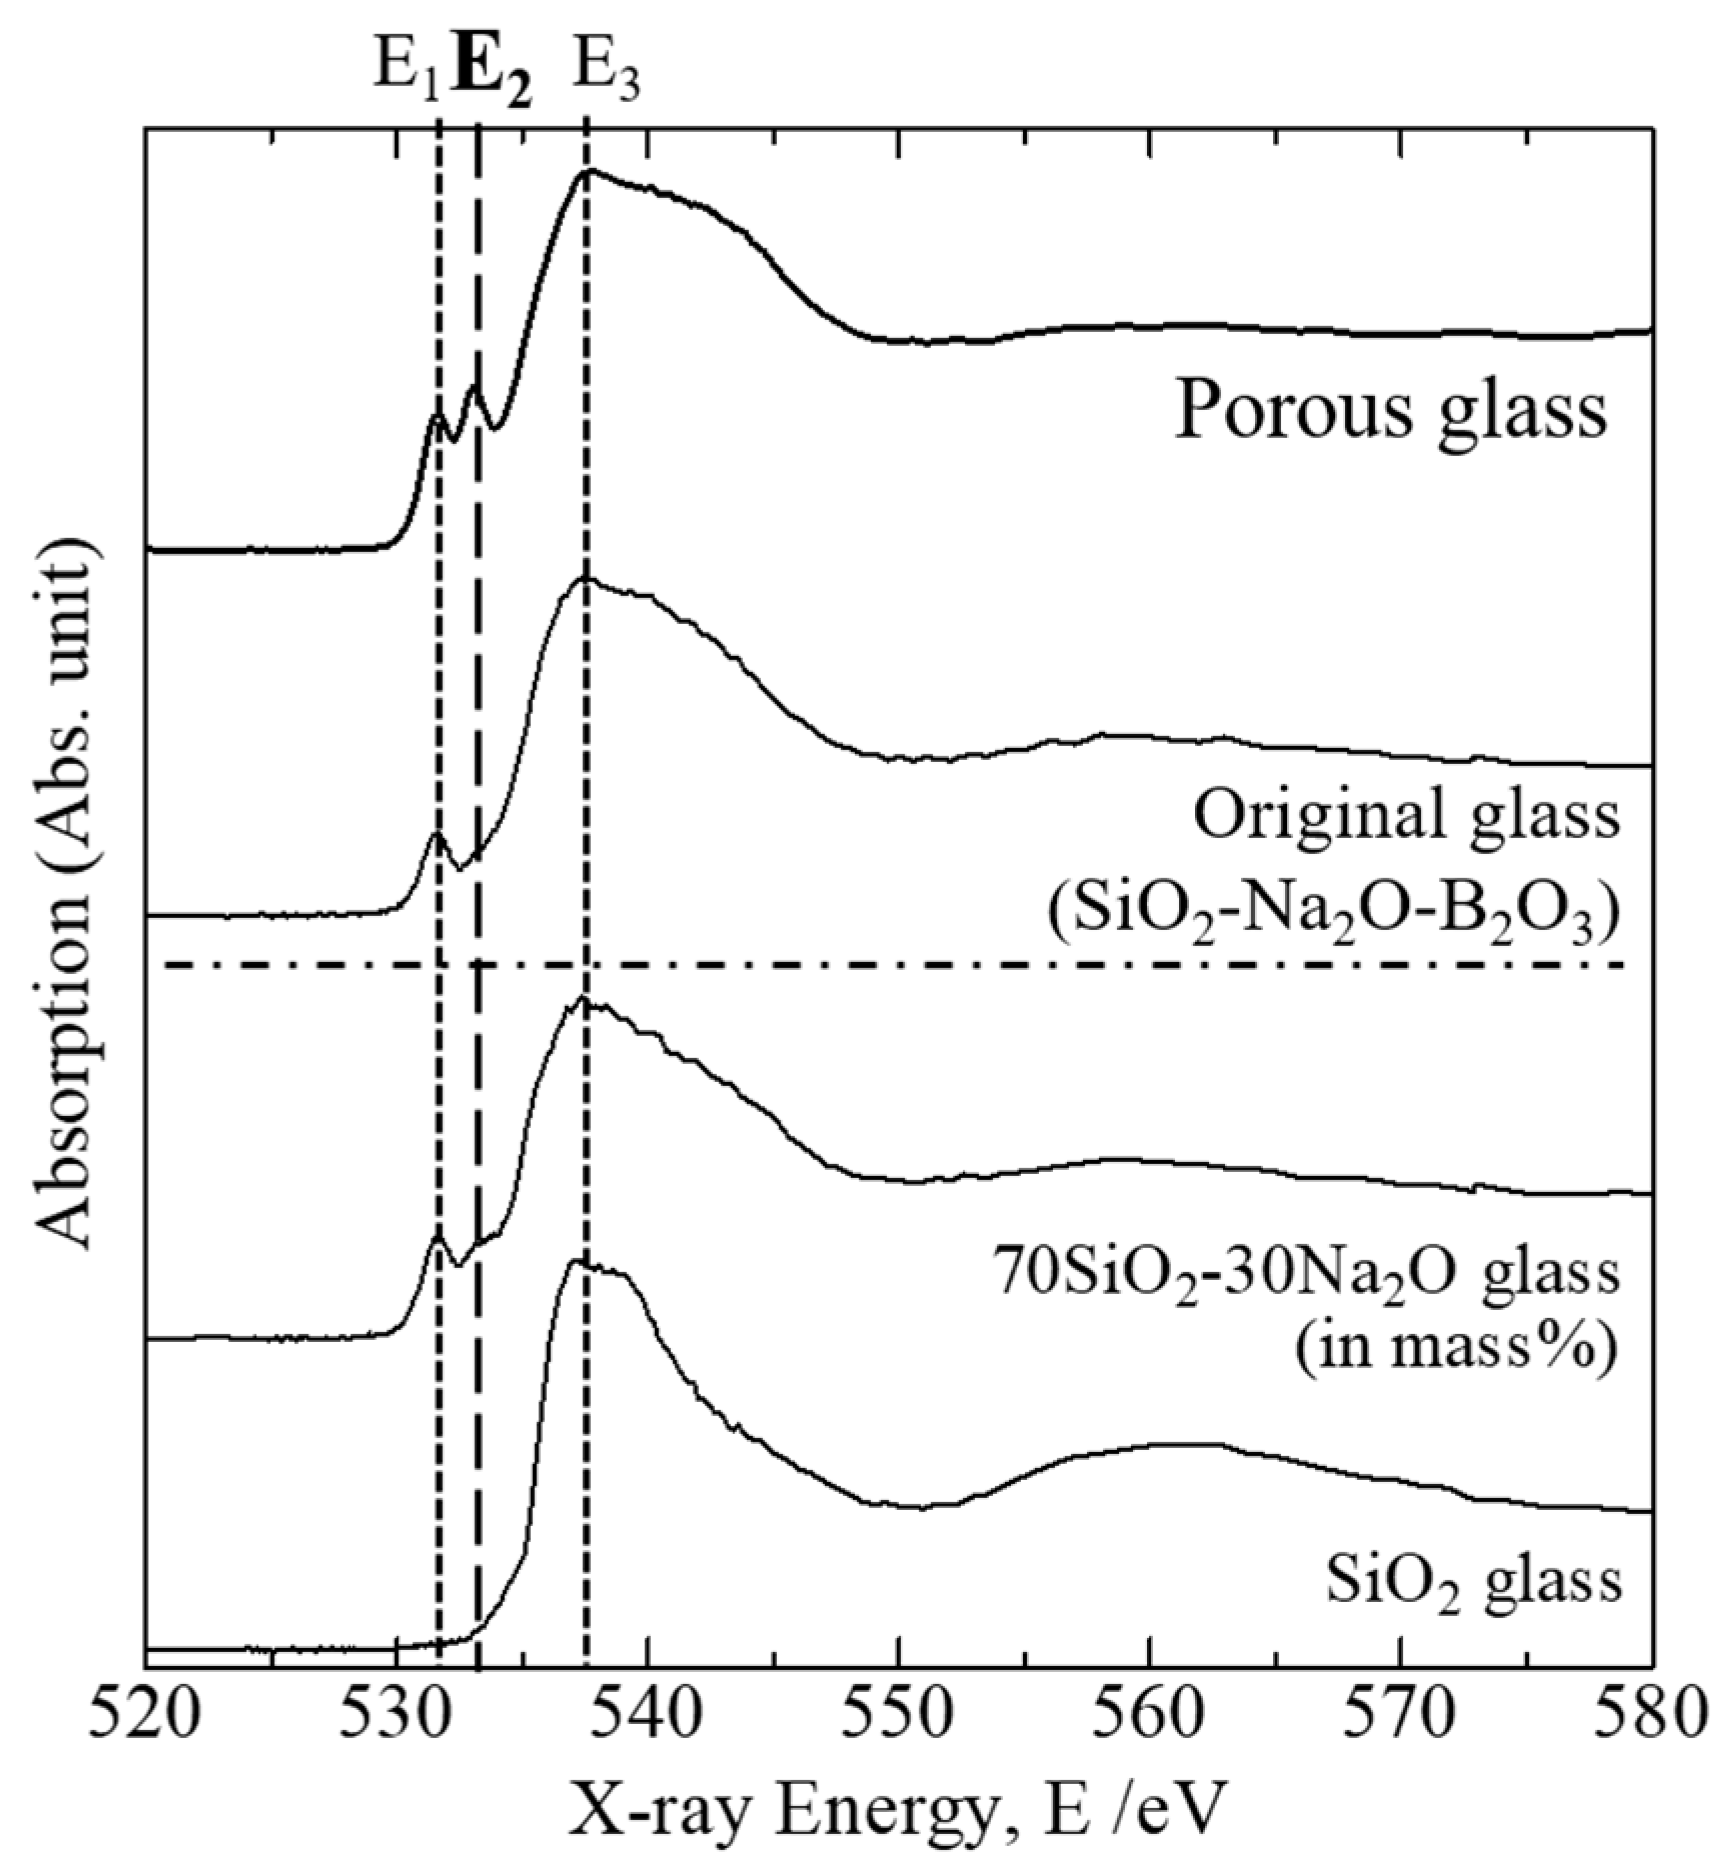
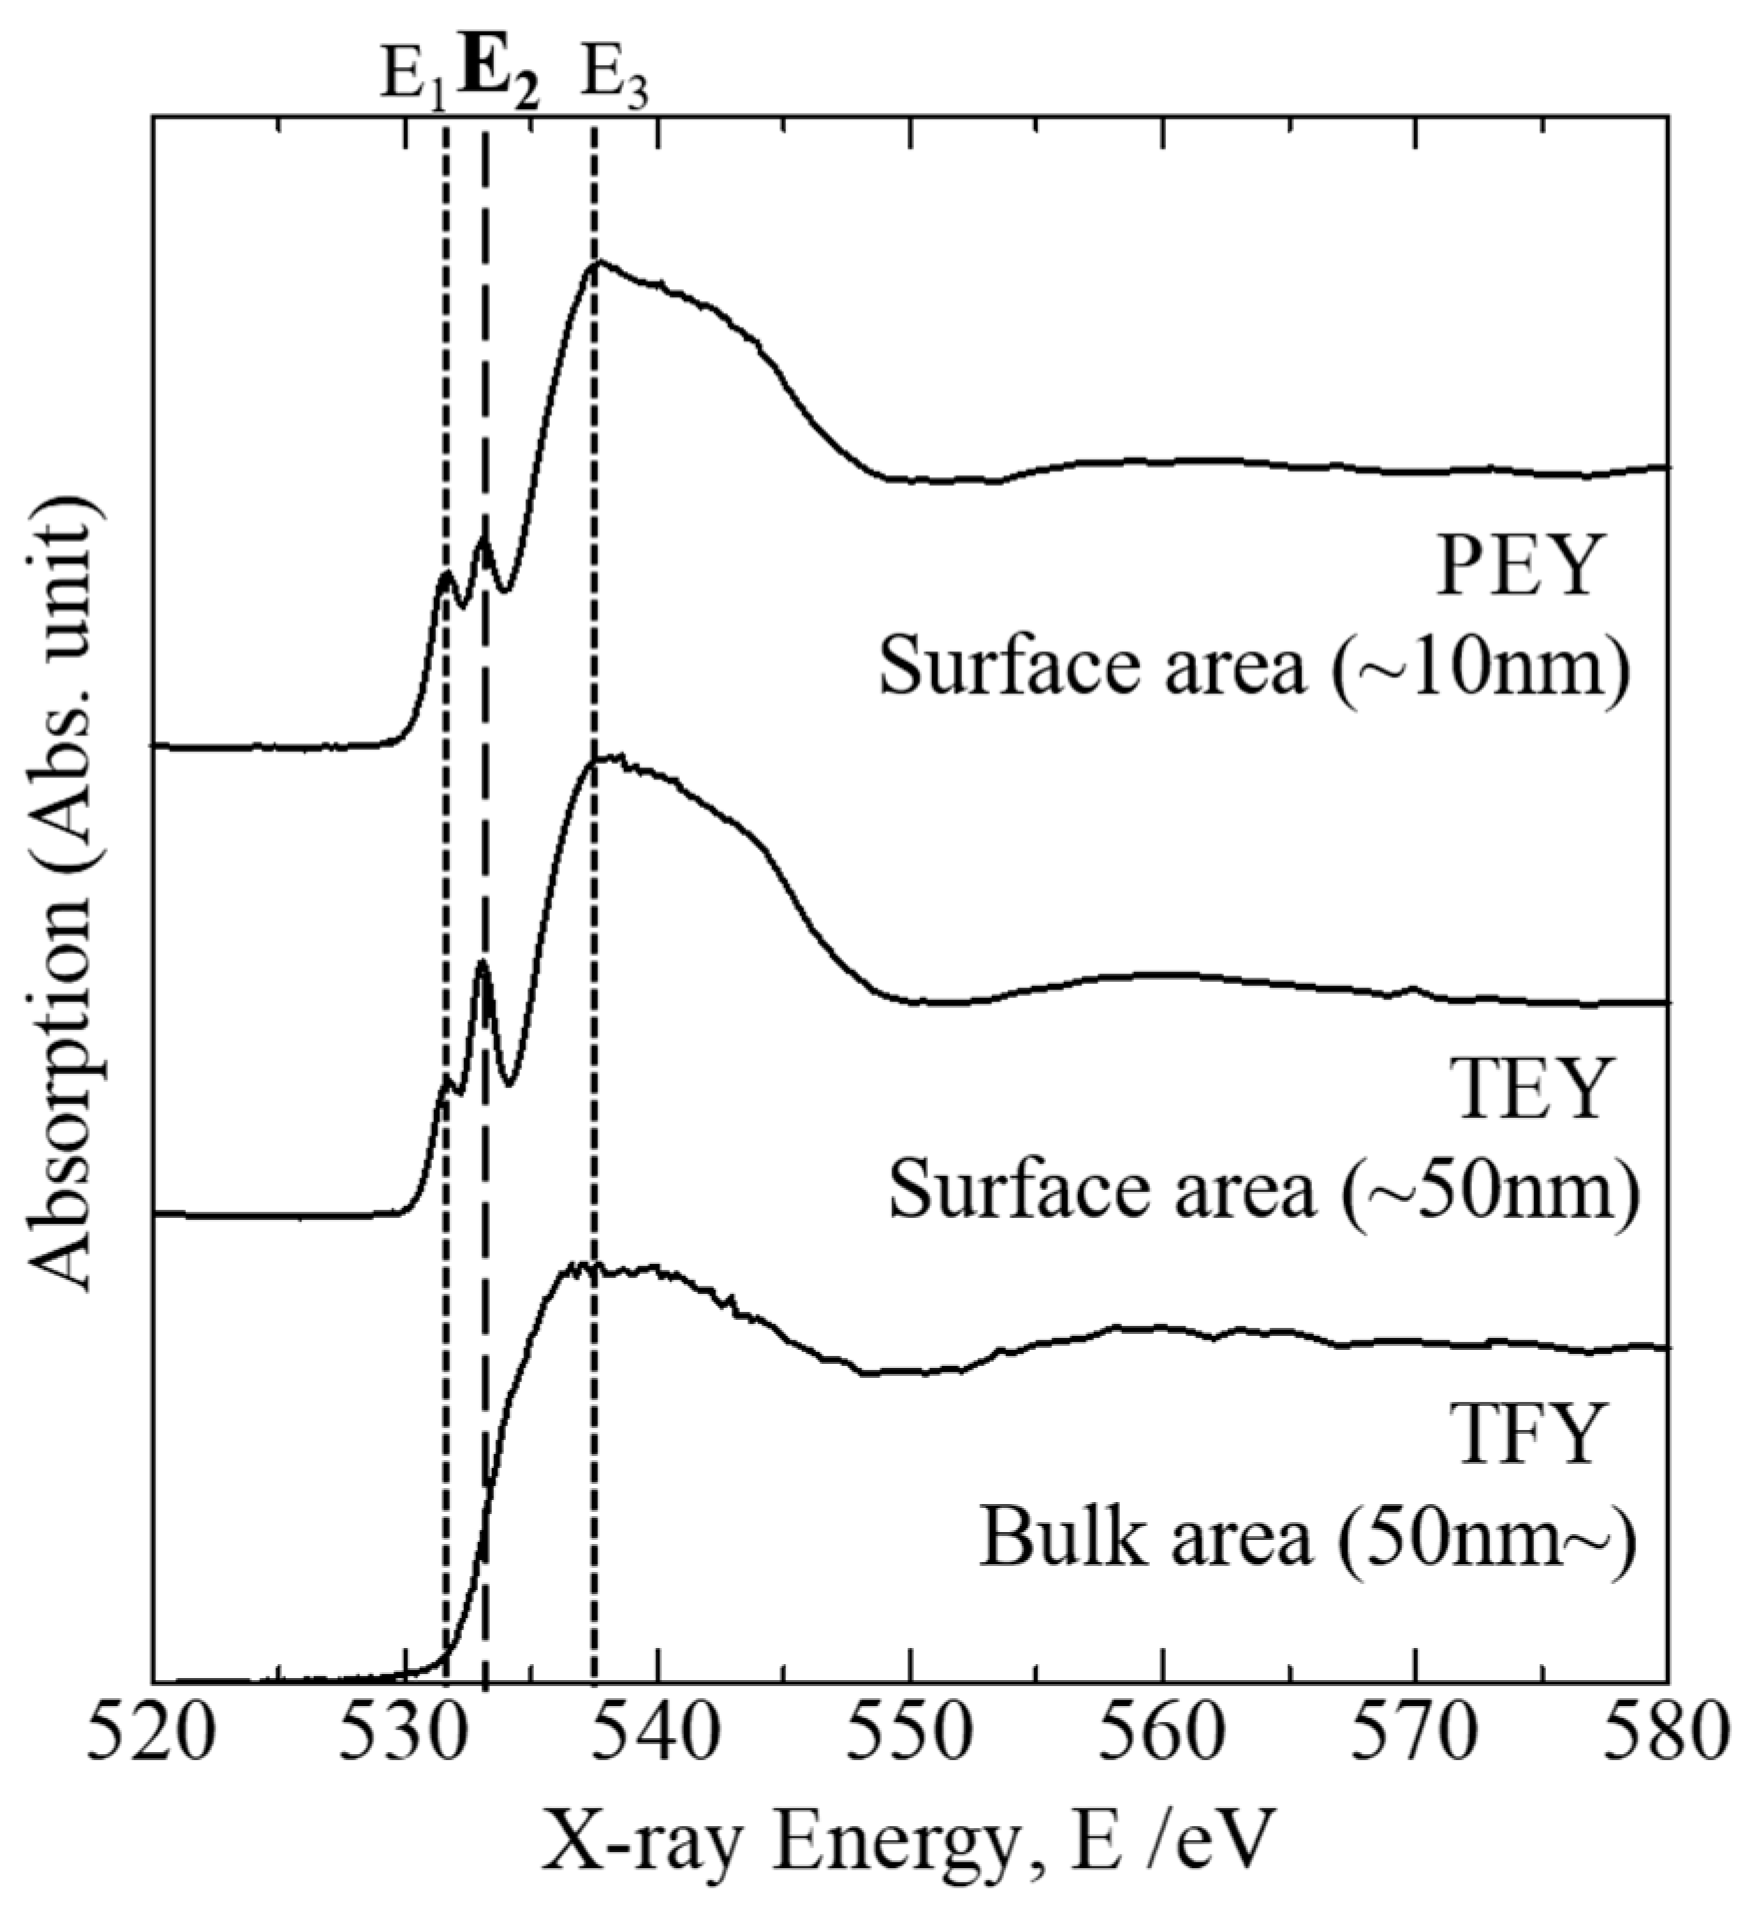
2.3. O K-Edge XANES Spectroscopy of Porous Glass to Determine in-Depth Distribution of OH Groups

Figure 3 represents the O K-edge XANES spectra of the original sodium borosilicate glass and the porous glass prepared using the hydrothermal reaction and foaming behavior as well as those for SiO2 and SiO2–Na2O glasses as reference materials. The partial electron yield (PEY) mode was selected for collection. The spectrum for SiO2 glass, which contains only bridging oxygen ions (O0), consisted of a single absorption peak at 537.5 eV (marked as E3 in Figure 3). In contrast, the spectrum for SiO2–Na2O glass, where both bridging oxygen (O0) and non-bridging oxygen ions (O) are included, consisted of both the pre-edge absorption peak at 531.6 eV (marked as E1) and the main absorption peak E3. Therefore, it is verified that the absorbed peak energy E1 corresponds to the non-bridging oxygen ions (Si–O–Na), whereas E3 corresponds to the bridging oxygen ions (Si–O–Si). The spectrum for the original sodium borosilicate glass also contained both the E1 and E3 absorption peaks, indicating that the glass contains both O0 and O ions in its ionic structure. In contrast, a unique absorption peak (marked as E2) was observed in the spectrum for the porous glass as well as the E1 and E3 absorption peaks. The peak energy for E2 was identified as 533.1 eV, which corresponds to the OH group, as reported by several authors [31,32,33,34].
Figure 4 presents the O K-edge XANES spectra of the porous glass obtained using different collection modes. The partial electron yield (PEY) and total electron yield (TEY) modes reflect the ionic structure in the surface area (depths of 50 nm or less from the surface), whereas the total florescence yield (TFY) mode reflects that in the bulk area (depths of greater than 50 nm from the surface). The PEY mode detects the ionic structure at very shallow depths from the surface (depths of 10 nm or less) because of the screening effect, whereby only the radiated Auger electrons with high kinetic energies are detected. In Figure 4, we can assume that the peak energies E1, E2, and E3 are associated with non-bridging oxygen (e.g., Si–O–Na), hydroxyl groups (e.g., Si–OH), and bridging oxygen (e.g., Si–O–Si), respectively, each coordinated with a silicon cation, from the results in Figure 3. The spectra obtained in PEY and TEY modes clearly indicate the existence of the hydroxyl groups. In particular, the corresponding absorption peak in the TEY spectrum was remarkable. In contrast, the absorption peak E2 corresponding to the hydroxyl groups was not notable in the TFY spectrum.

3. Discussion

Concerning the OH group identification in the porous glass by O K-edge XANES spectroscopy (please see Figure 3), we focused on the relationship between the peak energy and the bond strength between a cation (Mn+) and oxygen anion, where we assumed that each oxygen makes the other bond with a silicon cation. If we assume that the absorbed X-ray energy, which reflects electronic state of valence electrons in oxygen elements associated with cations, is proportional to the energy for the M–O bond dissociation, the peak energy E2 corresponds to the hydroxyl group associated with the silicon cation (Si–OH) because the bond dissociation energies (D) of the M–O diatomic molecule defined by Luo [35] satisfy the following relationship: D(Na–O) < D(H–O) < D(Si–O), corresponding to the peak energy relationship E1 < E2 < E3. Thus, the use of O K-edge XANES spectroscopy enabled the characterization of oxygen ions bonded with different ions, particularly the OH group speciation in the porous glass created by the hydrothermal reaction of sodium borosilicate glass.
In addition, the O K-edge XANES measurements performed using different collection modes enabled the evaluation of the in-depth distribution of the OH groups in the porous glass microstructure (see Figure 4). Here, it should be noted that although all the samples were prepared as powders, we can assume that the spectra obtained in PEY and TEY modes mainly reflect the ionic structure of the pore surface rather than the cross-sectional planes because of the adequately large pore surface area. The results in Figure 4 indicate that the hydroxyl groups were selectively distributed in the pore surface (up to 50 nm in depth) rather than in the interior of the porous glass microstructure. This finding is of importance in our understanding of how the porous microstructure is formed after the vaporization of H2O molecules in the ionic structure of the glass when the foaming behavior occurs. When the H2O-bearing glass is heated at normal pressure, the incorporated H2O molecules in the ionic structure are immediately saturated, and then, the emission of H2O vapor most likely occurs by moving out of the linkage of SiO4 or BO4 tetrahedra disconnected by OH groups to form a bubble (Figure 5 shows a schematic image of H2O behavior in glass microscopic structure), in addition, softening of the glass structure occurs. This process may result in the segregation of hydroxyl groups in the surface area of the broken-bubble structure made of the softened glass. Thus, for preparation of a largely expanded porous glass, the optimum glass composition should be determined to enhance the disconnection of the silicate tetrahedra linkage by hydroxyl group incorporation as well as H2O molecules entrapment during the hydrothermal reaction.

4. Materials and Methods

Sodium borosilicate glass with the chemical composition 63 SiO2–27 Na2O–10 mass% B2O3 was synthesized by mixing powder reagents of silicon dioxide, sodium carbonate (special grade of FUJIFILM Wako Pure Chemical Corporation, Osaka, Japan), and boron trioxide (special grade of Mitsuwa Chemicals Co. Ltd., Osaka, Japan) in a mortar, melting the mixture in a Pt–Rh crucible at 1673 K in air, and pouring the melt onto a Cu plate for quenching. This glass composition was selected on the basis of the report by Nakamoto et al. [5] to maximize the apparent H2O content by the hydrothermal reaction. The sodium borosilicate glass was subjected to hydrothermal reaction by putting 1 g of the glass sample in the powder state and 5 mL of purified water in a sealed autoclave and heating the autoclave at 473 K for 2 h. The glass sample was placed in an inner Teflon crucible (inner diameter: 17 mm, height: 27 mm) and separated with water placed in an outer Teflon container (inner diameter: 30 mm, height: 40 mm) in the autoclave. The detailed conditions of the autoclave setup for the hydrothermal reaction can be found elsewhere [10]. After the hydrothermal reaction, the resulting sample was dried in the oven at 353 K overnight to remove the condensed water, and then, the H2O-bearing glass was obtained. The H2O-bearing glass was then reheated in a 1000-W microwave oven (Model ER-J6, Toshiba Corporation, Tokyo, Japan) for 30 s to make a porous glass after the foaming behavior. The X-ray diffraction analysis was performed for powders of the original glass, the hydrothermally treated glass and the porous glass (see Figure S2 in supplementary materials), and it was confirmed that all of the samples were glassy and no crystalline phases were found.
The near-IR absorbance of each sample was evaluated by measuring the relative diffuse reflectance using a UV–Vis–NIR spectrophotometer (Model UV-3600, Shimadzu Corporation, Kyoto, Japan) in the wavelength range between 730 and 2500 nm; barium sulfate powder was used as the reference material. The absolute spectral reflectivity of each sample was then determined by multiplying the absolute spectral reflectivity of the reference material by the measured relative reflectance, where the absolute reflectivity data of barium sulfate powder was obtained from the report by Grum et al. [36].
Oxygen K-edge XANES measurement for each sample was conducted at beamline BL-11 at the Ritsumeikan University SR Center, Shiga, Japan. Each sample was prepared as a powder, which was placed on an indium sheet attached to a holder with conductive carbon tape. The holder with the sample was then placed in the transfer vessel. The above preparation was performed in a glove box placed under vacuum and then filled with purified Ar gas to reduce moisture in the atmosphere. After the vessel was set, the X-ray absorption spectroscopy measurement apparatus originally built in the SR center was placed under vacuum at 10−6 Pa. Finally, the O K-edge XANES spectra were measured in the range between 520 and 600 eV using a KTP (011) spectroscopic crystal, where the resolution of the X-ray energy ( Δ E / E ) was approximately 6.5 × 10 4 .

Supplementary Materials

Figure S1: Porous glass expanded in a transparent glass tube, showing condensed water emitted from the hydrothermally treated glass when heated. Figure S2: X-ray diffraction patterns of sodium borosilicate glass powders as prepared, after hydrothermal treatment and reheating by microwave oven (porous glass), where Cu Kα radiation was used.

Author Contributions

Conceptualization, M.S. and T.T.; methodology, M.S. and N.U.; validation, M.S., N.U., and S.M.; formal analysis, M.S.; investigation, S.M.; resources, S.M.; data curation, S.M. and M.S.; writing—original draft preparation, M.S.; writing—review and editing, N.U. and T.T.; visualization, M.S.; supervision, T.T.; project administration, M.S.

Funding

This research received no external funding.

Acknowledgments

The presented oxygen K-edge X-ray absorption spectroscopy measurements were performed at the BL-11 beamline of the SR Center, Ristumeikan University (Shiga, Japan), through application S18018 with assistance from Dr. Hirona Yamagishi and Prof. Toshiaki Ohta (The SR Center), and the BL1N2 beamline of the Aichi Synchrotron Center (Aichi, Japan), through application 20184061 with assistance from Dr. Akiko Nozaki (Aichi Synchrotron Center). We would also like to thank Tiffany Jain, M.S., from Edanz Group (www.edanzediting.com/ac) for editing a draft of this manuscript.

Conflicts of Interest

The authors declare no conflict of interest.

References

  1. Suzuki, M.; Tanaka, T.; Yamasaki, N. Use of hydrothermal reactions for slag/glass recycling to fabricate porous materials. Curr. Opin. Chem. Eng. 2014, 3, 7–12. [Google Scholar] [CrossRef]
  2. Suzuki, M.; Tanaka, T. Hydrothermal slag/glass chemistry for porous materials production. Key Eng. Sci. 2012, 521, 35–45. [Google Scholar] [CrossRef]
  3. Matamoros-Veloza, Z.; Yanagisawa, K.; Rendon-Angeles, J.C.; Yamasaki, N. Preparation of porous materials from hydrothermal hot pressed glass compacts. J. Mater. Sci. Lett. 2002, 21, 1855–1858. [Google Scholar] [CrossRef]
  4. Matamoros-Veloza, Z.; Yanagisawa, K.; Rendon-Angeles, J.C.; Oishi, S. The effect of hydrothermal hot-pressing parameters on the fabrication of porous ceramics using waste glass. J. Phys. Condens. Matter 2004, 16, S1361–S1372. [Google Scholar] [CrossRef]
  5. Nakamoto, M.; Lee, J.; Tanaka, T.; Ikeda, J.; Inagaki, S. Application of hydrothermal treatment on BF slag and waste glass for preparing lubricant materials in high strain rolling for ultrafine-grained steel production. ISIJ Int. 2005, 45, 1567–1571. [Google Scholar] [CrossRef]
  6. Nakamoto, M.; Lee, J.; Tanaka, T. Design of lubricants using waste slag in large strain addition strip processing for ultrafine-grained steels. Mat. Sci. Forum 2006, 512, 319–324. [Google Scholar] [CrossRef]
  7. Yoshikawa, T.; Sato, S.; Tanaka, T. Fabrication of low temperature forming glass materials using hydrothermal treatment. ISIJ Int. 2008, 48, 130–133. [Google Scholar] [CrossRef]
  8. Tanaka, T.; Yoshikawa, T.; Suzuki, M. Design of Porous Glass & Slag Materials and Its Application to Refining. In Proceedings of the VIII International Conference on Molten Slags, Fluxes and Salts, Santiago, Chile, 19–21 January 2009; Sanchez, M., Parra, R., Riveros, G., Diaz, C., Eds.; pp. 555–564. [Google Scholar]
  9. Yoshikawa, T.; Kasamatsu, K.; Kanata, T.; Hirai, N.; Tanaka, T.; Yamasaki, N. Fabrication of porous glass supporting silver ultrafine particles after hydrothermal treatment and microwave heating. J. Jpn. Inst. Met. 2011, 75, 665–670. [Google Scholar] [CrossRef]
  10. Suzuki, M.; Yamamoto, T.; Kuwata, S.; Derin, B.; Yamasaki, N.; Tanaka, T. Fabricating porous glass with needle-shaped hydrate crystals by hydrothermal treatment of blast-furnace slag and borosilicate glass mixture. Mater. Trans. 2013, 54, 1741–1749. [Google Scholar] [CrossRef]
  11. Goh, C.Y.; Suzuki, M.; Tanaka, T.; Murayama, N. Fabricating porous glass using hydrothermal reaction for application to toxic ion removal from polluted water. In Proceedings of the MJIIT-JUC Joint International, Symposium 2016, Kuala Lumpur, Malaysia, 6–7 September 2016; Mohamad, S.E., Ed.; MJIIT: Kuala Lumpur, Malaysia, 2016. [Google Scholar]
  12. Elmes, V.K.; Edgar, B.N.; Mendham, A.P.; Coleman, N.J. Basic metallosilicate catalysts from waste green container glass. Ceram. Int. 2018, 44, 17069–17073. [Google Scholar] [CrossRef]
  13. Gattullo, C.E.; D’Alessandro, C.; Allegretta, I.; Porfido, C.; Spagnuolo, M.; Terzano, R. Alkaline hydrothermal stabilization of Cr(VI) in soil using glass and aluminum from recycled municipal solid wastes. J. Hazard. Mater. 2018, 344, 381–389. [Google Scholar] [CrossRef] [PubMed]
  14. Kamitani, M.; Tagami, T.; Fukuya, T.; Kondo, M.; Hiki, T.; Nakahira, A. Synthesis of A-Type zeolite from flat glass recycle by hydrothermal treatments and its evaluation. Key Eng. Sci. 2014, 616, 183–187. [Google Scholar] [CrossRef]
  15. Ma, Q.; Cheng, H.; Yu, Y.; Huang, Y.; Lu, Q.; Han, S.; Chen, J.; Wang, R.; Fane, A.G.; Zhang, H. Preparation of Superhydrophilic and Underwater Superoleophobic Nanofiber-Based Meshes from Waste Glass for Multifunctional Oil/Water Separation. Small 2017, 13, 1700391. [Google Scholar] [CrossRef] [PubMed]
  16. Duraisamy, S.; Priyadarshini, B.G. Enhancing the Optical Behavior of Glass Surface by Creation of Microstructures in Single-Step Hydrothermal Wet Etching. ChemistrySelect 2018, 3, 11494–11504. [Google Scholar] [CrossRef]
  17. Luo, J.; Huynh, H.; Pantano, C.G.; Kim, S.H. Hydrothermal reactions of soda lime silica glass—Revealing subsurface damage and alteration of mechanical properties and chemical structure of glass surfaces. J. Non-Cryst. Solids 2016, 452, 93–101. [Google Scholar] [CrossRef]
  18. Warren, B.E.; Biscoe, J. Fourier analysis of X-ray patterns of soda-silica glass. J. Am. Ceram. Soc. 1938, 21, 259–265. [Google Scholar] [CrossRef]
  19. Greaves, G.N.; Fontaine, A.; Lagarde, P.; Raoux, D.; Gurman, S.J. Local structure of silicate glasses. Nature 1981, 293, 611–616. [Google Scholar] [CrossRef]
  20. Yun, Y.H.; Bray, P.J. Nuclear magnetic resonance studies of the glasses in the system Na2O-B2O3-SiO2. J. Non-Cryst. Solids 1978, 27, 363–380. [Google Scholar] [CrossRef]
  21. Tomozawa, M. Water in Glass. J. Non-Cryst. Solids 1985, 73, 197–204. [Google Scholar] [CrossRef]
  22. Kronenberg, A.K. Hydrogen speciation and chemical weakening of quartz. In Silica: Physical Behavior, Geochemistry, and Materials Applications; Heaney, P.J., Prewitt, C.T., Gibbs, G.V., Eds.; Mineralogical Society of America: Chantilly, VA, USA, 1994; Volume 29, pp. 123–176. [Google Scholar]
  23. Amma, S.; Kim, S.H.; Pantano, C.G. Analysis of Water and Hydroxyl Species in Soda Lime Glass Surfaces Using Attenuated Total Reflection (ATR)-IR Spectroscopy. J. Am. Ceram. Soc. 2016, 99, 128–134. [Google Scholar] [CrossRef]
  24. Frost, R.L.; Mako, E.; Kristof, J.; Kloprogge, J.T. Modificaiton of kaolinite surfaces through mechanochemical treatment—A mid-IR and near-IR spectroscopic study. Spectrochim. Acta A 2002, 58, 2849–2859. [Google Scholar] [CrossRef]
  25. Baker, G.J.; Greaves, G.N.; Surman, M.; Oversluizen, M. An oxygen XAFS study of sodium disilicate glass surfaces. Nucl. Instrum. Methods Phys. Res. B 1995, 97, 375–382. [Google Scholar] [CrossRef]
  26. Wang, H.M.; Henderson, G.S. Investigation of coordination number in silicate and germinate glasses using O K-edge X-ray absorption spectroscopy. Chem. Geol. 2004, 213, 17–30. [Google Scholar] [CrossRef]
  27. Henderson, G.S.; Neuville, D.R.; Cormier, L. An O K-edge XANES study of calcium aluminates. Can. J. Chem. 2007, 85, 801–805. [Google Scholar] [CrossRef]
  28. Henderson, G.S.; Neuville, D.R.; Cormier, L. An O K-edge XANES study of glasses and crystals in the CaO-Al2O3-SiO2 (CAS) system. Chem. Geol. 2009, 259, 54–62. [Google Scholar] [CrossRef]
  29. Nesbitt, H.W.; Henderson, G.S.; Bancroft, G.M.; Ho, R. Experimental evidence for Na coordination to bridging oxygen in Na-silicate glasses: Implications for spectroscopic studies and for the modified random network model. J. Non-Cryst. Solids 2015, 409, 139–148. [Google Scholar] [CrossRef]
  30. Stolen, R.H.; Walrafen, G.E. Water and its relation to broken bond defects in fused silica. J. Chem. Phys. 1976, 64, 2623–2631. [Google Scholar] [CrossRef]
  31. Doyle, C.S.; Kendelewicz, T.; Bostick, B.C.; Brown, G.E., Jr. Soft X-ray spectroscopic studies of the reaction of fractured pyrite surfaces with Cr(VI)-containing aqueous solutions. Geochim. Cosmochim. Acta 2004, 68, 4287–4299. [Google Scholar] [CrossRef]
  32. Nagasaka, M.; Kondoh, H.; Amemiya, K.; Nambu, A.; Nakai, I.; Shimada, T.; Ohta, T. Water formation reaction on Pt (111): Near edge X-ray absorption fine structure experiments and kinetic Monte Carlo simulations. J. Chem. Phys. 2003, 119, 9233–9241. [Google Scholar] [CrossRef]
  33. Wu, X.L.; Xiong, S.J.; Wang, J.; Shen, J.C.; Chu, P.K. Identification of surface structures on 3C-SiC nanocrystals with hydrogen and hydroxyl bonding by photoluminescence. Nano Lett. 2009, 9, 4053–4060. [Google Scholar] [CrossRef] [PubMed]
  34. Wang, H.; Wu, L.; Jiao, J.; Zhou, J.; Xu, Y.; Zhang, H.; Jiang, Z.; Shen, B.; Wang, Z. Covalent interaction enhanced electromagnetic wave absorption in SiC/Co hybrid nanowires. J. Mater. Chem. A 2015, 3, 6517–6525. [Google Scholar] [CrossRef]
  35. Luo, Y.R. Comprehensive Handbook of Chemical Bond Energies, 1st ed.; CRC Press: Boca Raton, FL, USA, 2007; pp. 56–60. [Google Scholar]
  36. Grum, F.; Luckey, G.W. Optical sphere paint and a working standard of reflectance. Appl. Opt. 1968, 7, 2289–2294. [Google Scholar] [CrossRef] [PubMed]
Sample Availability: Samples of the porous glass prepared by the hydrothermal reaction of sodium borosilicate glass are available from the authors.
Figure 1. (a) Appearance of H2O-bearing glass after hydrothermal reaction. (b) Appearance of porous glass obtained by reheating the H2O-bearing glass. (c) Cross-sectional SEM image of microstructure of porous glass.
Molecules 24 03488 g001
Figure 2. Near-IR absorbance spectra of glass samples. The solid lines are the observed spectra, and the dashed lines are fitted baselines estimated using polynomial functions.
Molecules 24 03488 g002
Figure 3. Oxygen K-edge X-ray absorption near-edge structure (XANES) spectra of porous glass and original sodium borosilicate glass observed in partial electron yield (PEY) mode. The spectra for SiO2 and 70% SiO2–30 Na2O (in mass %) glasses are provided as reference materials for non-bridging oxygen and bridging oxygen ions.
Molecules 24 03488 g003
Figure 4. Oxygen K-edge XANES spectra of porous glass obtained using different collection modes. The PEY and TEY modes reflect the ionic structure in surface area, whereas the TFY mode reflects that in the bulk.
Molecules 24 03488 g004
Figure 5. Schematic illustration of H2O vapor emission from glass microscopic structure when reheating the hydrothermally treated glass.
Molecules 24 03488 g005

