Abstract
Tea aroma is a key indicator for evaluating tea quality. Although notable success in tea aroma improvement has been achieved with heterosis breeding technology, the molecular basis underlying heterosis remains largely unexplored. Thus, the present report studies the tea plant volatile heterosis using a high-throughput next-generation RNA-seq strategy and gas chromatography–mass spectrometry. Phenotypically, we found higher terpenoid volatile and green leaf volatile contents by gas chromatography–mass spectrometry in the F1 hybrids than in their parental lines. Volatile heterosis was obvious in both F1 hybrids. At the molecular level, the comparative transcriptomics analysis revealed that approximately 41% (9027 of 21,995) of the genes showed non-additive expression, whereas only 7.83% (1723 of 21,995) showed additive expression. Among the non-additive genes, 42.1% showed high parental dominance and 17.6% showed over-dominance. Among different expression genes with high parental dominance and over-dominance expression patterns, KEGG and GO analyses found that plant hormone signal transduction, tea plant physiological process related pathways and most pathways associated with tea tree volatiles were enriched. In addition, we identified multiple genes (CsDXS, CsAATC2, CsSPLA2, etc.) and transcription factors (CsMYB1, CsbHLH79, CsWRKY40, etc.) that played important roles in tea volatile heterosis. Based on transcriptome and metabolite profiling, we conclude that non-additive action plays a major role in tea volatile heterosis. Genes and transcription factors involved in tea volatiles showing over-dominance expression patterns can be considered candidate genes and provide novel clues for breeding high-volatile tea varieties.
1. Introduction
Heterosis, or hybrid vigor, which is widely used in agricultural production practice, refers to the phenomenon in which a hybrid progeny has a greater biomass and higher yield and quality than the parents [1]. Since the 20th century, the heterosis breeding technology has been widely applied in cucumber, tomato, corn and other horticultural crops due to the merits shown by the F1 generation [2]. A convincing example is that successful utilization of heterosis has dramatically increased corn production over the last century [3]. To date, three competing but non-mutually exclusive genetic models have been invoked to explain heterosis in both plants and animals, including epistasis [4], overdominance [5] and dominance [6]. However, these classic hypotheses do not fully interpret the exceptional performance of hybrid offspring.
The popularity of sequencing technology has driven an unprecedented development of omics [7]. Attempts by breeders and scientists to expound on the genetic mechanism of heterosis at the molecular level show promise [8,9]. In the super hybrid rice WFYT025, some key genes showing overdominant effects were mapped near QTLs involved with grain number, which might lead to the grain number heterosis [10]. In Nicotiana tabacum L., the key genes involved in nicotine anabolism and transport in the hybrid demonstrated an over-dominant performance that might be the main contributor to nicotine content heterosis [11]. Furthermore, recent research found that the d differentially expressed genes (DEGs) in plant hormone metabolic pathways with up- or down-regulated expression promoted the generation of hybrid vigor. For example, in Arabidopsis thaliana, upregulated expression of the transcription factor PHYTOCHROME-INTERACTING FACTOR (PIF4) targets the auxin biosynthesis gene YUCCA8 and the auxin signaling gene IAA29 may contribute to biomass heterosis [12]. Lower endogenous SA concentrations and down-regulated target gene responses has been found in larger hybrid progeny compared to those of their parental lines [13].
Tea aroma is an important end-user quality parameter of tea products as well as a key indicator for evaluation of tea quality [14,15]. Among these compounds, terpenoid volatiles (TVs) and green leaf volatiles (GLVs) are considered the most critical volatiles for tea aroma, since their content is typically high and thresholds are relatively low [16,17]. In plants, all TVs are derived from two common precursors—isopentenyl diphosphate (IPP) and dimethylallyl pyrophosphate (DMAPP)—that are synthesized by two independent pathways, the cytoplasm mevalonate (MVA) and plastidial methylerythritol phosphate (MEP) pathways [18]. 1-Deoxy-D-xylulose-5-phosphate synthase (DXS gene) and acetyl-Co A C-acetyltransferase (AACT gene) are the first key committed enzymes in the MEP and MVA pathways, respectively, and they play important roles in TV biosynthesis [19,20]. Subsequently, the generation of TVs is catalyzed sequentially by a series of enzymes. GLVs are biosynthesized from linoleic and linolenic acids through the lipoxygenase (LOX) pathway [21]. In the LOX pathway, some important genes involved in this reaction include SPLA2, which is the first committed enzyme.
Tea is known worldwide for its unique flavor and health benefits [22]. Heterosis breeding technology has achieved notable success in tea breeding. Both the tea cultivars Camellia sinensis cv. Jinguanyin (JGY) and Camellia sinensis cv. Huangguanyin (HGY) are successful examples of the use of heterosis, because their processed tea products have richer floral and fruity flavors than their parental lines. However, little is known about the molecular mechanisms of aroma heterosis in the tea plant. In the present study, we found that the volatile hybrids content was considerably higher than those of the parents by using TD-GC-MS. Comparative transcriptomics analyses of leaves from the two F1 hybrids and their parental lines were conducted to explore potential molecular mechanisms. In particular, function enrichment analysis was performed for a series of genes that were expressed at higher levels in the offspring than in their parents, and we discover multiple genes associated with aroma heterosis. Our research provides comprehensive and novel insights into the formation of aroma heterosis and new ideas for tea tree hybrid breeding.
2. Results
2.1. The Volatile Content was Significantly Increased in Tea Leaves from the F1 Hybrids
The green leaf volatiles monoterpene and sesquiterpene contribute the most to the aroma of tea. We measured green leaf volatiles and terpenes in fresh tea leaves by GC-MS. As shown in Table 1, significant differences were found in the volatile contents among the four different varieties, and obvious aroma heterosis was observed in both F1 generation plants. The total GLV and the mono- and sesquiterpene contents in both F1 generation plants were higher than those of their parental lines. In particular, the GLVs and monoterpene in JGY and mono- and sesquiterpene in HGY were significantly higher than those of their parental lines. We observed that most types of GLVs and monoterpene in the JGY strain, such as hexanal, (Z)-2-hexen-1-ol, linalool and geraniol, were significantly higher than the contents in the parent. Similarly, most types of sesquiterpenes, such as germacrene D, and cubenene, were present at significantly higher levels than those in the parent. In addition, the mid-parent heterosis value (MPV) and Over high-parent heterosis value (OPV) were calculated to better understand the degree of heterosis in both F1 generation plants. As shown in Table 2, the sesquiterpene content MPV of HGY was higher than the OPV (over high-parent heterosis value) and MPV in HGY, but the monoterpene content MPV of JGY was higher than HGY. To summarize, the results indicate that the JGY and HGY hybrids demonstrate significant volatile heterosis. Specifically, although both F1 generation tea plants showed volatile heterosis, differences existed between the volatile compound proportions of the two tea varieties.

Table 1.
Volatiles content of F1 hybrids and their parents (HD × TGY) (ng/g).
Table 2.
Heterosis of volatiles content of hybrid combination (HD × TGY) in tea.
2.2. Higher Gene Expression Similarities were Observed Between the Two F1 Hybrids Than with the Parental Lines
A cDNA library was constructed with the RNA extracted from the young leaf (one bud and two leaves) samples from the four tea plant varieties (HD, HGY, JGY and TGY). In general, three replicate transcriptome sequences were generated for each tea variety, and a total of 280,000,808 bp raw reads were generated from HD, HGY, JGY and TGY. A total of 272,617,358 clean reads were obtained without adapters after filtering low-quality and N-containing sequences. A total of 40.98 Gb of clean bases was generated from these four tea plants with an error rate of 0.01%, and the average Q20 and Q30 values of those samples were 98.98% and 97.03%, respectively. The average GC content proportion of those samples was 45.49% (Table 3). In addition, we generated 41, 781 genes (one with a FPKM > 0), including 11, 288 novel genes and 30,493 known genes, using the Cufflinks and Cuffmerge software.
Table 3.
Sequencing data statistics derived from HD, HGY, JGY and TGY.
To investigate differences in gene expression patterns among the F1 generation and parental lines, 9015 differentially expressed genes (DEGs) were subjected to hierarchical clustering analysis of transcript abundances using the FPKM values. The heat map of the DEGs (Figure 1a) indicated that JGY and HGY had more similar transcriptome profiles than TGY and HD. Some genes with higher expression than those of the parental lines were observed in JGY and HGY. To further discover the heterosis and differences between each tea plant at the transcriptome level, we conducted a comparative analysis between the F1 hybrids and HD or TGY, between the two parents and between the two F1 hybrids at a level of p > 0.05 and fold change ≥2.
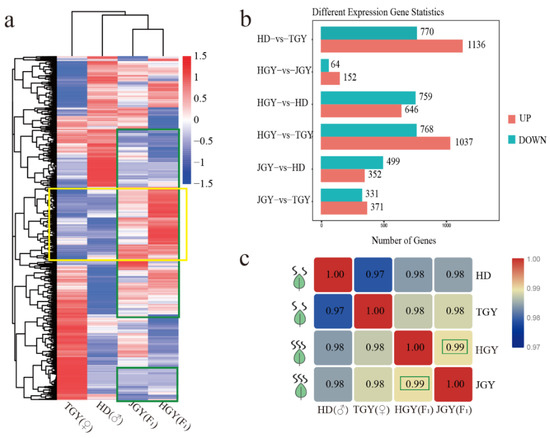
Figure 1.
Comparative analysis of the expressed genes detected in two F1 hybrid and parental lines. (a) Heat map of DEGs from four different tea cultivar. Clustering by relative expression level value log2 (ratios) of differential genes. Similarly expressed genes between two F1 hybrids were boxed by green and higher expressed genes than parental were boxed by yellow. Red indicates high expression and green indicates low expression (b). Differentially expressed genes between different tea varieties at level of p > 0.05 and fold change ≥2. (c). Correlation matrix of two hybrids and their parents calculated by all the detected genes, two F1 hybrids correlation coefficient were boxed.
As shown in Figure 1b, the least DEGs (64 down- and 152 up-regulated genes) were observed between the two F1 hybrids, which may be due to the same genetic background. Moreover, the correlations among all of the expressed genes proved that the two hybrids achieved the highest correlation coefficient (R = 0.99). These results indicated that the two F1 hybrids had similar gene expression patterns (Figure 1c).
2.3. Expression Level Dominance in the Tea Leaf Transcriptome
To understand the heterosis phenomenon in tea plants comprehensively at the molecular level, a total of 41, 781 genes in the F1 hybrids and parental lines were subjected to trend analysis. As described previously (Materials and Methods) and shown in Figure 2, C1–C4 showed additive expression (~4.12%, 1723 of 41,781), whereas C5-C10 showed non-additive expression (~21.6%, 9027 of 41,781). In particular, C5-C6 showed higher-parental dominance (~9.1%, 3804 of 41,781), whereas C7 and C8 showed lower-parental dominance (~5.6%, 2338 of 41,781); additionally, C9 showed up-regulated overdominance (~3.8%, 1586 of 41,781), whereas C10 showed down-regulated overdominance (~3.1%, 1299 of 41,781). In these 10 expression patterns, the higher-parent dominance pattern (C5–C6) had the highest proportion. In total, hybridization activates most genes in the hybrid progeny, and thus these genes show higher-parent dominance or overdominance. Specific information was listed in Table S2.
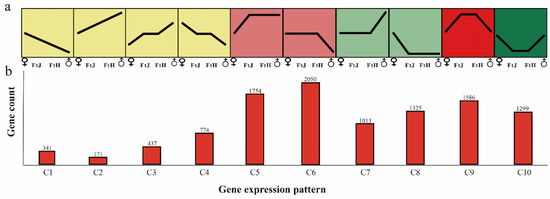
Figure 2.
Ten gene expression patterns involved in additive or non-additive expression. (a) Expression patterns of 10 types of genes. “♂” means male parent; “♀” means female parent; “F1J” means JGY; “F1H” means HGY. (b) The gene number of each pattern. “C” means gene cluster.
To investigate the functions of the genes with a higher-parent dominance pattern and up-regulated overdominance, KEGG and GO enrichment analyses were conducted. The genes involved in higher-parent dominance were enriched (Figure 3a and Table S7). The results indicated that the DEGs were predominantly enriched in “plant-pathogen interaction” and “glutathione metabolism”. In addition, some KEGG pathways involved in plant volatile were enriched, such as “linoleic acid metabolism” and “sesquiterpenoid and triterpenoid biosynthesis”. The genes involved in up-regulated overdominance were also enriched (Figure 3b and Table S8). The enriched genes in the KEGG pathway were involved in terpenoid backbone biosynthesis. Some KEGG pathways involved in plant energy metabolism, such as “pentose and glucuronate interconversions”, “pentose phosphate pathway” and “citrate cycle (TCA cycle)”, were enriched. In particular, the “plant hormone signal transduction” pathway was enriched.
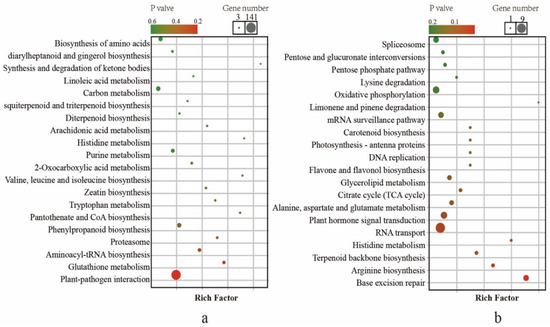
Figure 3.
KEGG pathway enrichment for differential gene expression among F1 hybrids and its parents. (a) KEGG analysis of gene with a higher-parent dominance pattern. (b) KEGG analysis of gene with an over-parent dominance pattern.
Further analysis of DEGs with a higher-parent dominance pattern indicated that these GO terms were mainly involved in morphological development (trichome morphogenesis, GO:0010090; plant epidermis morphogenesis, GO:0090626 and cell morphogenesis involved in differentiation, GO:0000904), phosphorus and nitrogen metabolic processes (phosphorus metabolic process, GO:0006793; nitrogen metabolic process, GO:1901566; and asparagine biosynthetic process, GO:0006529) and tea plant defense response (defense response, GO:0006952; defense response to bacterium, GO:0009617; and response to stimulus, GO:0050896). The GO terms of DEGs with up-regulated overdominance mainly were involved in volatile biosynthesis, including the isoprenoid biosynthetic process (GO:0008299), terpenoid biosynthetic process (GO:0016114) and terpenoid metabolic process (GO:0006721) (Table 4).
Table 4.
GO analysis of DEGs involved in higher parent dominance and up regulated overdominance.
2.4. Analysis of Pathways Related to Tea Aroma
Terpenoid volatiles, C6 aldehydes, alcohols, and their esters have a great contribution to the aroma of tea trees. To deeply investigate the mechanisms that regulate the biosynthesis of terpenoid volatiles, C6 aldehydes, alcohols and their esters in tea plants, we amply studied the core genes in the pathways and determined quantitative changes in aroma ingredients. In total, 21 DEGs involved in the terpenoid backbone biosynthesis pathway were annotated to encode nine structural genes, including acetyl-CoA C-acetyltransferase (AACT, 2), 3-hydroxy-3-methylglutaryl coenzyme A reductase (HMGCR, 2), mevalonate kinase (MVK, 1) 5-phosphomevalonate kinase (PMVK, 1), geranyl pyrophosphate synthase (GPS, 2) 1-deoxy-D-xylulose 5-phosphate synthase (DXS, 1), linalool synthase (LIS, 3), germacrene D synthase (GES, 2) and β-amyrin synthase (AS, 2). Among these genes, GES3, GES4, NMG1, LIS1, GPS1, AACT1, GPS2, and GES5 had the highest expression in HD. Similarly, HMGCR, AS1, and AS2 had the highest expression in TGY. Notably, MVK, DXS, HMGCR1, GES1, GES2, and AACT2 had higher expression in both HGY and JGY than in HD and TGY (Figure 4 and Table S5). The results indicated that the genes with higher expression in both HGY and JGY might contribute to the higher terpenoid accumulation in HGY and JGY.
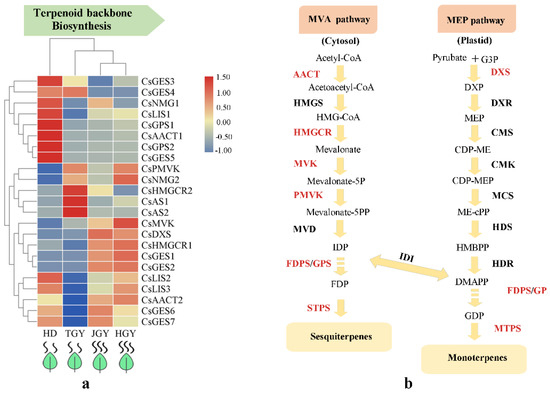
Figure 4.
Expression profiles of genes related to monoterpene and sesquiterpene biosynthesis. (a) Heat map of the expression pattern of related DEGs in four different tea variety. TBtools software was used for drawing heatmap and the function “scale” was used for normalized the data by rows (b) A simplified model of terpenoids pathway in tea plant.
In addition, we examined the DEGs that mapped to the LOX enzymatic pathway (Figure 5 and Table S6). A total of 13 DEGs were mapped to the LOX pathway, including alcohol dehydrogenase (ADH, 8), 13-lipoxygenase (13-LOX, 2), (Z)-3-hexen-1-ol acetyltransferase (CHAT, 1), alcohol acetyltransferase (AAT, 1) and secretory phospholipase A2 (SPLA2, 1). Among these DEGs, CsLOX2, CsADH7, and CsCHAT showed the highest expression in JGY. CsADH8, CsSPLA2, and CsLOX showed the highest expression in HGY. CsADH6 and CsADH2, CsADH3, and CsADH1 had the highest expression in HD and TGY, respectively. Further observation found that the DEGs CsADH8 and CsSPL2 had higher expression in both TGY and JGY than in HD and TGY. The results indicated that the high CsADH8 and CsSPL2 expression might contribute to the accumulation of C6 aldehydes, alcohols and their esters in HGY and JGY.
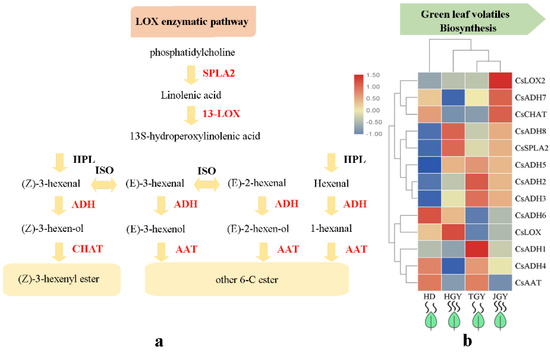
Figure 5.
Expression profiles of genes related to green leaf volatiles biosynthesis. (a) Heat map of the expression pattern of related DEGs in four different tea variety. TBtools software was used for drawing heatmap and the function “scale” was used for normalized the data by rows (b) A simplified model of LOX enzymatic pathway in tea plant.
2.5. Identification of TFs Involved in the Regulation of Tea Plant Aroma
Transcription factors play important roles in the regulation of volatile biosynthesis in plants. To further probe the reasons for the high volatile content in the F1 generation tea plants, we used SOM cluster analysis to screen out genes with similar expression patterns using genes that had higher expression levels in the F1 generation. As shown in Figure 6a, eight genes were clustered into eight different expression modules. In module Cluster_3_4, CsADH8 was located with the highest number of genes (503 genes). Among the 503 genes, 14 transcription factors (TFs) were identified using the iTAK (http://bioinfo.bti.cornell.edu/cgi-bin/itak/index.cgi) package. We also obtained some transcription factors with similar expression patterns in other modules. However, no TFs with the same expression patterns were identified in the module in which CsDXS was located (Figure 6b).
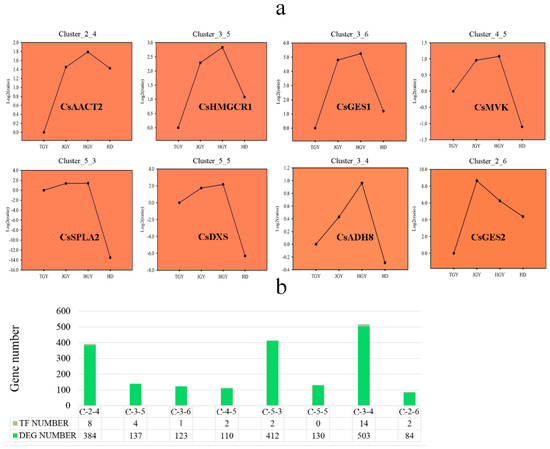
Figure 6.
Eight genes involved in volatile biosynthesis were analyzed by SOM (Self-Organizing Feature Map) cluster analysis with R package kohonen. (a) Line chart of different expression patterns cluster analysis. (b) Number of genes and TFs in different expression patterns.
To further evaluate correlations among the genes involved in volatile biosynthesis and the TFs identified by SOM (Supplementary File 3: Table S3), matrix correlation analysis was conducted with the SPSS software using Pearson’s correlation analysis (Supplementary File 4: Table S4).
As shown in Figure 7 and Table S4, the DEGs involved in volatile biosynthesis (CsAACT2, CsGES1, CsMVK, CsHMGCR1, CsSPLA2, CsADH8 and CsGES2) were positively correlated with TFs (CsMYB1, CsMYB3 and CsMYB4, CsbHLH79, CsbHLH121, etc.). Meanwhile, we observed a strong positive correlation between transcription factors (MYB1, HD2, etc.), especially transcription factors of the same family, which showed significant correlations (CsbHLH79/CsbHLH121 and CsMYB4/CsMYB1). The results indicated that TFs might participate in the biosynthesis process underlying tea plant volatile.
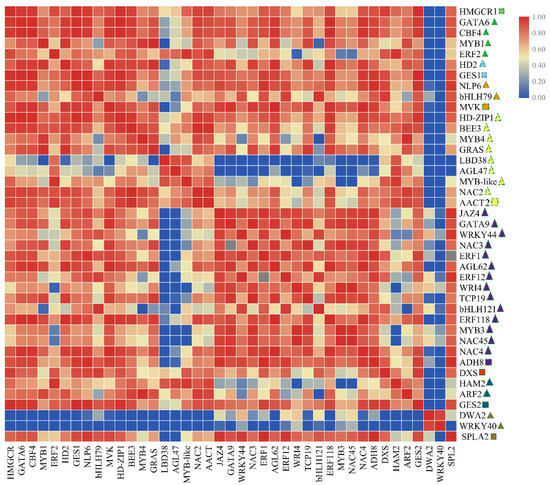
Figure 7.
The matrix correlation of genes and TFs involved in volatile biosynthesis (these genes and TFs expression in F1 generation are higher than parental lines). The heatmap drawing was conducted by correlation between genes analyzed by the Spearman test using SPSS 17.0 software and visualized by the TBtools software. Square indicates structural gene; Triangular indicates transcription factors; The same color indicates the same expression pattern in four tea tree.
2.6. Gene Expression Validated by qRT-PCR
To verify the accuracy of the transcriptome data, the transcript abundances of 13 selected DEGs were analyzed by qRT-PCR. In total, five key structural genes in the MVA pathway (CsAACT2, CsGES1, CsGES2, CsHMGCR1, and CsMVK), one key structural gene in the MEP pathway (CsDXS), two key structural genes in the LOX pathway (CsSPLA2 and CsADH8) and some TFs involved in these pathways were selected. Consistent color responses were detected between the qRT-PCR analysis and RNA-seq data (Figure 8). Consistent with the expected results, 13 DEGs were upregulated in the progeny. This result indicated that the transcriptome data and the results of our analysis are reliable.
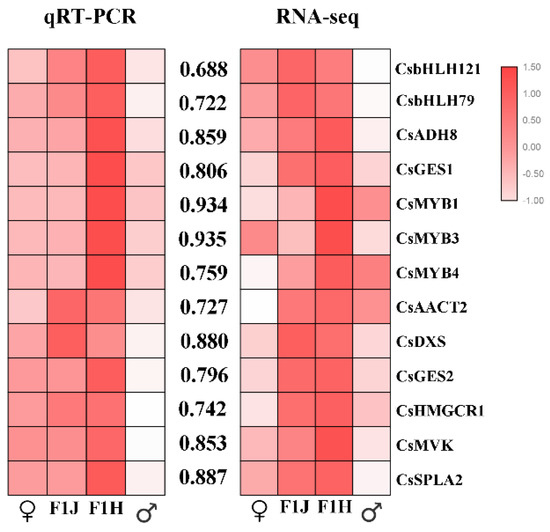
Figure 8.
Correlation analysis of candidate genes. The values between the two heatmaps represent correlation value between the expression profiles obtained from RNA-seq and RT-qPCR analysis for each gene. The heatmap drawing was conducted by correlation between genes analyzed by the Spearman test using SPSS 17.0 software and visualized by the TBtools software. “♂”means male parent; “♀” means female parent; “F1J” means JGY; “F1H” means HGY.
3. Discussion
Heterosis is widely used in cash crops. In tobacco, positive nicotine heterosis has been found in F1 hybrids [23]. In the present study, two offspring (JGY and HGY), superior for the TV and GLV concentrations, were identified using GC-MS (Table 1). Meanwhile, comparative transcriptome analysis was implemented for the tea F1 hybrid (JGY and HGY) and its two parental lines to study the molecular mechanisms contributing to tea volatile heterosis. Interestingly, we found very similar expression patterns and very few DEGs between offspring (Figure 1). KEGG and GO enrichment analysis found that the genes with non-additive expression in offspring were enriched in some pathways which were associated with tea plant volatiles. This result was in accordance with the volatile content of hybrid compared to the two parental lines. Hence, we can conclude that the genes with non-additive expression in offspring may contribute to volatile heterosis in tea plant.
3.1. More Meticulous inter-Gene Collaboration May Contribute to Heterosis
In the present study, the comparative transcriptome analysis confirmed similar global expression patterns and only a small proportion of differentially expressed genes between the hybrids. This result indicates the occurrence of a very similar transcriptional reprogramming event between tea F1 hybrids. Transcriptional reprogramming events appear to be common in the hybrid F1 generation and may play a major role in heterosis. In a tobacco intraspecific hybridization experiment, genes showing a significant higher-parental expression level dominance pattern were the main cause of nicotine heterosis [11]. The same result was also confirmed in Arabidopsis, in which overdominance and underdominance lead to heterosis [24,25]. Obviously, alteration in gene expression levels in the F1 hybrid generation is the molecular basis of heterosis [12]. Interestingly, similar expression patterns were observed in the two F1 hybrids in our study. In addition, hybrid progeny gene expression network analysis found that the hybrids possessed an enriched number of partial correlations at the genome-wide level compared to those of their parental lines [26]. These results may indicate that variation in gene expression in the F1 generation with heterosis is not in a random or disordered state but instead represents a series with tighter regulation. More meticulous inter-gene collaboration seems to enable plants to utilize resources more efficiently and thus to produce heterosis. This new perspective suggests that regulatory control of heterosis is achieved through successive cascades of gene activity, which has provided us with a better understanding of the phenomenon [27]. The explanation is based on more complicated epigenetic regulation.
3.2. Non-Additive Expression Plays A Dominant Role in The Formation of Tea Heterosis
A discussion of whether additive or non-additive gene expression patterns play a dominant role in the formation of heterosis has been ongoing for a long time. A large proportion of genes show additive expression patterns, which are considered to be the main cause of heterosis in both maize and rice hybrids and their inbred parents [28,29]. Analysis of immature ear tissues of maize also found that additive expression was the main reason for heterosis, whereas non-additive expression was negatively correlated with heterosis [30]. Some researchers believe that non-additive expression hinders the formation of plant heterosis [31]. Moreover, many studies have demonstrated that genes showing dominant or transgressive expression levels confer the F1 generation with a larger biomass and stronger adaptability. In Drosophila, a large proportion of genes showing non-additive expression patterns was considered the origin of heterosis [32]. Studies of maize [33], wheat [34], and cotton [35] reached the same conclusion. In this study, ~21.6% (9027 of 41,781) of the genes showed non-additive expression, whereas only ~4.12%, (1723 of 41,781) showed additive expression. Our conclusion is consistent with the latter pattern. Genes with non-additive expression play a key role in the volatile heterosis manifestation in tea plants. Among all of the non-additive genes, 42.1% showed higher-parent dominance and 17.6% showed overdominance. The classical genetic hypothesis indicates that the genomes from the two parents provide their advantageous alleles in the nucleus of the F1 hybrid, resulting in higher-parent dominance and leading to hybrid vigor [6]. The overdominance hypothesis indicates that heterogeneous combination of alleles from both parents generates a performance of “1 + 1 > 2” [5]. However, recent reports have suggested that non-additive expression might be influenced by the contribution of regulators, such as transcription factors (TFs), which seems to better explain the above phenomenon [36]. Indeed, we found that 33 TFs, which were highly correlated with volatile genes, exhibited differential expression in the hybrid compared with either parent.
Subsequently, we performed KEGG and GO enrichment analyses for the genes with non-additive expression. The results showed that some of the genes were enriched in pathways that were highly correlated with heterosis, such as “plant hormone signal transduction”. Recently, a breeder found that IAA-targeted gene activity was frequently correlated with a greater leaf cell number heterotic phenotype and that SA-targeted gene activity was negatively correlated with heterosis [13]. Increased expression of the transcription factor PIF4 may contribute to biomass heterosis by targeting the auxin signaling gene IAA29 [12]. Our results demonstrated that upregulated hormone-related genes in tea plants might contribute to basic development of the plants. Additionally, “biosynthesis of amino acids”, “carbon metabolism”, “citrate cycle (TCA cycle)”, and “alanine, aspartate and glutamate metabolism” are related to the basic metabolic activity of plants. Similarly, GO enrichment analysis found that plant energy metabolism GO terms were enriched, such as “phosphorus metabolic process”, “organonitrogen compound biosynthetic process” and “cellular nitrogen compound catabolic process”; plant development processes were also enriched, such as “trichome morphogenesis”, “plant epidermis development”, and “tissue development”. Although these pathways have not been reported to be related to heterosis in previous studies, they are closely related to physiological processes in tea plants and provide the necessary energy sources and structural components for tea plant volatile heterosis. Notably, we found that most pathways associated with tea plant volatiles were enriched, including the downstream pathways “diterpenoid biosynthesis” and “sesquiterpenoid and triterpenoid biosynthesis”, the upstream pathway “terpenoid backbone biosynthesis” and the GLV synthesis pathway “linoleic acid metabolism”. The GO enrichment analysis showed the same results (“terpenoid biosynthetic process”, “lipid biosynthetic process”, “terpenoid metabolic process” and “sesquiterpene synthase activity”). These non-additive genes involved in tea plant volatile biosynthesis may play key roles in tea plant volatile heterosis”.
3.3. Genes with Altered Expression Levels May Contribute to Volatile Heterosis
The MEP and MVA pathways involve a series of consecutive enzymes and are mainly responsible for the synthesis of isopentenyl diphosphate (IPP) and dimethylallyl pyrophosphate (DMAPP), respectively, which are the common precursor substances of terpenoid [18]. DXS is the first key rate-limiting enzyme in the MEP pathway [37]. Arabidopsis expressing a higher DXS level (overexpressors) demonstrates a higher isoprenoid final product level [38], and more than twice the accumulation of various isoprenoid final products was observed in potatoes and tomatoes overexpressing the DXS gene [39,40]. HMGCR is the first key rate-limiting enzyme in the MVA pathway [41]. Overexpression of PgHMGR1 enhanced terpenoid and sterol production in Arabidopsis and ginseng [42]. An embryo-lethal phenotype has been observed in A. thaliana with an AACT2 mutation, indicating that AtAACT2 plays an important role in isoprenoid synthesis [20]. MVK is a potential regulatory enzyme of the isoprenoid biosynthetic pathway [43]. In this study, CsDXS, CsHMGR1, CsAACT2, CsMVK and the terpene synthase gene (TPS) CsGES showed overdominance expression patterns in the tea hybrids. Correlation analysis found that the CsDXS expression level was significantly correlated with the total amount of monoterpenes in tea plants (r = 0.978, p = 0.022), whereas CsHMGR1 expression was correlated with total amount of sesquiterpenoids (r = 0.818). Similarly, we observed that CsADH8 and CsSPLA2 in the LOX enzymatic pathway were upregulated in the F1 hybrids. CsADH8 can reduce the aldehyde formed by HPL catalysis to the corresponding alcohol, which directly produces aroma substances [44]. In summary, these results indicate that these eight genes play pivotal roles in the formation of volatile heterosis in both JGY and HGY (Figure 9).
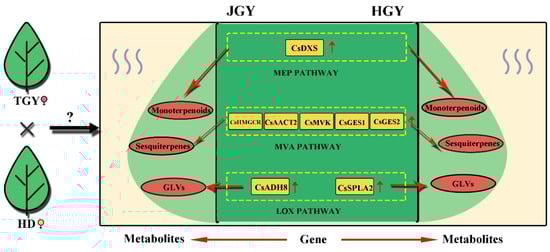
Figure 9.
Schematic diagram of key genes and metabolites of terpenoid and green leaf volatiles in F1 generation (HGY and JGY). Yellow square indicates gene with higher expression level in F1 generation than in parental line; Red oval indicates metabolite with higher content in F1 generation than in parental line. Solid line represents direct action.
3.4. Transcription Factors (Tfs) Probably Underlie Heterosis
TFs are an important cause of changes in gene expression. Researchers think one plausible molecular mechanism is that hybrids are caused by interactions between transcription factor allelic promoter regions [45]. We conducted SOM cluster analysis to filter out TFs that were correlated with the above eight genes. In this study, we identified 33 TFs that were upregulated in the F1 hybrids and correlated with the above eight genes. Previous studies found that ptMYB contributed to terpene synthesis in conifer trees similar to AtMYC in Arabidopsis [46,47]. WRKY3 and WRKY6 were found to be related to the accumulation of volatiles during continuous insect attacks in Nicotiana attenuate [48]. Three CsMYB (CsMYB1, CsMYB3 and CsMYB4), two CsMYC (CsbHLH79 and CsbHLH121) and two CsWRKY (CsWRKY40 and CsWRKY44) genes were identified among the 33 TFs. Furthermore, in addition to the seven reported TFs, the remaining 26 novel TFs may play an important role in volatile heterosis.
4. Materials and Methods
4.1. Plant Material Preparation
The parental lines (Camellia sinensis cv. Tieguanyin (TGY), female parent and Camellia sinensis cv. Huangdan (HD), male parent) and F1 hybrids (Camellia sinensis cv. Jinguanyin (JGY) and Camellia sinensis cv. Huangguanyin (HGY) were obtained from Ningde Vocational and Technical College (Fujian China, E119°66′ N27°10′) consistent with the tea plant growth period in May 2018. Indeed, all of tea plants were grown under the same cultivation practices. Shoot tips with two unfolded leaves samples were freshly picked as follows: each variety samples was picked from 10 tea trees, respectively, mixed as a biological repetition. A total of 300 g of fresh leaf samples were picked from each tea plant variety for detection of released volatiles and transcriptome analysis (100 g of tea leaves were harvested for each biological replicate; we collected three biological replicates from the four cultivars). All samples were packed with tinfoil, placed into liquid nitrogen and then maintained at −80 °C.
4.2. Thermal Desorption Combined with Gas Chromatography Mass Spectrometry (TD-GC-MS) Analysis of Volatile Compounds in the Leaves
First, we created a simple and efficient equipment to gather more tea volatiles (Figure 10). A total of 250 g of vacuum freeze-dried leaf samples (total 1000 g) was ground into powder and then filtered with 50 mesh sieves. Then, 5 g of ground tea powder was placed into a beaker with 100 mL of distilled boiling water, and 15 μL of ethyl decanoate (100 ppm) was added as an internal standard. Next, the beaker mouth was quickly sealed with a membrane (polytetrafluoroethylene) connected to an air pump (flow rate 0.2 L/min) through a pipe (polytetrafluoroethylene) with an adsorption tube (5 g of adsorbent). The beaker containing the tea mixture was placed on a heating plate (130 °C) for 30 min and shaken every 5 min. Finally, the enriched adsorption tube was placed on the thermal desorption autosampler.
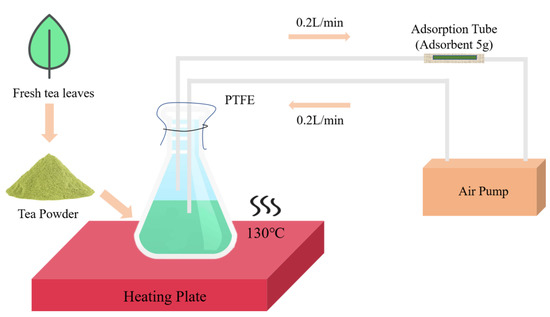
Figure 10.
Simplified sampling process.
The Auto TD A thermal desorption system (Colin Corporation, Chengdu, China) was used to gather tea volatiles. Tubes enriched with trapped volatiles from fresh tea leaves were totally desorbed (desorption time: 0.05 min, desorption temperature: 250 °C, flow: 35 mL/min, and split: 25 mL/min). Next, the volatilized component reached the cold trap (25 °C) and was desorbed (desorption temperature: 300 °C, flow: 35 mL/min, and split: 5 mL/min). Finally, the volatiles were carried by carrier gas into the gas chromatograph (transmission temperature: 200 °C, carrier gas pressure: 60.0 kPa, and valve temperature: 200 °C).
The TQ8040 GC-MS (Shimadzu Corporation, Kyoto, Japan) was used for analysis. Helium (99.99%) was used as the carrier gas (pressure: 49.5 kPa, total flow: 9 mL/min, column flow: 1 mL/min, line speed: 36.1 cm/s, purge flow: 3 mL/min, and split ratio: 5). The initial temperature of the column oven was set at 40 °C (3 min), and the inlet temperature was set at 240 °C. The column parameter was 30 m × 0.25 mm × 0.25 um. The MS conditions were as follows: ion source temperature: 230 °C; interface temperature: 280 °C; and total program time: 36 min. Specifically, the GC oven temperature was held at 40 °C for 3 min, increased to 120 °C for 5 min at a rate of 5 °C/min, and finally increased to 240 °C for 8 min at a rate of 30 °C/min. Every volatile compound was identified in the NIST library according to both its retention time and mass spectrum values. We calculated the relative concentration of the target released from the volatile using Wang’s method [49].
4.3. Transcriptome Sequencing Preparation and Data Analysis
Total RNA samples (four tea plant varieties with three replicates) were prepared using the pBIzol kit (BIOFLUX, Hangzhou Bori Technology Co., Ltd., Hangzhou, China), and RNA degradation and contamination were monitored on 1% agarose gels. The RNA purity was checked using a Nano Photometer spectrophotometer (IMPLEN, Los Angeles, CA, USA). The RNA concentration was measured using the Qubit RNA Assay Kit in a Qubit 2.0 Fluorometer (Life Technologies, Gaithersburg, MD, USA). RNA integrity was assessed using the RNA Nano 6000 Assay Kit for the Agilent Bioanalyzer 2100 system (Agilent Technologies, Santa Clara, CA, USA). After all samples were tested (RIN > 0.8), each RNA sample (2 μg) was used for library sequencing. The library construction and RNA-seq were performed by the Allwegene Biotechnology Corporation (Beijing, China) according to the manufacturer’s instructions. A total of 12 libraries (four samples with three biological replicates) were sequenced on the Hiseq 4000 platform (Illumina, San Diego, CA, USA).
4.4. Gene and Expression Annotation
The fastq files of the raw reads were filtered using in-house Perl scripts, and adapters and low-quality reads were removed by Trimmomatic (v0.33). Then, the GC contents and the Q20 and Q30 values of the clean data were calculated to ensure the accuracy of the downstream analyses based on these high-quality clean reads. The Trinity method was used for transcriptome assembly. Then, these clean reads were mapped to the tea plant reference genome sequence [50] by TopHat2 with the mismatch set to 2 by default and all other parameters set as the default values. Gene function was annotated based on the following databases: nr (NCBI nonredundant protein sequences); nt (NCBI nonredundant nucleotide sequences); Pfam (Protein family); KOG/COG (Clusters of Orthologous Groups of Proteins); Swiss-Prot (a manually annotated and reviewed protein sequence database); KO (KEGG Ortholog database); and GO (Gene Ontology). The gene expression levels of each sample were analyzed using the HTSeq software with the model set to union. The gene expression levels were measured using FPKM (Fragments per kilobase of exon model per million mapped reads) [51]. Read counts based on the gene expression level analysis were used for the gene differential expression analysis with DESeq (1.10.1). Typically, the standard for differential gene selection is a q-value<0.05.
4.5. Cluster and Trend Analysis
To identify genes with the same expression patterns, all genes were used for the SOM (Self-Organizing Feature Map) cluster analysis with the R package kohonen, which is an unsupervised learning neural network. We performed a trend analysis for all expressed genes. The parameter is |log2 (fold change)| >2 and a q-value <0.05. This trend analysis was performed at http://www.omicshare.com/tools.
4.6. Validation of the Accuracy of the Transcriptome Data by Quantitative Real-Time PCR Analysis
To validate the accuracy of the transcriptome data, 13 candidate genes involved in the volatiles synthesis pathways were selected. All specific primers for these genes were designed with the Primer6 software; the specific primer sequences are listed in detail in (Supplementary File 1: Table S1). RNA templates were harvested from four tea plant varieties (Tieguanyin, Huangguanyin, Jinguanyin and Huangdan) using the RNAprep Pure Plant Kit (polysaccharide- and polyphenolic-rich) (Tiangen, Beijing, China). cDNAs were synthesized from the RNA templates using the TransScript® One-Step gDNA Removal and cDNA Synthesis SuperMix (Transgen, Beijing, China). To achieve a higher synthesis efficiency, RNA templates, specific primers and RNase-free water were mixed first, incubated at 65°C for 5 min and then placed on ice for 2 min. Next, the remaining reaction components were added. The qRT-PCR was performed on the CFX96™ real-time PCR system (Bio-Rad, USA) with a 10 μL reaction volume using the TransStart Tip Green qPCR superMix kit (Transgen). GAPDH was selected as the reference gene. All samples were analyzed in three biological and three technical replicates, and the results were calculated using 2−ΔΔCT [52].
4.7. Definition of Expression Patterns of Degs Between F1 Hybrids and Parental Lines
According to the previously described method [35], a FPKM value (F1 hybrid) between the two parents of Vparent1 > Vhybrid1 > Vhybrid2 > Vparent2 or Vparent1 > Vhybrid1 = Vhybrid2 > Vparent2 was defined as an additive expression mode. An FPKM value (F1 hybrid) close to the higher parent value (Vparent1 = Vhybrid1 = Vhybrid2 > Vparent2) was defined as a higher-parental dominance expression mode, and a FPKM value (F1 hybrid) close to the lower parent value (Vparent1 = Vhybrid1 = Vhybrid2 < Vparent2) was defined as a lower-parent dominance expression mode. If the FPKM values of both hybrids were higher than those of the two parents, we defined this expression mode as upregulated overdominance; conversely, the opposite trend was defined as down-regulated overdominance. “>” means statistically higher (p < 0.05 and fold change ≥2), “<” means statistically lower (p < 0.05 and fold change ≥2) and “=” means statistically similar.
4.8. Statistical Analysis
All data were analyzed based on the results of T-tests using SPSS Statistics 17 (SPSS Inc., Chicago, IL, USA). The two sets of data are marked with different letters to indicate statistically significant differences (p-value < 0.05). Correlations were analyzed based on the Pearson analysis results. All data are presented as the mean ± standard error (SE, n = 3). The Mid-parent heterosis value (MPV) and Over high-parent heterosis value (OPV) was calculated as previous described [10]: MPV (%) = (F1 − MP)/MP × 100, HPV (%) = (F1 − HP)/HP × 100, F1 = performance of F1 generation, HP = performance of high-value parent, MP = mid-parent average [(Parent1 + Parent2)/2].
5. Conclusions
In this study, we conducted a comprehensive comparative transcriptional analysis of parental lines and their offspring to investigate possible molecular mechanisms leading to volatile heterosis in the tea plant. We systematically classified the acquired DEGs and found that non-additive expression was the main mode of inheritance. In addition, we found some genes and TFs that were significantly upregulated in pathways associated with tea volatile in the progeny. Overall, these data provide novel insights into the possible molecular mechanisms leading to volatile heterosis in the tea plant, which offers new opportunities for revealing the heterosis of higher volatiles.
Supplementary Materials
Table S1: The primer sequences used for qRT-PCR amplification; Table S2: Number of genes with different expression levels; Table S3: The result of SOM cluster analysis; Table S4: Correlation among the genes involved in volatile biosynthesis and the TFs identified by SOM; Table S5: FPKM value of the genes in the terpenoid backbone biosynthesis pathway; Table S6: FPKM value of the genes in the LOX pathway; Table S7: KEGG enrichment analyses for the genes involved in higher-parent dominance; Table S8: KEGG enrichment analyses for the genes involved in over-dominance.
Author Contributions
N.Y., C.Y., Y.S. and Y.Z. conceived and designed the project. Y.Z., X.C., and P.W. performed the experiments. All authors read and approved the final manuscript. Y.Z. and P.W. analyzed the data. Y.Z. wrote the manuscript. All authors read and approved the manuscript.
Funding
This study was funded by Fujian Province “2011 Collaborative Innovation Center” Chinese Oolong Tea Industry Innovation Center (Cultivation) special project (J2015-75) and National Modern Agriculture (tea) Industrial Technology System Construction special fund project (CARS-19) and Fujian Agriculture and Forestry University Science and Technology Innovation special fund project (CXZX2017181).
Acknowledgments
We appreciate Wenxi Wu and Yu Ting (Hengzheng Testing Co., Ltd. Fuzhou, China) for their technical support. We are also grateful to free online platform for data analysis (http://www.omicshare.com/tools).
Conflicts of Interest
The authors declare no conflict of interest.
Availability of Data and Material
Specific transcriptome sequencing results have been uploaded to the Sequence Read Archive database (SRA accession: PRJNA526005).
References
- Birchler, J.A.; Yao, H.; Chudalayandi, S.; Vaiman, D.; Veitia, R.A. Heterosis. Plant Cell 2010, 22, 2105–2112. [Google Scholar] [CrossRef] [PubMed]
- Duvick, D.N. Heterosis: Feeding People and Protecting Natural Resources. Genet. Exploit. Heterosis Crops 1997, 19–29. [Google Scholar]
- Duvick, D.N. Biotechnology in the 1930s: The development ofhybrid maize. Nat. Rev. Genet. 2001, 2, 69–74. [Google Scholar] [CrossRef] [PubMed]
- Frank, H.; Nadine, H. Towards the molecular basis of heterosis. Trends Plant Sci. 2007, 12, 427–432. [Google Scholar]
- Li, Z.K.; Luo, L.J.; Mei, H.W.; Shu, Q.Y.; Tabien, R.; Zhong, D.B.; Ying, C.S.; Stansel, J.W.; Khush, G.S.; Paterson, A.H. Overdominant epistatic loci are the primary genetic basis of inbreeding depression and heterosis in rice. II. Grain yield components. Genetics 2001, 158, 1737. [Google Scholar] [PubMed]
- Birchler, J.A.; Hong, Y.; Sivanandan, C. Unraveling the genetic basis of hybrid vigor. Proc. Natl. Acad. Sci. USA 2006, 103, 12957–12958. [Google Scholar] [CrossRef] [PubMed]
- Yadav, P.; Vaidya, E.; Rani, R.; Yadav, N.K.; Singh, B.K.; Rai, P.K.; Singh, D. Recent Perspective of Next Generation Sequencing: Applications in Molecular Plant Biology and Crop Improvement. Proc. Natl. Acad. Sci. India 2018, 88, 435–449. [Google Scholar] [CrossRef]
- Frisch, M.; Thiemann, A.; Fu, J.; Schrag, T.A.; Scholten, S.; Melchinger, A.E. Transcriptome-based distance measures for grouping of germplasm and prediction of hybrid performance in maize. Theor. Appl. Genet. 2010, 120, 441–450. [Google Scholar] [CrossRef]
- Pavani, M.; Sundaram, R.M.; Ramesha, M.S.; Kishor, P.B.K.; Kemparaju, K.B. Prediction of heterosis in rice based on divergence of morphological and molecular markers. J. Genet. 2018, 97, 1263–1279. [Google Scholar] [CrossRef]
- Chen, L.; Bian, J.; Shi, S.; Yu, J.; Khanzada, H.; Wassan, G.M.; Zhu, C.; Luo, X.; Tong, S.; Yang, X.; et al. Genetic analysis for the grain number heterosis of a super-hybrid rice WFYT025 combination using RNA-Seq. Rice 2018, 11, 37. [Google Scholar] [CrossRef]
- Tian, M.; Nie, Q.; Li, Z.; Zhang, J.; Liu, Y.; Long, Y.; Wang, Z.; Wang, G.; Liu, R. Transcriptomic analysis reveals overdominance playing a critical role in nicotine heterosis in Nicotiana tabacum L. BMC Plant Biol. 2018, 18, 48. [Google Scholar] [CrossRef] [PubMed]
- Wang, L.; Wu, L.M.; Greaves, I.K.; Zhu, A.; Dennis, E.S.; Peacock, W.J. PIF4-controlled auxin pathway contributes to hybrid vigor in Arabidopsis thaliana. Proc. Natl. Acad. Sci. USA 2017, 114, E3555–E3562. [Google Scholar] [CrossRef] [PubMed]
- Groszmann, M.; Gonzalez-Bayon, R.; Lyons, R.L.; Greaves, I.K.; Kazan, K.; Peacock, W.J.; Dennis, E.S. Hormone-regulated defense and stress response networks contribute to heterosis in Arabidopsis F1 hybrids. Proc. Natl. Acad. Sci. USA 2015, 112, E6397–E6406. [Google Scholar] [CrossRef] [PubMed]
- Yang, Z.; Baldermann, S.; Watanabe, N. Recent studies of the volatile compounds in tea. Food Res. Int. 2013, 53, 585–599. [Google Scholar] [CrossRef]
- Zeng, L.; Watanabe, N.; Yang, Z. Understanding the biosyntheses and stress response mechanisms of aroma compounds in tea (Camellia sinensis) to safely and effectively improve tea aroma. Crit. Rev. Food Sci. Nutr. 2018, 1–14. [Google Scholar] [CrossRef] [PubMed]
- Christian, S.; Peter, S. Characterization of the key aroma compounds in the beverage prepared from Darjeeling black tea: Quantitative differences between tea leaves and infusion. J. Agric. Food Chem. 2006, 54, 916–924. [Google Scholar]
- Hu, C.J.; LI, Da.; M, Y.X.; Zhang, W.; Lin, C.; Zheng, X.Q.; Liang, Y.R.; Lu, J.L. Formation mechanism of the oolong tea characteristic aroma during bruising and withering treatment. Food Chem. 2018, 269, 202–211. [Google Scholar] [CrossRef]
- Vranova, E.; Coman, D.; Gruissem, W. Network analysis of the MVA and MEP pathways for isoprenoid synthesis. Annu. Rev. Plant Biol. 2013, 64, 665–700. [Google Scholar] [CrossRef]
- Zhang, M.; Li, K.; Zhang, C.; Gai, J.; Yu, D. Identification and characterization of class 1 DXS gene encoding 1-deoxy-D-xylulose-5-phosphate synthase, the first committed enzyme of the MEP pathway from soybean. Mol. Biol. Rep. 2009, 36, 879–887. [Google Scholar] [CrossRef]
- Jin, H.; Song, Z.; Nikolau, B.J. Reverse genetic characterization of two paralogous acetoacetyl CoA thiolase genes in Arabidopsis reveals their importance in plant growth and development. Plant J. 2012, 70, 1015–1032. [Google Scholar] [CrossRef]
- Zhang, B.; Shen, J.Y.; Wei, W.W.; Xi, W.P.; Xu, C.J.; Ferguson, I.; Chen, K. Expression of genes associated with aroma formation derived from the fatty acid pathway during peach fruit ripening. J. Agric. Food Chem. 2010, 58, 6157–6165. [Google Scholar] [CrossRef] [PubMed]
- Butt, M.S.; Sultan, M.T. Green Tea: Nature’s Defense against Malignancies. Crit. Rev. Food Sci. Nutr. 2009, 49, 463–473. [Google Scholar] [CrossRef] [PubMed]
- Sabour, M.; Simmonds, J.; Setterfield, G. Variation in Nicotine Content of Cultured Cell Lines of Nicotiana Species and their Somatic and Sexual Hybrids. Plant Breed. 2010, 97, 324–333. [Google Scholar] [CrossRef]
- Marnik, V.; Fred, V.E.; Paul, V.H.; Martin, K.; Marc, Z. Genetic analysis of variation in gene expression in Arabidopsis thaliana. Genetics 2005, 171, 1267. [Google Scholar]
- Ryo, F.; Taylor, J.M.; Sachiko, S.; James, P.W.; Dennis, E.S. Heterosis of Arabidopsis hybrids between C24 and Col is associated with increased photosynthesis capacity. Proc. Natl. Acad. Sci. USA 2012, 109, 7109–7114. [Google Scholar]
- Andorf, S.; Selbig, J.; Altmann, T.; Poos, K.; Witucka-Wall, H.; Repsilber, D. Enriched partial correlations in genome-wide gene expression profiles of hybrids (A. thaliana): A systems biological approach towards the molecular basis of heterosis. Theor. Appl. Genet. 2010, 120, 249–259. [Google Scholar] [CrossRef] [PubMed]
- Chen, Z.J. Molecular mechanisms of polyploidy and hybrid vigor. Trends Plant Sci. 2010, 15, 57–71. [Google Scholar] [CrossRef]
- Ge, X.; Chen, W.; Song, S.; Wang, W.; Hu, S.; Yu, J. Transcriptomic profiling of mature embryo from an elite super-hybrid rice LYP9 and its parental lines. BMC Plant Boil. 2008, 8, 114. [Google Scholar] [CrossRef]
- Swanson-Wagner, R.A.; Jia, Y.; DeCook, R.; Borsuk, L.A.; Nettleton, D.; Schnable, P.S. All possible modes of gene action are observed in a global comparison of gene expression in a maize F1 hybrid and its inbred parents. Proc. Natl. Acad. Sci. 2006, 103, 6805–6810. [Google Scholar] [CrossRef]
- Guo, M.; Rupe, M.A.; Yang, X.; Crasta, O.; Zinselmeier, C.; Smith, O.S.; Bowen, B. Genome-wide transcript analysis of maize hybrids: allelic additive gene expression and yield heterosis. Theor. Appl. Genet. 2006, 113, 831–845. [Google Scholar] [CrossRef]
- Springer, N.M.; Stupar, R.M. Allelic variation and heterosis in maize: How do two halves make more than a whole? Genome Res. 2007, 17, 264–275. [Google Scholar] [CrossRef]
- Gibson, G.; Riley-Berger, R.; Harshman, L.; Kopp, A.; Vacha, S.; Nuzhdin, S.; Wayne, M. Extensive sex-specific nonadditivity of gene expression in Drosophila melanogaster. Genetics 2004, 167, 1791–1799. [Google Scholar] [CrossRef]
- Uzarowska, A.; Keller, B.; Piepho, H.P.; Schwarz, G.; Ingvardsen, C.; Wenzel, G.; Lubberstedt, T. Comparative expression profiling in meristems of inbred-hybrid triplets of maize based on morphological investigations of heterosis for plant height. Plant Mol. Biol. 2007, 63, 21–34. [Google Scholar] [CrossRef]
- Li, A.; Liu, D.; Wu, J.; Zhao, X.; Hao, M.; Geng, S.; Yan, J.; Jiang, X.; Zhang, L.; Wu, J.; et al. mRNA and Small RNA Transcriptomes Reveal Insights into Dynamic Homoeolog Regulation of Allopolyploid Heterosis in Nascent Hexaploid Wheat[W][OPEN]. Plant Cell 2014, 26, 1878–1900. [Google Scholar] [CrossRef]
- Yoo, M.J.; Szadkowski, E.; Wendel, J.F. Homoeolog expression bias and expression level dominance in allopolyploid cotton. Heredity 2013, 110, 171–180. [Google Scholar] [CrossRef]
- Birchler, J.A.; Riddle, N.C.; Auger, D.L.; Veitia, R.A. Dosage balance in gene regulation: Biological implications. Trends Genet. 2005, 21, 219–226. [Google Scholar] [CrossRef]
- Lange, B.M.; Wildung, M.R.; McCaskill, D.; Croteau, R. A family of transketolases that directs isoprenoid biosynthesis via a mevalonate-independent pathway. Proc. Natl. Acad. Sci. USA 1998, 95, 2100–2104. [Google Scholar] [CrossRef]
- Estevez, J.M.; Romero, C.K.H.; Jimenez, L.F.; Kuzuyama, T.S.H.; Kamiya, Y.; Leon, P.; Cantero, A. Analysis of the expression of CLA1, a gene that encodes the 1-deoxyxylulose 5-phosphate synthase of the 2-C-methyl-D-erythritol-4-phosphate pathway in Arabidopsis. Plant Physiol. 2000, 124, 95–103. [Google Scholar] [CrossRef]
- Morris, W.L.; Ducreux, L.J.M.; Hedden, P.; Millam, S.; Taylor, M.A. Overexpression of a bacterial 1-deoxy-D-xylulose 5-phosphate synthase gene in potato tubers perturbs the isoprenoid metabolic network: implications for the control of the tuber life cycle. J. Exp. Bot. 2006, 57, 3007–3018. [Google Scholar] [CrossRef]
- Enfissi, E.M.A.; Fraser, P.D.; Lois, L.M.; Boronat, A.; Schuch, W.; Bramley, P.M. Metabolic engineering of the mevalonate and non-mevalonate isopentenyl diphosphate-forming pathways for the production of health-promoting isoprenoids in tomato. Plant Biotechnol. J. 2010, 3, 17–27. [Google Scholar] [CrossRef]
- Rodríguez-Concepción, M. Early Steps in Isoprenoid Biosynthesis: Multilevel Regulation of the Supply of Common Precursors in Plant Cells. Phytochem. Rev. 2006, 5, 1–15. [Google Scholar] [CrossRef]
- Kim, Y.J.; Lee, O.R.; Oh, J.Y.; Jang, M.G.; Yang, D.C. Functional analysis of 3-hydroxy-3-methylglutaryl coenzyme a reductase encoding genes in triterpene saponin-producing ginseng. Plant Physiol. 2014, 165, 373–387. [Google Scholar] [CrossRef] [PubMed]
- Lluch, M.A.; Masferrer, A.; Arro, M.; Boronat, A.; Ferrer, A. Molecular cloning and expression analysis of the mevalonate kinase gene from Arabidopsis thaliana. Plant Mol. Biol. 2000, 42, 365–376. [Google Scholar] [CrossRef] [PubMed]
- Dolferus, R.; Jacobs, M.; Peacock, W.J.; Dennis, E.S. Differential Interactions of Promoter Elements in Stress Responses of the Arabidopsis Adh Gene. Plant Physiol. 1994, 105, 1075–1087. [Google Scholar] [CrossRef] [PubMed]
- Zhang, H.Y.; He, H.; Chen, L.B.; Li, L.; Liang, M.Z.; Wang, X.F.; Liu, X.G.; He, G.M.; Chen, R.S.; Ma, L.G.; et al. A genome-wide transcription analysis reveals a close correlation of promoter INDEL polymorphism and heterotic gene expression in rice hybrids. Mol. Plant 2008, 1, 720–731. [Google Scholar] [CrossRef] [PubMed]
- Hong, G.J.; Xue, X.Y.; Mao, Y.B.; Wang, L.J.; Chen, X.Y. Arabidopsis MYC2 interacts with DELLA proteins in regulating sesquiterpene synthase gene expression. Plant Cell 2012, 24, 2635–2648. [Google Scholar] [CrossRef] [PubMed]
- Bedon, F.; Bomal, C.; Caron, S.; Levasseur, C.; Boyle, B.; Mansfield, S.D.; Schmidt, A.; Gershenzon, J.; Grimapettenati, J.; Séguin, A. Subgroup 4 R2R3-MYBs in conifer trees: Gene family expansion and contribution to the isoprenoid- and flavonoid-oriented responses. J. Exp. Bot. 2010, 61, 3847–3864. [Google Scholar] [CrossRef] [PubMed]
- Skibbe, M.; Qu, N.; Galis, I.; Baldwin, I.T. Induced plant defenses in the natural environment: Nicotiana attenuata WRKY3 and WRKY6 coordinate responses to herbivory. Plant Cell 2008, 20, 1984–2000. [Google Scholar] [CrossRef] [PubMed]
- Wang, Y.; Zheng, P.C.; Liu, P.P.; Song, X.W.; Guo, F.; Li, Y.Y.; Ni, D.J.; Jiang, C.J. Novel insight into the role of withering process in characteristic flavor formation of teas using transcriptome analysis and metabolite profiling. Food Chem. 2019, 272, 313–322. [Google Scholar] [CrossRef]
- Wei, C.; Yang, H.; Wang, S.; Zhao, J.; Liu, C.; Gao, L.; Xia, E.; Lu, Y.; Tai, Y.; She, G. Draft genome sequence of Camellia sinensis var. sinensis provides insights into the evolution of the tea genome and tea quality. Proc. Natl. Acad. Sci. USA 2018, 115, 201719622. [Google Scholar] [CrossRef] [PubMed]
- Mortazavi, A.; Williams, B.A.; McCue, K.; Schaeffer, L.; Wold, B. Mapping and quantifying mammalian transcriptomes by RNA-Seq. Nat. Methods 2008, 5, 621. [Google Scholar] [CrossRef] [PubMed]
- Livak, K.J.; Schmittgen, T.D. Analysis of relative gene expression data using real-time quantitative PCR and the 2(-Delta Delta C(T)) Method. Methods 2001, 25, 402–408. [Google Scholar] [CrossRef] [PubMed]
Sample Availability: Samples of the compounds are not available from the authors. |
© 2019 by the authors. Licensee MDPI, Basel, Switzerland. This article is an open access article distributed under the terms and conditions of the Creative Commons Attribution (CC BY) license (http://creativecommons.org/licenses/by/4.0/).