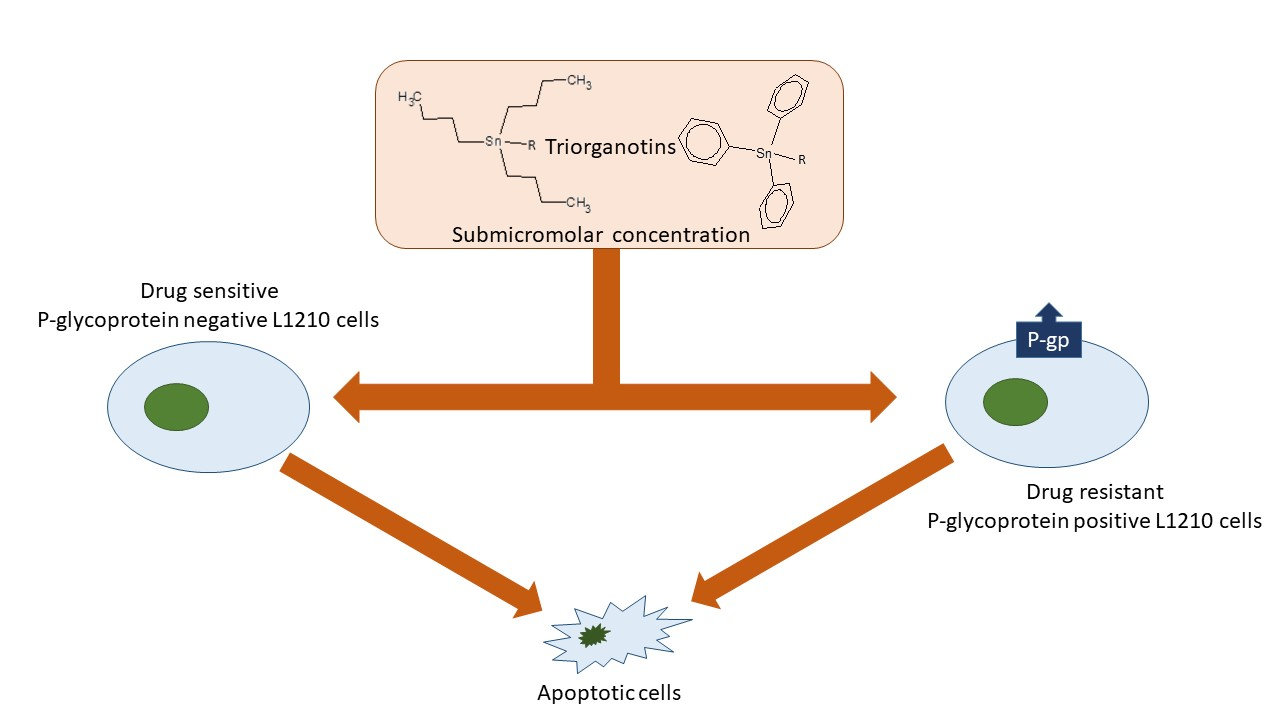
Triorganotin Derivatives Induce Cell Death Effects on L1210 Leukemia Cells at Submicromolar Concentrations Independently of P-glycoprotein Expression

 ,
,
Abstract
:
1. Introduction
2. Results
2.1. Characterization of P-gp Positive Variants of L1210 Cells
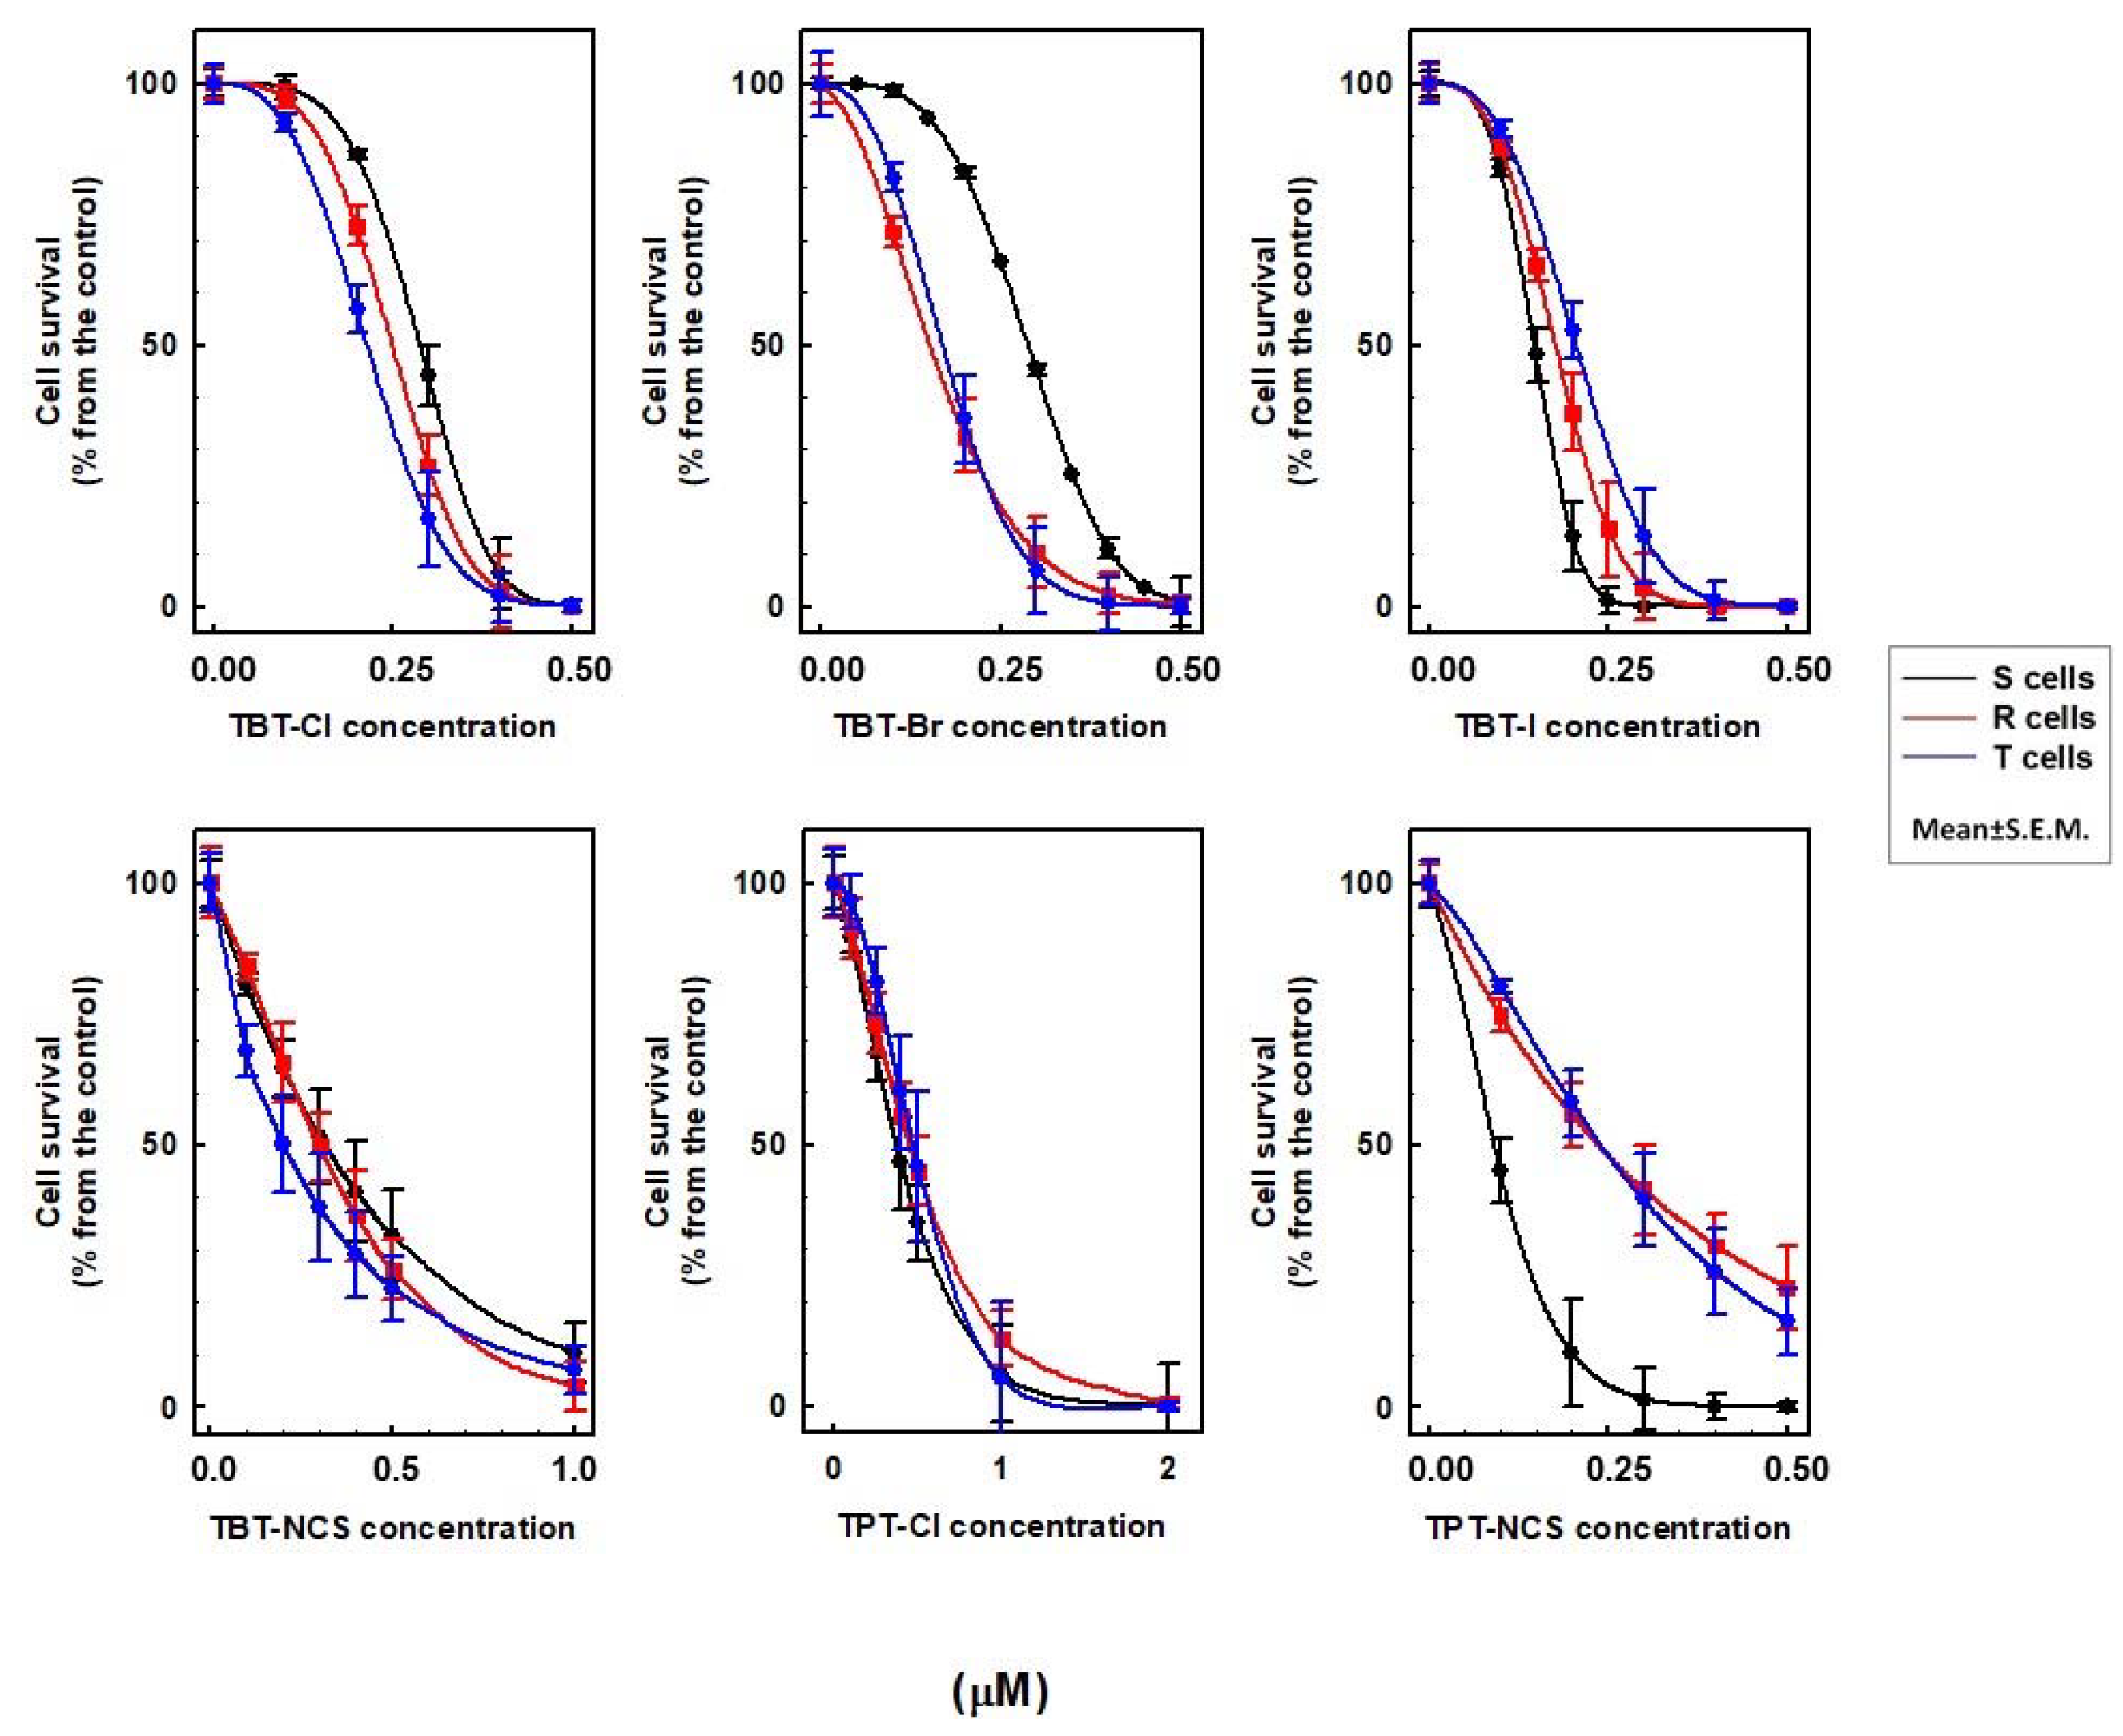
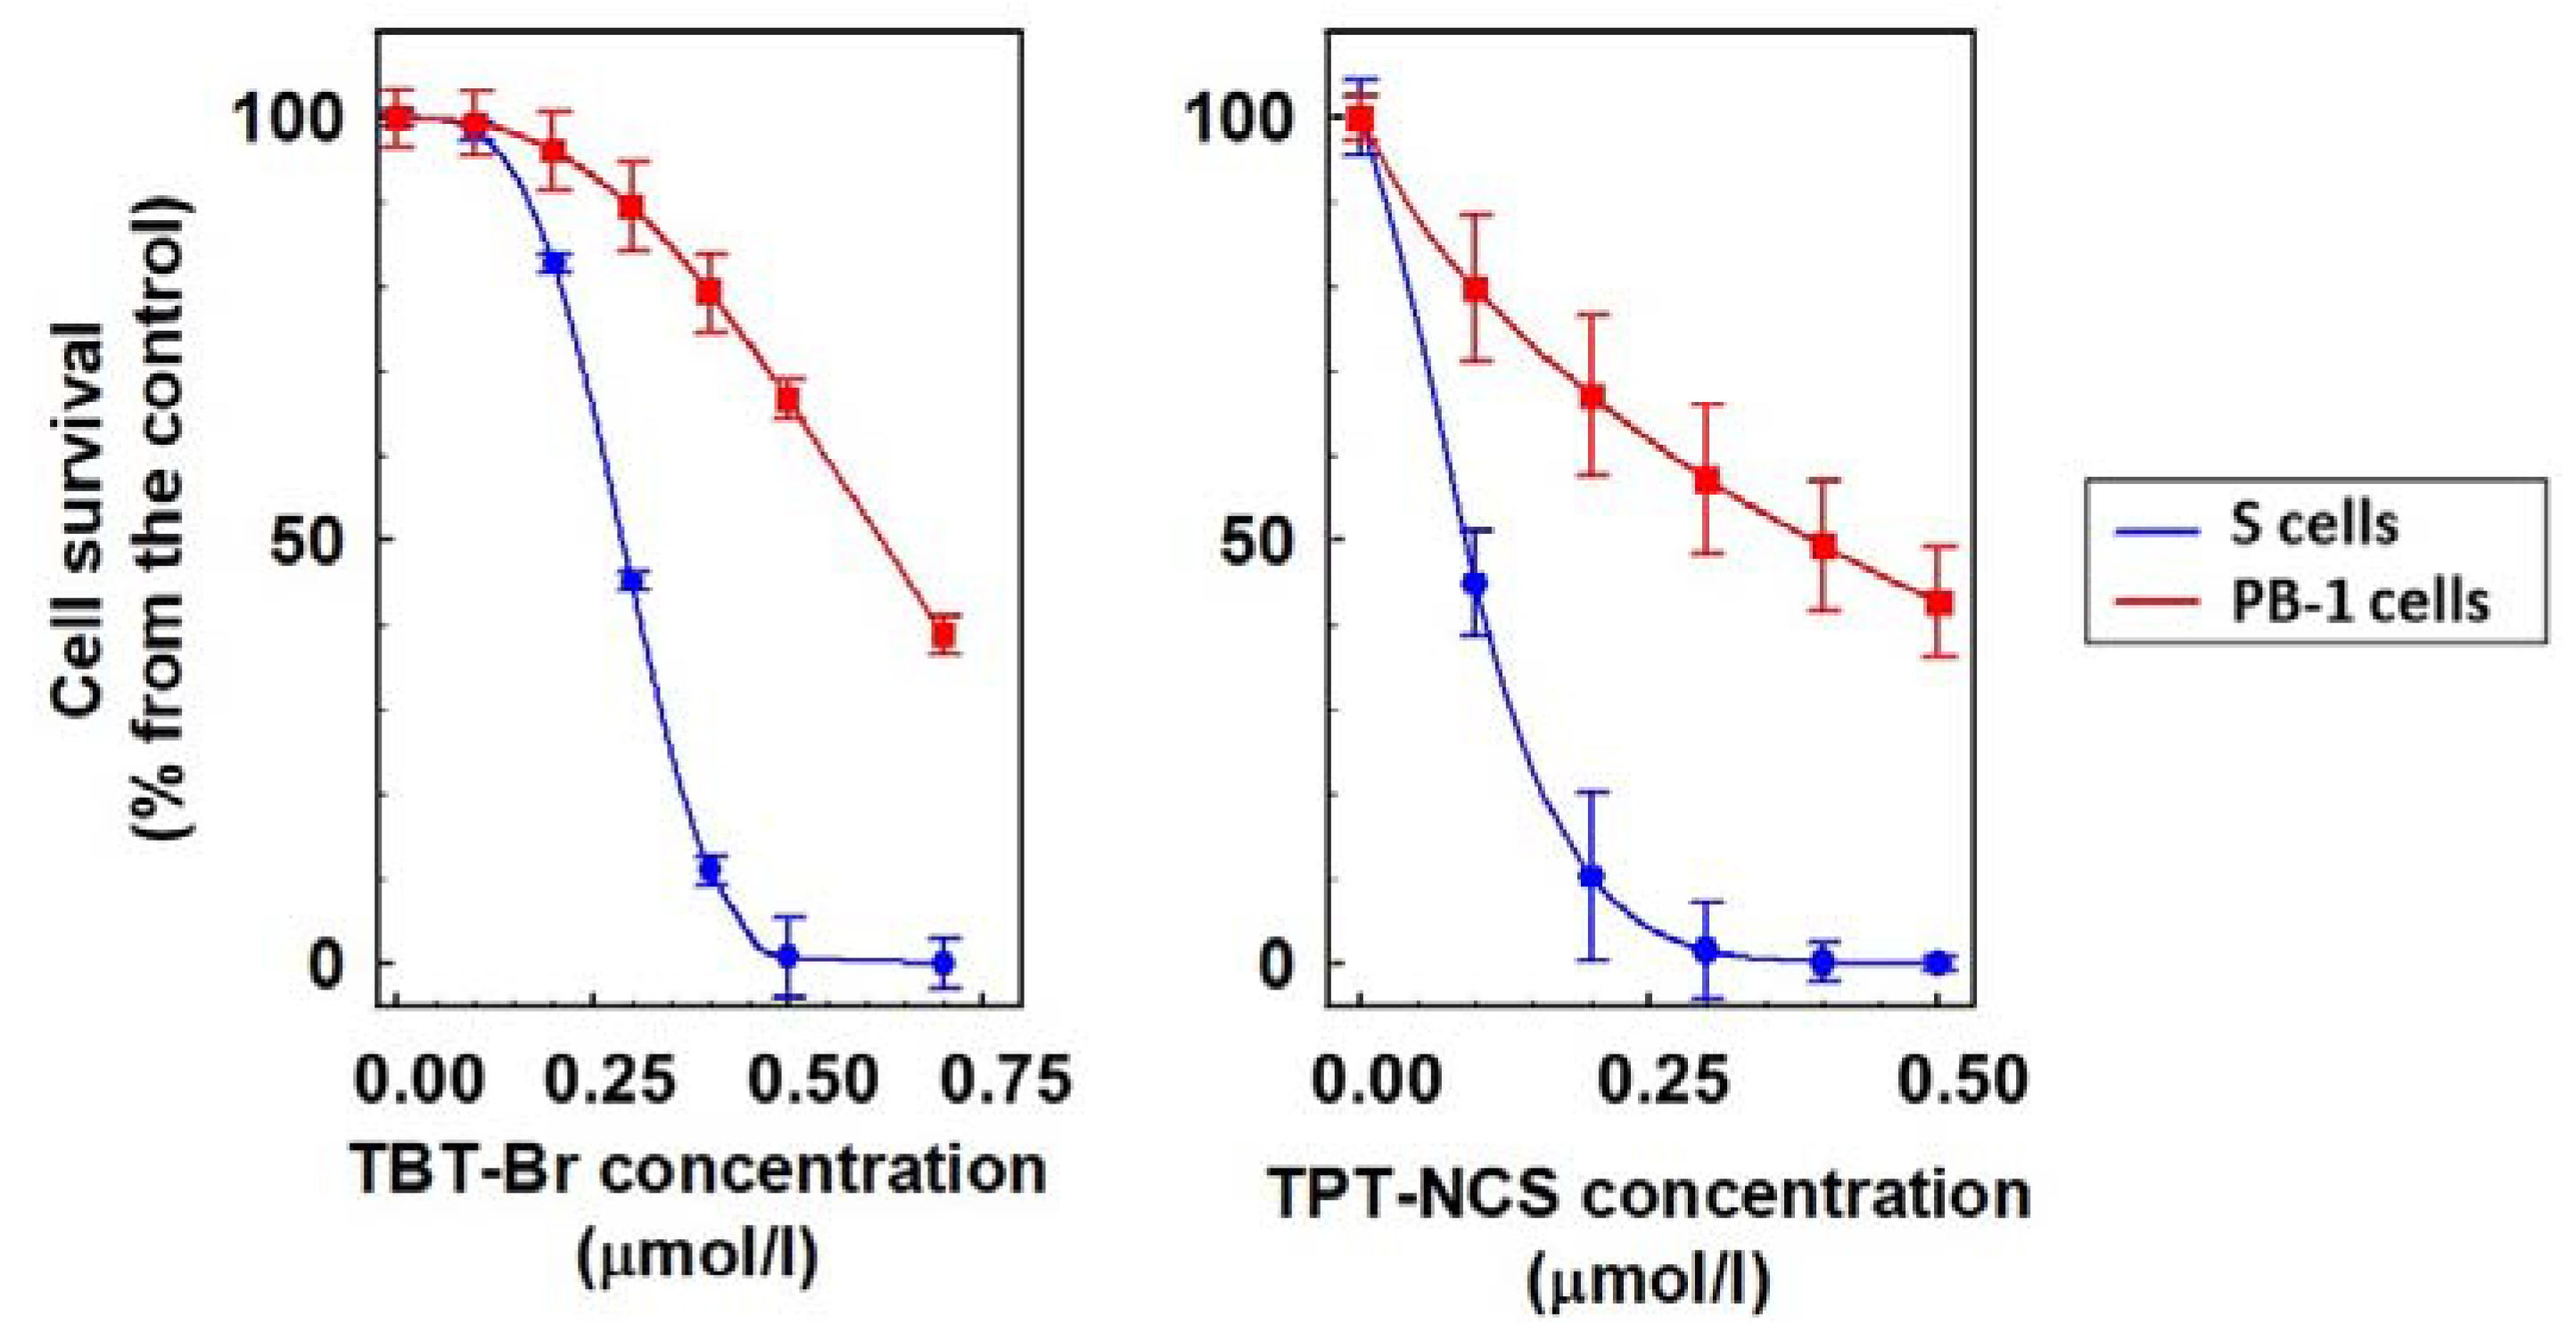
2.2. Cytotoxic Effect of TBT and TPT Derivatives on S, R, T and PB-1 Cells
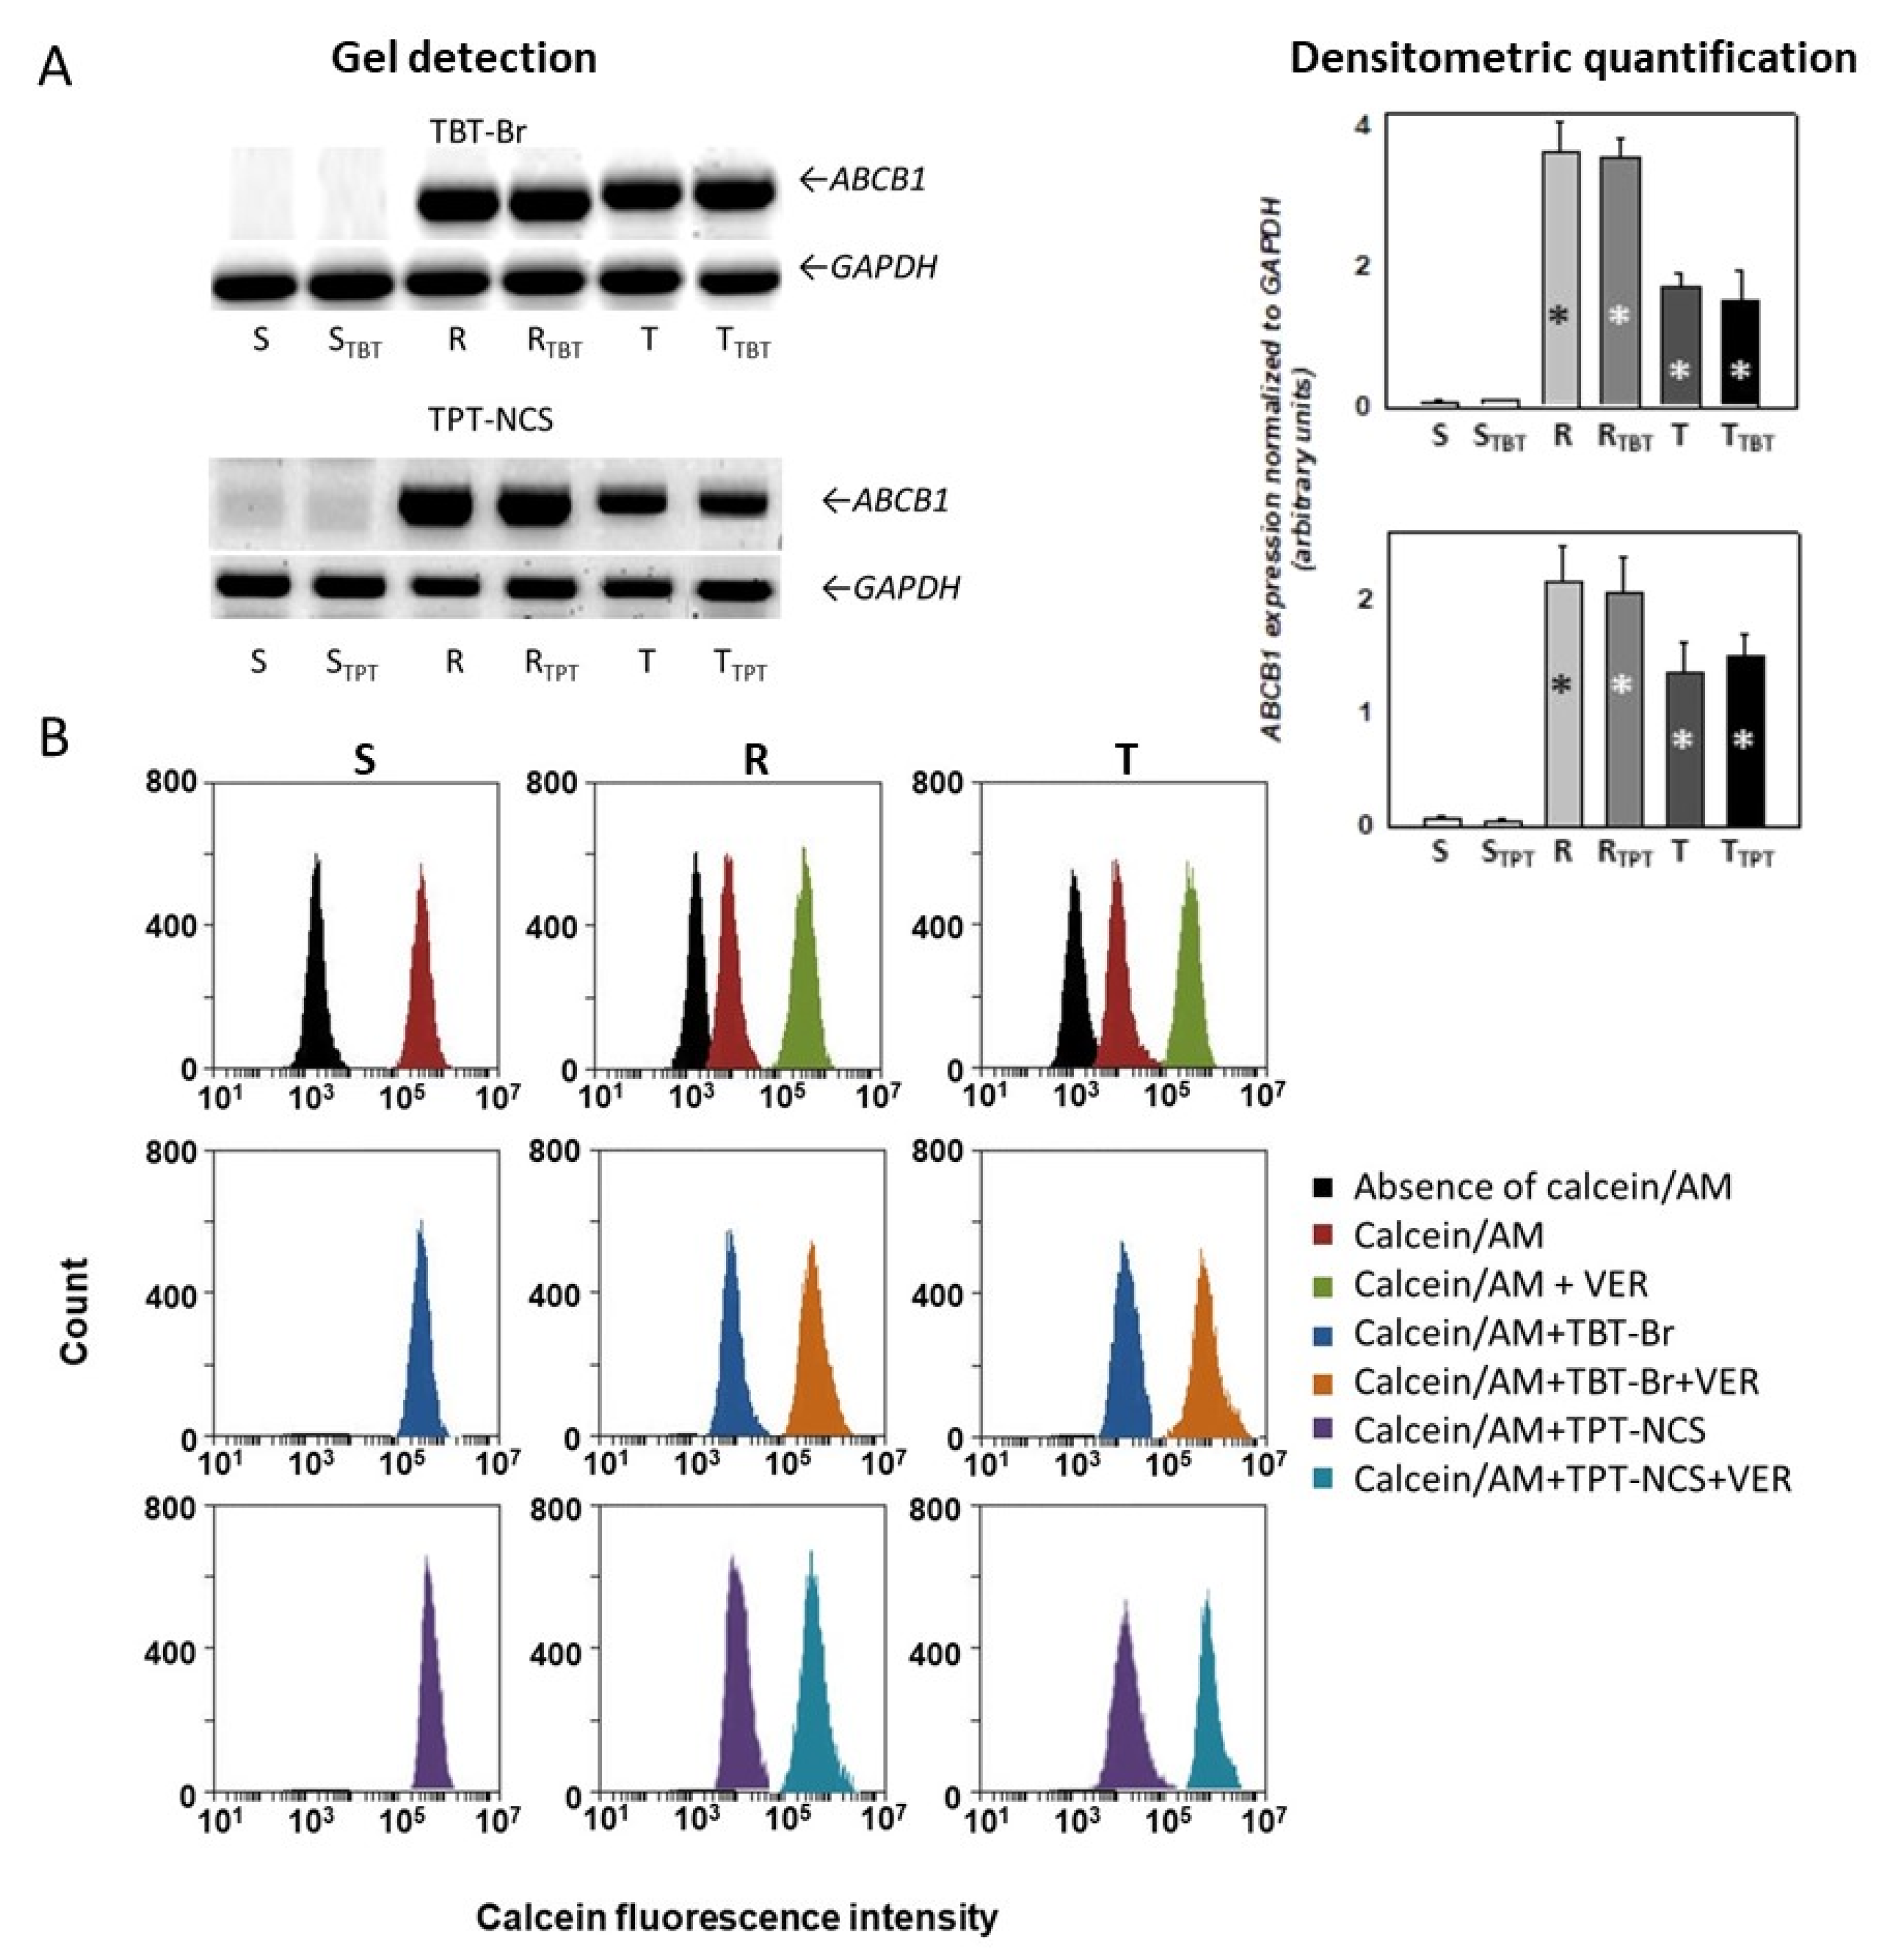
2.3. Effect of Triorganotin Derivatives on Expression and Drug Efflux Activity of P-gp
2.4. Mechanism of Triorganotin Cell Death Effects
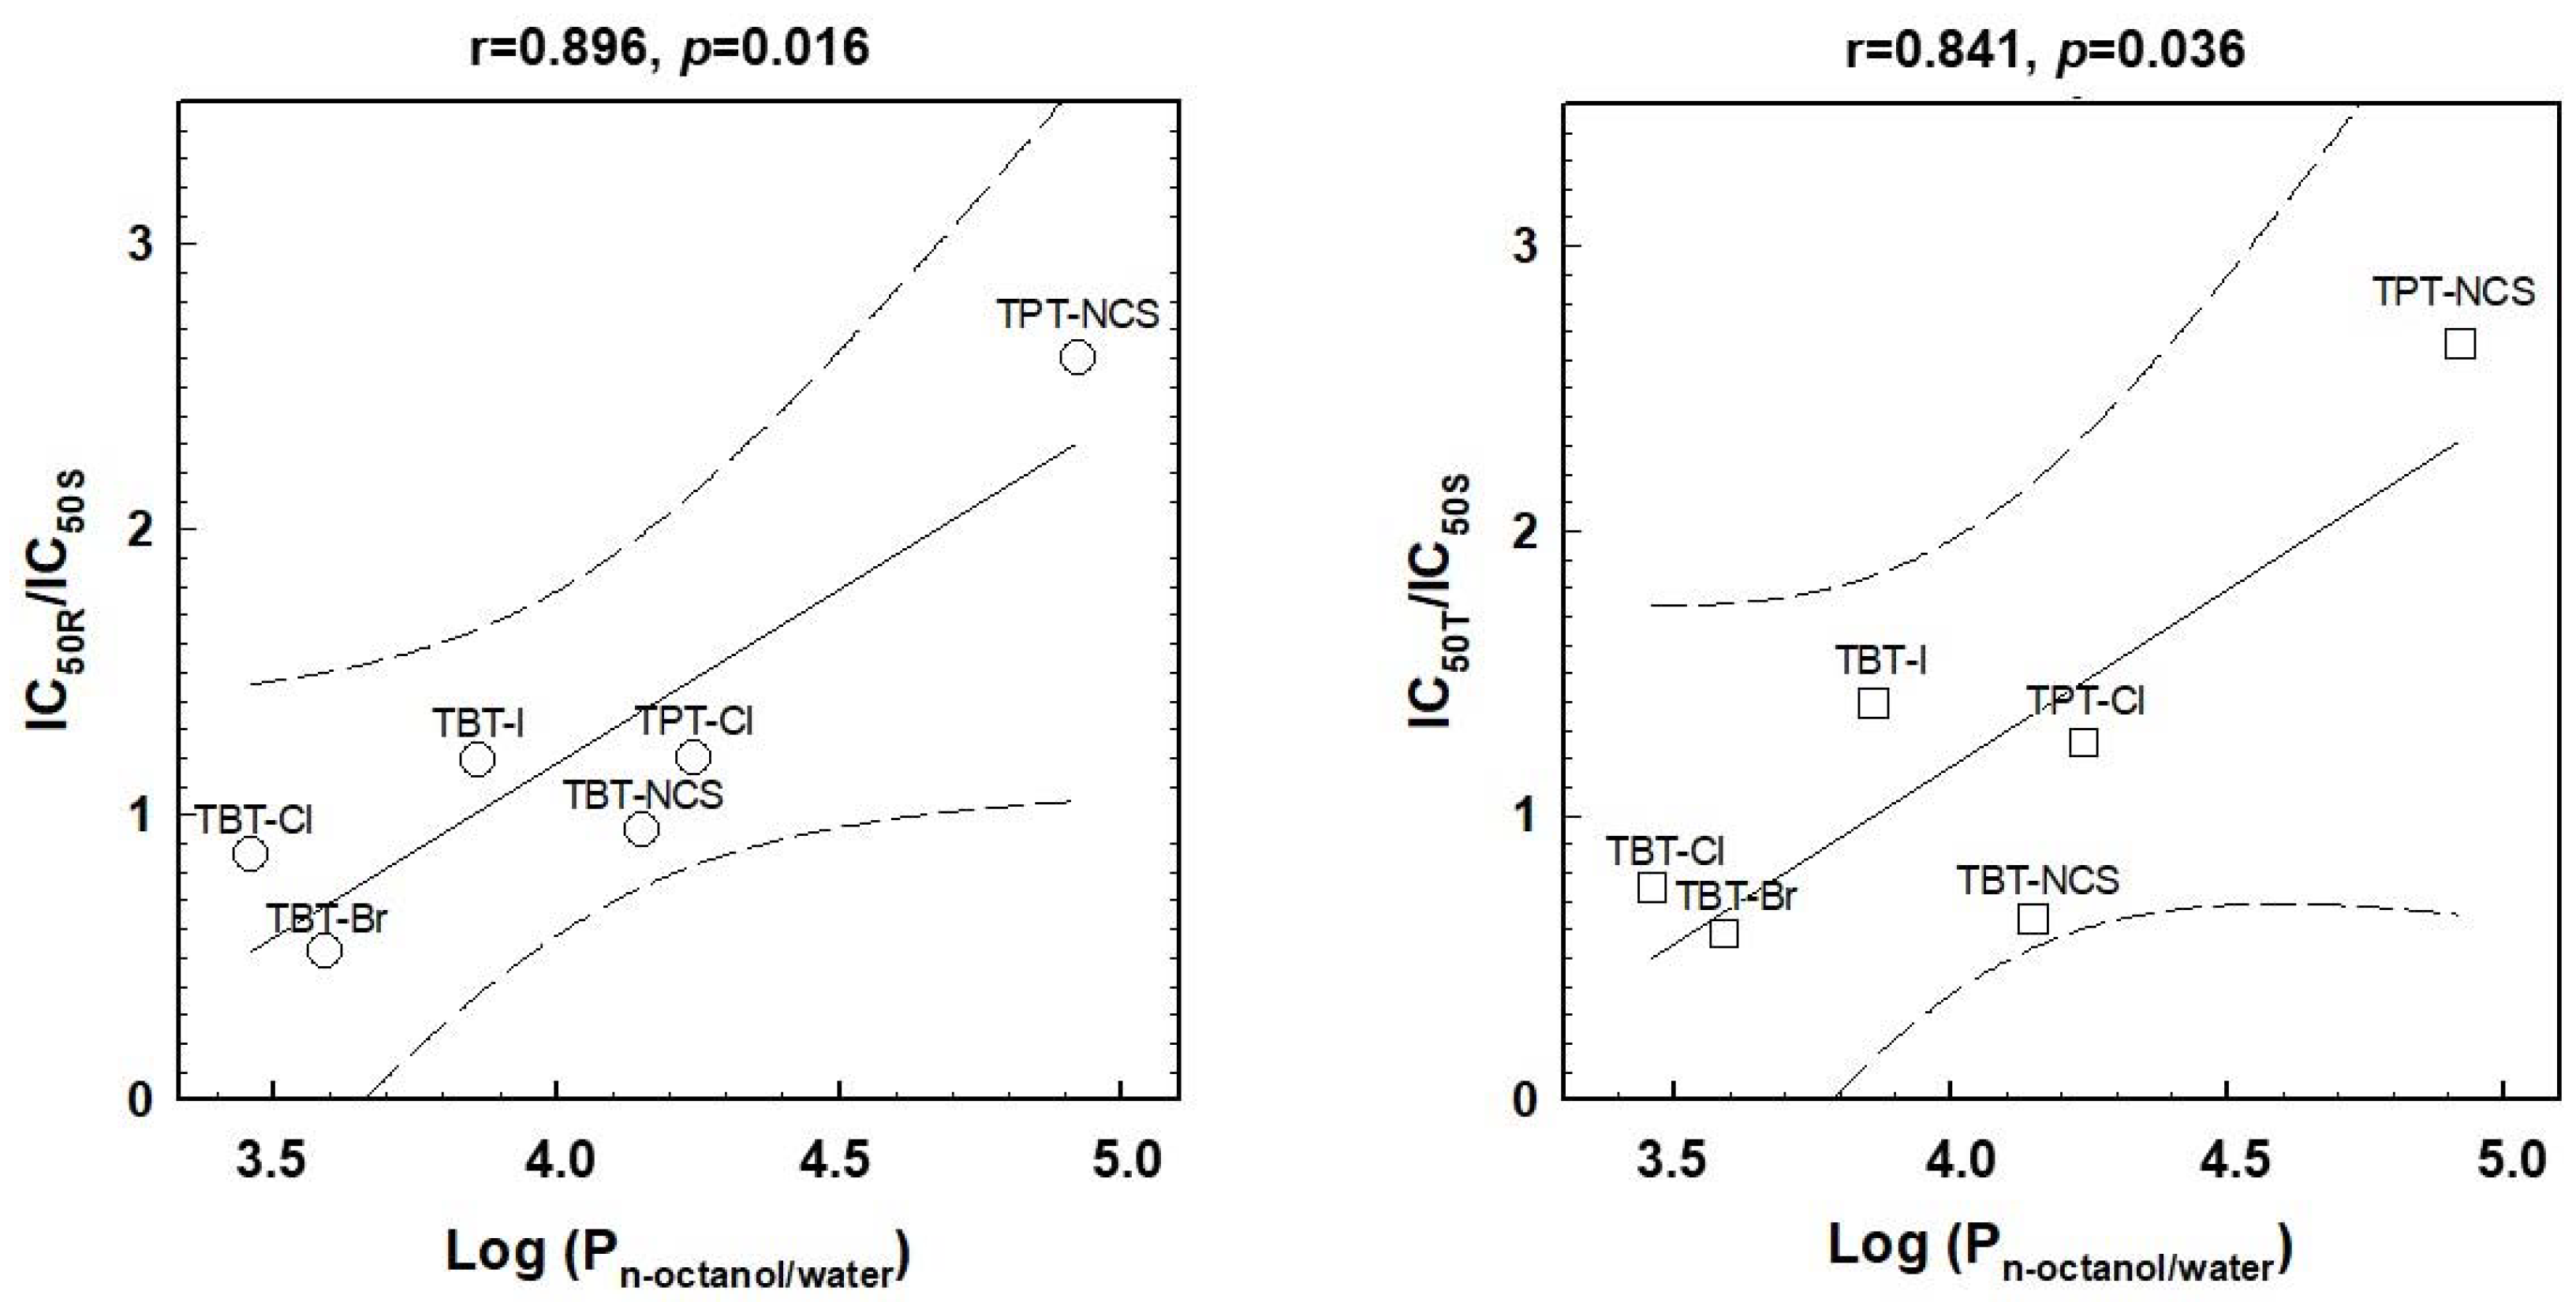
2.5. Relations between the Effectiveness of the Cell Death Effects and Lipophilicity of Triorganotins
3. Discussion
4. Materials and Methods
4.1. Chemicals
4.2. Cell Culture Conditions
4.3. Cell Death Effects of Triorganotin Derivatives on S, R, T and PB-1 Cells
4.4. Reverse Transcription Polymerase Chain Reaction (RT-PCR) Detection of P-gp Expression
4.5. Estimation of P-gp Transport Activity by Calcein/AM Retention Assay
4.6. Measurement of S, R and T Cells’ Proportions in Apoptosis and Necrosis Using
4.7. Western Blot Procedures
5. Conclusions
Author Contributions
Funding
Acknowledgments
Conflicts of Interest
References
- Tsimberidou, A.M. Targeted therapy in cancer. Cancer Chemother. Pharmacol. 2015, 76, 1113–1132. [Google Scholar] [CrossRef] [PubMed]
- Kue, C.S.; Kamkaew, A.; Burgess, K.; Kiew, L.V.; Chung, L.Y.; Lee, H.B. Small molecules for active targeting in cancer. Med. Res. Rev. 2016, 36, 494–575. [Google Scholar] [CrossRef] [PubMed]
- Emmons, M.F.; Faiao-Flores, F.; Smalley, K.S. The role of phenotypic plasticity in the escape of cancer cells from targeted therapy. Biochem. Pharmacol. 2016, 122, 1–9. [Google Scholar] [CrossRef] [PubMed]
- Messingerova, L.; Imrichova, D.; Coculova, M.; Zelina, M.; Pavlikova, L.; Kavcova, H.; Seres, M.; Bohacova, V.; Lakatos, B.; Sulova, Z.; et al. Different mechanisms of drug resistance in myelodysplastic syndromes and acute myeloid leukemia. In Myelodysplastic Syndromes; Fusch, O., Ed.; Intech Open Science Open Minds: London, UK, 2016; pp. 181–200. [Google Scholar]
- Kibria, G.; Hatakeyama, H.; Harashima, H. Cancer multidrug resistance: Mechanisms involved and strategies for circumvention using a drug delivery system. Arch. Pharm. Res. 2014, 37, 4–15. [Google Scholar] [CrossRef] [PubMed]
- Breier, A.; Gibalova, L.; Seres, M.; Barancik, M.; Sulova, Z. New insight into P-glycoprotein as a drug target. Anticancer Agents Med. Chem. 2013, 13, 159–170. [Google Scholar] [CrossRef] [PubMed]
- Breier, A.; Barancik, M.; Sulova, Z.; Uhrik, B. P-glycoprotein—Implications of metabolism of neoplastic cells and cancer therapy. Curr. Cancer Drug Targets 2005, 5, 457–468. [Google Scholar] [CrossRef] [PubMed]
- Hunakova, L.; Macejova, D.; Toporova, L.; Brtko, J. Anticancer effects of tributyltin chloride and triphenyltin chloride in human breast cancer cell lines MCF-7 and MDA-MB-231. Tumour Biol. 2016, 37, 6701–6708. [Google Scholar] [CrossRef] [PubMed]
- Fickova, M.; Macho, L.; Brtko, J. A comparison of the effects of tributyltin chloride and triphenyltin chloride on cell proliferation, proapoptotic P53, bax, and antiapoptotic BCL-2 protein levels in human breast cancer MCF-7 cell line. Toxicol. In Vitro 2015, 29, 727–731. [Google Scholar] [CrossRef] [PubMed]
- Brtko, J.; Dvorak, Z. Triorganotin compounds—Ligands for “rexinoid” inducible transcription factors: Biological effects. Toxicol. Lett. 2015, 234, 50–58. [Google Scholar] [CrossRef] [PubMed]
- Hiromori, Y.; Yui, H.; Nishikawa, J.; Nagase, H.; Nakanishi, T. Organotin compounds cause structure-dependent induction of progesterone in human choriocarcinoma jar cells. J. Steroid Biochem. Mol. Biol. 2016, 155, 190–198. [Google Scholar] [CrossRef] [PubMed]
- Illes, P.; Brtko, J.; Dvorak, Z. Development and characterization of a human reporter cell line for the assessment of thyroid receptor transcriptional activity: A case of organotin endocrine disruptors. J. Agric. Food Chem. 2015, 63, 7074–7083. [Google Scholar] [CrossRef] [PubMed]
- Macejova, D.; Toporova, L.; Brtko, J. The role of retinoic acid receptors and their cognate ligands in reproduction in a context of triorganotin based endocrine disrupting chemicals. Endocr. Regul. 2016, 50, 154–164. [Google Scholar] [CrossRef] [PubMed]
- Sapozhnikova, Y.; Wirth, E.; Schiff, K.; Brown, J.; Fulton, M. Antifouling pesticides in the coastal waters of southern california. Mar. Pollut. Bull. 2007, 54, 1972–1978. [Google Scholar] [CrossRef] [PubMed]
- Escher, B.I.; Sigg, L. Chemical speciation of organics and of metals at biological interphases. In Physicochemical Kinetics and Transport at Biointerfaces; John Wiley & Sons, Ltd.: Hoboken, NJ, USA, 2004; pp. 205–269. [Google Scholar]
- Arnold, C.G.; Weidenhaupt, A.; David, M.M.; Muller, S.R.; Haderlein, S.B.; Schwarzenbach, R.P. Aqueous speciation and 1-octanol-water partitioning of tributyl- and triphenyltin: Effect of ph and ion composition. Environ. Sci. Technol. 1997, 31, 2596–2602. [Google Scholar] [CrossRef]
- Novotny, L.; Sharaf, L.; Abdel-Hamid, M.E.; Brtko, J. Stability studies of endocrine disrupting tributyltin and triphenyltin compounds in an artificial sea water model. Gen. Physiol. Biophys. 2018, 37, 93–99. [Google Scholar] [CrossRef] [PubMed]
- Kobayashi-Hattori, K.; Watanabe, T.; Kimura, K.; Sugita-Konishi, Y. Down-regulation of mdr1b mRNA expression in the kidneys of mice following maternal exposure to tributyltin chloride. Biosci. Biotechnol. Biochem. 2006, 70, 1242–1245. [Google Scholar] [CrossRef] [PubMed]
- Tsukazaki, M.; Satsu, H.; Mori, A.; Sugita-Konishi, Y.; Shimizu, M. Effects of tributyltin on barrier functions in human intestinal Caco-2 cells. Biochem. Biophys. Res. Commun. 2004, 315, 991–997. [Google Scholar] [CrossRef] [PubMed]
- Polekova, L.; Barancik, M.; Mrazova, T.; Pirker, R.; Wallner, J.; Sulova, Z.; Breier, A. Adaptation of mouse leukemia cells L1210 to vincristine. Evidence for expression of p-glycoprotein. Neoplasma 1992, 39, 73–77. [Google Scholar] [PubMed]
- Sulova, Z.; Ditte, P.; Kurucova, T.; Polakova, E.; Rogozanova, K.; Gibalova, L.; Seres, M.; Skvarkova, L.; Sedlak, J.; Pastorek, J.; et al. The presence of P-glycoprotein in L1210 cells directly induces down-regulation of cell surface saccharide targets of concanavalin a. Anticancer Res. 2010, 30, 3661–3668. [Google Scholar] [PubMed]
- Pavlikova, L.; Seres, M.; Imrichova, D.; Hano, M.; Rusnak, A.; Zamorova, M.; Katrlik, J.; Breier, A.; Sulova, Z. The expression of P-gp in leukemia cells is associated with cross-resistance to protein n-glycosylation inhibitor tunicamycin. Gen. Physiol. Biophys. 2016, 35, 497–510. [Google Scholar] [CrossRef] [PubMed]
- Schuetz, J.D.; Schuetz, E.G. Extracellular matrix regulation of multidrug resistance in primary monolayer cultures of adult rat hepatocytes. Cell Growth Differ. 1993, 4, 31–40. [Google Scholar] [PubMed]
- Seres, M.; Cholujova, D.; Bubencikova, T.; Breier, A.; Sulova, Z. Tunicamycin depresses p-glycoprotein glycosylation without an effect on its membrane localization and drug efflux activity in l1210 cells. Int. J. Mol. Sci. 2011, 12, 7772–7784. [Google Scholar] [CrossRef] [PubMed]
- Balas, V.I.; Banti, C.N.; Kourkoumelis, N.; Hadjikakou, S.K.; Geromichalos, G.D.; Sahpazidou, D.; Male, L.; Hursthouse, M.B.; Bednarz, B.; Kubicki, M.; et al. Structural and in vitro biological studies of organotin (IV) precursors; selective inhibitory activity against human breast cancer cells, positive to estrogen receptors. Aust. J. Chem. 2012, 65, 1625–1637. [Google Scholar] [CrossRef]
- Mire-Sluis, A.R.; Healey, L.; Griffiths, S.; Hockley, D.; Thorpe, R. Development of a continuous IL-7-dependent murine pre-B cell line PB-1 suitable for the biological characterisation and assay of human IL-7. J. Immunol. Methods 2000, 236, 71–76. [Google Scholar] [CrossRef]
- Uhrik, B.; Tribulova, N.; Klobusicka, M.; Barancik, M.; Breier, A. Characterization of morphological and histochemical changes induced by overexpression of P-glycoprotein in mouse leukemic cell line l1210. Neoplasma 1994, 41, 83–88. [Google Scholar] [PubMed]
- Waseem, D.; Butt, A.F.; Haq, I.U.; Bhatti, M.H.; Khan, G.M. Carboxylate derivatives of tributyltin (IV) complexes as anticancer and antileishmanial agents. Daru 2017, 25, 8. [Google Scholar] [CrossRef] [PubMed]
- Lam, A.; Hoang, J.D.; Singleton, A.; Han, X.; Bleier, B.S. Itraconazole and clarithromycin inhibit P-glycoprotein activity in primary human sinonasal epithelial cells. Int. Forum Allergy Rhinol. 2015, 5, 477–480. [Google Scholar] [CrossRef] [PubMed]
- Nocera, A.L.; Miyake, M.M.; Seifert, P.; Han, X.; Bleier, B.S. Exosomes mediate interepithelial transfer of functional P-glycoprotein in chronic rhinosinusitis with nasal polyps. Laryngoscope 2017, 127, E295–E300. [Google Scholar] [CrossRef] [PubMed]
- Kim, R.B. Drugs as P-glycoprotein substrates, inhibitors, and inducers. Drug Metab. Rev. 2002, 34, 47–54. [Google Scholar] [CrossRef] [PubMed]
- Crowley, L.C.; Marfell, B.J.; Scott, A.P.; Waterhouse, N.J. Quantitation of apoptosis and necrosis by annexin v binding, propidium iodide uptake, and flow cytometry. Cold Spring Harb. Protoc. 2016, 2016, pdb-prot087288. [Google Scholar] [CrossRef] [PubMed]
- Del Principe, M.I.; Del Poeta, G.; Maurillo, L.; Buccisano, F.; Venditti, A.; Tamburini, A.; Bruno, A.; Cox, M.C.; Suppo, G.; Tendas, A.; et al. P-glycoprotein and BCL-2 levels predict outcome in adult acute lymphoblastic leukaemia. Br. J. Haematol. 2003, 121, 730–738. [Google Scholar] [CrossRef] [PubMed]
- Pituch-Noworolska, A.; Hajto, B.; Balwierz, W.; Klus, K. Induction of apoptosis and BCL-2 expression in acute lymphoblastic leukaemia and non-hodgkin’s lymphoma in children. Haematologia 2001, 31, 191–207. [Google Scholar] [CrossRef] [PubMed]
- Hardwick, J.M.; Soane, L. Multiple functions of BCL-2 family proteins. Cold Spring Harb. Perspect. Biol. 2013, 5. [Google Scholar] [CrossRef] [PubMed]
- Tainton, K.M.; Smyth, M.J.; Jackson, J.T.; Tanner, J.E.; Cerruti, L.; Jane, S.M.; Darcy, P.K.; Johnstone, R.W. Mutational analysis of P-glycoprotein: Suppression of caspase activation in the absence of ATP-dependent drug efflux. Cell Death Differ. 2004, 11, 1028–1037. [Google Scholar] [CrossRef] [PubMed]
- Breier, A.; Drobna, Z.; Docolomansky, P.; Barancik, M. Cytotoxic activity of several unrelated drugs on L1210 mouse leukemic cell sublines with P-glycoprotein (PGP) mediated multidrug resistance (MDR) phenotype. A qsar study. Neoplasma 2000, 47, 100–106. [Google Scholar] [PubMed]
- Seltzer, R. The reactions of organotin chlorides with the cyanodithioimidocarbonate anion. J. Org. Chem. 1968, 33, 3896–3900. [Google Scholar] [CrossRef]
- Wharf, I. Studies in aryltin chemistry. Part 5. Tin-119 and carbon-13 NMR spectra of some tetra- and tri-aryltin compounds. Inorg. Chim. Acta 1989, 159, 41–48. [Google Scholar] [CrossRef]
- Pastan, I.; Gottesman, M.M.; Ueda, K.; Lovelace, E.; Rutherford, A.V.; Willingham, M.C. A retrovirus carrying an MDR1 cDNA confers multidrug resistance and polarized expression of P-glycoprotein in MDCK cells. Proc. Natl. Acad. Sci. USA 1988, 85, 4486–4490. [Google Scholar] [CrossRef] [PubMed]
- Gerlier, D.; Thomasset, N. Use of mtt colorimetric assay to measure cell activation. J. Immunol. Methods 1986, 94, 57–63. [Google Scholar] [CrossRef]
- Eneroth, A.; Astrom, E.; Hoogstraate, J.; Schrenk, D.; Conrad, S.; Kauffmann, H.M.; Gjellan, K. Evaluation of a vincristine resistant Caco-2 cell line for use in a calcein AM extrusion screening assay for P-glycoprotein interaction. Eur. J. Pharm. Sci. 2001, 12, 205–214. [Google Scholar] [CrossRef]
- Orlicky, J.; Sulova, Z.; Dovinova, I.; Fiala, R.; Zahradnikova, A., Jr.; Breier, A. Functional fluo-3/AM assay on P-glycoprotein transport activity in L1210/VCR cells by confocal microscopy. Gen. Physiol. Biophys. 2004, 23, 357–366. [Google Scholar] [PubMed]
- Laemmli, U.K. Cleavage of structural proteins during the assembly of the head of bacteriophage T4. Nature 1970, 227, 680–685. [Google Scholar] [CrossRef] [PubMed]
- Towbin, H.; Staehelin, T.; Gordon, J. Electrophoretic transfer of proteins from polyacrylamide gels to nitrocellulose sheets: Procedure and some applications. Proc. Natl. Acad. Sci. USA 1979, 76, 4350–4354. [Google Scholar] [CrossRef] [PubMed]
Sample Availability: Samples of the compounds TBT-NCS and TPT-NCS are available from the authors. |


| Compound | Abbreviation | Structure 1 | Log P 2 |
|---|---|---|---|
| Tributyltin chloride (Chlorotributyltin, Chlorotributylstannane) | TBT-Cl |  | 3.46 |
| Tributyltin bromide (Bromotributyltin, Bromotributylstannane) | TBT-Br | 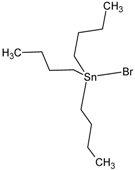 | 3.59 |
| Tributyltin iodide (Iodotributyltin, Iodotributylstannane) | TBT-I | 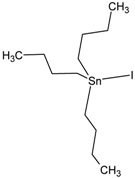 | 3.86 |
| Tributyltin isothiocyanate (Isothiocyanatotributyltin, Isothiocyanatotributylstannane) | TBT-NCS |  | 4.15 |
| Triphenyltin chloride (Chlorotriphenyltin, Chlorotriphenylstannane) | TPT-Cl | 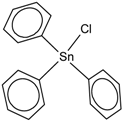 | 4.24 |
| Triphenyltin isothiocyanate (Isothiocyanatotriphenyltin, Isothiocyanatotriphenylstannane) | TPT-NCS | 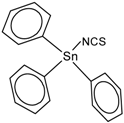 | 4.92 |
| IC50 for | S | R | Rv | T | Tv |
|---|---|---|---|---|---|
| Substances | (in μM) | ||||
| TBT-Cl | 0.29 ± 0.03 | 0.25 ± 0.02 * | 0.23 ± 0.05 * | 0.21 ± 0.05 ** | 0.21 ± 0.04 ** |
| TBT-Br | 0.29 ± 0.05 | 0.15 ± 0.05 ** | 0.15 ± 0.04 ** | 0.17 ± 0.07 ** | 0.16 ± 0.04 ** |
| TBT-I | 0.14 ± 0.02 | 0.18 ± 0.03 * | 0.15 ± 0.02 + | 0.21 ± 0.04 ** | 0.16 ± 0.03 + |
| TPT-Cl | 0.37 ± 0.09 | 0.45 ± 0.09 | 0.44 ± 0.10 | 0.47 ± 0.11 | 0.48 ± 0.12 |
| TBT-NCS | 0.31 ± 0.09 | 0.30 ± 0.05 | 0.33 ± 0.07 | 0.20 ± 0.05 * | 0.20 ± 0. 04 * |
| TPT-NCS | 0.09 ± 0.02 | 0.24 ± 0.04 ** | 0.10 ± 0.02 ++ | 0.24 ± 0.06 ** | 0.09 ± 0.03 ++ |
| Correlation | B0 | B1 | r | p | Significance |
|---|---|---|---|---|---|
| S vs. R | - | - | 0.582 | 0.226 | Insignificant |
| S vs. T | - | - | 0.425 | 0.401 | Insignificant |
| R vs. T | 0.008 | 0.928 (42,9°) | 0.902 | 0.014 | significant (p < 0.02) |
© 2018 by the authors. Licensee MDPI, Basel, Switzerland. This article is an open access article distributed under the terms and conditions of the Creative Commons Attribution (CC BY) license (http://creativecommons.org/licenses/by/4.0/).
Share and Cite
Bohacova, V.; Seres, M.; Pavlikova, L.; Kontar, S.; Cagala, M.; Bobal, P.; Otevrel, J.; Brtko, J.; Sulova, Z.; Breier, A. Triorganotin Derivatives Induce Cell Death Effects on L1210 Leukemia Cells at Submicromolar Concentrations Independently of P-glycoprotein Expression. Molecules 2018, 23, 1053. https://doi.org/10.3390/molecules23051053
Bohacova V, Seres M, Pavlikova L, Kontar S, Cagala M, Bobal P, Otevrel J, Brtko J, Sulova Z, Breier A. Triorganotin Derivatives Induce Cell Death Effects on L1210 Leukemia Cells at Submicromolar Concentrations Independently of P-glycoprotein Expression. Molecules. 2018; 23(5):1053. https://doi.org/10.3390/molecules23051053
Chicago/Turabian StyleBohacova, Viera, Mario Seres, Lucia Pavlikova, Szilvia Kontar, Martin Cagala, Pavel Bobal, Jan Otevrel, Julius Brtko, Zdena Sulova, and Albert Breier. 2018. "Triorganotin Derivatives Induce Cell Death Effects on L1210 Leukemia Cells at Submicromolar Concentrations Independently of P-glycoprotein Expression" Molecules 23, no. 5: 1053. https://doi.org/10.3390/molecules23051053