Article

A New Lignanamide from the Root of Lycium yunnanense Kuang and Its Antioxidant Activity

Guangdong Province Key Laboratory of Pharmacodynamic Constituents of Traditional Chinese Medicine and New Drugs Research, Institute of Traditional Chinese Medicine and Natural Product, College of Pharmacy, Jinan University, Guangzhou 510632, China
*
Author to whom correspondence should be addressed.
Molecules 2018, 23(4), 770; https://doi.org/10.3390/molecules23040770
Submission received: 7 March 2018 / Revised: 21 March 2018 / Accepted: 23 March 2018 / Published: 27 March 2018
(This article belongs to the Section Natural Products Chemistry)

Abstract

:
A new lignanamide (1), lyciumamide K, together with four known analogues (25), was isolated from the root of Lycium yunnanense Kuang. Based on HR-ESI-MS, NMR spectral data and quantum chemistry ECD calculations, the structure of this new compound was confirmed, including its absolute configuration. Evaluation of the antioxidant activity of compounds 15 in the oxygen radical absorption capacity (ORAC) assay showed that they all exhibited significant antioxidant activities. Particularly, compound 1 showed the best activity with ORAC values (U/mol) of 7.90 ± 0.52. Thus, the new lignanamide may be a good source of bioavtive and protective compounds.

1. Introduction

There are 80 species of Lycium (Solanaceae) throughout the world, mainly in South Africa, Asia, temperate Europe and South America. China has seven species and three varieties, which are mainly distributed in the northwest and north of China [1]. Cortex Lycii, that is the root bark of Lycium barbarum L., has been widely used in traditional Chinese medicine treatment of night sweats, pneumonia, cough and diabetes, etc. [2]. Several types of compounds have been isolated from these plants, including lignanamides, alkaloids, flavonoids, cyclic peptides, lignans, terpenes and phenolic glycosides [3,4,5,6,7,8,9]. Meanwhile, the antioxidant properties of the fruits of Lycium barbarum L. have been intensively studied for years [10,11,12]. The literature has demonstrated that polysaccharides, carotenoids, and especially phenolic compounds (flavonoids and phenolic acids) obtained from the fruits of L. barbarum performed effective antioxidant activities [13]. Lycium yunnanense Kuang is another species of plant in the same genus, and is commonly found in such places as Luquan, Jingdong, Funing, Yanshan and Malipo in Yunnan province, China, born in the wet sandy soil of riversides or jungles in elevation of 700~2200 m. In order to further study the active ingredients of the related traditional Chinese medicine, a systematic chemical study was conducted on the ethyl acetate fraction of the ethanol extract of the root of Lycium yunnanense Kuang. As a result, a new lignanamide (1) as well as four known compounds (25) were isolated (see Figure 1). Here, we elaborate the isolation and structural analysis of this lignadamide and its antioxidant activity.

2. Results and Explanation

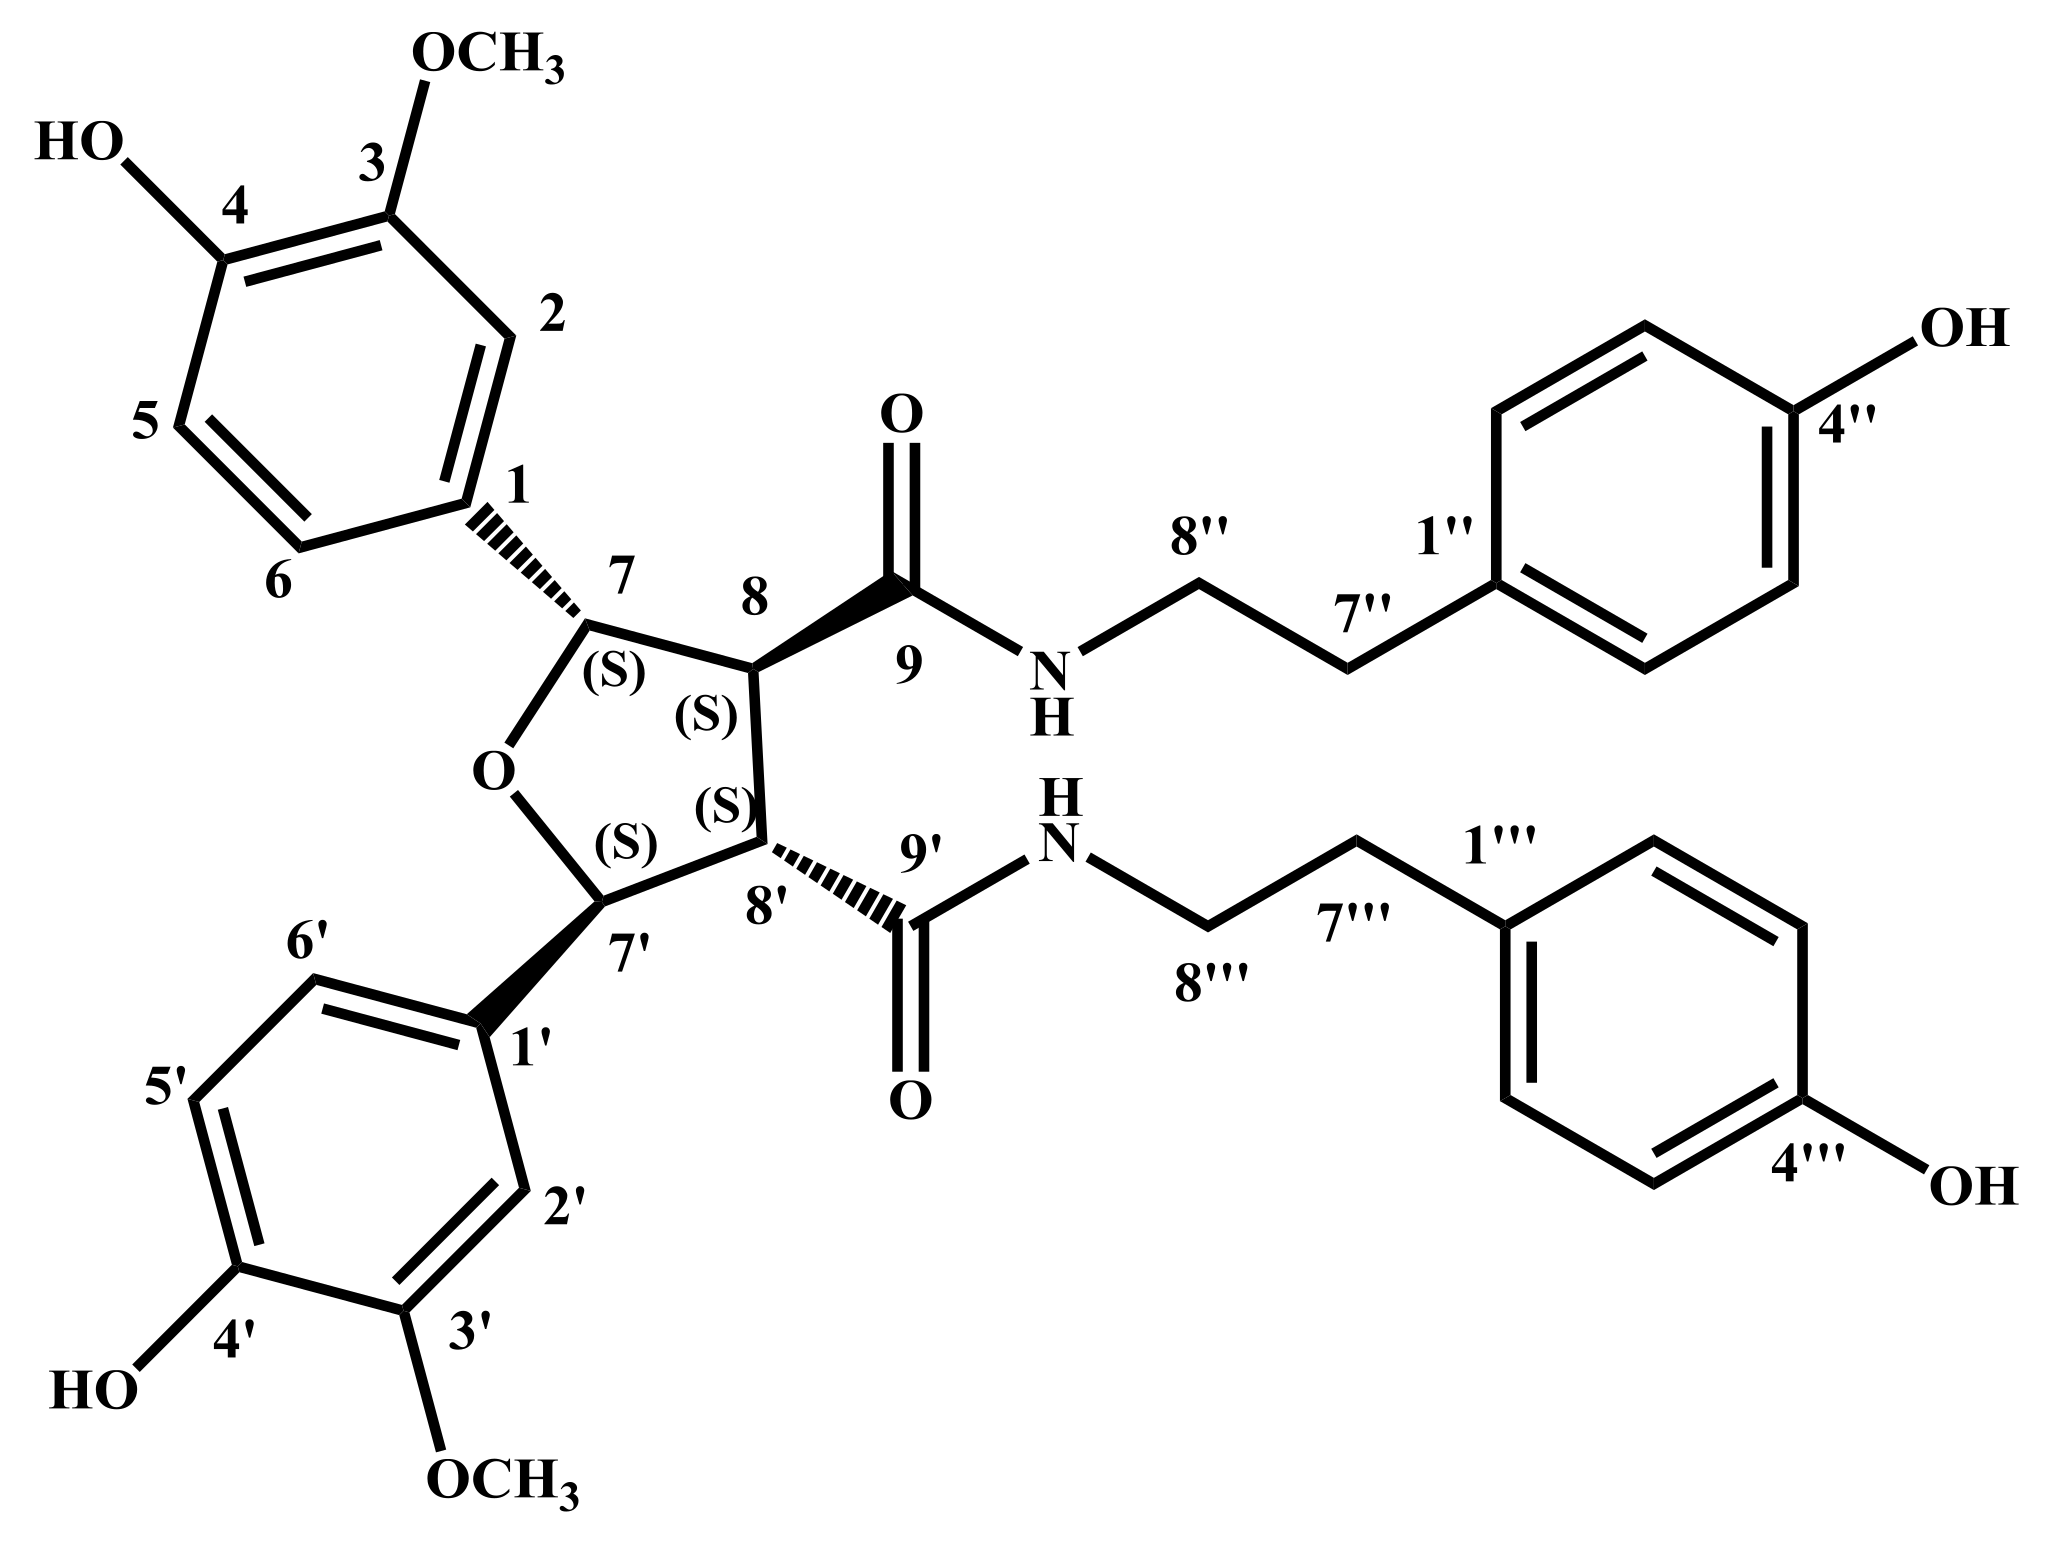
2.1. Structural Feature of the Compound 1

Compound 1 was obtained as white amorphous powder. The molecular formula of 1 was determined to be C36H38N2O9 on the basis of the sodiated molecular ion peak observed at m/z 665.2474 [M + Na]+ by HR-ESI-MS, which indicated 19 degrees of unsaturation. The 1H, 13C-NMR and HSQC data of 1 (Table 1, see Supplementary Materials) suggested the presence of tyramine moiety (δH 6.84 (2H, d, J = 8.4 Hz), 6.64 (2H, d, J = 8.4 Hz), 3.39 (1H, t, J = 7.2 Hz), 3.17 (1H, t, J = 7.2 Hz), 2.53 (1H, t, J = 7.2 Hz), 2.59 (1H, t, J = 7.2 Hz) and δC 156.8, 131.0, 130.7 × 2, 116.2 × 2, 42.5, 35.7), a 1,3,4-trisubstituted aromatic ring [δH 7.03 (1H, d, J = 1.5 Hz), 6.79 (1H, d, J = 8.1 Hz), 6.81 (1H, dd, J = 1.5, 8.1 Hz), and δC 149.3, 147.8, 133.2, 120.5, 116.2, 110.8], and a carbonyl group (δC 172.1). Compound 1 presented characteristic 1H-NMR and 13C-NMR signals for tetrahydrofuran-type lignans with the chemical shifts of two methines (δH 3.34 (1H, dd, J = 2.8, 6.4 Hz), δC 60.6) and two benzylic methines (δH 5.26 (1H, d, J = 2.8 Hz), δC 86.2) substituted by oxygen. These data indicated the presence of oxygen-bearing carbons, which were further confirmed by DEPT and HSQC data [14]. All the 1H and 13C-NMR data only accounted for half the number of atoms expected for its molecular formula (C36H38N2O9), suggesting that 1 is a symmetrical dimer of two completely identical moieties (monomer units). The interpretation of the NMR data of 1 revealed that the monomer part was structurally similar to the known compound N-trans-feruloyltyramine [15], which co-occurs with 1 in the same extract. The 13C-NMR chemical shifts and quaternary status of C-8/C-8′ (δC 60.6), C-7/C-7′ (δC 86.2) suggested that the two monomer units were connected via tetrahydrofuran (THF) unit [14]. This was further confirmed by the HMBC correlations from H-2 to C-7, from H-6 to C-7, and from H-7 to C-2, C-6, C-8/C-8′ and C-9, and from H-8 to C-1, C-7/C-7′, C-8′ and C-9, (see Figure 2).
The relative configuration of Compound 1 was confirmed by multiple data. From the NOESY spectrum, there was NOE correlations between H-6 and H-7, and between H-2 and H-8 in methanol-d4. Moreover, the coupling constant values of both H-7 with H-8, and H-7′ with H-8′ were 2.8 Hz, and the coupling constant value of H-8 with H-8′ was 6.4 Hz. Finally, we calculated the configurations between C-7/C-7′, C-8/C-8′ with the lowest energy of compound 1 in ChemDraw [16]. All of these results suggested that the substitution of the THF ring of 1 should possess a 7, 8-trans/8, 8′-trans/7′, 8′-trans relative configuration [17,18,19].
The absolute configuration of 1 was determined by ECD calculation. In the UV spectrum, the maximum absorption around 205 nm exhibited the same UV features for all the lignanamides. Following a standard procedure (SYBYL version 2.0) for the prediction of ECD spectra, the conformational ensemble of 1 in solution was investigated by a molecular mechanics conformational search via the MMFF94 force field. Finally, the lowest energy conformers of (7S,7′S,8S,8′S)-1 and (7R,7′R,8R,8′R)-1 were obtained. Subsequently, the pairs of isomers were re-optimized using DFT at the B3LYP/6-31+G (d) level in gas phase by the GAUSSIAN 09 program with the measured CD data. By comparing the experimental ECD spectrum with the calculated ECD spectra, the absolute configuration of 1 was determined to be (7S,7′S,8S,8′S)-1 (Figure 3). According to these data, the structure of 1 was completely determined (Figure 4), and named lyciumamide K.
Compounds 25 were identified as known compounds cannabisin D (2), cannabisin F (3), (E)-2-(4,5-dihydroxy-2-{3-[(4-hydroxyphenethyl)amino]-3-oxopropyl}phenyl)-3-(4-hydroxy-3,5 -dimethoxyphenyl)-N-(4-hydroxyphenethyl)acrylamide (4), (E)-2-(4,5-dihydroxy-2-{3-[(4-hydroxy phenethyl)amino]-3-oxopropyl}phenyl)-3-(4-hydroxy-3-methoxyphenyl)-N-(4-acetamidobutyl) acrylamide) (5) on the basis of their NMR and MS data referring to the literature [5,20,21].

2.2. Antioxidant Activity

The isolated compounds 15 exhibited obvious antioxidant activities by the ORAC assay with quercetin as the positive control. According to the result of ORAC assay, compounds 1, 2, 4 and 5 showed strong activities with ORAC values (U/mol) of 7.90 ± 0.52, 6.44 ± 0.48, 4.60 ± 0.30, 4.80 ± 0.25, respectively (Table 2, Figure 5). In particular, Compound 1 is the best antioxidant among them.

3. Materials and Methods

3.1. General Experimental Procedures

IR data were recorded with a Nicolet Impact 410-FTIR instrument (Thermo, San Jose, CA, USA). Optical rotations were conducted with JASCO digital polarimeter (JASCO Corporation, Tokyo, Japan). UV spectra were measured on a JASCO V-550 UV/VIS spectrometer (JASCO Corporation, Tokyo, Japan). HR-ESI-MS were obtained from an Agilent 6210 LC/MS TOF mass spectrometer (Agilent Technologies, Santa Clara, CA, USA.). NMR spectra were carried out on a Bruker AV-300 and AV-600 spectrometer (Bruker Instrument, Inc., Zurich, Switzerland). HPLC was performed on an Agilent 1200 HPLC system equipped with a diode array detector, using a column A (Ultimate XB-C18, 5 μm, 4.6. 250 mm, Welch, Potamac, MA, USA) for analysis and a semi-preparative HPLC column B (Ultimate XB-C18, 5 μm, 10 × 250 mm, Welch, Potamac, MA, U.S.A.) for purification. Sephadex LH-20 (25–100 mm) was purchased from Pharmacia and open column chromatography (CC) was conducted on silica gel (200–300 mesh, Haiyang Chemical Group Corporation, Qingdao, China). HSGF254 silica gel TLC plates (0.2 mm thickness, 200 × 200 mm, Qingdao Marine Chemical, Qingdao, China) were used for routine analysis and chemical analysis. The spraying reagent used for TLC detection was 10% H2SO4 in EtOH. 2,2′-azobis (2-methylpropionamidine) dihydrochloride (AAPH), Fluorescein sodium salt and 6-hydroxy-2,5,7,8-tetramethylchroman-2-carboxylic acid (Trolox) were purchased from Macklin (Shanghai, China). All the other reagents and solvents were provided by Tianjin Damao Chemical Company (Tianjin, China).

3.2. Plant Material

The root of Lycium yunnanense Kuang was collected from Malipo County, Wenshan Prefecture, Yunnan Province in June 2015. Its original plant was identified as the solanaceous plant Lycium yunnanense Kuang by Dr. En-De Liu at Kunming Institute of Botany, Chinese Academy of Sciences.

3.3. Extraction and Isolation

The root of Lycium yunnanense Kuang (2.75 kg) was smashed into powder, then extracted twice times with 95% EtOH (10 L) and once time with 80% EtOH (10 L). The solvent of the combined extracts was evaporated and the residue (276 g) was suspended in H2O and successively partitioned with petroleum ether and EtOAc. The EtOAc fraction (40 g) was separated to a silica gel column, a stepwise gradient elution of CH2Cl2/MeOH [100:1, 50:1, 30:1, 20:1, 15:1, 10:1, 5:1 and 2:1 (v/v)] was used and 12 fractions (Fr 1-12) were got through TLC analysis. Fraction 7 (5.9 g) was subjected to a silica gel column eluting with a step-gradient of CH2Cl2/MeOH (from 20:1 to 2:1) to afford 5 subfractions Fr 7-1–Fr 7-5. Fr 7-1 (1.2 g) was chromatographed over a Sephadex LH-20 column (100% MeOH) and was further purified with semi-preparative HPLC (solvent system: MeOH/H2O (40:60)) to yield 1 (7.0 mg, tR = 50.24 min) and 2 (4.0 mg, tR = 42.0 min). Fr 7-2 (1.1 g) was further purified with semi-preparative HPLC (solvent system: MeOH/H2O (52:48)) to yield 3 (15.1 mg, tR = 44.28 min). Fraction 9 (3.0 g) was chromatographed via ODS column at a proportion of MeOH/H2O [30–100%, v/v] to get 3 fractions Fr 9-1–Fr 9-3. Fr 9-2 (742 mg) was chromatographed over a Sephadex LH-20 column (100% MeOH) and was further purified with semi-preparative HPLC (solvent system: MeOH/H2O (38:62)) to yield 4 (5.5 mg, tR = 26.25 min). Fr 9-3 (653 mg) was further purified with semi-preparative HPLC (solvent system: MeOH/H2O (35:65)) to yield 5 (26.7 mg, tR = 42.0 min). All semi-preparative HPLC methods were operated in the flow rate of 3 mL min−1 and detected at 210 nm (UV).
Lyciumamide K (1): White amorphous powder; [ α ] D 20 + 29.4 (c 0.50, MeOH); UV (MeOH) λmax (log ε): 205.2 (4.87), 228.3 (4.47) nm; IR (KBr) νmax: 3449, 1638 cm−1. CD (MeOH) λmax (Δε): 227.2 (−4.52), 207.8 (+1.88) nm; 1H-NMR (CD3OD, 600 MHz) and 13C-NMR (CD3OD, 150 MHz) data, see Table 1; HR-ESI-MS (positive): m/z 665.2474 [M + Na]+ (calcd. for C36H38N2O9Na, 665.2470).

3.4. Computational Details for ECD of Compound 1

In general, the systematic random conformational analysis of two possible stereoisomers ((7S,7′S,8S,8′S)-1 and (7R,7′R,8R,8′R)-1) of 1 was carried out via random searching in the Sybyl-X 2.0 using the MMFF94S force field with an energy cutoff of 2.5 kcal mol−1. Subsequently, the conformers were further optimized using DFT at the B3LYP/6-31+G (d) level in gas phase by using Gaussian09 program (Gaussian, Inc., Wallingford, CT, USA). The energies, oscillator strengths, and rotational strengths (velocity) of the first 60 electronic excitations were calculated using the TD-DFT methodology at the B3LYP/6-311++G (d, p) level in vacuum. The ECD curves were simulated by the overlapping Gaussian function (half the bandwidth at 1/e peak height, σ = 0.2 eV). In order to get the final spectra, The ECD spectrum were weighted by the Boltzmann distribution of each conformer and their relative Gibbs free energy (ΔG). Theoretical ECD spectrum of the corresponding enantiomer was obtained by directly inverse of the ECD spectrum of the calculated model molecule, respectively. The calculated ECD spectrum of (7S,7′S,8S,8′S)-1 and (7R,7′R,8R,8′R)-1 were subsequently compared with the experimental spectra, respectively [22,23,24].

3.5. Antioxidant Activity

Oxygen Radical Absorbance Capacity (ORAC) Assay [25,26,27]. Briefly, 20 μL, 10 μM sample or 20 μL, 20 μM Trolox to be tested (prepared with 75 mmol/L potassium phosphate buffer, pH 7.4) and potassium phosphate buffer were added to each well of 96-well plate, respectively. Fluorescein sodium salt (final concentration of 63 nmol/L) and 140 μL AAPH (final concentration 12.8 mmol/L) were quickly added to the 96-well plate in a temperature of 37 °C in a fluorescence analyzer. Fluorescence was immediately read at 538 nm with 485 nm excitation wavelength. The decrease of fluorescence was read every two minutes for 2 h at 37 °C, with 5 s stirring before measurement. Trolox solution was used as the internal control. The area under the curve (AUC) was calculated as:
AUC = 2 × (f0 +f1 + … + fn-1 + fn) − f0 − fn
where f0 was the initial fluorescence read at 0 min, and fn was the fluorescence read at corresponding time. The Net AUC were different values between the AUC of the blank and each sample. ORAC values were expressed as:
ORAC value = [(AUCSample − AUC + AAPH)/(AUCTrolox − AUC + AAPH)] × (molarity of Trolox/molarity of sample) = (Net AUCSample/Net AUCTrolox) × (molarity of Trolox/molarity of sample)

4. Conclusions

A new lignanamide dimer (1) as well as four known ones (25) were isolated from the root of Lycium yunnanense Kuang. The structure of the new lignanamide was elucidated on the basis of HR-ESI-MS, NMR spectral data and especially quantum chemistry ECD calculations. The antioxidant activities of all compounds were tested by ORAC assay and the results showed that all of them exhibited good antioxidant activities. These findings suggested the potential of these compounds as a medicinal supplement for the treatment and prevention of diseases related to oxidation stress.

Supplementary Materials

The following are available online. IR, UV, CD, HR-ESI-MS, NMR spectra of compounds 1 as well as other supporting data.

Acknowledgments

This work was financially supported by grants from the National Natural Science Foundation of China (No. 81573578). We would like to give thanks to the Xiangxue Pharmaceutical Factory Co., Ltd. (Guangzhou, China) for helping test NMR spectrum.

Author Contributions

Xin-Heng Zheng and Guang-Xiong Zhou conceived and designed the experiments; Xin-Heng Zheng, Yuan-Peng Huang, Qiu-Ping Liang, Ting Lan performed the experiments; Xin-Heng Zheng, Wei Xu, and Guang-Xiong Zhou analyzed the data; Xin-Heng Zheng and Guang-Xiong Zhou wrote the paper.

Conflicts of Interest

The authors declare no conflict of interest.

Abbreviations

HR-ESI-MSHigh Resolution Electron Spray Ionization Mass
NMRNuclear Magnetic Resonance
ECDElectronic Circular Dichroism
HPLCHigh Performance Liquid Chromatography
1H-1H COSYTwo Dimensional 1H Correlation
DEPTDistortionless Enhancement by Polarization Transfer
HSQC1H-Detected Heteronuclear Single-Quantum Coherence
HMBC1H-Detected Heteronuclear Multiple-Bond Correlation
NOESYNuclear Overhauser Effect Spectroscopy

References

  1. Committee of National Pharmacopoeia. China Pharmacopoeia; Chines Medical Science Press: Beijing, China, 2015; Volume 1, p. 124. [Google Scholar]
  2. Xie, L.W.; Atanasov, A.G.; Guo, D.A.; Malainer, C.; Zhang, J.X.; Zehl, M.; Guan, S.H.; Heiss, E.H.; Urban, E.; Dirsch, V.M.; et al. Activity-guided isolation of NF-κB inhibitors and PPARγ agonists from the root bark of Lycium chinense Miller. J. Ethnopharmacol. 2014, 152, 470–477. [Google Scholar] [CrossRef] [PubMed]
  3. An, Y.W.; Zhan, Z.L.; Xie, J.; Yang, Y.N.; Jiang, J.S.; Feng, Z.M.; Ye, F.; Zhang, P.C. Biocative octahydroxylated C21 steroids from the root bark of Lycium chinense. J. Nat. Prod. 2016, 79, 1024–1034. [Google Scholar] [CrossRef] [PubMed]
  4. Yang, Y.N.; An, Y.M.; Zhan, Z.L.; Xie, J.; Jiang, J.S.; Feng, Z.M.; Ye, F.; Zhang, P.C. Nine new compounds from the root bark of Lycium chinense and their α-glucosidase inhibitory activity. RSC Adv. 2017, 7, 805–812. [Google Scholar] [CrossRef]
  5. Zhang, J.X.; Guan, S.H.; Feng, R.H.; Wang, Y.; Wu, Z.Y.; Zhang, Y.B.; Bi, K.S.; Guo, D.A. Neolignanamides, Lignanamides, and other phenolic compounds from the root bark of Lycium chinense. J. Nat. Prod. 2013, 76, 51–58. [Google Scholar] [CrossRef] [PubMed]
  6. Lee, D.G.; Park, Y.; Kim, M.R.; Jung, H.J.; Seu, Y.B.; Hahm, K.S.; Woo, E.R. Anti-fungal effects of phenolic amides isolated from the root bark of Lycium chinense. Biotechnol. Lett. 2004, 26, 1125–1130. [Google Scholar] [CrossRef] [PubMed]
  7. Funayama, S.; Zhang, G.R.; Nozoe, S. Kukoamine B, a spermine alkaloid from Lycium chinense. Phytochemistry 1995, 38, 1529–1531. [Google Scholar] [CrossRef]
  8. Yahara, S.; Shigeyama, C.; Ura, T.; Wakamatsu, K.; Yasuhara, T.; Nohara, T. Cyclic peptides, acyclic diterpene glycosides and other compounds from Lycium chinense Mill. Chem. Pharm. Bull. 1993, 41, 703–709. [Google Scholar] [CrossRef] [PubMed]
  9. Yao, X.; Peng, Y.; Xu, L.J.; Li, L.; Wu, Q.L.; Xiao, P.G. Phytochemical and biological studies of Lycium medicinal plants. Chem. Biodivers. 2011, 8, 976–1010. [Google Scholar] [CrossRef] [PubMed]
  10. Le, L.; Chiu, F.; Ng, K. Identification and quantification of antioxidants in Fructus lycii. Food Chem. 2007, 105, 353–363. [Google Scholar] [CrossRef]
  11. Chang, R.C.; So, K.F. Use of anti-aging herbal medicine, Lycium barbarum, against aging-associated diseases. What do we know so far? Cell. Mol. Neurobiol. 2008, 28, 643–652. [Google Scholar] [CrossRef] [PubMed]
  12. Li, X.M. Protective effect of Lycium barbarum polysaccharides on streptozotocin-induced oxidative stress in rats. Int. J. Biol. Macromol. 2007, 40, 461–645. [Google Scholar] [CrossRef] [PubMed]
  13. Wang, C.C.; Chang, S.C.; Stephen, L.B.; Chen, B.H. Isolation of carotenoids, flavonoids and polysaccharides from Lycium barbarum L. and evaluation of antioxidant activity. Food Chem. 2010, 120, 184–192. [Google Scholar] [CrossRef]
  14. Henrici, A.K.; Kaloga, M.K.; Eich, E.K. Jacpaniculines, the first lignanamide alkaloids from the convolvulaceae. Phytochemistry 1994, 37, 1637–1640. [Google Scholar] [CrossRef]
  15. Chen, H.; Li, Y.J.; Sun, Y.J.; Gong, J.H.; Du, K.; Zhang, Y.L.; Su, C.F.; Han, Q.Q.; Zheng, X.K.; Feng, W.S. Lignanamides with potent antihyperlipidemic activities from the root bark of Lycium chinense. Fitoterapia 2017, 122, 119–125. [Google Scholar] [CrossRef] [PubMed]
  16. ChemDraw Software, version 14.0; CambridgeSoft Inc.: Cambridge, MA, USA, 2015.
  17. Chaves, M.H.; Roque, N.F. Amides and lignanamides from Porcelia macrocarpa. Phytochemistry 1997, 46, 879–881. [Google Scholar] [CrossRef]
  18. Matsushita, H.; Miyase, T.; Ueno, A. Ligan and terpene glycosides from Eplmedium sagittatum. Phytochemistry 1991, 30, 2025–2027. [Google Scholar] [CrossRef]
  19. Fu, S.N.; Wang, F.; Li, H.Y.; Bao, Y.X.; Yang, Y.; Shen, H.F.; Lin, B.R.; Zhou, G.X. Secondary metabolites from marine-derived Streptomyces antibioticus strain H74-21. Nat. Prod. Res. 2016, 30, 2460–2467. [Google Scholar] [CrossRef] [PubMed]
  20. Sakakibara, I.; Ikeya, Y.; Hayashi, K.; Marrsuhashi, H. Three phenyldihydronaphthalene lignanamides from fruits of Cannabis sativa. Phytochemistry 1992, 31, 3219–3223. [Google Scholar] [CrossRef]
  21. Sakakibara, I.; Ikeya, Y.; Hayashi, K.; Marrsuhashi, H. Three acyclic bis-phenylpropane lignanamides from fruits of Cannabis sativa. Phytochemistry 1995, 38, 1003–1007. [Google Scholar] [CrossRef]
  22. Sybyl Software, version X 2.0; Tripos Associates Inc.: St. Louis, MO, USA, 2013.
  23. Frisch, M.J.; Truck, G.W.; Schlegel, H.B. Gaussian 09, Revision A.01, Gaussian Inc.: Wallingford, CT, USA, 2009.
  24. Stephens, P.J.; Harada, N. ECD cotton effect approximated by the Gaussian curve and other methods. Chirality 2010, 22, 229–233. [Google Scholar] [CrossRef] [PubMed]
  25. Huang, D.; Ou, B.; Hampsch-Woodill, M.; Flanagan, J.A.; Prior, R.L. High-throughput assay of oxygen radical absorbance capacity (ORAC) using a multichannel liquid handling system coupled with a microplate fluorescence reader in 96-well format. J. Agric. Food Chem. 2002, 50, 4437–4444. [Google Scholar] [CrossRef] [PubMed]
  26. Xu, J.K.; Yao, X.S.; Hiroshi, K. Oxygen radical absorbance capacity assay and its application. Chin. J. Pharmacol. Bull. 2006, 22, 1015–1021. [Google Scholar]
  27. Claudia, G.I.; Erika, S.; Nathalie, B.; Bruno, B.; Atikorn, P.; Maria, C.F. Antioxidant activity of protocatechuates evaluated by DPPH, ORAC, and CAT methods. Food Chem. 2016, 194, 749–757. [Google Scholar]
Sample Availability: Samples of the compounds 1–5, dry preserved, are available from the authors. If necessary, we could provide it in very small amount in the further.
Figure 1. The structures of compounds 15.
Molecules 23 00770 g001
Figure 2. Key 1H–1H COSY and HMBC correlations for compound 1.
Molecules 23 00770 g002
Figure 3. Experimental ECD spectra of compound 1 and the calculated ECD spectra of (7S,7′S,8S,8′S)-1 and (7R,7′R,8R,8′R)-1.
Molecules 23 00770 g003
Figure 4. The chemical structure of 1, indicated the absolute configurations of chiral centers.
Molecules 23 00770 g004
Figure 5. Fluorescence decay curves induced by AAPH in the presence of compounds 15 at 1 μM.
Molecules 23 00770 g005
Table 1. 1H and 13C-NMR data of compound 1 (CD3OD, δ in ppm, J in Hz).
NO.13C-NMR (δC a)1H-NMR (δH b)
1, 1′133.2-
2, 2′110.87.03 (d, 1.5)
3, 3′149.3-
4, 4′147.8-
5, 5′116.26.79 (d, 8.1)
6, 6′120.56.81 (dd, 1.5, 8.1)
7, 7′86.25.25 (d, 2.8), 5.26 (d, 2.8)
8, 8′60.63.34 (dd, 2.8, 6.4)
9, 9′172.1-
1′′, 1′′′131.0-
2′′, 2′′′130.76.84 (d, 8.4)
3′′, 3′′′116.26.64 (d, 8.4)
4′′, 4′′′156.8-
5′′, 5′′′116.26.64 (d, 8.4)
6′′, 6′′′130.76.84 (d, 8.4)
7′′, 7′′′35.72.53 (t, 7.2), 2.59 (t, 7.2)
8′′, 8′′′42.53.17 (t, 7.2), 3.39 (t, 7.2)
3, 3′-OCH356.43.88 (s)
a Measured at 150 MHz. b Measured at 600 MHz.
Table 2. Antioxidant activities of compounds 15.
CompoundORAC (U/mol) a
17.90 ± 0.52
26.44 ± 0.48
32.16 ± 0.21
44.60 ± 0.30
54.80 ± 0.25
Quercetin b2.59 ± 0.21
Note: U was equivalent Trolox of 1 mol. a Mean ORAC values ± SD (n = 10) are shown. b Used as positive control.

