Article

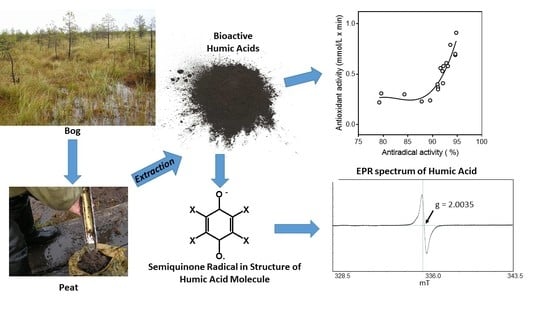
Physicochemical Characterization and Antioxidant Activity of Humic Acids Isolated from Peat of Various Origins

by
Maria V. Zykova
1,†,
Igor A. Schepetkin
2,†,
Mikhail V. Belousov
3,
Sergey V. Krivoshchekov
3,4,
Lyudmila A. Logvinova
1,
Kristina A. Bratishko
1,
Mekhman S. Yusubov
1,4,
Sergey V. Romanenko
1,4 and
Mark T. Quinn
2,*
1
Department of Chemistry, Siberian State Medical University, Tomsk 634050, Russia
2
Department of Microbiology and Immunology, Montana State University, Bozeman, MT 59717, USA
3
Department of Pharmaceutical Analysis, Siberian State Medical University, Tomsk 634050, Russia
4
Research School of Chemical and Biomedical Technologies, Tomsk Polytechnic University, Tomsk 634050, Russia
*
Author to whom correspondence should be addressed.
These authors contributed equally to this work.
Molecules 2018, 23(4), 753; https://doi.org/10.3390/molecules23040753
Submission received: 5 March 2018 / Revised: 20 March 2018 / Accepted: 22 March 2018 / Published: 24 March 2018
(This article belongs to the Special Issue The Antioxidant Capacities of Natural Products)

Abstract

:
Although humic acids (HAs) from peat exhibit various therapeutic properties, there is little information available concerning their physicochemical and antioxidant properties. To address this issue, nine different types of peat, including oligotrophic, mesotrophic, and minerotrophic peat samples, were used for isolation of HA fractions by basic (HAb) and pyrophosphate (HAp) extractions. Physical parameters of the HAs were analyzed by UV-Vis, fluorescent, infrared (IR), and electron paramagnetic resonance (EPR) spectroscopy. Average Mr of the fractions ranged from 17.2 to 39.7 kDa, while their humification index (HIX) varied from 0.49 to 1.21. HAp fractions had a higher content of aromatic structures compared to HAb fractions. Moreover, HAp fractions had a significantly higher content of phenolic OH groups (3.6 ± 0.5 mmol/g) versus HAb (3.1 ± 0.5 mmol/g). All HA fractions exhibited antioxidant activity in radical scavenging and electrochemical assays, and their EPR signal had a single line with g = 2.0035, which is consistent with semiquinone type radicals. Furthermore, the HIX was found to be important in determining the number of semiquinone-type free radicals in the HA structures. Overall, these data provide a molecular basis to explain at least part of the beneficial therapeutic properties of peat-derived HAs.

Graphical Abstract

1. Introduction

Peat is organic soil formed as a result of incomplete disintegration and humification of marsh plants under high humidity conditions. The organic matter of peat consists of humic substances (up to 40%), lignin, polysaccharides, lipids, pectins, hemicellulose, and cellulose [1]. Humic substances are heterogeneous natural biopolymers that are contained in plant-based substances (peat, brown coal, and benthic sediment) and are represented mostly by humic acids (HAs) [1].
HAs are employed in oriental medicine, where they continue to be used extensively for treatment of skin diseases, cold stress, rheumatic pain, diabetes, kidney stones, heart ailments, leprosy, and immune system diseases [2,3]. Peat preparations are mainly used as external remedies but can also be used as internal drugs [2,4,5]. For example, HAs from various sources have been used externally for the treatment of hematoma, phlebitis, desmorrhexis, myogelosis, arthrosis, polyarthritis, osteoarthritis, and osteochondrosis [2,3]. Regarding internal use, HAs have been shown to be particular useful in therapy for diarrhea, gastritis, stomach ulcers, dysentery, colitis, and diabetes mellitus [2,3,6]. HAs have been reported in a number of studies to exhibit anti-inflammatory and immunomodulatory properties [2,3,7,8,9,10,11]. Recently, we demonstrated that peat-derived HAs exhibited antihypoxic, hepatoprotective, cardiovascular, and vasodilating activities [12,13,14,15]. Sodium humate has also been reported to be radioprotective in rats [16].
The various anti-inflammatory, immunomodulatory, and radioprotective effects of natural substances seem to be associated, at least in part, with their antioxidant and antiradical effects [17,18,19,20,21]. For example, the neuroprotective effect of HAs in a focal cerebral ischemia rat model is likely due to the antioxidant properties of HAs [22]. In renal ischemia reperfusion injury in rats, the therapeutic effects of HAs were associated with the prevention of oxidative stress [23]. HAs are protective against iron-induced hepatotoxicity and cardiotoxicity via their antioxidant and free radical scavenging effects [24]. Indeed, various humic substances are powerful antioxidants and possess reactive oxygen species (ROS) [superoxide anion (O2·−) and hydroxyl radical (OH•)] scavenging properties [25,26]. The reactivity of HAs has been attributed to the presence of phenolic and quinoid moieties [27], and HAs can behave as electron donors or acceptors, depending on the redox state of the system [27]. Thus, each HA macromolecule contains multiple antioxidant sites, a property that makes them very attractive from the environmental and biomedical point of view [28]. Considering that HAs have significant antioxidant capacity and do not have toxicity for living organisms, they have significant potential for use in the pharmaceutical or food industries [29,30,31,32].
Although antiradical and antioxidant activities of some native humic substances have been reported previously [28,32,33,34], there is no information regarding specific HAs isolated from peat. Because peat could represent an important source of HAs for the pharmaceutical industry, characterization and standardization of their physical and chemical parameters is necessary [35], especially since no clear relationships have been reported between the pharmacological activities of peat-derived HAs and their humification degree, molecular size distribution, or stable-free radical content [36]. Peat is exposed to a relatively high O2 levels, which leads to intensification of oxidation processes and to changes in chemical and biological characteristics of humic substances [37]. This, humification process can in turn lead to changes in pharmacological properties, such as enhancement of antiulcerogenic and antiradical activities [38].
The goal this work was to characterize the antiradical/antioxidant properties of HAs as a function their origin, method of isolation, and physicochemical properties. Thus, we quantified the antioxidant activity of a representative range of peat-derived HA fractions with differing physical and chemical properties.

2. Results and Discussion

2.1. Isolation of the HA Fractions

The nine peat samples analyzed varied in the degree of decomposition from 5–10% (low-mire minerotrophic samples Peat 1 and Peat 4) to 40–45% (samples of raised bog oligotrophic Peat 7 and mesotrophic Peat 9), with the ash content ranging from 2.6% (Peat 4) to 16.3% (Peat 7). The HA fractions, isolated using basic (NaOH) and pyrophosphate (Na4P2O7) extractions were designated as HAb1-9 and HAp1-9, respectively. The peat-derived HA fractions represent amorphous dark brown odorless powder, which is highly soluble in water. Basic extraction resulted in isolation of 1.5–3 times more HA than extraction by Na4P2O7 (Table 1).

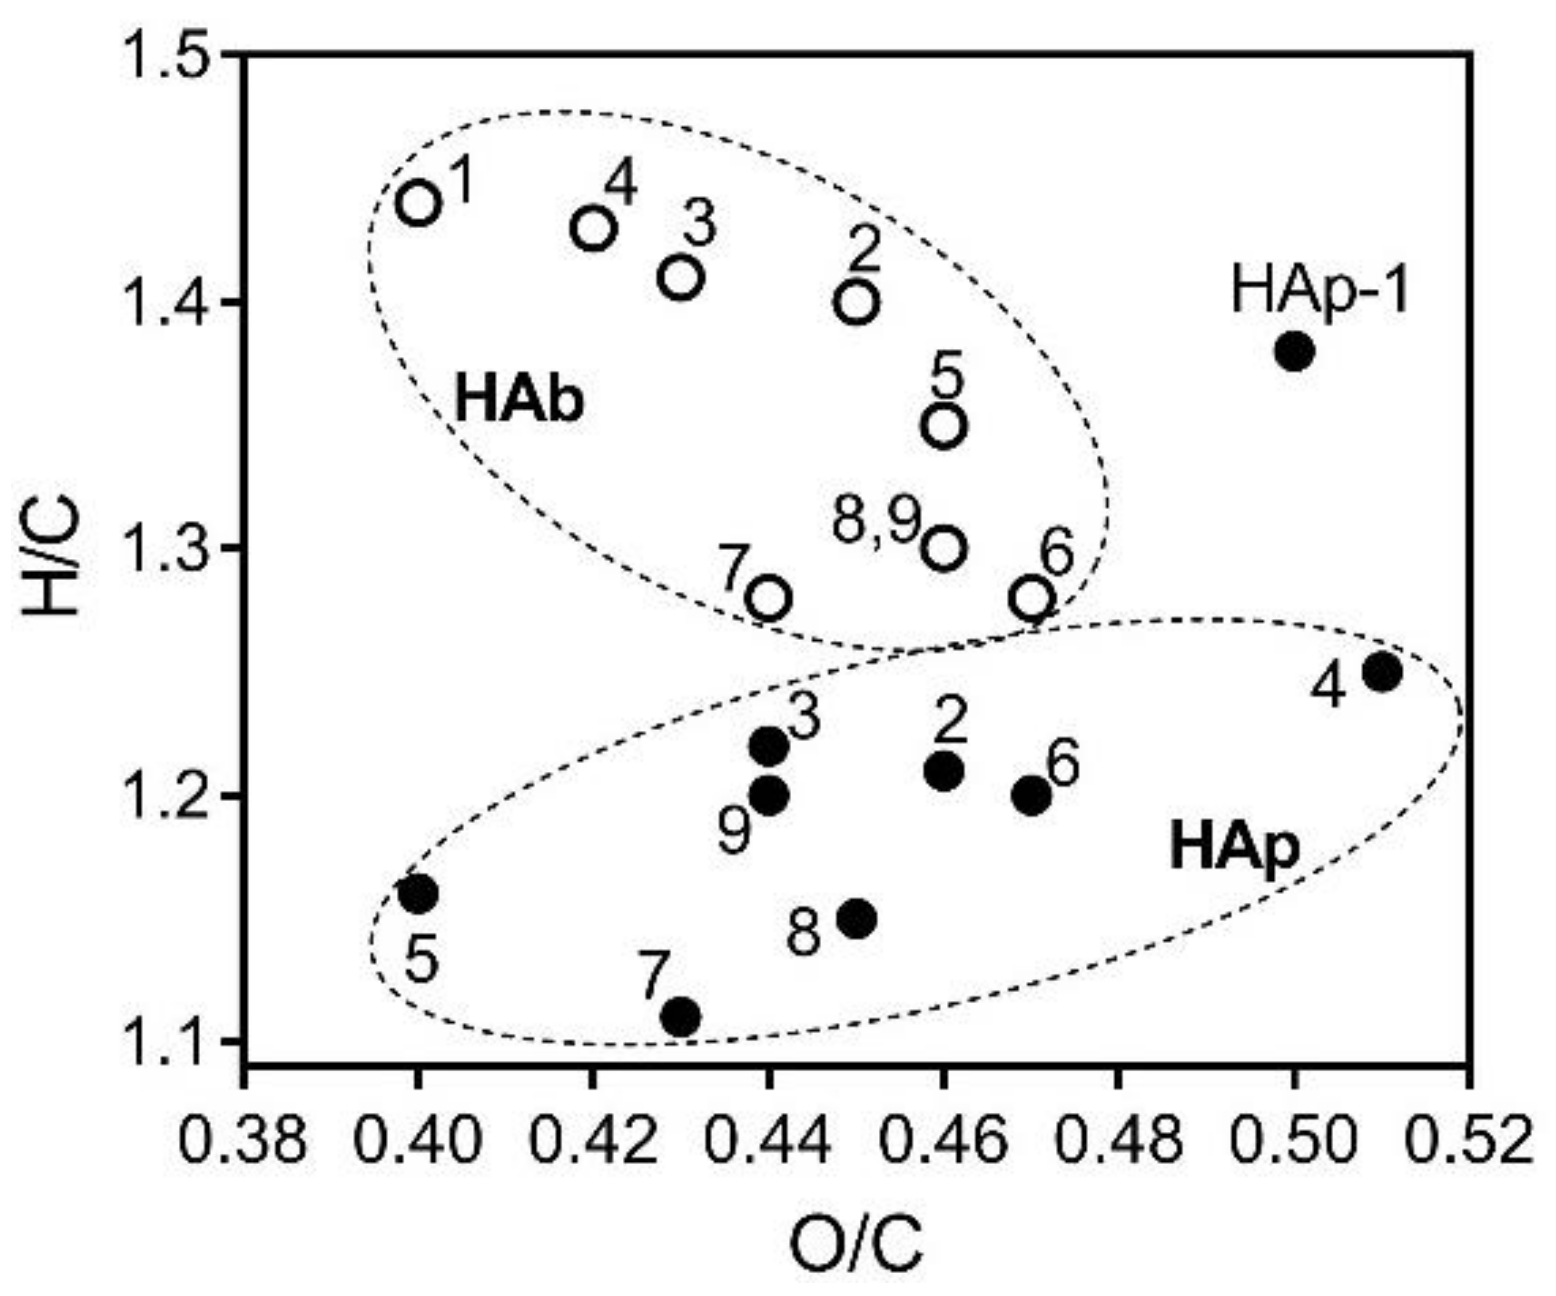
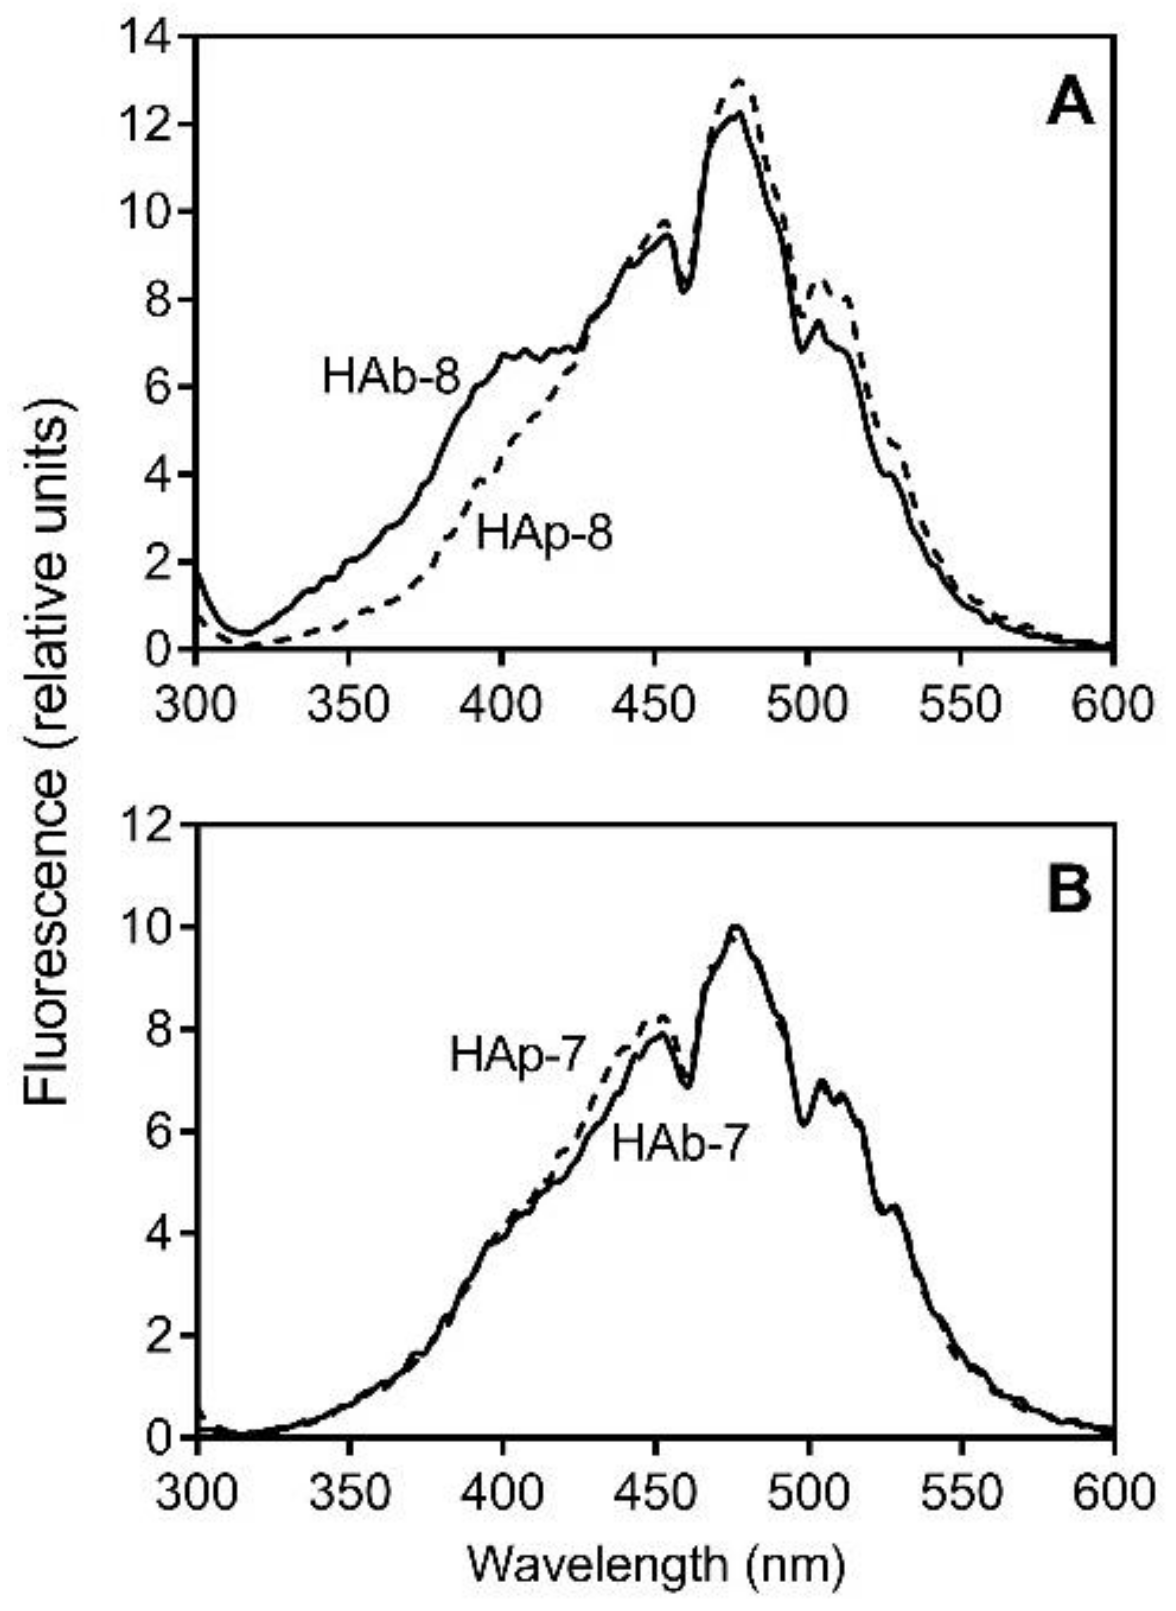
2.2. Partial Structural Characterization of the HA Fractions

The main physicochemical parameters of the HA fractions resemble criteria developed previously for standardization of peat-derived HAs isolated for medical or biological purposes [14,35,39]. The average molecular weight (Mr) of the HA fractions ranged from 17.2 to 39.7 kDa (Table 1), which is close to the range observed previously for soil and peat-derived HAs [40]. No difference in Mr was found between HAb and HAp fractions. However, HAb-1 and HAp-1 isolated from raised bog sphagnum (Peat 1) had the highest Mr (34.6 and 39.7 kDa), respectively, while the average Mr for the other 16 fractions was 21.5 ± 4.0 kDa.
The E4:E6 ratio (ratio of optical densities at 465 nm (E4) and 665 nm (E6)) in HA fractions isolated by basic extraction was significantly (p < 0.0001) higher than that of HA fractions obtained by pyrophosphate extraction (3.1 ± 0.19 versus 1.6 ± 0.28, respectively) (Table 1). A lower E4:E6 ratio value is associated with more abundant aromatic components and a higher degree of condensation in the structure of humic substances [41].
Infrared (IR) spectra of the HA fractions reflect the presence of typical absorption bands for peat-derived HAs [10,39] (e.g., see Supplementary Figure S1). In particular, the spectrum contained characteristic absorption bands at 3500–3300 cm−1 (OH stretching vibrations); 3250–3200 cm−1 (amide and amine N-H stretching vibrations); 2920, 2860, 1460–1440, and 700–900 cm−1 (stretching vibrations of –CH3 and –CH2 in side chains); 2600–2500 cm−1 (vibrations of carboxylic acids); 1725–1700 cm−1 (stretching vibrations of C=O groups that could represent ketones, aldehydes, carboxylic acids, and their functional derivatives); 1625–1610 cm−1 [in-plane vibrations of conjugated C-C bonds (aromatic, C=C) and C-O bonds (carbonyls bound by H-bonds, carboxylate ions, C=O) in an aromatic skeleton and quinones]; 1510–1500 cm−1 (uncondensed aromatic compounds bound to N and O atoms); 1250–1225 cm−1 [stretching (C-O) and bending (O-H) vibrations]; and 1050–1150 cm−1 (alcohol and carbohydrate OH stretching vibrations).
The method of baseline and relative densities was applied to obtain a quantitative estimate of the intensity of the absorption bands in the IR region and the relative concentrations of functional groups [39]. This analysis indicated that HAp fractions differ from HAb fractions by having a higher content of aromatic structures and phenolic (aromatic OH) groups in the HA molecules, as estimated by the A1610/A2920 and A3400/A1610 ratios, respectively (Figure 1A,B). A1610, A2920, and A3400 are optical densities for aromatic (C=C), aliphatic, and OH groups, respectively [42,43]. A plot of A1610/A2920 versus E4:E6 demonstrated a negative linear correlation (r = −0.66; p < 0.03; n = 18), supporting the conclusion that the low E4:E6 ratio is indeed associated with aromatic components [41] (Figure 1C). On the other hand, there was no definite relationship between HA extraction method and specific IR band for carboxylic groups (C=O groups, A1720) associated with aliphatic structures (A2920) in the HA molecules (data not shown).
Elemental analysis indicated that the substances isolated from peat should be classified as HAs [35]. The results showed that the HA fractions had a C content of 42.5 ± 0.6% (HAp-1) to 54.2 ± 0.68% (HAb-3), N content of 2.2 ± 0.03% (HAp-2) to 3.9 ± 0.04% (HAb-1, HAp-1, and HAb-3), H content of 4.1 ± 0.04% (HAp-7) to 6.0 ± 0.06%, and O content of 27.8 ± 0.36% to 32.8 ± 0.38% (Table 2). H/C and O/C ratios are commonly used as indicators of structural characteristics of humic substances. The generally low values for H/C in all samples indicated the presence of condensed aromatic ring structures, while the high O/C ratios may be indicative of the degree of oxygen substitution in the HA structures [44]. Indeed, a plot of H/C in all HA fractions versus E4:E6 demonstrated some linear correlation (r = 0.66; p < 0.005; n = 18) between these values.
The van Krevelen diagram, created by plotting H/C versus O/C (Figure 2), showed that the cluster of HAp fractions was located in a region with lower H/C values compared to the cluster of HAb fractions, indicating a higher content of aromatic and/or condensed aromatic molecules [45,46], which is supported by the UV-Vis (E4:E6) and IR (A1610/A2920) spectroscopy analyses of these fractions. Notably, HAb and HAp isolated from low-mire peat samples with a high degree of decomposition (Peat 5–9) were characterized by more aromatic structures compared to HA fractions obtained from raised bog peat samples (Peat 1–4), which is consistent with our previous publications [11,39]. The HAb fractions were mainly aliphatic in nature and were comprised mainly of molecules having H/C values centered at 1.3–1.4 [47]. There was no difference in the average O/C values of the HAb and HAp fractions, which is indicative of their similar carbohydrate content, carboxylic groups, and degree of oxidation.
To improve peak resolution compared with the conventional emission fluorescence technique, we used synchronous-scan fluorescence analysis [48]. In general, synchronous-scan fluorescence spectra of the 18 HA fractions reflected features of soil HAs [49]. However, we found that the spectra of HAb fractions had an additional fluorescence peak at 390–410 nm, except for HA fractions isolated from low-mire Peat 6 and 7. For example, the fluorescence spectra of the HAb-7–HAp-7 and HAb-8–HAp-8 pairs are shown in Figure 3.
Fluorescence spectrometry was also used to determine the extent of humification in the peat HAs [50,51]. The humification index (HIX) ranged from 0.49 to 1.21 in the HA samples (Table 1) and indicates the degree of complexity and condensed (aromatic) nature of the fractions [50,51]. The linear correlation coefficients between E4:E6 and HIX were not statistically significant (p > 0.05).

2.3. Content of Carboxylic and Phenolic Groups in the HA Fractions

Carboxylic and phenolic groups are the most important ionizable sites present in HAs and are likely to determine many of the proton binding properties of these substances [52]. We analyzed the content of these groups by chemical titration. According to the values obtained for total acidity of the peat HAs (Table 3), 50% to 64% of the HA acidic functional groups can be attributed to phenolic OH groups.
These data correlate well with our IR analysis, specifically with the A3400/A1610 and A1720/A2920 ratios for OH and COOH groups, respectively (Figure 4). We found that HAp fractions have significantly (p < 0.02) higher content of phenolic OH groups (3.6 ± 0.5 mmol/g) compared to HAb (3.1 ± 0.5 mmol/g). However, HAb and HAp showed no significant differences in their average content of COOH groups (2.6 ± 0.1 mmol/g versus 2.7 ± 0.2 mmol/g, respectively).

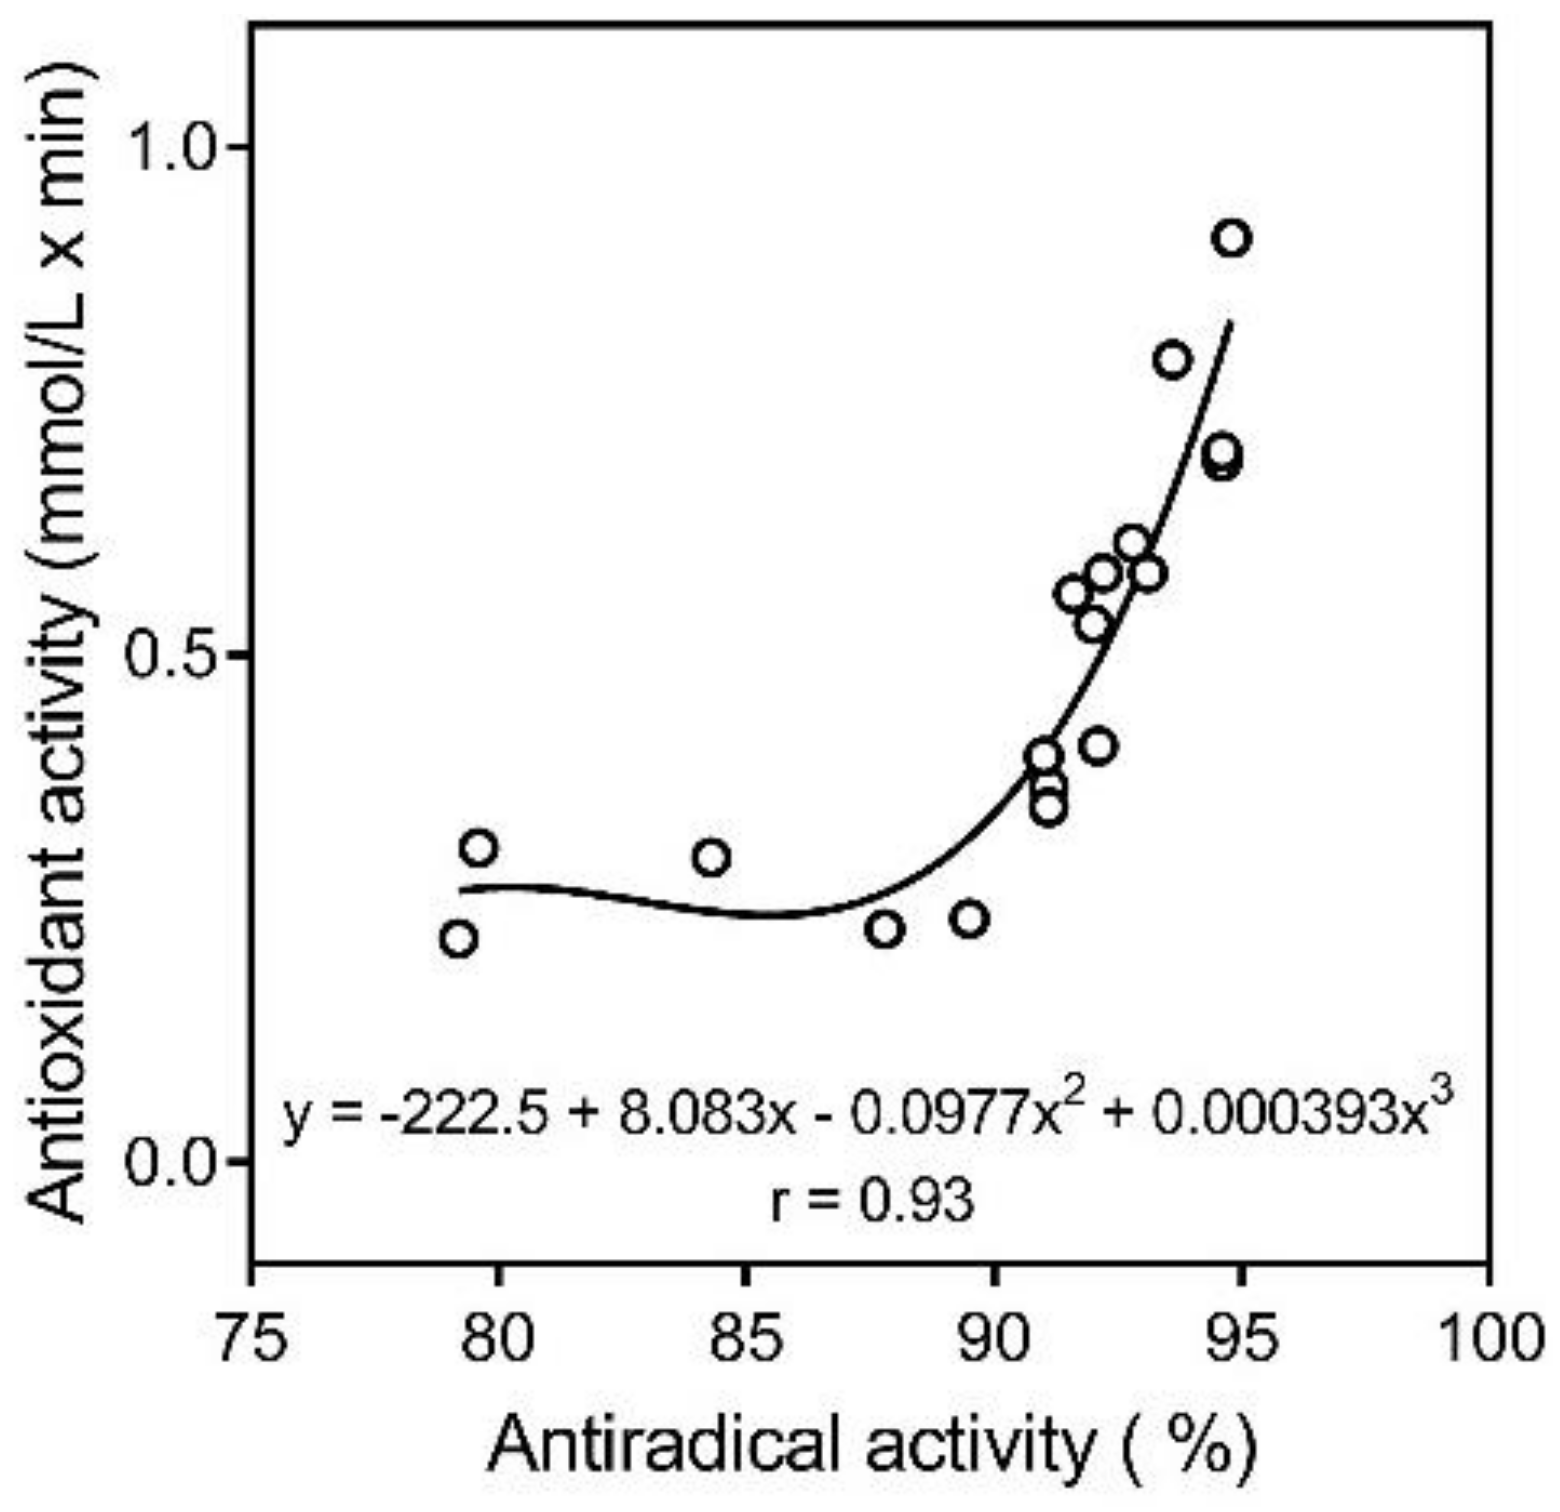
2.4. Antioxidant Activity of the HA Fractions

Antioxidant activity of the HA samples was evaluated in electrochemical reduction and 1,1-diphenyl-2-picrylhydrazyl (DPPH) radical-scavenging assays. Electrochemical O2 reduction at the mercury film electrode proceeds at the cathode in several stages, with formation of O2·− and H2O2. The voltammetric methodology allows evaluation of the antioxidant activity of natural compounds and, moreover, consideration of their influence on the kinetics of the electrochemical O2 reduction can suggest mechanisms of interaction of the compounds with ROS in model systems [53]. We found that the antioxidant activity of HAp fractions was higher than that of the HAb fractions, with two exceptions being the HA fractions isolated from raised bog peat (Peat 1 and 3) (Table 4).
To determine free radical scavenging activity of the HA fractions, we evaluated reaction with DPPH (Table 4). Additionally, nonlinear (polynomial) extrapolation performed on plots of antiradical activity in the DPPH assay versus antioxidant activity in electrochemical assay demonstrated a good correlation coefficient (r = 0.93) (Figure 5).
Interaction of the proton of these oxygen-containing functional groups in the structure of HAs (HA–H) with the active free radical DPPH• is responsible for the ability of humic substances to bind free radicals in the system and to remove active radical species from the reaction sphere, according to the following reaction [34]:
HA–H + DPPH•→HA• + DPPH–H
The antioxidant/antiradical activity of HAs is attributed to the presence of semiquinone-type radicals in their structure [54], and the stability of these radicals is sustained by the condensed aromatic structures in HA [55]. We found that the electron paramagnetic resonance (EPR) signal of all HA fractions exhibited a single line with g = 2.0035 ± 0.0002, which is consistent with the presence of semiquinone-type radicals [56] (e.g., see Supplementary Figure S2). The total amount of the semiquinone-type free radicals in each HA fraction was evaluated by EPR as the number of paramagnetic centers (PMC) (Table 4). Note, however, that we did not find a significant difference in the average PMC content in HAb versus HAp fractions (7.8 ± 1.6 and 8.5 ± 4.1 spin/g × 10−16, respectively).
HAs contain a wide variety of moieties that are oxidized at different potentials. When they are oxidized, they release protons and electrons and undergo irreversible follow-up reactions [27]. For example, electron and hydrogen-donating phenolic antioxidants can react with ROS in a termination reaction [27,57]. The activity of many natural compounds toward DPPH is due to the presence of a variety of phenol fragments and correlates with the total concentration of OH groups [58]. Indeed, Aeschbacher et al. [27] reported that phenolic moieties are the major electron donating groups in a humic substances. On the other hand, the number of quinoid moieties account for only part of the HA structural fragments involved in electron transfer. Apart from quinoid/semiquinoid moieties, phenolic groups oxidized to phenoxyl radicals can also contribute to antioxidant activity of HAs [33,59]. The EPR and chemical titration analyses show that higher amounts of PMC and phenolic OH groups in the HA structure improves antioxidant activity, with significant coefficients of linear correlation r = 0.60 (p < 0.01) and r = 0.84 (p < 0.001), respectively (Figure 6). It should be noted that HAp fractions from low-mire grass peat samples (Peat 6 and 7) have the highest number of PMC and antioxidant activities (Table 4). Moreover, in accordance with Schnitzer and Levesque [60], we found that the number of PMC correlated significantly (r = 0.72, p < 0.001) with the concentration of phenolic OH groups (Figure 7A). No correlation was found between the content of carboxylic groups and antiradical activity (p < 0.05; r = 0.09) or antioxidant activity (p < 0.05; r = 0.11). Thus, although a strong correlation was previously reported between complement-fixing activity and carboxylic group content in some fractions of humic substances [8], the carboxylic groups probably do not play an important role in antiradical/antioxidant activity of peat-derived HAs.
In the present study, the negative correlation between HIX and number of PMC was found for most of HAs, with the exception of fractions derived from low-mire samples (Peat 6 and 7; Figure 7B). According to Rosa et al. [61], phenolic groups formed during organic matter decomposition undergo oxidation, producing quinone- and hydroquinone-type structures. These structures, which are predecessors of semiquinone-type free radicals, can presumably increase as the state of humification advances and should be associated with increasing HIX. Indeed, a positive relationship was reported between HIX obtained using laser-induced fluorescence spectroscopy (LIFS) and the number of semiquinone radicals [62]. Conversely, quinone- and hydroquinone-type structures have their own fluorescence and could affect the optic parameters measured for HAs. Moreover, reduction of HAs could be accompanied by a blue-shift in their fluorescence spectrum [63], which may be due to the increase of hydroquinone/quinone-groups and decreasing HIX calculated as ΣI435→480)/ΣI300→345 (see Methods).
In conclusion, peat-derived HAp fractions differ from HAb mainly in the higher content of condensed and/or aromatic structures and phenolic groups. A high number of semiquinone-type radicals and antioxidant/antiradical activity were found in HA fractions isolated from low-mire peat samples (sampling at > 2 m depth of a peat column). Thus, the high level of antioxidant activity of low-mire peat HAp samples may contribute to their beneficial therapeutic properties, and future research on this issue is warranted.

3. Materials and Methods

3.1. Isolation of HAs from Peat

For HA isolation, nine representative types of peat were taken from major peat bogs in the Tomsk region of Russia, including the oligotrophic bog located in southern taiga zone between the Iksa and Bakchar rivers and representing the northeastern spurs of the Great Vasyugan Mire [64] (56°58′ N latitude and 82°36′ W longitude; Peat 1–4, 6, 7, and 9) and the eutrophic bogs Klyukvennoe (56°23′ N latitude and 84°42′ W longitude; Peat 5) and Tagan (56°21′ N latitude and 84°48′ W longitude; Peat 8). Different peat profiles in the bogs were chosen, and samples were taking from different depths of the peat sections. The degree of decomposition of the peat samples was analyzed microscopically (at 56–140× magnification) as a percentage of groundmass to volumetric amount of total tissues in the peat samples. For isolation of HAs, the peat was desiccated at room temperature, milled, and treated with 0.1 M Na4P2O7 (pyrophosphate extraction) or 0.1 M NaOH (basic extraction) [48] for 5–8 h with constant mixing at 30–50 °C. The sediment was separated from the fluid by filtration. For HA precipitation from the solution, the fluid was treated with HCl at pH 1.0–2.0, and the isolated HAs were separated by centrifugation, washed on a filter with water up to pH 7.0, and dried at room temperature. Yield of HAs from the peat samples was measured by the gravimetric method.

3.2. Physical Characterization of HAs

Infrared (IR) absorption spectra of the isolated HAs were recorded using an Fourier transform IR spectrometer (FSM 1201, Infraspek Ltd., St. Petersburg, Russia) in KBr tablets at a ratio of 1:100 and at 500–4000 cm−1. Electronic absorption spectra of the aqueous solutions of HAs (10 µg/mL) in quartz cuvettes (1 cm) were recorded on a Unico 2800 spectrophotometer (Dayton, NJ, USA) at 190–700 nm. The optical densities at 465 nm (E4) and 665 nm (E6) were determined from the spectra for calculation of the E4:E6 ratio. The elemental composition was determined by combustion on a Carlo Erba Strumentazione Model 1106 C, H, N analyzer (Milan, Italy), and the O2 content was determined as the difference. The concentration of semiquinone-type free radicals in solid-state samples was determined as the number of PMC by EPR spectroscopy [55] using an EMX EPR spectrometer (Bruker, Rheinstetten, Germany) at room temperature (~23 °C). While determining the absolute concentration of unpaired spins, CuCl2·5H2O served as a standard containing a known number of PMC.
Fluorescence measurements were performed using an LS50B luminescence spectrometer (Perkin Elmer, Norwalk, CT, USA). The samples were dissolved in NaHCO3 (25 mM, pH 8.5). The slit width for emission and excitation wavelengths was 10 nm. The HIX was determined using the formula: HIX = (ΣI435→480)/(ΣI300→345), where I is the fluorescence emission intensity with excitation at 254 nm [51]. Since fluorescence intensity can be attenuated by the solution itself (i.e., inner-filtering effect), both primary and secondary fluorescence inner-filtering effects were corrected for in order to obtain an accurate measurement of the fluorescence emission intensity. For calculation of HIX values corrected for inner-filter effects, linear extrapolation was performed on plots of HIX versus transmittance at 254 nm for 6–7 different concentrations of each fraction. The corrected HIX values correspond to infinite dilution (i.e., approximating 100% transmittance). Synchronous fluorescence spectra were recorded from 250 to 600 nm at a scan rate of 240 nm/min. The excitation–emission wavelength difference (Δλ) was 20 nm [48].

3.3. High Performance Size-Exclusion Chromatography (HP-SEC)

Average molecular weights of the HA fractions were determined by HP-SEC using Ultrahydrogel 250 column (300 × 7.8 mm, 6 µm, pore size 250 Å; Waters, Milford, MA, USA). The mobile phase was 0.1 M Tris-HCl, pH 8.9 (1 mL/min). We used an Ultimate 3000 chromatograph (Dionex, Sunnyvale, CA, USA) equipped with a vacuum degasser, LPG-3400SD pump, column thermostat TCC-3000SD, and a spectrophotometric detector DAD-3000 operating at 240 nm. The molecular weights of the fractions were estimated by comparison with the retention times of polystyrene sulfonate standards (PSS Polymer Standards Service GmbH, Mainz, Germany).

3.4. Chemical Analysis of HAs

In order to measure total acidity, the HA samples were treated with a Ba(OH)2 solution under N2 atmosphere for 24 h. The Ba(OH)2 remaining in the solution after the reaction was then back-titrated with a standard acid solution. For the titration of carboxylic acid groups, the HA samples were treated for 24 h with calcium acetate solution in excess, which causes the release of acetic acid. The CH3COOH released was then titrated with a standard base solution. Phenolic OH groups were calculated as the difference between total acidity and acidity of the carboxylic groups [65]

3.5. Free Radical Scavenging Activity

The antioxidant activity of the HA fractions was determined by measuring their capacity to bleach the purple-colored methanol solution of DPPH, which represents a suitable basis for comparative evaluation of the radical scavenging activity for most natural antioxidants [66,67]. In brief, a methanolic solution of DPPH (254 µmol/L) was mixed in a 1-cm cuvette with each HA sample (1 μg/mL) at room temperature. The decrease in absorbance at 520 nm was monitored for 60 min using a Unico 2800 spectrophotometer. For comparison, similar kinetic experiments were also performed for DPPH interacting with buffer alone (negative control). The radical scavenging activity is expressed as percent inhibition, and all determinations were performed in triplicate.

3.6. Electrochemical Experiments

Antioxidant activity of the HA samples was evaluated by measuring the electrochemical reduction current of O2 at a mercury film electrode after reaction of the compounds with O2·− [53,68]. A phosphate buffer solution (pH 6.9) served as the supporting electrolyte. HA fractions were placed in an electrochemical cell at a final concentration of 1 µg/mL and stirred. Voltammograms of the cathodic reduction of O2 were recorded with an AOA voltammetric analyzer (Tomsk, Russia) using linear sweep voltammetry under the following conditions: potential scan rate 30 mV/s and potential range E = 0 to −0.7 V. The electrochemical cell consisted of a working mercury film electrode, a silver/silver chloride reference electrode with saturated KCl. It should be noted that the HAs were not adsorbed to the surface of the working mercury film electrode in the range of the O2 reduction [53]. Test compounds reacted with ROS and changed the electrochemical reduction current of O2 (first wave at E = −0.3 V). The voltammograms were used to plot time dependences of the function [1–I/I0] in the presence of a test sample. The linear part of the plot and the slope ratio of the tangent to this portion of the curve were used to calculate the kinetic criterion of antioxidant activity, K (μmol/L × min−1), of a sample using the formula:
K = C O 2 t ( 1 I i I o )
where C O 2 is the initial O2 concentration in the solution (μmol/L), t is the duration of the interaction between the test substance and ROS (min), Ii is the change of the O2 reduction current density after addition of a test sample (μA), and Io is the limiting current of the O2 reduction in the absence of the substance being analyzed (μA). All determinations were performed in triplicate.

3.7. Statistical Analysis

Linear regression analysis was performed on the indicated sets of data to obtain correlation coefficients, 95% confidence intervals, and statistical significance (GraphPad Prism Software, San Diego, CA, USA). The data pertaining to physicochemical characteristics and content of carboxylic and phenol groups in different HA fractions were also analyzed using two-way analysis of variance (ANOVA). Both linear regression and ANOVA were considered statistically significant at p < 0.05.

Supplementary Materials

Supplementary Materials are avaliable online.

Acknowledgments

The research is carried out at Tomsk Polytechnic University within the framework of Tomsk Polytechnic University Competitiveness Enhancement Program (VIU-RSCABS-89/2018). This research was supported in part by National Institutes of Health IDeA Program COBRE Grant GM110732; USDA National Institute of Food and Agriculture Hatch project 1009546; the Montana State University Agricultural Experiment Station.

Author Contributions

M.V.Z., M.V.B., M.S.Y. and I.A.S. conceived and designed the experiments; M.V.Z., I.A.S., S.V.K. and L.A.L. performed the experiments and analyzed the data; S.V.K., L.A.L. and K.A.B. contributed reagents/materials/analysis tools; and M.V.Z., I.A.S., S.V.R. and M.T.Q. wrote the paper.

Conflicts of Interest

The authors declare no conflict of interest.

References

  1. Orlov, D.S. Humus Acids of Soils; Balkema: Rotterdam, The Netherlands, 1985; p. 378. [Google Scholar]
  2. Schepetkin, I.; Khlebnikov, A.; Kwon, B.S. Medical drugs from humus matter: Focus on mumie. Drug Dev. Res. 2002, 57, 140–159. [Google Scholar] [CrossRef]
  3. Van Rensburg, C.E.J. The antiinflammatory properties of humic substances: A mini review. Phytother. Res. 2015, 29, 791–795. [Google Scholar] [CrossRef] [PubMed]
  4. Krzeminski, T.F.; Nozynski, J.K.; Grzyb, J.; Porc, M.; Zeglen, S.; Filas, V.; Skopinska-Rozewska, E.; Sommer, E.; Filewska, M. Angiogenesis and cardioprotection after TNF α-inducer-Tolpa peat preparation treatment in rat’s hearts after experimental myocardial infarction in vivo. Vascul. Pharmacol. 2005, 43, 164–170. [Google Scholar] [CrossRef] [PubMed]
  5. Radomska-Lesniewska, D.M.; Skopinska-Rozewska, E.; Jozwiak, J.; Demkow, U.; Balan, B.J. Angiomodulatory properties of some antibiotics and Tolpa peat preparation. Cent. Eur. J. Immunol. 2016, 41, 19–24. [Google Scholar] [CrossRef] [PubMed]
  6. Brzozowski, T.; Dembinski, A.; Konturek, S. Influence of Tolpa peat preparation on gastroprotection and on gastric and duodenal ulcers. Acta Pol. Pharm. 1994, 51, 103–107. [Google Scholar] [PubMed]
  7. Schepetkin, I.A.; Khlebnikov, A.I.; Ah, S.Y.; Woo, S.B.; Jeong, C.S.; Klubachuk, O.N.; Kwon, B.S. Characterization and biological activities of humic substances from mumie. J. Agric. Food Chem. 2003, 51, 5245–5254. [Google Scholar] [CrossRef] [PubMed]
  8. Schepetkin, I.A.; Xie, G.; Jutila, M.A.; Quinn, M.T. Complement-fixing activity of fulvic acid from shilajit and other natural sources. Phytother. Res. 2009, 23, 373–384. [Google Scholar] [CrossRef] [PubMed]
  9. Joone, G.K.; Dekker, J.; Elizabeth, C.; van Rensburg, J. Investigation of the immunostimulatory properties of oxihumate. Z. Naturforsch. (C) 2003, 58, 263–267. [Google Scholar] [CrossRef]
  10. Trofimova, E.S.; Zykova, M.V.; Ligacheva, A.A.; Sherstoboev, E.Y.; Zhdanov, V.V.; Belousov, M.V.; Yusubov, M.S.; Krivoshchekov, S.V.; Danilets, M.G.; Dygai, A.M. Effects of humic acids isolated from peat of various origin on in vitro production of nitric oxide: A screening study. Bull. Exp. Biol. Med. 2016, 161, 687–692. [Google Scholar] [CrossRef] [PubMed]
  11. Trofimova, E.S.; Zykova, M.V.; Ligacheva, A.A.; Sherstoboev, E.Y.; Zhdanov, V.V.; Belousov, M.V.; Yusubov, M.S.; Krivoshchekov, S.V.; Danilets, M.G.; Dygai, A.M. Influence of humic acids extracted from peat by different methods on functional activity of macrophages in vitro. Bull. Exp. Biol. Med. 2017, 162, 741–745. [Google Scholar] [CrossRef] [PubMed]
  12. Belousov, M.V.; Akhmedzhanov, R.R.; Zykova, M.V.; Arbuzov, A.N.; Gur’ev, A.M.; Yusubov, M.S. Antihypoxic activity of native humic acids of Tomsk lowland peat. Pharm. Chem. J. 2014, 48, 97–99. [Google Scholar] [CrossRef]
  13. Belousov, M.V.; Akhmedzhanov, R.R.; Zykova, M.V.; Gur’ev, A.M.; Yusubov, M.S. Hepatoprotective properties of native humic acids isolated from lowland peat of Tomsk region. Pharm. Chem. J. 2014, 48, 249–252. [Google Scholar] [CrossRef]
  14. Belousov, M.V.; Akhmedzhanov, R.R.; Zykova, M.V.; Vasil’ev, K.Y.; Yusubov, M.S. Effect of native humic acids from Tomsk region lowland peat on mitochrondrial oxidative phosphorylation under hypoxic conditions. Pharm. Chem. J. 2015, 49, 250–253. [Google Scholar] [CrossRef]
  15. Zykova, M.V.; Belousov, M.V.; Lasukova, T.V.; Gorbunov, A.S.; Logvinova, L.A.; Dygai, A.M. Cardiovascular effects of high-molecular-weight compounds of humic nature. Bull. Exp. Biol. Med. 2017, 163, 206–209. [Google Scholar] [CrossRef] [PubMed]
  16. Pukhova, G.G.; Druzhina, N.A.; Stepchenko, L.M.; Chebotarev, E.E. Effect of sodium humate on animals irradiated with lethal doses. Radiobiologiia 1987, 27, 650–653. [Google Scholar] [PubMed]
  17. Lu, F.J.; Lee, Y.S. Humic-acid: inhibitor of plasmin. Sci. Total Environ. 1992, 114, 135–139. [Google Scholar] [CrossRef]
  18. Hseu, Y.C.; Wang, S.Y.; Chen, H.Y.; Lu, F.J.; Gau, R.J.; Chang, W.C.; Liu, T.Z.; Yang, H.L. Humic acid induces the generation of nitric oxide in human umbilical vein endothelial cells: Stimulation of nitric oxide synthase during cell injury. Free Radic. Biol. Med. 2002, 32, 619–629. [Google Scholar] [CrossRef]
  19. Hosseinimehr, S.J. Foundation review: Trends in the development of radioprotective agents. Drug Discov. Today 2007, 12, 794–805. [Google Scholar] [CrossRef] [PubMed]
  20. Brezani, V.; Smejkal, K.; Hosek, J.; Tomasova, V. Anti-inflammatory natural prenylated phenolic compounds—Potential lead substances. Curr. Med. Chem. 2017, 24, 1–66. [Google Scholar] [CrossRef] [PubMed]
  21. Altemimi, A.; Lakhssassi, N.; Baharlouei, A.; Watson, D.G.; Lightfoot, D.A. Phytochemicals: Extraction, isolation, and identification of bioactive compounds from plant extracts. Plants 2017, 6, 42. [Google Scholar] [CrossRef] [PubMed]
  22. Ozkan, A.; Sen, H.M.; Sehitoglu, I.; Alacam, H.; Guven, M.; Aras, A.B.; Akman, T.; Silan, C.; Cosar, M.; Karaman, H.I.O. Neuroprotective effect of humic acid on focal cerebral ischemia injury: An experimental study in rats. Inflammation 2015, 38, 32–39. [Google Scholar] [CrossRef] [PubMed]
  23. Akbas, A.; Silan, C.; Gulpinar, M.T.; Sancak, E.B.; Ozkanli, S.S.; Cakir, D.U. Renoprotective effect of humic acid on renal ischemia-reperfusion injury: An experimental study in rats. Inflammation 2015, 38, 2042–2048. [Google Scholar] [CrossRef] [PubMed]
  24. Cagin, Y.F.; Sahin, N.; Polat, A.; Erdogan, M.A.; Atayan, Y.; Eyol, E.; Bilgic, Y.; Seckin, Y.; Colak, C. The acute effect of humic acid on iron accumulation in rats. Biol. Trace Elem. Res. 2016, 171, 145–155. [Google Scholar] [CrossRef] [PubMed]
  25. Wang, C.X.; Wang, Z.J.; Peng, A.; Hou, J.W.; Xin, W.J. Interaction between fulvic acids of different origins and active oxygen radicals. Sci. China Ser. C 1996, 39, 267–275. [Google Scholar]
  26. Avvakumova, N.P.; Gerchikov, A.Y.; Khairullina, V.R.; Zhdanova, A.V. Antioxidant properties of humic substances isolated from peloids. Pharm. Chem. J. 2011, 45, 192–193. [Google Scholar] [CrossRef]
  27. Aeschbacher, M.; Graf, C.; Schwarzenbach, R.P.; Sander, M. Antioxidant properties of humic substances. Environ. Sci. Technol. 2012, 46, 4916–4925. [Google Scholar] [CrossRef] [PubMed]
  28. Shang, E.X.; Li, Y.; Niu, J.F.; Zhou, Y.J.; Wang, T.Y.; Crittenden, J.C. Relative importance of humic and fulvic acid on ROS generation, dissolution, and toxicity of sulfide nanoparticles. Water Res. 2017, 124, 595–604. [Google Scholar] [CrossRef] [PubMed]
  29. Adekunle, I.M.; Ajuwon, O.R. Influence of humic acid derived from composted wastes of Nigeria origin on oxidative and antioxidant status of African mud catfish (Clarias gariepinus). Pakistan J. Biol. Sci. 2010, 13, 821–827. [Google Scholar] [CrossRef]
  30. Martini, S.; D’Addario, C.; Bonechi, C.; Leone, G.; Tognazzi, A.; Consumi, M.; Magnani, A.; Rossi, C. Increasing photostability and water-solubility of carotenoids: Synthesis and characterization of beta-carotene-humic acid complexes. J. Photochem. Photobiol. B 2010, 101, 355–361. [Google Scholar] [CrossRef] [PubMed]
  31. Mirza, M.A.; Ahmad, N.; Agarwal, S.P.; Mahmood, D.; Khalid Anwer, M.; Iqbal, Z. Comparative evaluation of humic substances in oral drug delivery. Results Pharma Sci. 2011, 1, 16–26. [Google Scholar] [CrossRef] [PubMed]
  32. Karadirek, S.; Kanmaz, N.; Balta, Z.; Demircivi, P.; Uzer, A.; Hizal, J.; Apak, R. Determination of total antioxidant capacity of humic acids using CUPRAC, Folin-Ciocalteu, noble metal nanoparticle- and solid-liquid extraction-based methods. Talanta 2016, 153, 120–129. [Google Scholar] [CrossRef] [PubMed]
  33. Smirnova, O.V.; Efimova, I.V.; Khil’ko, S.L. Antioxidant and pro-oxidant activity of ascorbic and humic acids in radical-chain oxidation processes. Russ. J. Appl. Chem. 2012, 85, 252–255. [Google Scholar] [CrossRef]
  34. Efimova, I.V.; Khil’ko, S.L.; Smirnova, O.V. Antioxidant activity of humic acids in radical-chain oxidation processes. Russ. J. Appl. Chem. 2012, 85, 1351–1354. [Google Scholar]
  35. Zykova, M.V.; Belousov, M.V.; Gur’ev, A.M.; Akhmedzhanov, R.R.; Yusubov, M.S. Standardization of humic acids of lowland wood-grass peat from tomsk region. Pharm. Chem. J. 2014, 47, 675–678. [Google Scholar] [CrossRef]
  36. Vetvicka, V.; Vashishta, A.; Fuentes, M.; Baigorri, R.; Garcia-Mina, J.M.; Yvin, J.-C. The relative abundance of oxygen alkyl-related groups in aliphatic domains is involved in the main pharmacological-pleiotropic effects of humic acids. J. Med. Food 2013, 16, 625–632. [Google Scholar] [PubMed]
  37. Esteves, V.I.; Duarte, A.C. Differences between humic substances from riverine, estuarine, and marine environments observed by fluorescence spectroscopy. Acta Hydrochim. Hydrobiol. 2001, 28, 359–363. [Google Scholar] [CrossRef]
  38. Yudina, N.V.; Pisareva, S.I.; Saratikov, A.S. Antiulcerogenic activity of phenol compounds of peat. Chem. Plant. Mater. 1998, 289, G1024–G1029. [Google Scholar]
  39. Gostishcheva, M.V.; Belousov, M.V.; Yusubov, M.S.; Ismatova, R.R.; Dmitruk, S.E. Comparative IR spectral characteristics of humic acids from peats of different origin in the Tomsk area. Pharm. Chem. J. 2009, 43, 418–421. [Google Scholar] [CrossRef]
  40. Perminova, I.V.; Frimmel, F.H.; Kudryavtsev, A.V.; Kulikova, N.A.; Abbt-Braun, G.; Hesse, S.; Petrosyan, V.S. Molecular weight characteristics of humic substances from different environments as determined by size exclusion chromatography and their statistical evaluation. Environ. Sci. Technol. 2003, 37, 2477–2485. [Google Scholar] [CrossRef] [PubMed]
  41. Boguta, P.; Sokolowska, Z. Interactions of Zn(II) ions with humic acids isolated from various type of soils. Effect of pH, Zn concentrations and humic acids chemical properties. PLoS ONE 2016, 11, e0153626. [Google Scholar] [CrossRef] [PubMed]
  42. Vialykh, E.A.; Ilarionov, S.A.; Abdelrahman, H.M.; Vialykh, I.A. Changes in amino acids content of humic acids sequentially extracted from peat and sod-podzolic soil. Can. J. Soil Sci. 2014, 94, 575–583. [Google Scholar] [CrossRef]
  43. Zaccone, C.; Miano, T.M.; Shotyk, W. Qualitative comparison between raw peat and related humic acids in an ombrotrophic bog profile. Org. Geochem. 2007, 38, 151–160. [Google Scholar] [CrossRef]
  44. Majid, A.; Ripmeester, J.A. Isolation and characterization of humic acids from Alberta oil sands and related materials. Fuel 1990, 69, 1527–1536. [Google Scholar] [CrossRef]
  45. Koch, B.P.; Dittmar, T. From mass to structure: An aromaticity index for high-resolution mass data of natural organic matter. Rapid Commun. Mass Spectrom. 2006, 20, 926–932. [Google Scholar] [CrossRef] [Green Version]
  46. Li, L.; Huang, W.L.; Peng, P.; Sheng, G.Y.; Fu, J.M. Chemical and molecular heterogeneity of humic acids repetitively extracted from a peat. Soil Sci. Soc. Am. J. 2003, 67, 740–746. [Google Scholar] [CrossRef]
  47. Hartman, B.E.; Chen, H.M.; Hatcher, P.G. A non-thermogenic source of black carbon in peat and coal. Int. J. Coal Geol. 2015, 144, 15–22. [Google Scholar] [CrossRef]
  48. Chen, J.; Gu, B.H.; LeBoeuf, E.J.; Pan, H.J.; Dai, S. Spectroscopic characterization of the structural and functional properties of natural organic matter fractions. Chemosphere 2002, 48, 59–68. [Google Scholar] [CrossRef]
  49. Miano, T.M.; Senesi, N. Synchronous excitation fluorescence spectroscopy applied to soil humic substances chemistry. Sci. Total Environ. 1992, 118, 41–51. [Google Scholar] [CrossRef]
  50. Zsolnay, A.; Baigar, E.; Jimenez, M.; Steinweg, B.; Saccomandi, F. Differentiating with fluorescence spectroscopy the sources of dissolved organic matter in soils subjected to drying. Chemosphere 1999, 38, 45–50. [Google Scholar] [CrossRef]
  51. Ohno, T. Fluorescence inner-filtering correction for determining the humification index of dissolved organic matter. Environ. Sci. Technol. 2002, 36, 742–746. [Google Scholar] [CrossRef] [PubMed]
  52. Ibrahim, M.; Nada, A.; Kamal, D.E. Density functional theory and FTIR spectroscopic study of carboxyl group. Indian J. Pure Appl. Phys. 2005, 43, 911–917. [Google Scholar]
  53. Korotkova, E.I.; Karbainov, Y.A.; Avramchik, O.A. Investigation of antioxidant and catalytic properties of some biologically active substances by voltammetry. Anal. Bioanal. Chem. 2003, 375, 465–468. [Google Scholar] [CrossRef] [PubMed]
  54. Mal’tseva, E.V.; Yudina, N.V.; Lomovskii, O.I. Electrochemical reduction of oxygen in the presence of humic acids. Russ. J. Phys. Chem. 2011, 85, 1257–1260. [Google Scholar] [CrossRef]
  55. Riffaldi, R.; Schnitzer, M. Electron-spin resonance spectrometry of humic substances. Soil Sci. Soc. Am. Proc. 1972, 36, 301–305. [Google Scholar] [CrossRef]
  56. Witwicki, M.; Jaszewski, A.R.; Jezierska, J.; Jerzykiewicz, M.; Jezierski, A. The pH-induced shift in the g-tensor components of semiquinone-type radicals in humic acids-DFT and EPR studies. Chem. Phys. Lett. 2008, 462, 300–306. [Google Scholar] [CrossRef]
  57. Pereira, D.M.; Valentao, P.; Pereira, J.A.; Andradeet, P.B. Phenolics: From chemistry to biology. Molecules 2009, 14, 2202–2211. [Google Scholar] [CrossRef]
  58. Khlebnikov, A.I.; Schepetkin, I.A.; Domina, N.G.; Kirpotina, L.N.; Quinn, M.T. Improved quantitative structure-activity relationship models to predict antioxidant activity of flavonoids in chemical, enzymatic, and cellular systems. Bioorg. Med. Chem. 2007, 15, 1749–1770. [Google Scholar] [CrossRef] [PubMed]
  59. Nurmi, J.T.; Tratnyek, P.G. Electrochemical properties of natural organic matter (NOM), fractions of nom, and model biogeochemical electron shuttles. Environ. Sci. Technol. 2002, 36, 617–624. [Google Scholar] [CrossRef] [PubMed]
  60. Schnitzer, M.; Levesque, M. Electron-spin resonance as a guide to the degree of humification of peats. Soil Sci. 1979, 127, 140–145. [Google Scholar] [CrossRef]
  61. Rosa, A.H.; Simoes, M.L.; de Oliveira, L.C.; Rocha, J.C.; Neto, L.M.; Milori, D.M.B.P. Multimethod study of the degree of humification of humic substances extracted from different tropical soil profiles in Brazil’s Amazonian region. Geoderma 2005, 127, 1–10. [Google Scholar] [CrossRef]
  62. Segnini, A.; Posadas, A.; Quiroz, R.; Milori, D.M.B.P.; Saab, S.C.; Neto, L.M.; Vaz, C.M.P. Spectroscopic assessment of soil organic matter in wetlands from the high Andes. Soil Sci. Soc. Am. J. 2010, 74, 2246–2253. [Google Scholar] [CrossRef]
  63. Ravichandiran, P.; Santhoshkumar, P.; Vasanthkumar, S. Synthesis of chemical and electrochemical ‘off-on-off’ fluorescent switches of new 5H-benzo[b]carbazole-6,11-dione derivatives. J. Saudi Chem. Soc. 2017, 21, 35–41. [Google Scholar] [CrossRef]
  64. Veretennikova, E.E. Lead in the natural peat cores of ridge-hollow complex in the taiga zone of West Siberia. Ecol. Eng. 2015, 80, 100–107. [Google Scholar] [CrossRef]
  65. Sierra, M.M.D.; Arend, K.; Fernandes, A.N.; Giovanela, M.; Szpoganicz, B. Application of potentiometry to characterize acid and basic sites in humic substances - testing the BEST7 program with a weak-acid mixture. Anal. Chim. Acta 2001, 445, 89–98. [Google Scholar] [CrossRef]
  66. Brandwilliams, W.; Cuvelier, M.E.; Berset, C. Use of a free-radical method to evaluate antioxidant activity. Food Sci. Technol. 1995, 28, 25–30. [Google Scholar]
  67. Sahgal, G.; Ramanathan, S.; Sasidharan, S.; Mordi, M.N.; Ismail, S.; Mansor, S.M. In vitro antioxidant and xanthine oxidase inhibitory activities of methanolic Swietenia mahagoni seed extracts. Molecules 2009, 14, 4476–4485. [Google Scholar] [CrossRef] [PubMed]
  68. Avramchik, O.A.; Korotkova, E.I.; Plotnikov, E.; Lukina, A.; Karbainov, Y.A. Antioxidant and electrochemical properties of calcium and lithium ascorbates. J. Pharm. Biomed. Anal. 2005, 37, 1149–1154. [Google Scholar] [CrossRef] [PubMed]
Sample Availability: Samples of peat and humic acids are available from the authors.
Figure 1. Relative concentrations of functional groups in HA fractions estimated as a ratio of intensity of the absorption bands in the IR region. A1610, A2920, and A3400 are optical densities for aromatic (C=C), aliphatic, and OH groups, respectively. (Panels A,B) show differences in the ratios of the absorption bands between HAb and HAp fractions. (Panel C) shows a plot of A1610/A2920 versus E4:E6 for all 18 HA fractions. Dashed lines indicate area of the 95% confidence band.
Molecules 23 00753 g001
Figure 2. The van Krevelen diagram of H/C versus O/C for the HA fractions. HAs isolated by basic extraction are shown as open circles; HAs isolated by pyrophosphate extraction are shown as solid circles.
Molecules 23 00753 g002
Figure 3. Synchronous fluorescence spectra of selected HA fractions. Solutions of HAb-8 and HAp-8 (Panel A) and solutions of HAb-7 and HAp-7 (Panel B) (10 μg/mL in 25 mM NaHCO3) were analyzed with a scanning fluorometer, and the synchronous spectra (Δλ = 20 nm) are shown.
Molecules 23 00753 g003
Figure 4. A plot of content of aromatic OH groups (Panel A) and COOH groups (Panel B) in the HA fractions versus ratio of intensity of the absorption bands in the IR region specific for OH groups (A3400/A1610) (Panel A) and COOH groups (A1720/A2920) (Panel B). Dashed lines indicate area of the 95% confidence band. Note that the symbols for HAb-4, HAb-6, HAp-6, HAb-8, and HAp-8 overlap in (Panel A), and the symbols for HAb-1 and HAb-3 overlap in (Panel B).
Molecules 23 00753 g004
Figure 5. Polynomial extrapolation of antiradical activity in the DPPH assay versus antioxidant activity in the electrochemical assay for all 18 HA fractions.
Molecules 23 00753 g005
Figure 6. Plot of aromatic OH group content (Panel A) and number of paramagnetic centers (PMC) (Panel B) in the HA fractions versus antioxidant activity of the fractions in the electrochemical assay for all 18 HA fractions. Dashed lines indicate area of the 95% confidence band.
Molecules 23 00753 g006
Figure 7. Plot of the number of paramagnetic centers (PMC) versus relative content of aromatic OH groups (by IR spectra) (Panel A) and HIX values (Panel B) for all 18 HA fractions. Dashed lines indicate area of the 95% confidence band.
Molecules 23 00753 g007
Table 1. Characterization of the peat samples, yields of HA fractions isolated by basic and pyrophosphate extraction from the peat samples, and selected physicochemical properties.
Peat Type, Sample Name, Sampling Depth (cm), and Degree of Decay (%)FractionYield (%)E4:E6HIXMr (kDa)
Raised bog sphagnum
Peat 1, 20–70 cm, 5–10%
HAb-16.5 ± 0.12.85 ± 0.050.9934.6
HAp-13.1 ± 0.1 a1.50 ± 0.02 b0.8339.7
Raised bog pine-cotton-grass,
Peat 2, 10–50 cm, 30–35%
HAb-231.4 ± 0.22.91 ± 0.020.6919.0
HAp-213.2 ± 0.1 a2.04 ± 0.02 b0.6622.8
Raised bog magellanicum,
Peat 3, 20–70 cm, 10–15%
HAb-316.9 ± 0.13.17 ± 0.010.7527.8
HAp-34.2 ± 0.1 a2.15 ± 0.01 b0.7618.8
Raised bog fuscum,
Peat 4, 20–70 cm, 5–10%
HAb-413.3 ± 0.12.91 ± 0.020.7331.4
HAp-43.9 ± 0.1 a1.53 ± 0.02 b0.4925.8
Low-mire woody,
Peat 5, 10–50 cm, 25–30%
HAb-538.2 ± 0.42.91 ± 0.030.8124.4
HAp-526.0 ± 0.3 a1.68 ± 0.04 b0.8021.2
Low-mire grass-moss,
Peat 6, 200–250 cm, 35–50%
HAb-621.5 ± 0.23.41 ± 0.020.9822.1
HAp-66.8 ± 0.1 a1.34 ± 0.01 b0.8520.9
Low-mire grass,
Peat 7, 230–270 cm, 40–45%
HAb-737.3 ± 0.43.25 ± 0.061.2120.8
HAp-717.4 ± 0.6 a1.48 ± 0.01 b1.1416.7
Low-mire woody peat,
Peat 8, 50–100 cm, 30–35%
HAb-838.6 ± 0.13.18 ± 0.071.0117.6
HAp-817.9 ± 0.1 a1.68 ± 0.01 b1.0717.2
Mesotrophic carex peat,
Peat 9, 150–200 cm, 40–45%
HAb-927.3 ± 0.13.13 ± 0.050.7820.0
HAp-98.0 ± 0.1 a1.38 ± 0.01 b0.8817.5
Significant differences (a, p < 0.001; b, p < 0.05) between fractions isolated by basic (HAb) and pyrophosphate (HAp) extraction from the same peat samples are indicated.
Table 2. Elemental composition of the HA fractions expressed as weight percent.
FractionСНNО
HAb-153.3 ± 0.616.0 ± 0.063.9 ± 0.0428.6 ± 0.39
HAp-142.5 ± 0.61 a4.6 ± 0.05 a3.9 ± 0.0428.5 ± 0.38
HAb-252.2 ± 0.645.6 ± 0.052.8 ± 0.0331.5 ± 0.36
HAp-252.2 ± 0.654.8 ± 0.05 a2.2 ± 0.03 a31.6 ± 0.39
HAb-354.2 ± 0.686.0 ± 0.063.9 ± 0.0530.9 ± 0.45
HAp-351.5 ± 0.64 a4.8 ± 0.05 a3.4 ± 0.04 a30.1 ± 0.40
HAb-453.9 ± 0.696.0 ± 0.053.5 ± 0.0430.0 ± 0.45
HAp-449.3 ± 0.62 a4.7 ± 0.05 a3.2 ± 0.0433.6 ± 0.44 a
HAb-551.8 ± 0.745.4 ± 0.053.5 ± 0.0331.5 ± 0.38
HAp-552.5 ± 0.654.6 ± 0.05 a3.1 ± 0.04 a27.8 ± 0.36 a
HAb-652.3 ± 0.655.1 ± 0.053.4 ± 0.0532.8 ± 0.38
HAp-646.4 ± 0.61 a4.2 ± 0.04 a3.2 ± 0.0329.3 ± 0.38 a
HAb-749.2 ± 0.624.8 ± 0.053.6 ± 0.0429.0 ± 0.46
HAp-749.5 ± 0.624.1 ± 0,04 a3.3 ± 0.0328.5 ± 0.35
HAb-851.7 ± 0.575.4 ± 0.053.8 ± 0.0332.1 ± 0.39
HAp-852.1 ± 0.654.5 ± 0.04 a3.1 ± 0.03 a31.0 ± 0.42
HAb-952.7 ± 0.565.3 ± 0.063.0 ± 0.0332.0 ± 0.38
HAp-951.9 ± 0.634.7 ± 0,05 a3.1 ± 0,0330.6 ± 0.43
All elemental contents are expressed on an ash-free basis. a Significant differences (p < 0.05) between fractions isolated by basic (HAb) and pyrophosphate (HAp) extraction from the same peat samples are indicated.
Table 3. Acidic functional groups of the HA fractions determined by chemical titration.
FractionAcid Groups (mmol/g)
СООНОНphenolicTotal Acidity
HAb-12.5 ± 0.012.7 ± 0.035.2 ± 0.06
HAp-12.4 ± 0.013.4 ± 0.02 a5.7 ± 0.03 a
HAb-22.8 ± 0.012.9 ± 0.015.8 ± 0.02
HAp-22.7 ± 0.014.1 ± 0.02 a6.8 ± 0.04 a
HAb-32.4 ± 0.012.2 ± 0.035.7 ± 0.06
HAp-32.8 ± 0.01 a3.3 ± 0.02 a6.1 ± 0.03 a
HAb-42.6 ± 0.013.5 ± 0.036.1 ± 0.06
HAp-42.5 ± 0.013.6 ± 0.026.1 ± 0.03
HAb-52.8 ± 0.013.1 ± 0.025.9 ± 0.03
HAp-52.8 ± 0.013.2 ± 0.036.0 ± 0.05
HAb-62.8 ± 0.013.1 ± 0.015.9 ± 0.01
HAp-62.6 ± 0.01 a3.5 ± 0.02 a6.2 ± 0.03 a
HAb-72.6 ± 0.014.1 ± 0.036.7 ± 0.06
HAp-72.7 ± 0.014.8 ± 0.03 a7.5 ± 0.06 a
HAb-82.6 ± 0.013.1 ± 0.025.7 ± 0.03
HAp-83.0 ± 0,01 a3.5 ± 0.02 a6.5 ± 0.04 a
HAb-92.6 ± 0,013.1 ± 0.015.7 ± 0.01
HAp-93.1 ± 0.01 a3.1 ± 0.016.2 ± 0.02 a
a Significant differences (p < 0.05) between fractions isolated by basic (HAb) and pyrophosphate (HAp) extraction from the same peat samples are indicated.
Table 4. Analysis of antioxidant activities of the HA fractions using voltammetry and DPPH assays and determination of the number of paramagnetic centers (PMC) in each fraction.
FractionVoltammetry (µmol/L × min−1)DPPH (% Inhibition)PMC (spin/g × 10−16)
HAb-10.24 ± 0.0589.5 ± 0.025.47
HAp-10.23 ± 0.0387.8 ± 0.14 a5.05
HAb-20.37 ± 0.0591.1 ± 0.206.60
HAp-20.58 ± 0.06 a92.2 ± 0.127.06
HAb-30.56 ± 0.0391.6 ± 0.227.57
HAp-30.35 ± 0.04 a91.1 ± 0.205.55
HAb-40.61 ± 0.0592.8 ± 0.267.8
HAp-40.79 ± 0.06 a93.6 ± 0.158.69
HAb-50.40 ± 0.0591.0 ± 0.205.91
HAp-50.53 ± 0.02 a92.0 ± 0.236.78
HAb-60.58 ± 0.0693.1 ± 0.277.93
HAp-60.69 ± 0.07 a94.6 ± 0.1814.4
HAb-70.70 ± 0.0294.6 ± 0.259.6
HAp-70.91 ± 0.05 a94.8 ± 0.1816.3
HAb-80.30 ± 0.0284.3 ± 0.015.42
HAp-80.31 ± 0.0479.6 ± 0.12 a5.74
HAb-90.22 ± 0.0279.2 ± 0.114.49
HAp-90.41 ± 0.05 a92.1 ± 0.14 a6.9
a Significant differences (p < 0.05) between fractions isolated by basic (HAb) and pyrophosphate (HAp) extractions from same peat samples are indicated.

