Article

Antioxidant and Anti-Osteoporosis Activities of Chemical Constituents of the Stems of Zanthoxylum piperitum

1
College of Pharmacy, Chungnam National University, Daejeon 34134, Korea
2
Department of Food and Nutrition, Hannam University, Daejeon 34054, Korea
3
Institute of Marine Biochemistry (IMBC), Vietnam Academy of Science and Technology (VAST), Hanoi 10000, Vietnam
*
Author to whom correspondence should be addressed.
Molecules 2018, 23(2), 457; https://doi.org/10.3390/molecules23020457
Submission received: 30 January 2018 / Revised: 12 February 2018 / Accepted: 15 February 2018 / Published: 18 February 2018
(This article belongs to the Section Natural Products Chemistry)

Abstract

:
Two new lignans, zanthoxyloside C (1) and zanthoxyloside D (2), together with nine known compounds comprising lignans (35), flavonoids (68), and phenolics (911), were isolated from the methanol extract of the stems of Zanthoxylum piperitum. All isolates were evaluated for their antioxidant and anti-osteoporotic activities using oxygen radical absorbance capacity (ORAC), cupric reducing antioxidant capacity (CUPRAC), and tartrate-resistant acid phosphatase (TRAP) assays. Compounds 710 showed peroxyl radical-scavenging capacities and 4, 67, and 9 showed reducing capacities. Moreover, compounds 3, 69, and 11 significantly suppressed TRAP activities. These results indicated that the stems of Z. piperitum could be an excellent source for natural antioxidant and anti-osteoporosis.

Graphical Abstract

1. Introduction

Osteoporosis, one of the metabolic diseases of the bones, occurs when the balance between bone resorption and bone formation is lost. To maintain bone mass and skeletal homeostasis, the dynamic process of resorption and formation continues in the bone tissues. Two types of bone cells, osteoclasts and osteoblasts perform specific functions in bone remodeling. Osteoclasts absorb bone, while osteoblasts synthesize and fill bone matrix; bone mass depends on the reciprocal function of these cells. A typical adult always maintains a balance between the amount of bone resorption and bone formation. However, once osteoporosis develops, due to aging, hormone abnormality, or lack of exercise, one’s quality of life degrades as a result of severe pain and limited mobility [1,2,3,4,5].
Recently, there has been a growing interest in the relationship between osteoporosis and oxidative stress. Clinical studies have shown that there is a significant correlation between increased oxidative stress and decreased bone mineral density. The antioxidant levels in the blood of osteoporotic women turned out to be low, but their bone mineral density increased by taking antioxidant vitamins. It has been revealed in in vitro studies, as well, that reactive oxygen species (ROS) increase the activity of osteoclasts and depress the metabolism of osteoblasts. The inhibition of the metabolism of osteoblasts owing to oxidative stress can be mitigated by the medication of antioxidants [6,7,8]. Therefore, if natural products without side effects on the human body were able to indirectly increase the intravital antioxidant defense system and directly eliminate excessive ROS, natural antioxidants could be applied as a functional material to prevent diseases caused by oxidative stress.
Zanthoxylum piperitum DC, widely distributed in South-East Asia, is an aromatic shrub belonging to the Rutaceae family. The fruits of Z. piperitum have been used as traditional herbal medicine as well as as a condiment. Most previous studies of Z. piperitum have focused on the fruits and leaves [9,10,11,12]. Therefore, there is a lack of information on chemical constituents of Z. piperitum stems and their biological activities. As a part of our ongoing research into the bioactivity of natural products, eleven secondary metabolites were isolated from stems of Z. piperitum. Moreover, antioxidant and anti-osteoporosis activities of these compounds were evaluated.

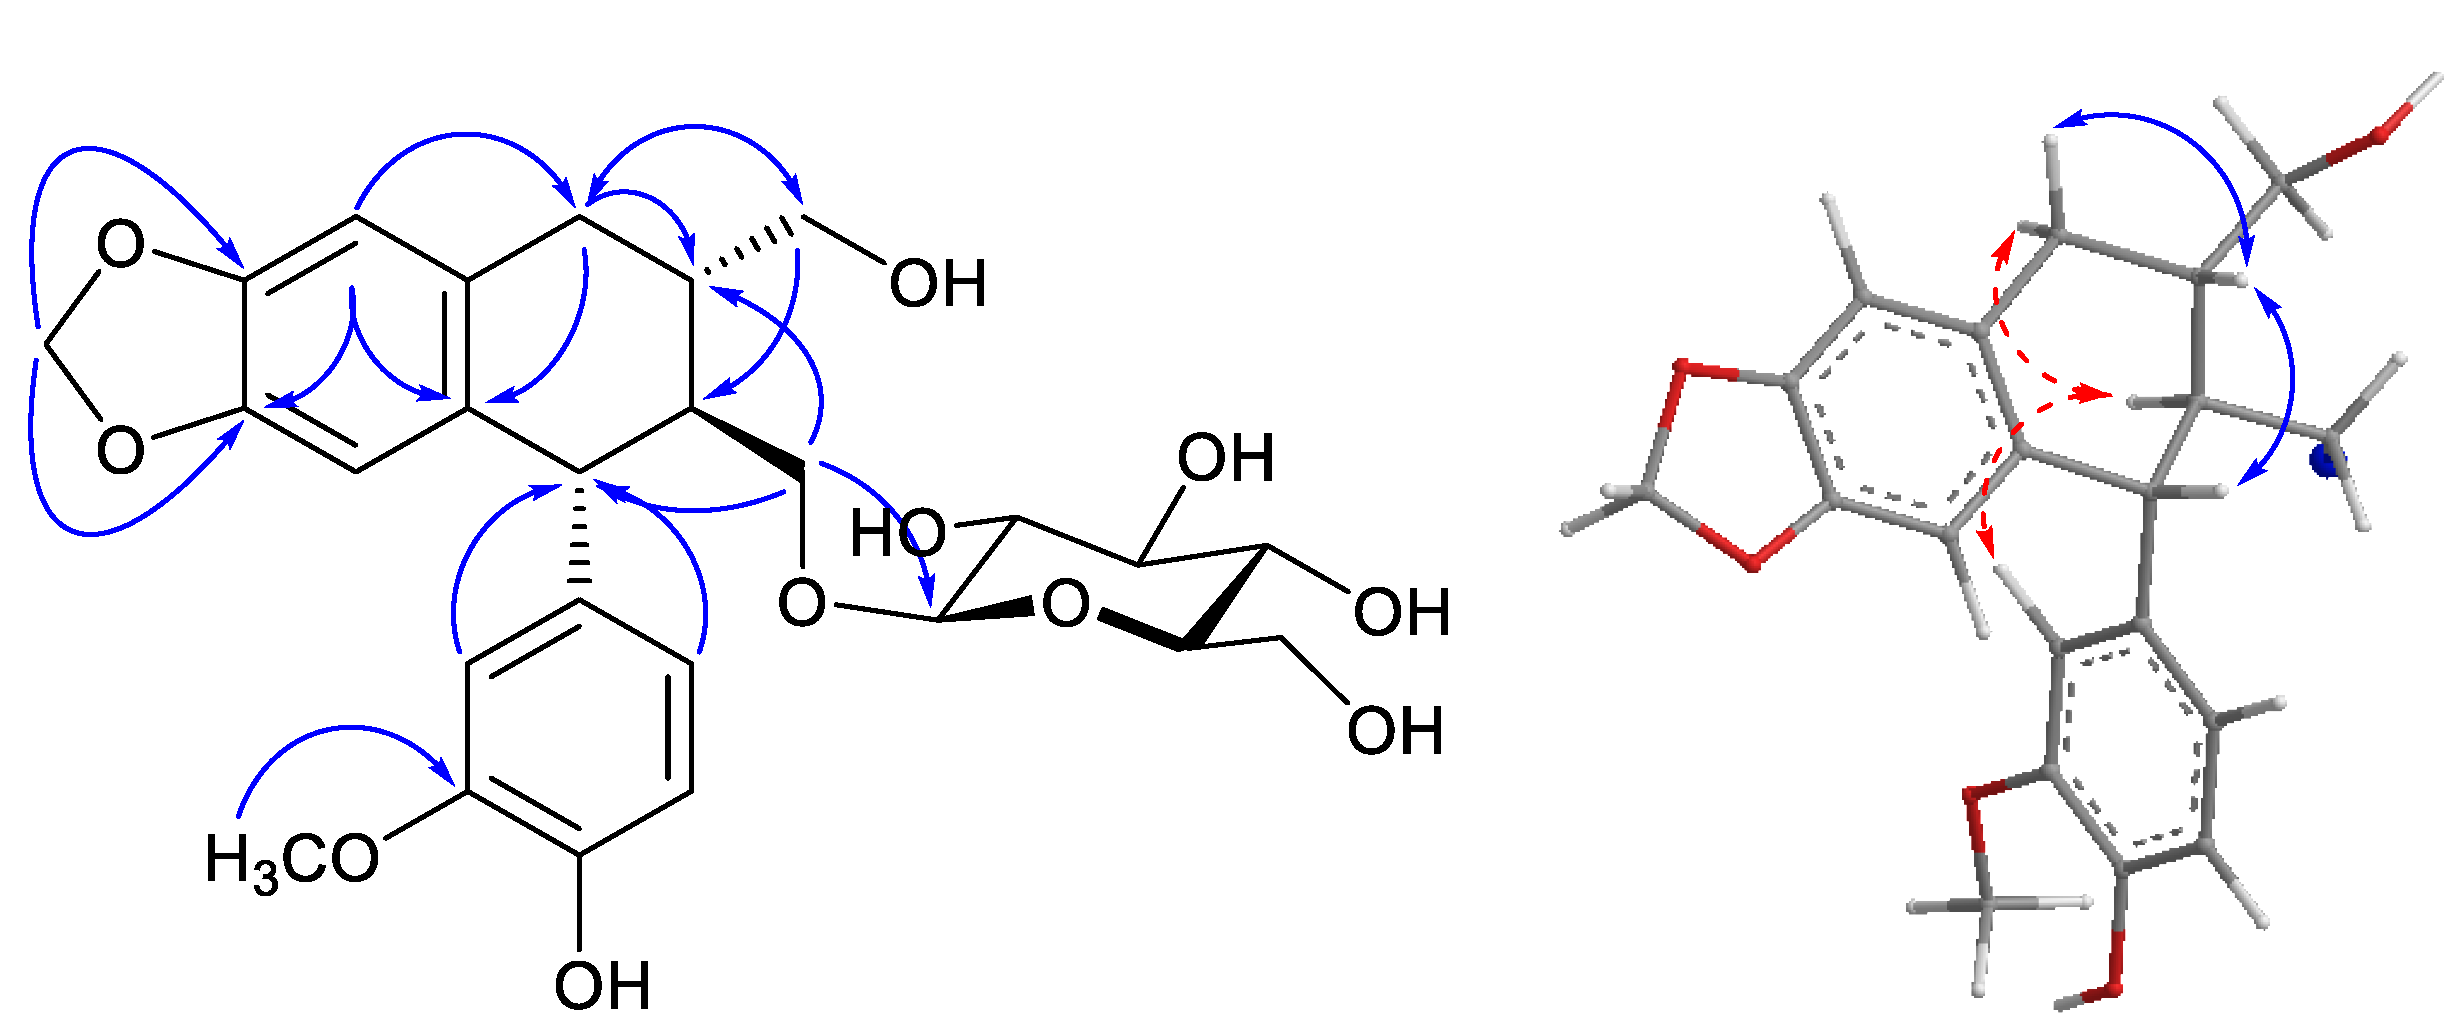
2. Results and Discussion

The phytochemical investigation of Z. piperitum stems resulted in the isolation of eleven compounds, including two new lignans, zanthoxyloside C (1) and zanthoxyloside D (2). The nine known compounds were determined to be (+)-neo-olivil (3) [13], (+)-syringaresinol (4) [14], hedyotol D (5) [15], hyperin (6) [16], quercitrin (7) [17], and kaempferol 3-O-rhamnoside (8) [18], protocatechuic acid (9) [19], 4-hydroxybenzoic acid (10) [20], and ailanthoidiol (11) [21] by comparing their NMR spectroscopic data with those of the published data (Figure 1).
Compound 1 was obtained as a pale yellow amorphous powder. The HR-ESI-MS spectrum of compound 1 contained quasi-molecular ion peaks at m/z 543.1864 [M + Na]+ (Cald for C26H32NaO11, 543.1837), indicating its molecular formula to be C26H32O11. The 1H-NMR spectrum of 1 showed signals characteristic for a 1,3,4-trisubstituted benzene ring (δH 6.55 (1H, dd, J = 1.8, 7.8 Hz, H-6), 6.60 (1H, d, J = 1.8 Hz, H-2), and 6.65 (1H, d, J = 7.8 Hz, H-5)) and a 1′,2′,4′,5′-tetrasubstituted benzene ring (δH 6.04 (1H, s, H-3′) and 6.48 (1H, s, H-6′)). The signals of a methylenedioxy group and a methoxy group were observed at δH 5.70 (2H, s) and 3.70 (3H, s), respectively. Additionally, the signal of one anomeric proton at δH 3.96 (1H, d, J = 7.3 Hz) indicated the presence of one sugar unit in the structure of 1. The 13C-NMR (Table 1) and DEPT-135 spectroscopic data indicated signals of 26 carbons. In addition to signals of a dioxygen-bearing methylene, a methoxy group, and a hexose sugar moiety, the remaining 18 carbon signals were assigned to two C6-C3 units. The HMBC spectrum revealed significant correlations between the proton signal at δH 6.48 (H-6′) and the carbon signals at δC 34.2 (C-7′), 134.5 (C-2′), 147.2 (C-5′), 147.3 (C-4′); between the proton signal at δH 2.76 (H-7′a) and the carbon signals at δC 41.0 (C-8′), 65.5 (C-9′), 131.4 (C-1′), 134.5 (C-2′); between the proton signal at δH 3.59 (H-9′b) and the carbon signals at δC 34.2 (C-7′), 45.5 (C-8); between the proton signal at δH 3.54 (H-9) and the carbon signals at δC 41.0 (C-8′), 49.7 (C-7), 104.1 (C-1″); and between the proton signal at δH 5.70 (-OCH2O-) and the carbon signals at δC 147.2 (C-5′), 147.3 (C-4′), which led to confirmation of the establishment of a tetralin glycoside moiety. Correlations between the proton signal at δH 6.60 (H-2) and the carbon signals at δC 49.7 (C-7), 123.5 (C-6), 138.6 (C-1), 146.24 (C-4), 149.2 (C-3); and between the methoxy proton signal at δH 3.70 and the carbon signal at δC 149.2 (C-3) in the HMBC spectra led to the confirmation of a hydroxyl and a methoxyl group at C-4 and C-3, respectively. Correlations between the proton signals at δH 6.60 (H-2), 6.55 (H-6) and the carbon signal at δC 49.7 (C-7) further indicated that two phenyl groups connected together at C-7 to form an aryltetralin lignan. The glucosyl linkage was confirmed by HMBC correlation between an anomeric proton at δH 3.96 (H-1″) and δC 70.8 (C-9). The coupling constant of the anomeric proton was 7.3 Hz in doublet multiplicity in the 1H-NMR spectrum, which confirmed the β-configuration of glucopyranoside. The absolute configurations were determined by examination of the circular dichroism (CD) spectrum. The CD spectrum of 1 showed a positive and a negative Cotton effect at 294 nm (+10.84) and 277 nm (−8.07), respectively, indicating “R” configuration of C-7, which was well characterized for 7(R)-aryltetralin lignans [22,23]. Next, NOE correlations of H-8 (δH 1.87) with both H-2 (δH 6.60) and H-6 (δH 6.55) indicated S configuration at C-8. Due to the close chemical shifts of H2-9 and H2-9′, the absolute configuration at C-8′ was determined by interpretation of 13C- and 1H-NMR spectra. The similar chemical shifts of C-7′ (δC 34.2), C-8 (δC 45.5), C-8′ (δC 41.0), and C-9′ (δC 65.5) were compared with those of (-)-isolariciresinol 3α-O-β-d-glucopyranoside (C-7′ (δC 33.6), C-8 (δC 45.4), C-8′ (δC 41.1), and C-9′ (δC 65.5)) [24], suggesting the same configuration “R” at C-8′. Additionally, the “R” configuration at C-8′ was in good agreement with the trans-axial coupling constant of H-8′ (δH 1.87) and H-7′ax (δH 2.76, dd, J = 16.1, 10.1 Hz) (Figure 2). Consequently, the structure of compound 1 was determined to be (7R,8S,8′R)-3-methoxy-4,9,9′-trihydroxy-3′,4′-methylendioxy aryltetralin lignan 9-O-β-d-glucopyranoside, and named zanthoxyloside C.
Compound 2 was obtained as a white amorphous powder. The HR-ESI-MS spectrum of compound 2 contained quasi-molecular ion peaks at m/z 543.1873 [M + Na]+ (Cald for C26H32NaO11, 543.1837), indicating its molecular formula to be C26H32O11. The 1H-NMR spectrum of 2 showed two 1,3,4-trisubstituted benzene ring spin systems (δH 6.71 (1H, dd, J = 2.1, 8.2 Hz, H-6), 6.83 (1H, d, J = 2.1 Hz, H-2), and 6.66 (1H, d, J = 8.2 Hz, H-5)) and (δH 6.59 (1H, dd, J = 8.2, 1.3 Hz, H-2′) , 6.63 (1H, d, J = 8.2 Hz, H-3′) and 6.64 (1H, dd, J = 8.2, 1.3 Hz, H-6′)). The signal of a methylene dioxy proton at δH 5.80 (2H, s) and a methoxy group at δH 3.76 (3H, s) were also observed. The signal of one anomeric proton at δH 4.20 (1H, d, J = 8.2 Hz) indicated the presence of one sugar unit in the structure of 2. The 13C-NMR (Table 1) and DEPT-135 spectroscopic data of 2 also indicated signals of 26 carbons, which was in agreement with the structure of lignan glycoside as compound 1. However, the downfield shift of C-7 (δC 84.3) and C-9′ (δC 73.7) suggested that compound 2 belonged the tetrahydrofuran lignans. The HMBC spectrum revealed significant correlations between the proton signal at δH 6.65 (H-6′) and the carbon signals at δC 33.9 (C-7′), 122.7 (C-2′), 136.1 (C-1′), 147.3 (C-4′); between the proton signal at δH 2.91 (H-7′a) and the carbon signals at δC 44.2 (C-8′), 51.8 (C-8), 73.7 (C-9′), 110.1 (C-6′), 122.7 (C-2′), 136.1 (C-1′); between the proton signal at δH 2.63 (H-8′) and the carbon signals at δC 51.8 (C-8), 68.5 (C-9), 73.7 (C-9′), 84.3 (C-7), 136.1 (C-1′); and between the proton signal at δH 2.41 (H-8) and the carbon signals at δC 33.9 (C-7′), 44.2 (C-8′), 68.5 (C-9), 73.7 (C-9′), 84.3 (C-7), which led to the establishment of a linkage moiety between methylenedioxyphenyl and tetrahydrofuran. Correlations between the proton signal at δH 6.83 (H-2) and the carbon signals at δC 84.3 (C-7), 119.9 (C-6), 135.6 (C-1), 147.1 (C-4), 149.2 (C-3); and between the methoxy proton signal at δH 3.76 and the carbon signal at δC 149.2 (C-3) in HMBC led to the establishment of a hydroxyl and methoxy groups at C-4 and C-3, respectively. Correlations between the proton signals at δH 6.83 (H-2), 6.70 (H-6) and the carbon signal at δC 84.3 (C-7) revealed a second benzene ring moiety connected to the tetrahydrofuran ring at C-7. The glucosyl linkage was confirmed by the HMBC correlation between an anomeric proton at δH 4.20 (H-1″) with δC 68.53 (C-8). The coupling constant of the anomeric proton was 8.2 Hz in doublet multiplicity in the 1H-NMR spectrum, which confirmed the β-configuration of glucopyranoside. Finally, the absolute configurations were determined by examinations of the CD spectrum and NOE correlation. The NOE correlations, including proton H-8 (δH 2.41) with both protons H-2 (δH 6.83) and H-6 (δH 6.71), proton H-7 (δH 4.73) with H-9 (δH 3.50), proton H-9 (δH 3.50) with H-7′ (δH 2.91), were clearly observed in the NOESY spectrum of 2, which confirmed their close proximity, as shown in Figure 3. In addition, the CD spectrum of 2 showed the opposite trend of Cotton effects (positive effects at 241 nm (+0.24) and 289 nm (+0.13)) in comparison with those of (+)-(7S,8R,8′R)-lariciresinol (negative effects at 244 nm (−0.42) and 290 nm (−0.26)) _ENREF_4 [25], which indicated 7R,8S,8′S configurations of compound 2. Thus, the structure of compound 2 was determined to be (7R,8S,8′S)-3-methoxy-4,9-dihydroxy-3′,4′-methylendioxy-7,9′-epoxylignan 9-O-β-d-glucopyranoside, and named zanthoxyloside D (see Supplementary Materials).
The antioxidant activities of the isolated compounds 111 were evaluated with respect to their peroxyl radical-scavenging and reducing capacity. Table 2 shows the scavenging activities of compounds 111 on peroxyl radicals, which were generated from 2,2′-azobis(2-amidinopropane) dihydrochloride (AAPH) in the oxygen radical absorbance capacity (ORAC) assay. All isolated compounds showed significant peroxyl radical-scavenging activities, with values of 5.91 ± 0.11 to 26.91 ± 1.05 μM at a concentration of 10 μM. The ability of compounds 111 to stimulate the reduction of copper ions (Cu2+ to Cu+) by donating electrons was investigated to determine whether their peroxyl radical-scavenging capacities, with the donation of hydrogen atoms, could be related to their reduction capacities. As shown in Table 2, compounds 19 showed significant reducing capacities, with values of 9.60 ± 0.26 to 33.04 ± 0.17 μM at a concentration of 10 μM. The rest of the compounds (10 and 11) showed weak activities. These results suggest that the peroxyl radical-scavenging and reducing capacity of all the tested compounds, due to transfer of hydrogen atoms and single electron, may be relevant to the hydroxyl groups of the benzene rings [26,27,28].
The anti-osteoporotic activities were investigated using TRAP assay on RAW 264.7 cells. The inhibitory effects of isolated compounds were tested based on the suppression of excessive bone resorption by osteoclasts. As shown in Table 3, compounds 3, 69, and 11 showed significant inhibitory activities, with values of 77.73 to 92.42% relative to the RANKL-treated control (100%).

3. Materials and Methods

3.1. General Information

The NMR spectra were recorded using JEOL ECA 600 MHz, JEOL JNM-AL 400 MHz (Jeol, Tokyo, Japan), and Bruker FT 300 MHz (Bruker Biospin GmbH, Karlsruhe, Germany) spectrometer using TMS as an internal standard. Chemical shift (δ) is expressed in ppm with reference to the TMS signals. Low ESI-MS spectra were obtained on a Shimadzu LCMS-2010. High-resolution electrospray ionization mass spectra (HR-ESI-MS) were obtained using an Agilent 6530 Accurate-Mass Q-TOF LC/MS system. The CD spectra were recorded using Jasco J-815 (150-L) (JASCO Crop., Tokyo, Japan). The UV spectra were recorded using UVmini-1240 (Shimadzu, Kyoto, Japan). GC was carried out on a Shimadzu-2010 (Shimadzu, Kyoto, Japan) spectrometer: detector, FID; detection temperature, 300 °C; column, SPB-1 (0.25mm i.d. × 30 m); column temperature, 230 °C; carrier gas, He (2 mL/min) injection temperature, 250 °C; injection volume, 0.5 μL. Column chromatography was performed using silica gel (Kieselgel 60, 70–230 mesh and 230–400 mesh, Merck, Darmstadt, Germany) and C-18 resins (30–50 µm, Fuji Silysia Chemical Ltd., Kasugai, Japan).

3.2. Plant Material

Dried stems of Z. piperitum were purchased at Daekwang Farm, Busan, Korea in November 2012 and were taxonomically identified by one of the authors (Prof. Young Ho Kim). A voucher specimen (CNU12107) was deposited at the Herbarium of College of Pharmacy, Chungnam National University, Daejeon, Korea.

3.3. Extraction and Isolation

Dried stems of Z. piperitum DC. (3.0 kg) were extracted with methanol at room temperature three times. After removal of the solvent under reduced pressure, the crude extract (120.0 g) was dissolved in 4.0 L of H2O to form a suspension that was successively partitioned with n-hexane, CH2Cl2, EtOAc, and BuOH to give n-hexane (45.0 g), CH2Cl2 (29.0 g), EtOAc (2.5 g), and BuOH (28.0 g) extracts, respectively.
The CH2Cl2 extract was subjected to column chromatography using SiO2 (70,230 mesh), eluting with gradient solvent system of n-hexane/acetone (100/0–0:100; v/v, 1.5 L for each step) to give five fractions (D1–D6). Franction D2 (900.0 mg) was subjected to RP column, eluted with gradient solvent system of MeOH/H2O (3/7–4/1; v/v, 0.5 L for each step) to yield six sub-fractions (D2.1–D2.6). Fraction D2.3 (90.0 mg) was separated using silica gel column with n-hexane/CH2Cl2/MeOH (3/3/0.2, v/v/v) as eluent to afford compound 3 (5.0 mg). Fraction D2.5 (200.0 mg) was separated using sephadex LH-20 column with CH2Cl2/MeOH (2/1, v/v) as eluent to afford compound 4 (90.0 mg). Fraction D4 (3.1 g) was subjected to silica gel column chromatography, eluted with gradient solvent system of n-hexane/EtOAc/MeOH (14/2/1–7/2/1; v/v/v, 0.8 L for each step) to give five fractions (D4.1–D4.5). Fraction D4.3 (1.8 g) was separated by silica gel column eluting with n-hexane/EtOAc/acetone (10/4/1, v/v/v) to yield four smaller fractions (D4.3.1.1–D4.3.1.4). Fraction D4.3.1.2 (20.0 mg) was separated using RP column, eluted with MeOH/H2O (3/2, v/v) to yield compound 11 (4.0 mg).
The EtOAc extract was subjected to column chromatography using sephadex LH-20, eluting with CH2Cl2/MeOH (1/1, v/v) to give five fractions (E1–E5). Fraction E2 (180.0 mg) was subjected to sephadex LH-20 column, eluted with MeOH/ H2O (1/1, v/v) to give four sub-fractions (E2.1–E2.4). Fraction E2.4 (20.0 mg) was subjected to RP column, eluted with gradient solvent system of MeOH/H2O (1/4–1/1; v/v, 0.4 L for each step) to yield compounds 9 (7.0 mg) and 10 (4.0 mg). Fraction E3 (900.0 mg) was subjected to RP column, eluted with a gradient solvent system of MeOH/H2O (1/4–0/1; v/v, 0.5 L for each step) to yield four sub-fractions (E3.1–E3.4). Fraction E3.2 (800.0 mg) was separated using silica gel column with CHCl3/MeOH/H2O (5/1/0.1, 3/1/0.1, v/v/v) elution solvent to give compounds 6 (750.0 mg) and 8 (12.0 mg). Fraction E3.3 (90.0 mg) was separated using silica gel column with CHCl3/MeOH/H2O (4/1/0.1, v/v/v) as eluent to afford compound 7 (73.0 mg). Fraction E4 (230.0 mg) was separated by RP column eluting with a gradient solvent system of MeOH/H2O (1:4–0:1; v/v, 0.4 L for each step) to yield four smaller fractions (E4.1–E4.4). Repeated silica gel column chromatography of fraction E4.4 with CH2Cl2/MeOH (10/1, v/v) and further purified using sephadex LH-20 column with MeOH/H2O (1/1, v/v) to give compounds 5 (70.0 mg). Fraction E5 (500.0 mg) was separated using silica gel column with n-hexane/EtOAc/acetone (10/4/1, v/v/v) to give six fractions (E5.1–E5.6). Fraction E5.5.1 (13.0 mg) was separated by RP column eluting with MeOH/H2O (2/1, v/v) to yield compound 1 (4.0 mg). Fraction E5.5.2 (10.0 mg) was subjected to silica gel column, eluted with n-hexane/EtOAc/MeOH (1/1/0.3, v/v/v) to obtain compound 2 (4.0 mg).

3.4. Acid Hydrolysis and Sugar Identification

Compounds 1 and 2 (2 mg each) were heated in 3 mL 10% HCl (dioxane-H2O, 1:1) at 90 °C for 3 h. The residue was partitioned between EtOAc and H2O to give aglycone and sugar, respectively. The aqueous layer was evaporated until dry to yield a residue; this was dissolved in anhydrous pyridine (200 μL) and then mixed with a pyridine solution of 0.1 M l-cysteine methyl ester hydrochloride (200 μL). After warming to 60 °C for 1 h, trimethylsilylimidazole solution was added, and the reaction solution was warmed at 60 °C for 1 h. The mixture was evaporated in vacuo to yield a dried product, which was partitioned between n-hexane and H2O. The n-hexane layer was filtered and analyzed by gas chromatography. Retention times of the persilylated monosaccharide derivatives were as follows: D-glucose (tR, 14.11 min) was confirmed by comparison with those of authentic standards (Sigma-Aldrich, St. Louis, MO, USA).

3.5. Product Characterization

Zanthoxyloside C (1): Pale yellow amorphous powder; C26H32O11; [ α ] D 25 : −30.7 (c 0.1, MeOH), UV (MeOH) λmax (nm) (log ε): 287 (3.78) nm, IR (KBr) νmax: 3365, 2891, 1616, 1435, 1232, 1073, 1034 cm−1; (1H-NMR (CD3OD, 600 MHz) and 13C-NMR data (CD3OD, 150 MHz), see Table 1; HR-ESI-MS: m/z 543.1864 [M + Na]+ (Cald for C26H32NaO11, 543.1837).
Zanthoxyloside D (2): White amorphous powder; C26H32O11; [ α ] D 25 : +52.7 (c 0.1, MeOH), UV (MeOH) λmax (nm) (log ε): 285 (3.65) nm, IR (KBr) νmax: 3392, 2886, 1635, 1436, 1248, 1075, 1035 cm−1; (1H-NMR (CD3OD, 600 MHz) and 13C-NMR data (CD3OD, 150 MHz), see Table 1; HR-ESI-MS: m/z 543.1873 [M + Na]+ (Cald for C26H32NaO11, 543.1837).

3.6. Oxygen Radical Absorbance Capacity (ORAC) Assay

ORAC assay was carried out using a Tecan GENios multifunctional plate reader (Salzburg, Austria) with fluorescent filters (excitation wavelength: 485 nm, emission filter: 535 nm). In the final assay mixture, fluorescein (40 nM) was used as a target of free radical attack with AAPH (20 mM) as a peroxyl radical generator in the peroxyl radical-scavenging capacity assay. The analyzer was programmed to record fluorescein fluorescence every 2 min after AAPH had been added. All fluorescence measurements were expressed relative to the initial reading. Final values were calculated based on the difference in the area under the fluorescence decay curve between the blank and test sample. All data are expressed as net protection area (net area). Trolox (1 µM) was used as the positive control to scavenge peroxyl radicals [29].

3.7. Reducing Capacity (CUPRAC) Assay

The electron-donating capacities of isolated compounds (111) to reduce Cu2+ to Cu+ were assessed according to the method of Aruoma et al [30]. Forty microliters of different concentrations of compounds dissolved in ethanol were mixed with 160 µL of a mixture containing 0.5 mM CuCl2 and 0.75 mM neocuproine, a Cu+ specific chelator, in10 mM phosphate buffer. Absorbance was measured using a microplate reader at 454 nm for 1 h. Increased absorbance of the reaction mixture indicated greater reducing power.

3.8. Tartrate-Resistant Acid Phosphatase (TRAP) Assay

TRAP Staining. RAW 264.7 cells (macrophages (pre-osteoclasts) from BALB/c mouse) were seeded in 12-well plates (3 × 10⁴ cells/well) containing DMEM medium plus 10% FBS, and the medium was replaced with test samples in differentiation medium containing 50 ng/mL RANKL. The differentiation medium was changed every 2 days. After 5 days, the medium was removed, and the cell monolayer was gently washed twice using ice-cold PBS. The cells were fixed in 3.5% formaldehyde for 10 min and ethanol-acetone (1:1) for 1 min. Subsequently, the dried cells were incubated in 50 mM citrate buffer (pH 4.5) containing 10 mM sodium tartrate and 6 mM PNPP. After 1 h incubation, the reaction mixtures were transferred to new well plates containing an equal volume of 0.1 N NaOH. Absorbance was measured at 405 nm using an enzyme-linked immunoassay reader, and TRAP activity was expressed as the percent of the untreated control [31].

3.9. Statistical Analysis

All data represent the mean ± S.D. of at least three independent experiments performed in triplicates. Statistical significance is determined by one-way ANOVA followed by Dunnett’s multiple comparison test, p < 0.05, using the SPSS 21 (IBM Crop., Armonk, NY, USA) program.

4. Conclusions

This study confirmed that the phenolic constituents of Z. piperitum stems have potentialities for antioxidant and anti-osteoporosis activities. When comparing the results of two activities, there was no significant correlation between antioxidant and anti-osteoporotic activities. Therefore, further study may be required to determine whether the significant anti-osteoporotic activities of compounds 3, 69, and 11 are indirectly related to the antioxidant activity.

Supplementary Materials

The following are available online. 1D/2D-NMR, CD, and HR-ESI-MS spectra of compounds 1 and 2.

Acknowledgments

This manuscript is an additional study, and a portion is based on the first author’s doctoral dissertation from Chungnam National University. This research was supported by Basic Science Research Program through the National Research Foundation of Korea (NRF) funded by the Ministry of Education (2009-0093815).

Author Contributions

S.Y.Y. performed the isolation, structure elucidation, and wrote the manuscript. S.-H.L. and H.-D.J. conducted the bioassay experiments. B.H.T. and Y.H.K. conceived and designed the experiments.

Conflicts of Interest

The authors declare no conflict of interest.

References

  1. Harris, P.E.; Bouloux, P.-M.G. Metabolic Bone Disease. In Endocrinology in Practice, 2nd ed.; Harris, P.E., Bouloux, P.-M.G., Eds.; CRC Press: London, UK, 2014; pp. 243–261. ISBN 978-1841849515. [Google Scholar]
  2. Rosen, C.J.; Bouxsein, M.L. Mechanisms of Disease: Is Osteoporosis the Obesity of Bone? Nat. Clin. Pract. Rheumatol. 2006, 2, 35–43. [Google Scholar] [CrossRef] [PubMed]
  3. Teitelbaum, S.L. Bone Resorption by Osteoclasts. Science 2000, 289, 1504–1508. [Google Scholar] [CrossRef] [PubMed]
  4. Parfitt, A.; Mathews, C.; Villanueva, A.; Kleerekoper, M.; Frame, B.; Rao, D. Relationships between Surface, Volume, and Thickness of Iliac Trabecular Bone in Aging and in Osteoporosis. Implications for the Microanatomic and Cellular Mechanisms of Bone Loss. J. Clin. Investig. 1983, 72, 1396–1409. [Google Scholar] [CrossRef] [PubMed]
  5. Srivastava, M.; Deal, C. Osteoporosis in Elderly: Prevention and Treatment. Clin. Geriatr. Med. 2002, 18, 529–555. [Google Scholar] [CrossRef]
  6. Basu, S.; Michaëlsson, K.; Olofsson, H.; Johansson, S.; Melhus, H. Association Between Oxidative Stress and Bone Mineral Density. Biochem. Biophys. Ress Communs. 2001, 288, 275–279. [Google Scholar] [CrossRef] [PubMed]
  7. Maggio, D.; Barabani, M.; Pierandrei, M.; Polidori, M.C.; Catani, M.; Mecocci, P.; Senin, U.; Pacifici, R.; Cherubini, A. Marked Decrease in Plasma Antioxidants in Aged Osteoporotic women: Results of a Cross-Sectional Study. J. Clin. Endocrinol. Metab. 2003, 88, 1523–1527. [Google Scholar] [CrossRef] [PubMed]
  8. Morton, D.J.; Barrett-Connor, E.L.; Schneider, D.L. Vitamin c Supplement Use and Bone Mineral Density in Postmenopausal Women. J. Bone. Miner. Res. 2001, 16, 135–140. [Google Scholar] [CrossRef] [PubMed]
  9. Hatano, T.; Inada, K.; Ogawa, T.-o.; Ito, H.; Yoshida, T. Aliphatic Acid Amides of the Fruits of Zanthoxylum piperitum. Phytochemistry. 2004, 65, 2599–2604. [Google Scholar] [CrossRef] [PubMed]
  10. Jiang, L.; Kubota, K. Formation by Mechanical Stimulus of the Flavor Compounds in Young Leaves of Japanese Pepper (Xanthoxylum piperitum DC.). J. Agric. Food Chem. 2001, 49, 1353–1357. [Google Scholar] [CrossRef] [PubMed]
  11. Sakai, T.; Yoshihara, K.; Hirose, Y. Constituents of Fruit Oil from Japanese Pepper. Bull. Chem. Soc. Jap. 1968, 41, 1945–1950. [Google Scholar] [CrossRef]
  12. Machmudah, S.; Izumi, T.; Sasaki, M.; Goto, M. Extraction of Pungent Components from Japanese Pepper (Xanthoxylum piperitum DC.) Using Supercritical CO2. Sep. Purif. Technol. 2009, 68, 159–164. [Google Scholar] [CrossRef]
  13. Kikuchi, M.; Kikuchi, M. Studies on the Constituents of Swertia japonica Makino II. On the Structures of New Glycosides. Chem. Pharm. Bull. 2005, 53, 48–51. [Google Scholar] [CrossRef] [PubMed]
  14. Cai, X.F.; Lee, I.S.; Dat, N.T.; Shen, G.; Kang, J.S.; Kim, D.H.; Kim, Y.H. Inhibitory Lignans Against NFAT Transcription Factor from Acanthopanax koreanum. Arch. Pharm. Res. 2004, 27, 738–741. [Google Scholar] [CrossRef] [PubMed]
  15. Nan, H.; Lin, H.; Qian, Z. Two New Furofuran Lignans from Kandelia obovata. Heterocycl. Int. J. Rev. Commun. Heterocycl. Chem. 2013, 87, 1093–1098. [Google Scholar] [CrossRef]
  16. Choi, J.S.; Young, H.S.; Park, J.C.; Choi, J.-H.; Woo, W.S. Flavonoids from the Leaves of Rhododendron brachycarpum. Arch. Pharm. Res. 1986, 9, 233–236. [Google Scholar] [CrossRef]
  17. Pyo, M.-K.; Koo, Y.-K.; YunChoi, H.-S. Anti-platelet Effect of the Phenolic Constituents Isolated from the Leaves of Magnolia obovata. Nat. Prod. Sci. 2002, 8, 147–151. [Google Scholar]
  18. Fukunaga, T.; Nishiya, K.; Kajikawa, I.; Watanabe, Y.; Suzuki, N.; Takeya, K.; Itokawa, H. Chemical Studies on the Constituents of Hyphear tanakae Hosokawa from Different Host Trees. Chem. Pharm. Bull. 1988, 36, 1180–1184. [Google Scholar] [CrossRef]
  19. Flamini, G.; Antognoli, E.; Morelli, I. Two Flavonoids and Other Compounds from the Aerial Parts of Centaurea bracteata from Italy. Phytochemistry 2001, 57, 559–564. [Google Scholar] [CrossRef]
  20. Rukachaisirikul, V.; Khamthong, N.; Sukpondma, Y.; Phongpaichit, S.; Hutadilok-Towatana, N.; Graidist, P.; Sakayaroj, J.; Kirtikara, K. Cyclohexene, Diketopiperazine, Lactone and Phenol Derivatives from the Sea Fan-derived Fungi Nigrospora sp. PSU-F11 and PSU-F12. Arch. Pharm. Res. 2010, 33, 375–380. [Google Scholar] [CrossRef] [PubMed]
  21. Hsiao, J.-J.; Chiang, H.-C. Phenylpropanoids from Aralia bipinnata. Phytochemistry. 1995, 39, 825–827. [Google Scholar] [CrossRef]
  22. Zhao, C.; Nagatsu, A.; Hatano, K.; Shirai, N.; Kato, S.; Ogihara, Y. New Lignan Glycosides from Chinese Medicinal Plant, Sinopodophillum emodi. Chem. Pharm. Bull. 2003, 51, 255–261. [Google Scholar] [CrossRef] [PubMed]
  23. Maryanoff, B.E.; McComsey, D.F.; Craig, J.C. Chiroptical Properties and Absolute Configuration of Pyrroloisoquinoline Antidepressants. Chirality 1998, 10, 169–172. [Google Scholar] [CrossRef]
  24. Wen, Q.; Lin, X.; Liu, Y.; Xu, X.; Liang, T.; Zheng, N.; Kintoko; Huang, R. Phenolic and Lignan Glycosides from the Butanol Extract of Averrhoa carambola L. root. Molecules 2012, 17, 12330–12340. [Google Scholar] [CrossRef] [PubMed]
  25. Chin, Y.W.; Chai, H.B.; Keller, W.J.; Kinghorn, A.D. Lignans and Other Constituents of the Fruits of Euterpe oleracea (Acai) with Antioxidant and Cytoprotective Activities. J. Agric. Food Chem. 2008, 56, 7759–7764. [Google Scholar] [CrossRef] [PubMed]
  26. Sies, H. Oxidative stress: Oxidants and Antioxidants. Exp. Physiol. 1997, 82, 291–295. [Google Scholar] [CrossRef] [PubMed]
  27. Ainsworth, E.A.; Gillespie, K.M. Estimation of Total Phenolic Content and Other Oxidation Substrates in Plant Tissues Using Folin–Ciocalteu Reagent. Nat. Prot. 2007, 2, 875–877. [Google Scholar] [CrossRef] [PubMed]
  28. Yan, X.-T.; Lee, S.-H.; Li, W.; Sun, Y.-N.; Yang, S.-Y.; Jang, H.-D.; Kim, Y.-H. Evaluation of the Antioxidant and Anti-osteoporosis Activities of Chemical Constituents of the Fruits of Prunus mume. Food Chem. 2014, 156, 408–415. [Google Scholar] [CrossRef] [PubMed]
  29. Kaur, C.; Kapoor, H.C. Antioxidants in fruits and vegetables–the millennium’s health. Int. J. Food Sci. Technol. 2001, 36, 703–725. [Google Scholar] [CrossRef]
  30. Aruoma, O.I.; Deiana, M.; Jenner, A.; Halliwell, B.; Kaur, H.; Banni, S.; Corongiu, F.P.; Dessí, M.A.; Aeschbach, R. Effect of hydroxytyrosol found in extra virgin olive oil on oxidative DNA damage and on low-density lipoprotein oxidation. J. Agric. Food Chem. 1998, 46, 5181–5187. [Google Scholar] [CrossRef]
  31. Lee, S.-H.; Ding, Y.; Yan, X.T.; Kim, Y.-H.; Jang, H.-D. Scopoletin and scopolin isolated from artemisia iwayomogi suppress differentiation of osteoclastic macrophage RAW 264.7 cells by scavenging reactive oxygen species. J. Nat. Prod. 2013, 76, 615–620. [Google Scholar] [CrossRef] [PubMed]
Sample Availability: Samples of the compounds are available from the authors.
Figure 1. Structures of compounds 111 from Z. piperitum stems.
Molecules 23 00457 g001
Figure 2. Key HMBC and NOESY correlations of compound 1.
Molecules 23 00457 g002
Figure 3. Key HMBC and NOESY correlations of compound 2.
Molecules 23 00457 g003
Table 1. 1H- and 13C-NMR spectroscopic data of compounds 1 and 2 in CD3OD.
Position12
δC aδH b (mult., J in Hz)δC aδH b (mult., J in Hz)
1138.6-135.6-
2114.06.60 (d, 1.8)110.76.83 (d, 2.1)
3149.2-148.2-
4146.2-147.1-
5116.26.65 (d, 7.8)116.06.66 (d, 8.2)
6123.56.55 (dd, 7.8, 1.8)119.96.71 (dd, 8.2, 2.1)
749.73.68 * 84.34.73 (d, 6.9)
845.51.87 *51.82.41 (q, 6.8)
970.83.54 (dd. 6.2, 10.3)68.53.50 (dd, 6.2, 10.3)
3.69 (dd, 6.2, 10.3) 4.11 (dd, 6.2, 10.3)
1′131.4-136.1-
2′ 134.5-122.76.59 (dd, 8.2, 1.3)
3′110.56.04 (s)109.16.63 (d, 8.2)
4′147.3-147.3-
5′147.2-149.2-
6′108.96.48 (s)110.16.64 (dd, 8.2, 1.3)
7′34.22.76 (dd, 10.1, 16.1)33.92.91 (dd, 3.1, 12.4)
2.63 (dd, 2.8, 16.1) 2.45 (dd, 3.1, 12.4)
8′41.01.87 *44.22.63 (m)
9′65.53.69 *73.73.87 (dd, 6.2, 8.2)
3.59 * 3.63 (dd, 6.2, 8.2)
3-OCH356.63.70 *56.43.76 (s)
-OCH2O-101.95.70 (s)102.25.80 (s)
Glc-1104.13.96 (d, 7.3)104.74.20 (d, 7.6)
275.23.07 (m)75.23.15 (dd, 9.1, 7.8)
378.33.19 (m)78.33.21 (m)
471.53.20 (m)71.73.28 (m)
578.02.99 (m)78.03.34 (m)
662.63.56 (m)62.93.61 (m)
3.70 (m) 3.84 (m)
* Overlapped signals; assignments were done by HMQC, HMBC, and NOESY experiments. a Measured at 600 MHz. b Measured at 150 MHz.
Table 2. The antioxidant activities of compounds isolated from the stems of Z. piperitum.
Compound (10 μM)Peroxyl Radical-scavenging Capacity (TE, μM) aReducing Capacity (Copper(I) Ions, μM)
113.26 ± 0.339.60 ± 0.26
215.79 ± 0.6410.69 ± 0.11
314.47 ± 0.9814.51 ± 0.17
412.98 ± 0.3020.42 ± 0.55
515.81 ± 0.3316.39 ± 0.36
619.09 ± 0.0925.66 ± 0.32
722.12 ± 0.7627.97 ± 0.34
822.89 ± 0.8710.19 ± 0.11
926.91 ± 1.0533.04 ± 0.17
1020.53 ± 0.890.04 ± 0.06
115.91 ± 0.110.08 ± 0.06
All data are expressed as the mean ± standard deviation of three individual experiments. a Values are expressed as μM of Trolox equivalents (TE), one ORAC unit is equivalent to the net protection area provided by 1 μM of Trolox.
Table 3. Inhibitory effects of the isolated compounds on RANKL-induced osteoclast differentiation. a
Compound (10 μM) bInhibition (%)
388.36 ± 10.93
682.11 ± 9.31
788.36 ± 10.93
877.78 ± 4.24
977.73 ± 4.85
1192.42 ± 9.50
Control100.00 ± 9.90
Untreated Control41.91 ± 0.04
a Inhibition of osteoclast differentiation was reflected in the reduction of TRAP activity. TRAP-positive multinucleated osteoclasts (control, obtained from RANKL-induced RAW 264.7 cells) served as a positive control, while untreated cells (untreated control, without RANKL induction) served as a negative control. Values are expressed as a percentage of the control (mean ± standard deviation, n = 3). b Compounds 12, 45, and 10 showed no inhibitory effects on TRAP activity at 10 μM.

