Article

Metabolite Profiling of 14 Wuyi Rock Tea Cultivars Using UPLC-QTOF MS and UPLC-QqQ MS Combined with Chemometrics

1
College of Horticulture, Fujian Agriculture and Forestry University, Fuzhou 350002, China
2
FAFU-UCR Joint Center for Horticultural Biology and Metabolomics, Fujian Provincial Key Laboratory of Haixia Applied Plant Systems Biology, Fujian Agriculture and Forestry University, Fuzhou 350002, China
3
Wuyi Star Tea Industry Co., Ltd., Wuyishan 354300, China
4
Center for Plant Cell Biology, Institute of integrated Genome Biology, and Department of Botany and Plant Sciences, University of California, Riverside, CA 92521, USA
*
Author to whom correspondence should be addressed.
Molecules 2018, 23(2), 104; https://doi.org/10.3390/molecules23020104
Submission received: 25 December 2017 / Revised: 19 January 2018 / Accepted: 20 January 2018 / Published: 24 January 2018

Abstract

:
Wuyi Rock tea, well-recognized for rich flavor and long-lasting fragrance, is a premium subcategory of oolong tea mainly produced in Wuyi Mountain and nearby regions of China. The quality of tea is mainly determined by the chemical constituents in the tea leaves. However, this remains underexplored for Wuyi Rock tea cultivars. In this study, we investigated the leaf metabolite profiles of 14 major Wuyi Rock tea cultivars grown in the same producing region using UPLC-QTOF MS and UPLC-QqQ MS with data processing via principal component analysis and cluster analysis. Relative quantitation of 49 major metabolites including flavan-3-ols, proanthocyanidins, flavonol glycosides, flavone glycosides, flavonone glycosides, phenolic acid derivatives, hydrolysable tannins, alkaloids and amino acids revealed clear variations between tea cultivars. In particular, catechins, kaempferol and quercetin derivatives were key metabolites responsible for cultivar discrimination. Information on the varietal differences in the levels of bioactive/functional metabolites, such as methylated catechins, flavonol glycosides and theanine, offers valuable insights to further explore the nutritional values and sensory qualities of Wuyi Rock tea. It also provides potential markers for tea plant fingerprinting and cultivar identification.

Graphical Abstract

1. Introduction

Oolong tea is a partially-fermented tea manufactured in southeast China, mainly in Fujian and Guangdong. In recent years, the production and consumption of oolong tea has increased greatly worldwide, attributed to its pleasurable aroma and taste favored by consumers [1,2]. As a functional drink, oolong tea exhibits many health-promoting benefits, such as anti-oxidant, anti-cancer, anti-obesity, anti-atherosclerosis, anti-diabetes and anti-allergic activities [1].
Wuyi Rock tea is a distinctive and premium subcategory of oolong tea grown in Wuyi Mountain, which is a UNESCO World Heritage site and considered the birthplace of oolong tea, as well as nearby regions in the north part of Fujian Province. Recognized as the most prestigious oolong tea in China, Wuyi Rock tea boasts a history of over 1500 years and is renowned for its rich flavor and long-lasting fragrance, so-called ‘rock charm and floral fragrance’ [3]. Consumer demand for Wuyi Rock tea, both domestic and abroad, is increasing year by year but is often hindered by limited supplies and resulting high market price. Production of high-quality Wuyi Rock tea involves very complicated procedures, including leaf-picking, withering, zuoqing (partial fermentation, which includes alternating rotation and cooling steps), fixation (enzyme inactivation), rolling, roasting, grading and packaging [1] and usually relies on experienced workers [4]. Apart from manufacturing procedures, like the production of other types of tea, the quality of Wuyi Rock tea is also determined by the initial metabolite contents in fresh tea leaves, which depends on both cultivars and environmental factors [5,6,7]. According to the conventional classification by local people on the basis of the natural environment where tea plants have been grown, Wuyi Rock tea is subdivided into authentic rock tea, half rock tea, riverbank tea and tea grown outside the main production area in descending grade order [3]. This may suggest the geographic location as a key factor influencing the quality of Wuyi Rock tea.
On the other hand, the choice of cultivars to produce Wuyi Rock tea also matters but remains underexplored except for a few comparative studies, which have focused only on a small number of major constituents in processed tea and were not performed under controlled environmental conditions [8,9]. Contributed by unique climate and soil conditions, Wuyi Mountain is home to a large collection of tea germplasms. Historically, some tea cultivars have been used to produce Wuyi Rock tea since ancient times. Primary cultivars are ‘Shuixian’ and ‘Rougui’; the former was registered as a national tea cultivar whereas the latter as a provincial tea cultivar due to their stable quality and higher yields. Other elite clonal cultivars include ‘Dahongpao’, ‘Tieluohan’, ‘Baijiguan’, ‘Shuijingui’, ‘Guazijin’ and ‘Jinsuoshi’, which are among the estimated 216 cultivars listed as Wuyi Rock tea cultivars. Such diverse genetic resources are valuable for producing Wuyi Rock tea. However, for most of these cultivars, research to examine quality-related traits at the genetic and metabolomic level is critical yet insufficient. Therefore, it would be helpful to comprehensively survey the metabolomes of representative tea cultivars, and identify important varietal differences relevant to tea quality.
Non-targeted metabolomics approach based on UPLC-QTOF MS, GC-TOF MS or NMR is a powerful technique capable of detecting a high number of endogenous metabolites simultaneously [10]. It has been widely applied in tea research to study impacts of environmental factors on tea metabolites [11,12,13], characterize dynamic changes during tea manufacture [14,15] and discover key compounds for tea type discrimination [16,17]. In this study, by combining UPLC-QTOF MS-based non-targeted analysis with UPLC-QqQ MS-based targeted quantifications of catechins, rutin, amino acids and caffeine, we analyzed the metabolite profiles of unprocessed fresh tea leaves of 14 major Wuyi Rock tea cultivars grown in the same environmental conditions subjected to the same cultivation practices. Data processing by principal component analysis (PCA), partial least squared discriminant analysis (PLS-DA) and hierarchical cluster analysis revealed differences as well as commonalities between the leaf phytochemical compositions among cultivars. It offered a comprehensive view for leaf metabolomes of Wuyi Rock tea cultivars in general and provided basis for future characterizations of nutritional values, sensory qualities and biological properties of Wuyi Rock tea.

2. Results and Discussion

2.1. Major Tea Leaf Metabolites Showed both Universal and Cultivar-Dependent Accumulation Patterns

To identify abundant metabolites and assess metabolite differences in 14 Wuyi Rock cultivars, which included ‘Dahongpao’ (DHP), ‘Tieluohan’ (TLH), ‘Baijiguan’ (BJG), ‘Shuijingui’ (SJG), ‘Bantianyao’ (BTY), ‘Shuixian’ (SX), ‘Rougui’ (RG), ‘Beidou’ (BD), ‘Queshe’ (QS), ‘Xiaoyemaoxie’ (XYMX), ‘Jinfenghuang’ (JFH), ‘Aijiaowulong’ (AJWL), ‘Guazijin’ (GZJ) and ‘Jinsuoshi’ (JSS) (Figure 1), non-targeted analysis based on UPLC-QTOF MS was performed to profile tea leaves. Forty-nine major metabolites were tentatively assigned based on their accurate masses, MS/MS fragmentation patterns and UV absorbance, in comparison to standard compounds and references (Table 1). Catechins, caffeine and free amino acids have been shown in a large body of literatures to contribute significantly to the taste and flavor quality of tea [6,18,19,20]. Therefore, absolute quantifications of these compounds, along with rutin, were carried out using UPLC-QqQ MS to enable comparisons with tea cultivars from other studies. The quantification results were shown in Table 2. Relative differences in the metabolites found in each sample were depicted in a heat map, which integrated measurements from both non-targeted and targeted analyses (Figure 2 and Figure S1).
Most compounds were detected in all tea cultivars suggesting the presence of common machinery for secondary metabolism in tea plants (Figure 2). However, sharp variations between cultivars (VIP > 1 and p < 0.05) were found for many metabolite classes, such as flavan-3-ols, proanthocyanidins, flavonol glycosides, flavone glycosides, flavonone glycosides, phenolic acid derivatives, hydrolysable tannins, alkaloids and amino acids (Figure 2).
In PCA score plot (Figure 3A), the first and the second principal components explained 36.0% and 17.0% of the variation, respectively. Samples were clustered mainly according to their biological replicates in the PCA score plot, except that cultivars RG and BTY showed close aggregation, indicating inter-cultivar variations in metabolite profiles of Wuyi Rock tea cultivars. In addition, cultivars JFH and SJG were clearly separated from other cultivars along PC1 whereas cultivars QS and BD were separated from others along PC2. As these cultivars were grown in the same geographic region under the same cultivation condition, influences of varying environmental conditions on the chemical make-ups of tea leaves could be minimized. As a result, differences in metabolite compositions were largely attributed to particular genotype traits.
To investigate major differential metabolites, a PCA loading plot was applied (Figure 3B). The major groups that stood out in the plot corresponded to the MS signals of catechins (e.g., (−)-epigallocatechingallate (EGCG), (−)-epicatechingallate (ECG), (−)-epigallocatechin (EGC), (−)-epicatechin (EC), (−)-gallocatechin (GC), and (−)-epigallocatechin 3-(3-O-methylgallate) (EGCG3″Me)) and flavonol glycosides (e.g., rutin, quercetin galactosyl rutinoside, quercetin glucosyl rutinoside, kaempferol rutinoside and kaempferol glucosyl rutinoside). This inferred that catechins as well as quercetin and kaempferol derivatives were the most critical parameters for cultivar discrimination.

2.2. Flavan-3-ols Exhibited Variable Levels in Tea Leaves

A total of 10 flavan-3-ols was tentatively identified by UPLC-QTOF MS, including GC, EGC, (−)-catechin (C), EC, EGCG, 8-C-ascorbylepigallocatechin 3-gallate, EGCG3″Me, ECG, epicatechin 3-(3-O-methylgallate) (ECG3″Me) and epiafzelechin 3-gallate (Table 1). Major flavan-3-ols included EGCG, EGC, EC and ECG, which occurred at descending levels in all cultivars examined (Table 2). In general, phenolic contents of tea cultivars applied to black and oolong tea are higher than that of green tea [7]. EGCG, as the most dominant flavan-3-ol, ranged from 66.93 mg/g in cultivar BJG to 128.08 mg/g in cultivar JFH, whereas GC (1.44–6.75 mg/g) and C (0.37–1.76 mg/g) were only minor components (Table 2).
EGCG3″Me, an O-methylated catechin, was detected in all tea cultivars, albeit in very low abundance in cultivars SJG, BD, QS, XYMX and AJWL (Figure 2 and Table 2). Methylated catechins have attracted much attention because of their stronger anti-allergic activities than catechins, including EGCG [29,30]. Efforts have been made to screen different tea varieties to identify cultivars enriched in EGCG3″Me [6,31]. Lv and coworkers identified four out of 71 Chinese tea cultivars with EGCG3″Me contents higher than 10 mg/g; interestingly, they are all oolong tea cultivars, implying that oolong tea cultivars may be a good source for finding EGCG3″Me-rich tea cultivars [31]. Supporting this notion, we found that cultivar BTY contained the highest content of EGCG3″Me (12.05 mg/g) (Table 2). Moreover, the other three cultivars, TLH, BJG and JFH, also produced medium levels of EGCG3″Me (≥6 mg/g). The distribution of a second O-methylated catechin, ECG3″Me, which also exhibited a strong anti-inflammatory activity in vitro [29], resembled that of EGCG3″Me, ranging from barely detectable in cultivars SJG, BD, QS, XYMX and AJWL to being highest in cultivar BTY. Due to the lack of an authentic standard, the absolute quantification of ECG3″Me was impossible. Nevertheless, the level of this compound somewhat demonstrated a positive correlation with the EGCG3″Me level in tea cultivars (Figure 2 and Figure S1). As a result, there is potentially a higher chance of finding tea cultivars rich in ECG3″Me among cultivars rich in EGCG3″Me.
An ascorbic acid-appended EGCG derivative, namely, 8-C-ascorbylepigallocatechin 3-gallate, was another interesting flavan-3-ol present as a minor constituent in seven cultivars, TLH, BJG, SX, BD, QS, AJWL and JSS (Figure 2). Initially isolated from a commercial oolong tea sample, this compound was structurally elucidated through NMR spectroscopy by Hashimoto and coworkers [32]. Subsequent activity tests showed that it demonstrated inhibitory effects against HIV replication in H9 lymphocyte cells [33] and pancreatic lipase [34]. Information on the distribution of 8-C-ascorbylepigallocatechin 3-gallate among tea cultivars is scarce. Nonetheless, considering where this compound was first isolated and its high occurrence in the current study, Wuyi Rock tea cultivars may be a promising source for compound isolation to further explore its therapeutic potential.

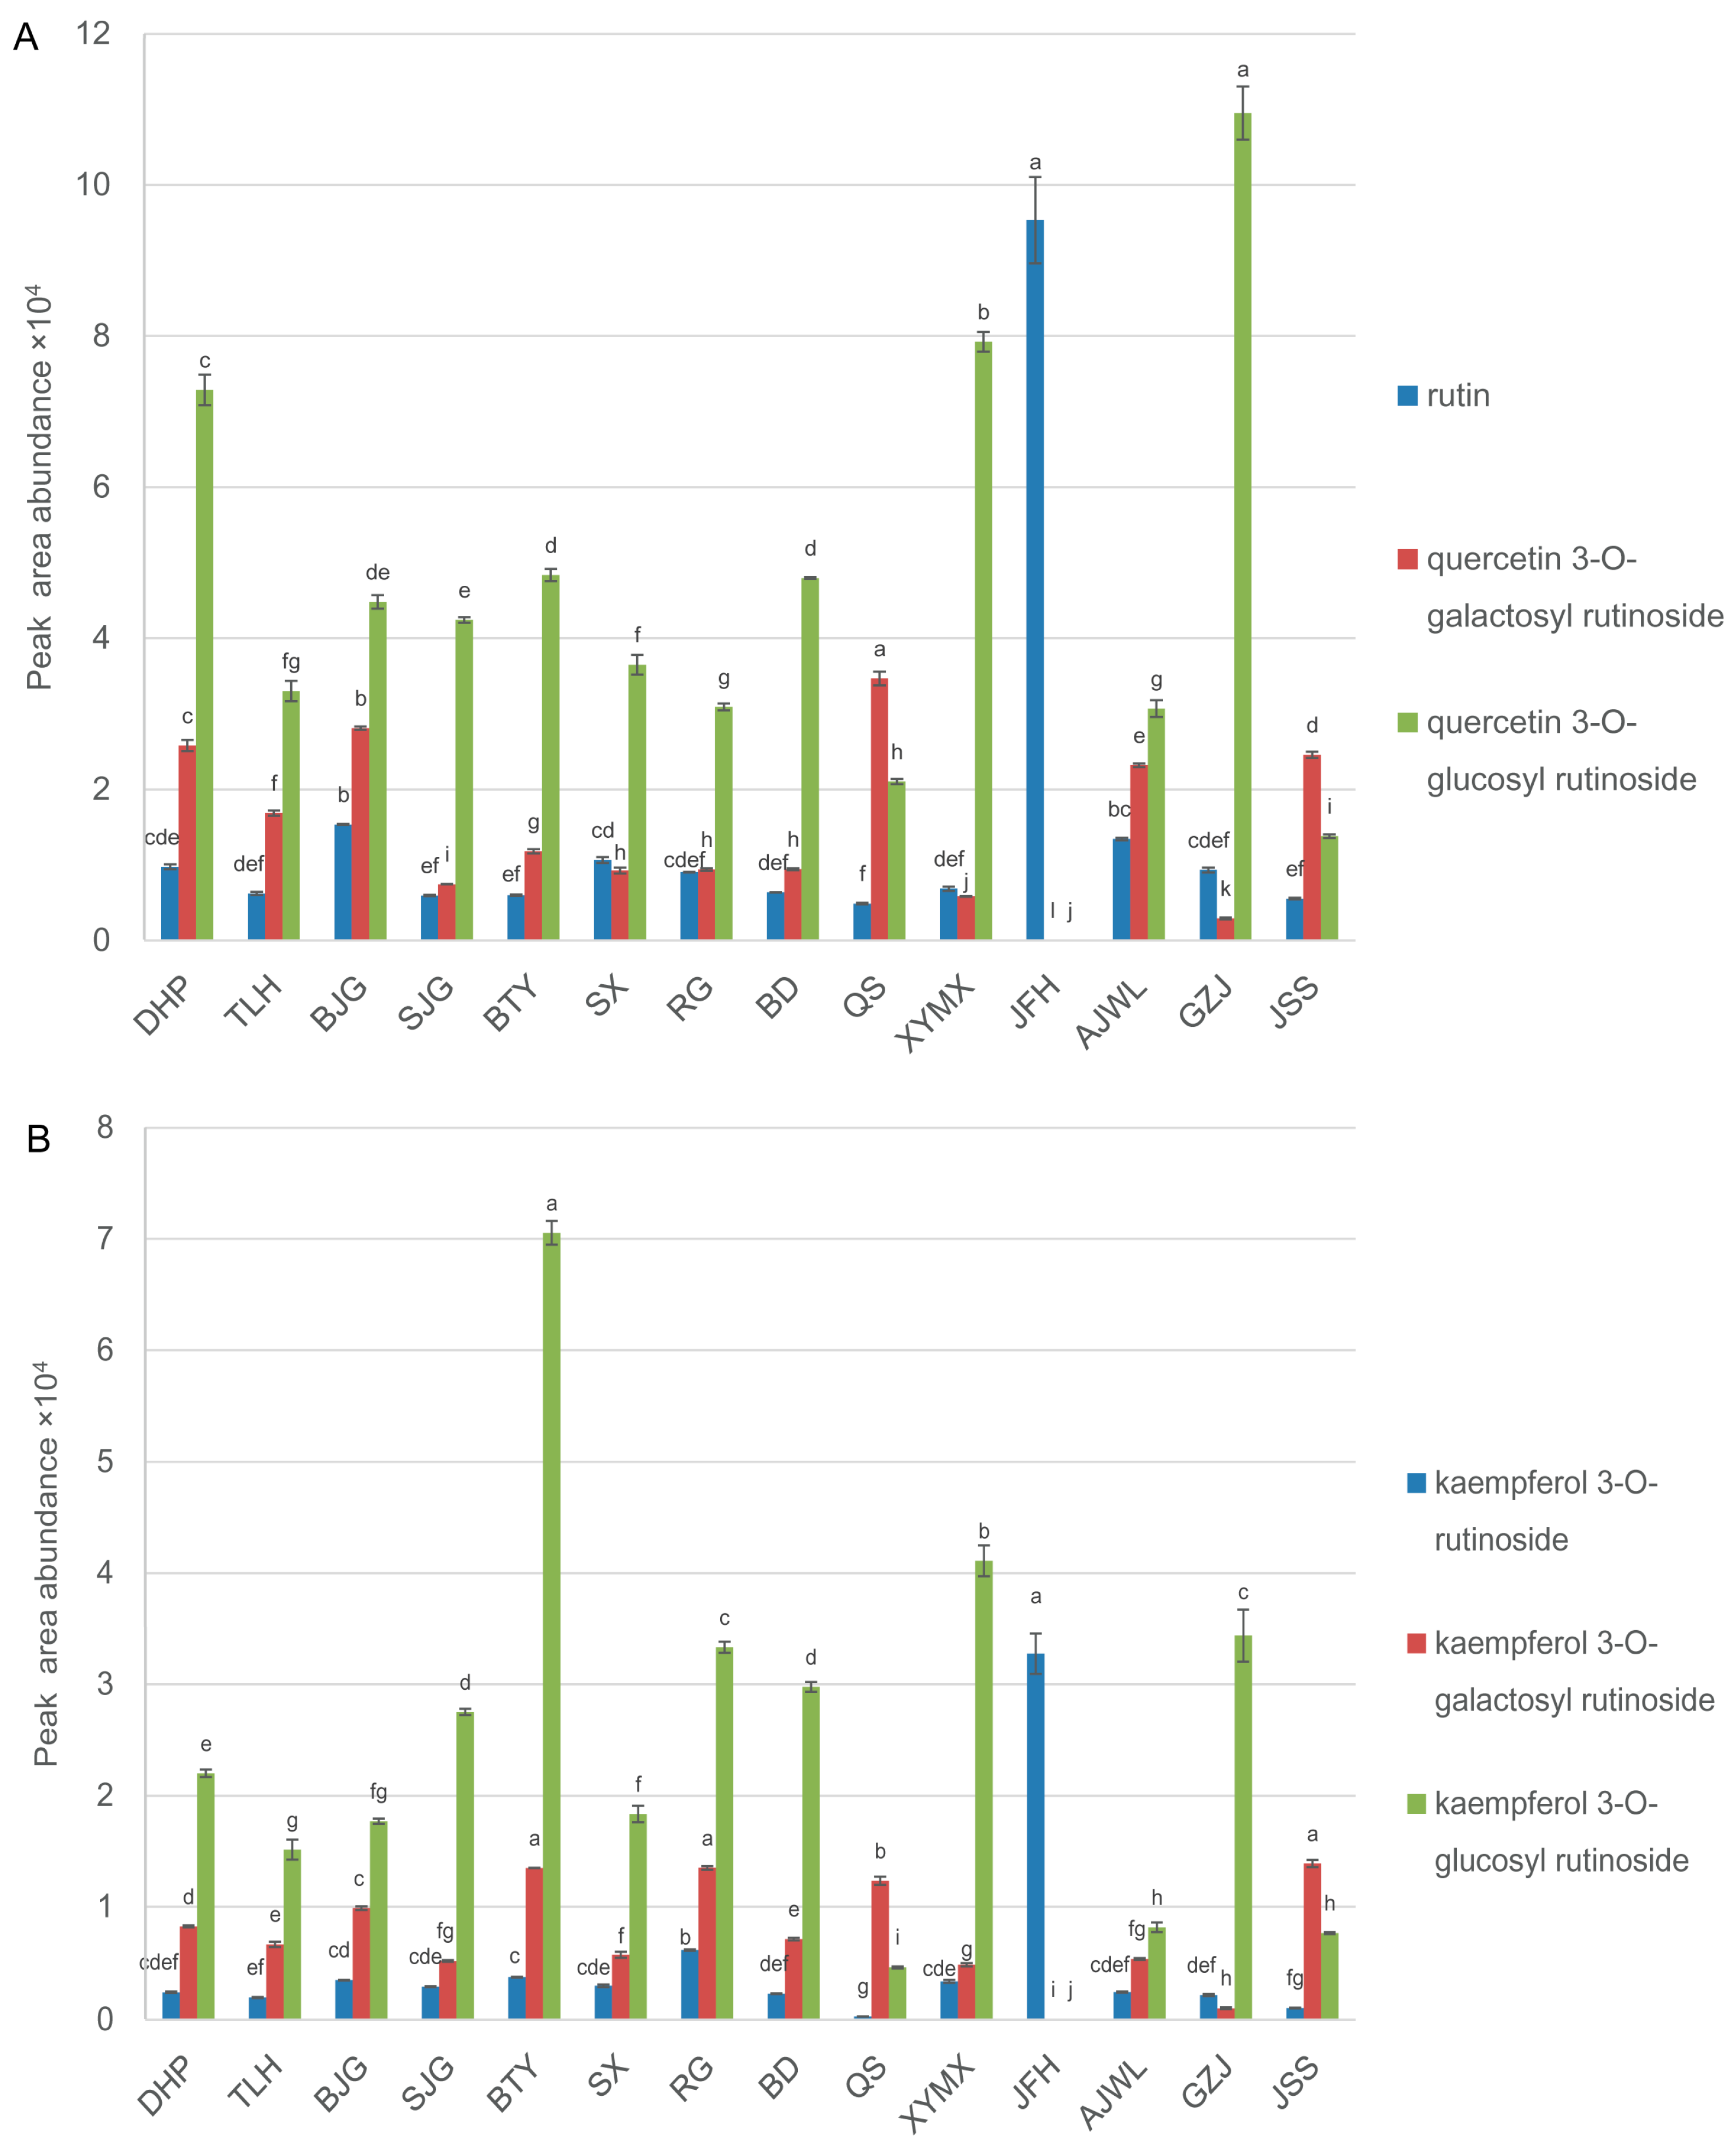
2.3. Cultivar JFH Possessed High Contents of Rutin and Kaempferol Rutinoside

Flavonol glycosides (FOGs) are one of most important phenolic compounds in tea besides catechins. Though less abundant than catechins, they confer velvety and astringent tastes to tea infusions at much lower thresholds and hence are key tea taste determinants [35]. Unambiguous FOG assignments are difficult due to the fact that many authentic standards of FOGs in tea are not commercially available. Moreover, FOGs usually contain several positional isomers. Nevertheless, galactosyl flavonols were reported to elute earlier than glucosyl flavonols [15]. Taking account of the differences in chromatographic retention behaviors, in combined with analyses of MS2 fragmentation patterns and UV absorbance (if available), we tentatively identified 18 FOGs in the current study. These FOGs, most commonly kaempferol and quercetin derivatives, were mainly present in the form of mono-, di-, tri- and tetraglycosides (Table 1). Many FOGs have been previously detected in processed tea products or fresh tea leaves [2,36].
Contents of kaempferol and quercetin glycosides varied widely between tea cultivars (Figure 2). In particular, the rutin (also called quercetin 3-O-rutinoside) content in cultivar JFH (5.40 mg/g) was found to be significantly higher (p < 0.01) than in other cultivars (between 0.18–0.89 mg/g) (Figure 4A and Table 2). Apart from rutin, the highest level of kaempferol 3-O-rutinoside was also detected in cultivar JFH (Figure 4B). In contrast, four flavonol triglycosides, kaempferol 3-O-galactosyl rutinoside, kaempferol 3-O-glucosyl rutinoside, quercetin 3-O-galactosyl-rutinoside and quercetin 3-O-glucosyl rutinoside, were barely detectable in this cultivar (Figure 4A,B). Quercetin 3-O-galactosyl rutinoside and quercetin 3-O-glucosyl rutinoside could be synthesized from rutin by glycosyltransferases. Kaempferol 3-O-galactosyl rutinoside and kaempferol 3-O-glucosyl rutinoside may derive from kaempferol 3-O-rutinoside catalyzed by the same type of enzymes. In cultivar JFH, we speculate that enzyme(s) responsible for glycosylation of flavonol diglycosides are either not functional or expressed at very low levels, accounting for the high accumulations of rutin and kaempferol 3-O-rutinoside. Alternatively, genes which are critical for flavonoid metabolism and catabolism in cultivar JFH may be differentially regulated. Comparing gene expressions in the phenylpropanoid pathway among these cultivars would further shed light on flavonoid biosynthesis in tea. A number of pharmacological properties of rutin, such as anti-inflammation, anti-microbial, anti-tumor and anti-asthma, have been well documented [37]. Therefore, finding tea cultivars with high yields of flavonoids such as rutin could be useful in diversifying the utilization of functional components in tea resources.

2.4. Cultivars BJG, SJG and QS Demonstrated High Levels of Amino Acids in Leaves

Amino acid constituents of tea leaves have a large impact on the taste and aroma properties of processed tea [18]. There exists a positive correlation between the quality of tea and amino acid contents [18]. Theanine, glutamate and serine are key components imparting “umami” or “brothy” taste to tea infusions [19,38]. To compare amino acid profiles between leaves of different cultivars, hydrophilic interaction liquid chromatography (HILIC) tandem mass spectrometry was applied since amino acids are typically not well resolved in C18 columns. In total, 18 amino acids in varying concentrations were detected (Table 2). Theanine, a non-proteinogenic amino acid synthesized from glutamate and ethylamine by theanine synthetase, has been shown in many studies as the most abundant free amino acid in tea plants [20,39,40,41]. As expected, theanine was found to be the most predominant free amino acid in 13 out of 14 cultivars examined, accounting for 42.3–72.3% of total free amino acids in leaves. Other abundant amino acids included glutamate, aspartate and serine (Table 2). In contrast, cultivar BD contained a higher level (p < 0.01) of glutamate (1.2 mg/g) than theanine (0.8 mg/g). Moreover, the total amino acid content (3.11 mg/g) in leaves of cultivar BD was lowest. Cultivars BJG, SJG and QS were characterized by high levels of amino acids (Table 2). Not only containing markedly higher (p < 0.05) amounts of theanine (14.32, 12.08 and 11.63 mg/g for cultivars BJG, SJG and QS, respectively), they also demonstrated high accumulations of other amino acids, suggesting an overall up regulation of amino acid metabolism. For example, glutamate and aspartate were at high levels in both cultivars. The glutamine level in cultivar QS and the arginine level in cultivar BJG were significantly higher (p < 0.01) than other cultivars.
Interestingly, cultivar BJG is a light-sensitive albino tea variety (Figure 1C) [42]. A recent study showed that cultivar BJG exhibited yellow leaf phenotype, and reduced synthesis of chlorophyll and carotenoid under high light intensity but could turn green when transferred to low intensity light [42]. Similar scenarios were described for other albino tea cultivars such as ‘Anji Baicha’, whose albinism is induced by temperature instead of light [43]. Feng and coworkers reported that theanine and glutamate levels in some temperature-sensitive albino tea cultivars were higher than in normal green cultivars [19]. Similar to temperature-sensitive cultivars, cultivar BJG also contained the highest level of theanine and a relatively higher level of glutamate, second only to cultivar QS (Table 2). One possible explanation is that suppressed chlorophyll biosynthesis leads to elevated levels of glutamate, which provides more substrates for theanine synthesis [43].

2.5. Purine Alkaloids Exhibited Variable Levels in Tea Leaves

Purine alkaloids are naturally found in tea. The biosynthesis of purine alkaloids, mainly caffeine and theobromine, has been extensively investigated in tea plants [41,44,45]. The caffeine is the most abundant purine alkaloid in tea leaves, ranging between 1.5–5% [36]. Among the 14 cultivars, the caffeine content in leaves was found to vary between 1.38% (cultivar JFH) and 2.98% (cultivar SJG) (Table 2), consistent with the previous report [36]. Moreover, cultivar SJG also had markedly a higher (p < 0.05) content of theobromine than other cultivars, followed by cultivar BTY (Figure 2). Previous studies suggested that genotypic factors other than environmental factors may have more effects on the caffeine content [46]. Therefore, differences in the abundances of purine alkaloids in the current study may be the result of genetic variations.

3. Materials and Methods

3.1. Chemicals

(−)-Epigallocatechingallate, (−)-epigallocatechin, (−)-catechin, (−)-epicatechingallate, (−)-epicatechin, (−)-gallocatechin, rutin and L-theanine (all with purity≥95%) were obtained from Sigma-Aldrich (St. Louis, MO, USA). (−)-Epigallocatechin3-(3-O-methylgallate) (≥95%) and kaempferol 3-rutinoside (≥98%) were purchased from ChemFaces (Wuhan, China). Caffeine (≥98%) was obtained from Yuanye Biotechnology Inc. (Shanghai, China). Theobromine (≥99%) and kaempferol glucoside (≥98%) were obtained from BioBioPha Co., Ltd. (Kunming, China). Theogallin (≥95%) was kindly provided by Dr. Qingxie Chen of Fujian Agriculture and Forestry University, China. Acetonitrile (MS grade), methanol (HPLC grade) and formic acid (98%) were obtained from Sigma-Aldrich. Deionized water was produced by a Milli-Q water purification system (Millipore, Billerica, MA, USA).

3.2. Tea Samples and Sample Preparation

All tea plants of Camellia sinensis (five-year-old) used in the current study were grown at the same tea germplasm garden and under the same cultivation practice, which was managed by the Wuyi Star Tea Industry Co., Ltd., Wuyishan City, Fujian, China (latitude: 27.71° N, longitude: 118.00° E). The fully expanded second leaves were collected from 14 Wuyi Rock tea cultivars on 9 May 2015. The cultivars included ‘Dahongpao’, ‘Tieluohan’, ‘Baijiguan’, ‘Shuijingui’, ‘Bantianyao’, ‘Shuixian’, ‘Rougui’, ‘Beidou’, ‘Queshe’, ‘Xiaoyemaoxie’, ‘Jinfenghuang’, ‘Aijiaowulong’, ‘Guazijin’ and ‘Jinsuoshi’ (Figure 1). For each cultivar, three biological replicates were collected with each replicate gathered from 7–8 individual tea plants. The excised leaf samples were immediately frozen in liquid nitrogen, brought back to lab and stored at −80 °C until analysis.
Extraction of tea leaves were carried out as previously described with some minor modifications [47]. Briefly, frozen tea leaves were individually ground to fine powders using precooled mortars and pestles. Following lyophilization, 30 mg (± 0.5 mg) of ground samples was weighted and 1.2 mL of 70% (v/v) methanol was added for metabolite extraction. Samples were vortexed, sonicated at 25 °C for 20 min and centrifuged (10 min, 12,000 g). Supernatants were diluted 50-fold with 70% (v/v) methanol, filtered through a 0.22 μm PVDF filter (Millipore) and stored at −20 °C until analyzed. Three biological sample replicates were prepared for each cultivar.

3.3. UPLC-QTOF MS-Based Non-Targeted Metabolite Analysis

Aliquots (1 µL) of above extracts were analyzed on a Waters Acquity UPLC system coupled in tandem to a Waters photodiode array (PDA) detector and a SYNAPT G2-Si HDMS QTOF mass spectrometer (Waters, Manchester, UK). Chromatographic separation was performed on a Waters Acquity UPLC HSS T3 column (2.1 × 100 mm, 1.8 µm) at 40 °C with water containing 0.1% formic acid (phase A) and acetonitrile containing 0.1% formic acid (phase B) for chromatographic elution: 0–2 min (99–93% A), 2–13 min (93–60% A), 13–14 min (60–1% A) and 14–17 min (1–1% A). The flow rate was set at 0.3 mL/min.
Samples were run in both positive and negative ionization modes as separate chromatographic runs. Following settings were applied during LC-MS runs: capillary voltage, 2.0 kV (ESI+) and 2.5 kV (ESI); cone voltage, 40 eV; collision energy, 4 eV; source temperature, 120 °C; desolvation temperature, 500 °C; cone gas flow, 50 L/h; desolvation gas flow, 800 L/h; m/z range, 50–1200 Da. The collision energy ramp for MSe (continuum mode) was set from 10 to 50 eV. LockSpray (leucine encephalin) reference ions with m/z of 556.2771 (for ESI+) or 554.2615 (for ESI) were infused during data acquisition for online calibration. Each triplicate tea sample was analyzed once.
Quality control (QC) samples were prepared by mixing 30 mg of one leaf sample to become a combined sample. QC samples were injected throughout the analytical runs (every five samples) to check the instrument performance. The MassLynx software (version 4.1, Waters, Milford, MA, USA) was used to control all instruments and calculate accurate masses.

3.4. UPLC-QqQ MS-Based Targeted Quantification of Catechins, Rutin, Caffeine and Amino Acids

For quantifications of catechins, rutin, caffeine and amino acids, 2 µL of above extracts, with appropriate dilutions within the range of the calibration curve, were injected on a Waters Acquity UPLC system coupled in tandem to a Waters photodiode array (PDA) detector and a XEVO TQ-S MS triple quadrupole mass spectrometer (Waters, Milford, MA, USA).
To detect catechins, rutin and caffeine, chromatographic separation was achieved on a Waters Acquity UPLC BEH C18 column (2.1 × 100 mm, 1.7 µm) at 40 °C with water containing 0.1% formic acid (phase A) and acetonitrile containing 0.1% formic acid (phase B) for chromatographic elution: 0–12 min (95–83% A), 12–13 min (83–0% A) and 13–16.5 min (0–0% A). The flow rate was set at 0.3 mL/min. Mass spectrometry was performed in the ESI mode for catechins and rutin, and in the ESI+ mode for caffeine with the following settings: capillary voltage: 3.0 kV (ESI+) and 2.0 kV (ESI); desolvation temperature: 400 °C; source temperature: 150 °C; cone gas flow: 150 L/h; desolvation gas flow: 800 L/h. Collision energy and cone voltage were optimized for above compounds with multiple reaction monitoring (MRM) for quantification. Calibration curves generated by injecting increasing concentrations of chemical standards were used to determine the absolute concentrations of catechins, rutin and caffeine.
Amino acids were measured in the same manner except that the chromatographic separation was achieved on a Merck SeQuant ZIC-HILIC column (2.1 × 100 mm, 5 µm) at 40 °C with water containing 5 mM ammonium acetate (phase A) and acetonitrile containing 0.1% formic acid (phase B) for chromatographic elution: 0–13 min (5–41% A), 13–15 min (41–60% A) and 15–20 min (60–5% A). The flow rate was set at 0.4 mL/min. Mass spectrometry was performed in the ESI+ mode using the same setting for caffeine. In all cases, the MassLynx software (version 4.1, Waters, Milford, MA, USA) was used for instrument control and data acquisition. Each triplicate tea sample was analyzed once.

3.5. Data Processing and Statistical Analysis

Resulting chromatograms from UPLC-QTOFMS were processed using Progenesis QI software (version 2.1, Nonlinear Dynamics, New Castle upon Tyne, UK) with default settings for peak picking, normalization (normalized to all compounds), signal integration and initial peak assignments. Only chromatograms between elution time 1–14 min were included in the analysis. The final data set contained 1550 molecular features in the ESI mode and 992 molecular features in the ESI+ mode. For comparing the abundances of molecular features, the data matrix consisting of mass features (including retention time and accurate mass values) and peak area values was exported from Progenesis QI to Excel. The mean peak area abundance values from three biological replicates of the same cultivar were calculated and differences in metabolite signal abundances were compared across cultivars.
The raw 1550 molecular features detected in the ESI mode were filtered to only include single features. After filtering, the remaining 466 molecular features were fed into PCA analysis to observe intrinsic metabolite variance between cultivars; PLS-DA was performed to identify differential metabolites using Progenesis QI extension EZinfo after Pareto scaling. One-way ANOVA was used to measure the significance of metabolites in cultivar discrimination using SPSS (version 13.0, SPSS, Chicago, IL, USA). Significantly different metabolites between samples were selected with variable importance in the projection (VIP) > 1 and a p value < 0.05. Heat map with hierarchical clustering (Pearson’s correlation, average linkage) was generated with MultiExperiment Viewer software (version 4.9.0, J. Craig Venter Institute, La Jolla, CA, USA) to visualize accumulation patterns of annotated major metabolites between sample types. Before analysis, the data were log2 transformed and normalized to the median level of individual compounds, combining data from metabolite analyses by UPLC-QTOF MS and UPLC-QqQ MS. The data matrix used for PCA and PLS-DA analyses was listed in Table S1.

3.6. Metabolite Identification

Annotation obtained from Progenesis QI was used as a starting point for manual peak identification. Metabolites were identified by comparing accurate masses, MS/MS fragmentation patterns and isotope patterns with authentic standards, online metabolite databases of Metlin [21], HMDB [48], MassBank [49], ReSpect [22], KNApSAcK [50] and literature references [2,11,27,28,51]. Each mass spectrum was manually inspected to verify whether software-predicted fragments were derived from a single metabolite. UV spectra (Waters, Milford, MA, USA) were used for identification whenever possible.

4. Conclusions

To the best of our knowledge, this is the first exhaustive study of leaf metabolite profiles of different Wuyi Rock tea cultivars. A combined UPLC-QTOF MS and UPLC-QqQ MS approach coupled with multivariate data analysis revealed fundamental varietal differences in primary and secondary metabolism between cultivars. Those differential metabolites mainly include phenolic compounds (e.g., flavan-3-ols, flavonol glycosides and phenolic acids), alkaloids and amino acids. Major catechins as well as quercetin and kaempferol glycosides were determined as critical for cultivar discrimination. The functional compounds found in leaves of Wuyi Rock tea cultivars as well as the knowledge on the cultivar-specific differences provides insights for their potential applications as dietary supplements or nutraceuticals. For instance, cultivar BTY would be an excellent target for anti-allergic study owing to the production of high levels of methylated catechins. Cultivar JFH may serve as a stable source for rutin and kaempferol rutinoside. Cultivars BJG, SJG and QS could be explored as a prominent source for theanine. The metabolites identified in the current study could potentially be used as chemical markers for tea plant fingerprinting, cultivar identification and tea authentication. It also provides valuable information to tea breeders in selecting breeding materials with desirable traits. On the other hand, chemical constituents of processed tea are influenced by both cultivars and processing techniques. Studies by other research groups have shown that both volatile and non-volatile compounds undergo substantial changes during the manufacture of oolong tea [1,4,52].Therefore, whether and how potential markers uncovered in the current study could be applied for analyzing processed Wuyi Rock tea samples warrants further investigations.

Supplementary Materials

The Supplementary Materials are available online, Figure S1: Distribution of metabolites in the methanol extracts of fresh leaves of 14 Wuyi Rock tea cultivars, Table S1: Filtered and normalized PCA data matrix generated from UPLC-QTOF MS in ESI.

Acknowledgments

This study was financially supported by the Natural Science Foundation of Fujian (2016J01108), the Distinguished Young Scholar Program of Fujian Agriculture and Forestry University (xjq201610) and the startup fund from Fujian Agriculture and Forestry University.

Author Contributions

X.Y. and Z.Y. conceived and directed the research; S.C. and M.L. performed the research; J.L., S.W. and X.W. operated MS instruments; S.C. and M.L. analyzed the data; G.Z., T.W., Q.C. and S.C. collected the samples; X.Y. and S.C. wrote the paper. All authors read and approved the final manuscript.

Conflicts of Interest

The authors declare no conflict of interests.

References

  1. Chen, Y.L.; Duan, J.; Jiang, Y.M.; Shi, J.; Peng, L.; Xue, S.; Kakuda, Y. Production, quality, and biological effects of Oolong tea (Camellia sinensis). Food Rev. Int. 2011, 27, 1–15. [Google Scholar] [CrossRef]
  2. Dou, J.; Lee, V.S.; Tzen, J.T.; Lee, M.R. Identification and comparison of phenolic compounds in the preparation of oolong tea manufactured by semifermentation and drying processes. J. Agric. Food Chem. 2007, 55, 7462–7468. [Google Scholar] [CrossRef] [PubMed]
  3. Xiao, K.B. The taste of tea: Material, embodied knowledge and environmental history in northern Fujian, China. J. Mater. Cult. 2017, 22, 3–18. [Google Scholar] [CrossRef]
  4. Ma, C.H.; Tan, C.; Li, W.L.; Chen, L.B.; Wang, Y.R.; Chen, X. Identification of the different aroma compounds between conventional and freeze dried Wuyi rock Tea (Dangui) using headspace solid phase microextraction. Food Sci. Technol. Res. 2013, 19, 805–811. [Google Scholar] [CrossRef]
  5. Chaturvedula, V.S.P.; Prakash, I. The aroma, taste, color and bioactive constituents of tea. J. Med. Plants Res. 2011, 5, 2110–2124. [Google Scholar]
  6. Ji, H.G.; Lee, Y.R.; Lee, M.S.; Hwang, K.H.; Kim, E.H.; Park, J.S.; Hong, Y.S. Metabolic phenotyping of various tea (Camellia sinensis L.) cultivars and understanding of their intrinsic metabolism. Food Chem. 2017, 233, 321–330. [Google Scholar] [CrossRef] [PubMed]
  7. Zeng, L.; Luo, L.; Li, H.; Liu, R. Phytochemical profiles and antioxidant activity of 27 cultivars of tea. Int. J. Food Sci. Nutr. 2017, 68, 525–537. [Google Scholar] [CrossRef] [PubMed]
  8. Cai, H.H.; Cheng, R.H.; Jin, Y.L.; Ding, S.W.; Chen, Z. Evaluation of oolong teas using 1H and 13C solid-state NMR, sensory analysis, and multivariate statistics. J. Chin. Chem. Soc. 2016, 63, 792–799. [Google Scholar] [CrossRef]
  9. Zhao, F.; Lin, H.T.; Zhang, S.; Lin, Y.F.; Yang, J.F.; Ye, N.X. Simultaneous determination of caffeine and some selected polyphenols in Wuyi Rock tea by high-performance liquid chromatography. J. Agric. Food Chem. 2014, 62, 2772–2781. [Google Scholar] [CrossRef] [PubMed]
  10. Daglia, M.; Antiochia, R.; Sobolev, A.P.; Mannina, L. Untargeted and targeted methodologies in the study of tea (Camellia sinensis L.). Food Res. Int. 2014, 63, 275–289. [Google Scholar] [CrossRef]
  11. Dai, W.D.; Qi, D.D.; Yang, T.; Lv, H.P.; Guo, L.; Zhang, Y.; Zhu, Y.; Peng, Q.H.; Xie, D.C.; Tan, J.F.; et al. Nontargeted analysis using ultraperformance liquid chromatography-quadrupole time-of-flight mass spectrometry uncovers the effects of harvest season on the metabolites and taste quality of tea (Camellia sinensis L.). J. Agric. Food Chem. 2015, 63, 9869–9878. [Google Scholar] [CrossRef] [PubMed]
  12. Liu, J.; Zhang, Q.; Liu, M.; Ma, L.; Shi, Y.; Ruan, J. Metabolomic analyses reveal distinct change of metabolites and quality of green tea during the short duration of a single spring season. J. Agric. Food Chem. 2016, 64, 3302–3309. [Google Scholar] [CrossRef] [PubMed]
  13. Zhang, Q.; Shi, Y.; Ma, L.; Yi, X.; Ruan, J. Metabolomic analysis using ultra-performance liquid chromatography-quadrupole-time of flight mass spectrometry (UPLC-Q-TOF MS) uncovers the effects of light intensity and temperature under shading treatments on the metabolites in tea. PLoS ONE 2014, 9, e112572. [Google Scholar] [CrossRef] [PubMed]
  14. Fraser, K.; Lane, G.A.; Otter, D.E.; Harrison, S.J.; Quek, S.Y.; Hemar, Y.; Rasmussen, S. Non-targeted analysis by LC-MS of major metabolite changes during the oolong tea manufacturing in New Zealand. Food Chem. 2014, 151, 394–403. [Google Scholar] [CrossRef] [PubMed]
  15. Tan, J.; Dai, W.; Lu, M.; Lv, H.; Guo, L.; Zhang, Y.; Zhu, Y.; Peng, Q.; Lin, Z. Study of the dynamic changes in the non-volatile chemical constituents of black tea during fermentation processing by a non-targeted metabolomics approach. Food Res. Int. 2016, 79, 106–113. [Google Scholar] [CrossRef]
  16. Lee, J.-E.; Lee, B.-J.; Chung, J.-O.; Kim, H.-N.; Kim, E.-H.; Jung, S.; Lee, H.; Lee, S.-J.; Hong, Y.-S. Metabolomic unveiling of a diverse range of green tea (Camellia sinensis) metabolites dependent on geography. Food Chem. 2015, 174, 452–459. [Google Scholar] [CrossRef] [PubMed]
  17. Lin, J.; Zhang, P.; Pan, Z.; Xu, H.; Luo, Y.; Wang, X. Discrimination of oolong tea (Camellia sinensis) varieties based on feature extraction and selection from aromatic profiles analysed by HS-SPME/GC-MS. Food Chem. 2013, 141, 259–265. [Google Scholar] [CrossRef] [PubMed]
  18. Alcazar, A.; Ballesteros, O.; Jurado, J.M.; Pablos, F.; Martin, M.J.; Vilches, J.L.; Navalon, A. Differentiation of green, white, black, Oolong, and Pu-erh teas according to their free amino acids content. J. Agric. Food Chem. 2007, 55, 5960–5965. [Google Scholar] [CrossRef] [PubMed]
  19. Feng, L.; Gao, M.J.; Hou, R.Y.; Hu, X.Y.; Zhang, L.; Wan, X.C.; Wei, S. Determination of quality constituents in the young leaves of albino tea cultivars. Food Chem. 2014, 155, 98–104. [Google Scholar] [CrossRef] [PubMed]
  20. Yang, X.R.; Ye, C.X.; Xu, J.K.; Jiang, Y.M. Simultaneous analysis of purine alkaloids and catechins in Camellia sinensis, Camellia ptilophylla and Camellia assamica var. kucha by HPLC. Food Chem. 2007, 100, 1132–1136. [Google Scholar] [CrossRef]
  21. Tautenhahn, R.; Cho, K.; Uritboonthai, W.; Zhu, Z.; Patti, G.J.; Siuzdak, G. An accelerated workflow for untargeted metabolomics using the METLIN database. Nat. Biotechnol. 2012, 30, 826–828. [Google Scholar] [CrossRef] [PubMed]
  22. Sawada, Y.; Nakabayashi, R.; Yamada, Y.; Suzuki, M.; Sato, M.; Sakata, A.; Akiyama, K.; Sakurai, T.; Matsuda, F.; Aoki, T.; et al. RIKEN tandem mass spectral database (ReSpect) for phytochemicals: a plant-specific MS/MS-based data resource and database. Phytochemistry 2012, 82, 38–45. [Google Scholar] [CrossRef] [PubMed]
  23. Jiang, X.; Liu, Y.; Wu, Y.; Tan, H.; Meng, F.; Wang, Y.S.; Li, M.; Zhao, L.; Liu, L.; Qian, Y.; et al. Analysis of accumulation patterns and preliminary study on the condensation mechanism of proanthocyanidins in the tea plant [Camellia sinensis]. Sci. Rep. 2015, 5. [Google Scholar] [CrossRef] [PubMed]
  24. Ferreres, F.; Silva, B.M.; Andrade, P.B.; Seabra, R.M.; Ferreira, M.A. Approach to the study of C-glycosyl flavones by ion trap HPLC-PAD-ESI/MS/MS: application to seeds of quince (Cydonia oblonga). Phytochem. Anal. 2003, 14, 352–359. [Google Scholar] [CrossRef] [PubMed]
  25. Scoparo, C.T.; de Souza, L.M.; Dartora, N.; Sassaki, G.L.; Gorin, P.A.; Iacomini, M. Analysis of Camellia sinensis green and black teas via ultra high performance liquid chromatography assisted by liquid-liquid partition and two-dimensional liquid chromatography (size exclusion x reversed phase). J. Chromatogr. A 2012, 27, 29–37. [Google Scholar] [CrossRef] [PubMed]
  26. Zheng, Y.; Hu, X.; Zhai, Y.; Liu, J.; Wu, G.; Wu, L.; ShenTu, J. Pharmacokinetics and tissue distribution study of camellianin A and its major metabolite in rats by liquid chromatography with tandem mass spectrometry. J. Chromatogr. B 2015, 997, 200–209. [Google Scholar] [CrossRef] [PubMed]
  27. Xie, C.; Xu, L.Z.; Luo, X.Z.; Zhong, Z.; Yang, S.L. Flavonol glycosides from Lysimachia capillipes. J. Asian Nat. Prod. Res. 2002, 4, 17–23. [Google Scholar] [CrossRef] [PubMed]
  28. Hanhineva, K.; Rogachev, I.; Kokko, H.; Mintz-Oron, S.; Venger, I.; Karenlampi, S.; Aharoni, A. Non-targeted analysis of spatial metabolite composition in strawberry (Fragariaxananassa) flowers. Phytochemistry 2008, 69, 2463–2481. [Google Scholar] [CrossRef] [PubMed]
  29. Iijima, T.; Mohri, Y.; Hattori, Y.; Kashima, A.; Kamo, T.; Hirota, M.; Kiyota, H.; Makabe, H. Synthesis of (−)-epicatechin 3-(3-O-methylgallate) and (+)-catechin 3-(3-O-methylgallate), and their anti-inflammatory activity. Chem. Biodivers. 2009, 6, 520–526. [Google Scholar] [CrossRef] [PubMed]
  30. Sano, M.; Suzuki, M.; Miyase, T.; Yoshino, K.; Maeda-Yamamoto, M. Novel antiallergic catechin derivatives isolated from oolong tea. J. Agric. Food Chem. 1999, 47, 1906–1910. [Google Scholar] [CrossRef] [PubMed]
  31. Lv, H.-P.; Yang, T.; Ma, C.-Y.; Wang, C.-P.; Shi, J.; Zhang, Y.; Peng, Q.-H.; Tan, J.-F.; Guo, L.; Lin, Z. Analysis of naturally occurring 3″-Methyl-epigallocatechin gallate in 71 major tea cultivars grown in China and its processing characteristics. J. Funct. Foods 2014, 7, 727–736. [Google Scholar] [CrossRef]
  32. Hashimoto, F.; Nonaka, G.; Nishioka, I. Tannins and related-compounds. XC. 8-C-ascorbyl(-)-epigallocatechin 3-O-gallate and novel dimeric flavan-3-ols, oolonghomobisflavans A and B, from oolong tea. Chem. Pharm. Bull. 1989, 37, 3255–3263. [Google Scholar] [CrossRef]
  33. Hashimoto, F.; Kashiwada, Y.; Nonaka, G.; Nishioka, I.; Nohara, T.; Cosentino, L.M.; Lee, K.H. Evaluation of tea polyphenols as anti-HIV agents. Bioorg. Med. Chem. Lett. 1996, 6, 695–700. [Google Scholar] [CrossRef]
  34. Nakai, M.; Fukui, Y.; Asami, S.; Toyoda-Ono, Y.; Iwashita, T.; Shibata, H.; Mitsunaga, T.; Hashimoto, F.; Kiso, Y. Inhibitory effects of oolong tea polyphenols on pancreatic lipase in vitro. J. Agric. Food Chem. 2005, 53, 4593–4598. [Google Scholar] [CrossRef] [PubMed]
  35. Scharbert, S.; Hofmann, T. Molecular definition of black tea taste by means of quantitative studies, taste reconstitution, and omission experiments. J. Agric. Food Chem. 2005, 53, 5377–5384. [Google Scholar] [CrossRef] [PubMed]
  36. Engelhardt, U.H. Chemistry of Tea. In Reference Module in Chemistry, Molecular Sciences and Chemical Engineering; Elsevier: Braunschweig, Germany, 2013. [Google Scholar]
  37. Gullon, B.; Lu-Chau, T.A.; Moreira, M.T.; Lema, J.M.; Eibes, G. Rutin: A review on extraction, identification and purification methods, biological activities and approaches to enhance its bioavailability. Trends Food Sci. Technol. 2017, 67, 220–235. [Google Scholar] [CrossRef]
  38. Ekborg-Ott, K.H.; Taylor, A.; Armstrong, D.W. Varietal differences in the total and enantiomeric composition of theanine in tea. J. Agric. Food Chem. 1997, 45, 353–363. [Google Scholar] [CrossRef]
  39. Deng, W.-W.; Ogita, S.; Ashihara, H. Biosynthesis of theanine (γ-ethylamino-l-glutamic acid) in seedlings of Camellia sinensis. Phytochem. Lett. 2008, 1, 115–119. [Google Scholar] [CrossRef]
  40. Deng, W.W.; Ogita, S.; Ashihara, H. Distribution and biosynthesis of theanine in Theaceae plants. Plant Physiol. Biochem. 2010, 48, 70–72. [Google Scholar] [CrossRef] [PubMed]
  41. Deng, W.-W.; Ashihara, H. Occurrence and de novo biosynthesis of caffeine and theanine in seedlings of tea (Camellia sinensis). Nat. Prod. Commun. 2015, 10, 703–706. [Google Scholar] [PubMed]
  42. Wu, Q.; Chen, Z.; Sun, W.; Deng, T.; Chen, M. De novo sequencing of the leaf transcriptome reveals complex light-responsive regulatory networks in Camellia sinensis cv. Baijiguan. Front. Plant Sci. 2016, 7, 322. [Google Scholar] [CrossRef] [PubMed]
  43. Li, C.F.; Xu, Y.X.; Ma, J.Q.; Jin, J.Q.; Huang, D.J.; Yao, M.Z.; Ma, C.L.; Chen, L. Biochemical and transcriptomic analyses reveal different metabolite biosynthesis profiles among three color and developmental stages in ‘Anji Baicha’ (Camellia sinensis). BMC Plant Biol. 2016, 16, 195. [Google Scholar] [CrossRef] [PubMed]
  44. Kato, M.; Kitao, N.; Ishida, M.; Morimoto, H.; Irino, F.; Mizuno, K. Expression for caffeine biosynthesis and related enzymes in Camellia sinensis. Z. Naturforsch. C 2010, 65, 245–256. [Google Scholar] [CrossRef] [PubMed]
  45. Xia, E.-H.; Zhang, H.-B.; Sheng, J.; Li, K.; Zhang, Q.-J.; Kim, C.; Zhang, Y.; Liu, Y.; Zhu, T.; Li, W.; et al. The tea tree genome provides insights into tea flavor and independent evolution of caffeine biosynthesis. Mol. Plant 2017, 10, 866–877. [Google Scholar] [CrossRef] [PubMed]
  46. Wei, K.; Wang, L.-Y.; Zhou, J.; He, W.; Zeng, J.-M.; Jiang, Y.-W.; Cheng, H. Comparison of catechins and purine alkaloids in albino and normal green tea cultivars (Camellia sinensis L.) by HPLC. Food Chem. 2012, 130, 720–724. [Google Scholar] [CrossRef]
  47. Li, C.F.; Yao, M.Z.; Ma, C.L.; Ma, J.Q.; Jin, J.Q.; Chen, L. Differential metabolic profiles during the albescent stages of ‘Anji Baicha’ (Camellia sinensis). PLoS ONE 2015, 10. [Google Scholar] [CrossRef] [PubMed]
  48. Wishart, D.S.; Jewison, T.; Guo, A.C.; Wilson, M.; Knox, C.; Liu, Y.; Djoumbou, Y.; Mandal, R.; Aziat, F.; Dong, E.; et al. HMDB 3.0--The Human Metabolome Database in 2013. Nucleic Acids Res. 2013, 41, D801–D807. [Google Scholar] [CrossRef] [PubMed]
  49. Horai, H.; Arita, M.; Kanaya, S.; Nihei, Y.; Ikeda, T.; Suwa, K.; Ojima, Y.; Tanaka, K.; Tanaka, S.; Aoshima, K.; et al. MassBank: A public repository for sharing mass spectral data for life sciences. J. Mass Spectrom. 2010, 45, 703–714. [Google Scholar] [CrossRef] [PubMed]
  50. Afendi, F.M.; Okada, T.; Yamazaki, M.; Hirai-Morita, A.; Nakamura, Y.; Nakamura, K.; Ikeda, S.; Takahashi, H.; Altaf-Ul-Amin, M.; Darusman, L.K.; et al. KNApSAcK family databases: integrated metabolite-plant species databases for multifaceted plant research. Plant Cell Physiol. 2012, 53, e1. [Google Scholar] [CrossRef] [PubMed]
  51. Jiang, H.Y.; Engelhardt, U.H.; Thrane, C.; Maiwald, B.; Stark, J. Determination of flavonol glycosides in green tea, oolong tea and black tea by UHPLC compared to HPLC. Food Chem. 2015, 183, 30–35. [Google Scholar] [CrossRef] [PubMed]
  52. Chen, Y.-J.; Kuo, P.-C.; Yang, M.-L.; Li, F.-Y.; Tzen, J.T.C. Effects of baking and aging on the changes of phenolic and volatile compounds in the preparation of old Tieguanyin oolong teas. Food Res. Int. 2013, 53, 732–743. [Google Scholar] [CrossRef]
Sample Availability: Samples of the compounds are not available.
Figure 1. Leaf phenotypes of 14 Wuyi Rock tea cultivars. (A) ‘Dahongpao’ (DHP); (B) ‘Tieluohan’ (TLH); (C) ‘Baijiguan’ (BJG); (D) ‘Shuijingui’ (SJG); (E) ‘Bantianyao’ (BTY); (F) ‘Shuixian’ (SX); (G) ‘Rougui’ (RG); (H) ‘Beidou’ (BD); (I) ‘Queshe’ (QS); (J) ‘Xiaoyemaoxie’ (XYMX); (K) ‘Jinfenghuang’ (JFH); (L) ‘Aijiaowulong’ (AJWL); (M) ‘Guazijin’ (GZJ); (N) ‘Jinsuoshi’ (JSS).
Molecules 23 00104 g001
Figure 2. Comparisons of metabolite levels in 14 tea cultivars. The analysis is based on the normalized average signal abundance from three biological replicates for each cultivar. Normalized values are shown on a color scale proportional to the content of each metabolite and are expressed as log2 using the MultiExperiment Viewer software (MeV v4.9.0, J. Craig Venter Institute, La Jolla, CA, USA).
Molecules 23 00104 g002
Figure 3. Principal component analysis (PCA) of methanol extracts of tea leaves. (A) Score plot of PCA demonstrating differences in metabolite profiles between leaf samples based on 466 filtered single molecular features detected by UPLC-QTOF MS in ESI. The principal components 1 and 2 explained 36.0% and 17.0% of total variance, respectively. For each cultivar, three biological replicates were prepared, where one replicate was a pool of 7–8 tea leaves. R2X, explained variation; (B) Loading plot of PCA indicating primary differential metabolites.
Molecules 23 00104 g003
Figure 4. Mean peak area abundance values (±SD) of (A) some quercetin glycosides and (B) some kaempferol glycosides in leaves of 14 tea cultivars. Different letters on top of the vertical bars of the graph indicate significant differences among the samples, which were determined by Tukey’s HSD test at p < 0.05.
Molecules 23 00104 g004
Table 1. Metabolites putatively identified in 14 tea cultivars by UPLC-QTOFMS.
Compound#Tentative AssignmentsRT (min)Detected [M − H] (m/z)Theoretical [M − H] (m/z)Mass Error (ppm)FormulaMS/MS FragmentsRef.
Catechins
1GC3.84305.0668 305.0661 0.51C15H14O7219.0660, 179.0348, 167.0347, 139.0397, 125.0242Authentic standard b
2EGC4.93305.0680 305.0661 1.04C15H14O7219.0663, 179.0350, 167.0349, 139.0400, 125.0245Authentic standard b
3C5.36289.0718 289.0712 0.20C15H14O6245.0817, 203.0710, 125.0242Authentic standard b
4EC6.28289.0722 289.0712 2.13C15H14O6245.0820, 203.0711, 123.0450Authentic standard b
5EGCG6.35457.0783 457.0771 2.60C22H18O11305.0662, 169.0143, 125.0244Authentic standard b
68-C-ascorbylepigallocatechin 3-gallate6.65631.0938 631.0935 -0.37C28H24O17479.0821, 316.0218[21]
7EGCG3″Me7.42471.0933 471.0927 0.16C23H20O11305.0667, 287.0560, 183.0300, 161.0243Authentic standard b
8ECG7.86441.0827 441.0822 0.51C22H18O10331.0458, 289.0719, 245.0818, 169.0145, 125.0245Authentic standard b
9ECG3″Me8.92455.0984 455.0978 -0.02C23H20O10289.0717, 183.0298Authentic standard b
10epiafzelechin 3-gallate8.97425.0880 425.0873 0.41C22H18O9273.0765, 255.0661[21]
Proanthocyanidins
11prodelphinidin B 4.11609.1251 609.1244 0.13C30H26O14441.0825, 423.0718, 305.0667, 125.0243[2]
12EC-GC dimer4.80593.1301 593.1295 0.06C30H26O13423.0714, 305.0659, 289.0717[21]
13prodelphinidin B2 (or B4) 3′-O-gallate5.12761.1357 761.1354 -0.27C37H30O18609.1236, 591.1144, 577.1347, 423.0717[2]
14procyanidin dimer (B type)5.68577.1352 577.1346 0.02C30H26O12451.1029, 425.0874, 407.0768, 289.0716[22]
15EGC-ECG dimer6.04745.1409 745.1405 -0.19C37H30O17593.1298, 423.0714, 407.0768, 177.0191[23]
163-galloylprocyanidin B1/3′-galloylprocyanidin B2 6.78729.1458 729.1456 -0.36C37H30O16407.0766, 289.0716[23]
Flavonol/flavone glycosides
17isovitexin glucoside6.08595.1655 a595.1663 a-0.40C27H30O15313.0711[24]
18apigenin 6-C-glucoside 8-C-arabinoside 6.91563.1405 563.1401 -0.22C26H28O14473.1086, 443.0980, 383.0769, 353.0664[24]
19myricetin 3-robinobioside (or 3-neohesperidoside)6.93625.1407 625.1405 -0.44C27H30O17316.0219[21]
20myricetin 3-galactoside7.02479.0829 479.0826 0.36C21H20O13316.0223, 315.0141, 271.0245[25]
21myricetin 3′-glucoside7.12479.0830 479.0826 -0.22C21H20O13316.0224, 315.0146, 271.0245[25]
22quercetin 3-O-galactosyl rutinoside7.21771.1990 771.1984 0.03C33H40O21609.1434, 463.0903, 301.0339, 300.0266[11]
23quercetin 3-O-glucosyl rutinoside7.36771.1991 771.1984 0.23C33H40O21609.1458, 301.0348, 300.0272[11]
24camellianin B7.69579.1704 a579.1714 a-0.75C27H30O14433.1129, 313.0709[26]
25rutin7.70609.1455 609.1456 -0.93C27H30O16300.0274, 299.0195Authentic standard b
26kaempferol-3-O-galactosylrutinoside7.72755.2040 755.2035 -0.05C33H40O20533.1294, 285.0398, 284.0319[2]
27tricetin7.90303.0504a303.0505 a1.56C15H10O7285.0402, 257.0450[21]
28kaempferol-3-O-glucosylrutinoside8.00755.2042 755.2035 0.19C33H40O20593.1511, 285.0403, 284.0325[2]
29quercetin 3-O-glucoside8.02463.0879 463.0877 -0.62C21H20O12300.0274, 299.0195, 243.0297[25]
30kaempferol 3-O-rutinoside8.43593.1511 593.1506 -0.21C27H30O15501.0102, 285.0399, 284.0326Authentic standard b
31kaempferol galactoside8.51447.0929 447.0927 -0.84C21H20O11285.0387, 284.0317
32kaempferol glucoside8.78447.0929 447.0927 -0.76C21H20O11284.0324, 255.0295, 227.0349Authentic standard b
33capilliposide I isomer 19.941065.3052 a1065.3087 a-2.68C48H56O27617.2078, 449.1078, 303.0506[27]
34capilliposide II isomer 110.191049.3113 a1049.3138 a-1.84C48H56O26741.2036, 595.1495, 287.0553[27]
35capilliposide I isomer 210.601065.3061 a1065.3087 a-1.97C48H56O27617.2083, 449.1086, 303.0514[27]
36capilliposide II isomer 210.881049.3114 a1049.3138 a-1.78C48H56O26741.2048, 287.0564[27]
Flavonone glycosides
37eriodictyol 5,3′-di-O-glucoside6.08611.1617 611.1612 -0.10C27H32O16491.1189, 449.1292, 329.0869[21]
38naringenin diglucoside6.16595.1664 595.1663 -0.78C27H32O15577.1552, 475.1243, 433.1348, 381.0827, 313.0923[21]
39eriodictyol 7-O-glucoside6.57449.1086 449.1084 -0.68C21H22O11329.0657, 197.0455[21]
Phenolic acids
40theogallin2.90343.0669 343.0665 0.16C14H16O10191.0560Authentic standard b
413-p-coumaroylquinic acid5.18337.0928 337.0923 -0.25C16H18O8163.0399[2]
424-p-coumaroylquinic acid 6.15337.0924 337.0923 -0.36C16H18O8191.0542, 173.0454, 163.0398,119.0500,111.0441, 93.0343[2]
435-p-coumaroylquinic acid 6.42337.0925 337.0923 -0.08C16H18O8173.0457, 163.0396, 119.0499, 93.0343[2]
Hydrolysable tannins
44monogalloyl glucose2.44331.0668 331.0665 -0.80C13H16O10271.0454, 211.0247, 169.0140, 125.0242[28]
45methyl 6-O-galloyl-β-d-glucose3.67345.0823 345.0822 -1.09C14H18O10285.0611, 225.0401, 183.0296[21]
461,4,6-tri-O-galloyl-β-d-glucose6.64635.0894 635.0884 1.60C27H24O18483.0777, 465.0666, 423.0524, 313.0562, 241.0348, 169.0142, 125.0236[25]
Alkaloids
47theobromine3.80181.0725 a181.0726 a3.53C7H8N4O2138.0671Authentic standard b
48caffeine5.60195.0893 a195.0882 a5.60C8H10N4O2138.0670Authentic standard b
Amino acids
49theanine1.43175.1085 a175.1083 a4.72C7H14N2O3158.0823, 129.1030Authentic standard b
a [M + H]+. b This letter indicates that identification of the compound was confirmed by the authentic standard.
Table 2. Abundance (mg/g DW) of catechins, rutin, caffeine and amino acids in tea leaves in relation to cultivars.
CompoundDHPTLHBJGSJGBTYSXRGBDQSXYMXJFHAJWLGZJJSS
Catechins210.09 ± 12.55 bc201.42 ± 5.35 c155.29 ± 6.42 e199.58 ± 4.77 cd225.73 ± 6.42 ab233.28 ± 4.11 a195.99 ± 8.44 cd210.14 ± 16.03 abc177.60 ± 2.85 de162.51 ± 5.88 e218.92 ± 3.72 abc167.86 ± 4.68 e201.94 ± 9.50 c165.06 ± 6.09 e
EGCG94.67 ± 5.17 d95.07 ± 2.93 d66.93 ± 3.97 f111.71 ± 1.76 bc97.81 ± 2.50 d103.73 ± 1.66 cd81.87 ± 3.43 e116.21 ± 8.70 b96.45 ± 2.08 d69.71 ± 2.25 f128.08 ± 1.63 a71.20 ± 2.23 ef81.60 ± 3.61 e68.27 ± 3.35 f
ECG22.83 ± 1.56 c15.17 ± 0.56 fg18.13 ± 0.93 de13.09 ± 0.32 gh22.83 ± 0.60 c26.51 ± 0.26 b14.91 ± 0.67 fg31.31 ± 2.56 a27.92 ± 0.29 b11.12 ± 0.29 h15.28 ± 0.14 fg16.77 ± 0.32 ef20.80 ± 0.89 bc18.48 ± 0.71 de
EC11.73 ± 0.70 b7.60 ± 0.14 d9.04 ± 0.28 c5.12 ± 0.14 e11.65 ± 0.58 b13.95 ± 0.40 a9.73 ± 0.68 c9.15 ± 0.74 c8.59 ± 0.30 cd7.55 ± 0.20 d5.09 ± 0.17 e11.44 ± 0.21 b12.43 ± 0.39 b11.41 ± 0.28 b
EGC72.83 ± 5.50 abcd71.60 ± 1.42 bcd50.99 ± 1.45 g65.09 ± 2.37 def76.43 ± 2.91 abc81.44 ± 2.20 a80.21 ± 3.28 ab49.92 ± 3.92 g42.48 ± 0.65 g69.68 ± 3.09 cde60.53 ± 2.29 f64.80 ± 1.81 def73.84 ± 3.98 abc61.44 ± 1.89 ef
EGCG3″Me4.81 ± 0.22 c6.48 ± 0.36 b6.89 ± 0.49 b0.03 ± 0.00 f12.05 ± 0.45 a2.62 ± 0.15 e4.49 ± 0.05 c0.03 ± 0.00 f0.05 ± 0.00 f0.03 ± 0.00 f6.89 ± 0.39 b0.13 ± 0.01 f4.77 ± 0.18 c3.38 ± 0.18 d
GC2.48 ± 0.14 d4.80 ± 0.16 b2.45 ± 0.05 d3.84 ± 0.21 c4.00 ± 0.16 c3.81 ± 0.05 c3.81 ± 0.33 c2.75 ± 0.30 d1.44 ± 0.00 e3.81 ± 0.09 c2.67 ± 0.05 d2.69 ± 0.12 d6.75 ± 0.47 a1.55 ± 0.05 e
C0.75 ± 0.05 de0.69 ± 0.12 def0.85 ± 0.05 cd0.69 ± 0.05 def0.96 ± 0.08 c1.23 ± 0.05 b0.96 ± 0.08 c0.77 ± 0.05 cde0.67 ± 0.05 def0.61 ± 0.05 ef0.37 ± 0.05 g0.83 ± 0.05 cd1.76 ± 0.08 a0.53 ± 0.05 fg
Rutin0.68 ± 0.02 bcd0.38 ± 0.01 de0.89 ± 0.12 b0.40 ± 0.04 de0.44 ± 0.02 de0.70 ± 0.07 bcd0.60 ± 0.04 bcd0.50 ± 0.07 cde0.18 ± 0.02 e0.42 ± 0.01 de5.40 ± 0.39 a0.83 ± 0.11 bc0.85 ± 0.08 bc0.23 ± 0.02 e
Caffeine26.00 ± 2.28 b18.35 ± 0.40 de21.81 ± 0.44 cd29.79 ± 1.40 a23.97 ± 1.09 bc25.41 ± 1.11 b20.93 ± 1.38 cd19.28 ± 1.42 de22.93 ± 0.62 bc14.27 ± 1.02 f13.81 ± 0.58 f14.16 ± 0.76 f18.85 ± 1.72 de16.51 ± 0.36 ef
Amino acids4.60 ± 0.32 g6.01 ± 0.36 ef21.07 ± 0.80 a15.83 ± 0.72 c6.68 ± 0.31 ef6.84 ± 0.06 ef5.83 ± 0.22 f3.11 ± 0.15 h18.24 ± 0.41 b4.29 ± 0.39 g4.33 ± 0.17 g5.77 ± 0.35 f8.05 ± 0.23 d7.09 ± 0.19 de
l-Theanine2.61 ± 0.30 ef3.31 ± 0.33 de14.32 ± 0.68 a12.08 ± 0.77 b4.35 ± 0.36 cd3.97 ± 0.05 cd3.63 ± 0.28 de0.80 ± 0.08 g11.63 ± 0.62 b1.81 ± 0.23 fg2.08 ± 0.08 f2.59 ± 0.26 ef4.91 ± 0.30 c4.13 ± 0.18 cd
Glu1.15 ± 0.05 g1.73 ± 0.10 cde2.53 ± 0.10 b2.33 ± 0.11 b1.38 ± 0.07 fg1.82 ± 0.07 cd1.41 ± 0.09 fg1.22 ± 0.05 g3.05 ± 0.16 a1.57 ± 0.08 def1.45 ± 0.08 efg1.76 ± 0.15 cd1.68 ± 0.05 cdef1.93 ± 0.17 c
Asp0.22 ± 0.03 e0.43 ± 0.01 d1.13 ± 0.05 b0.56 ± 0.02 c0.27 ± 0.01 e0.42 ± 0.03 d0.22 ± 0.02 e0.43 ± 0.02 d1.37 ± 0.06 a0.41 ± 0.05 d0.23 ± 0.02 e0.55 ± 0.01 c0.55 ± 0.03 c0.31 ± 0.04 e
Ser0.22 ± 0.01 h0.23 ± 0.03 gh0.39 ± 0.02 c0.35 ± 0.04 cde0.29 ± 0.02 efg0.22 ± 0.02 gh0.24 ± 0.01 gh0.28 ± 0.01 efgh0.58 ± 0.01 a0.24 ± 0.04 gh0.24 ± 0.02 fgh0.37 ± 0.02 cd0.48 ± 0.03 b0.31 ± 0.02 def
Trp0.06 ± 0.00 a0.02 ± 0.00 def0.05 ± 0.00 b0.05 ± 0.00 b0.03 ± 0.00 c0.05 ± 0.00 b0.03 ± 0.00 cde0.02 ± 0.00 fgh0.03 ± 0.00 cd0.01 ± 0.00 h0.01 ± 0.00 gh0.01 ± 0.00 gh0.03 ± 0.00 cd0.02 ± 0.00 efg
Phe0.05 ± 0.00 bc0.04 ± 0.00 bcde0.05 ± 0.00 bc0.04 ± 0.00 def0.03 ± 0.00 efg0.05 ± 0.00 bc0.04 ± 0.00 bcde0.05 ± 0.00 b0.12 ± 0.01 a0.04 ± 0.00 cdef0.03 ± 0.00 g0.03 ± 0.00 fg0.03 ± 0.00 g0.04 ± 0.00 bcd
Gln0.05 ± 0.00 g0.07 ± 0.01 fg0.18 ± 0.01 c0.16 ± 0.02 cd0.10 ± 0.00 ef0.12 ± 0.01 de0.07 ± 0.00 fg0.10 ± 0.01 ef1.19 ± 0.05 a0.07 ± 0.01 fg0.10 ± 0.00 ef0.27 ± 0.01 b0.23 ± 0.01 b0.14 ± 0.00 de
Leu0.04 ± 0.00 b0.02 ± 0.00 ef0.07 ± 0.00 a0.04 ± 0.00 bc0.03 ± 0.00 cd0.02 ± 0.00 efg0.03 ± 0.00 ef0.03 ± 0.00 ef0.03 ± 0.00 de0.02 ± 0.00 i0.03 ± 0.00 de0.02 ± 0.00 hi0.02 ± 0.00 ghi0.02 ± 0.00 fgh
Lys0.04 ± 0.00 b0.02 ± 0.00 defgh0.15 ± 0.01 a0.02 ± 0.00 cd0.02 ± 0.00 de0.02 ± 0.00 defgh0.02 ± 0.00 defg0.02 ± 0.00 def0.03 ± 0.00 bc0.01 ± 0.00 h0.01 ± 0.00 efgh0.01 ± 0.00 fgh0.01 ± 0.00 gh0.02 ± 0.00 de
Tyr0.03 ± 0.00 b0.02 ± 0.00 bc0.02 ± 0.00 cde0.01 ± 0.00 hi0.02 ± 0.00 bcd0.02 ± 0.00 def0.02 ± 0.00 bc0.02 ± 0.00 bcd0.02 ± 0.00 efg0.02 ± 0.00 fg0.03 ± 0.00 a0.02 ± 0.00 gh0.01 ± 0.00 i0.02 ± 0.00 fg
Pro0.02 ± 0.00 cde0.02 ± 0.00 f0.03 ± 0.00 bc0.03 ± 0.00 b0.02 ± 0.00 ef0.03 ± 0.00 bc0.02 ± 0.00 def0.03 ± 0.00 bcd0.03 ± 0.00 a0.02 ± 0.00 g0.03 ± 0.00 bc0.03 ± 0.00 bcd0.03 ± 0.00 bc0.02 ± 0.00 def
Thr0.02 ± 0.00 bcde0.02 ± 0.00 cde0.03 ± 0.00 ab0.03 ± 0.01 abcd0.03 ± 0.01 abcd0.02 ± 0.00 e0.02 ± 0.00 bcde0.02 ± 0.00 de0.04 ± 0.01 a0.03 ± 0.00 abcd0.02 ± 0.00 cde0.03 ± 0.00 abc0.03 ± 0.00 bcde0.03 ± 0.00 abcd
Val0.02 ± 0.00 ab0.01 ± 0.00 fg0.02 ± 0.00 a0.02 ± 0.00 cde0.01 ± 0.00 defg0.02 ± 0.00 bcd0.02 ± 0.00 bc0.02 ± 0.00 ab0.01 ± 0.00 g0.01 ± 0.00 efg0.02 ± 0.00 bcd0.01 ± 0.00 cdef0.01 ± 0.00 efg0.01 ± 0.00 cdef
GABA0.02 ± 0.00 fg0.02 ± 0.00 ef0.11 ± 0.00 a0.05 ± 0.00 b0.03 ± 0.00 cd0.02 ± 0.00 e0.03 ± 0.00 d0.01 ± 0.00 fgh0.01 ± 0.00 i0.01 ± 0.00 hi0.01 ± 0.00 gh0.03 ± 0.00 c0.01 ± 0.00 hi0.03 ± 0.00 d
His0.02 ± 0.00 bc0.01 ± 0.00 d0.06 ± 0.01 a0.01 ± 0.00 cd0.01 ± 0.00 cd0.01 ± 0.00 cd0.01 ± 0.00 d0.01 ± 0.00 d0.02 ± 0.00 b0.01 ± 0.00 d0.01 ± 0.00 d0.01 ± 0.00 dND0.01 ± 0.00 d
Ile0.01 ± 0.00 de0.01 ± 0.00 efg0.03 ± 0.00 a0.01 ± 0.00 fg0.02 ± 0.00 cd0.01 ± 0.00 fg0.01 ± 0.00 fg0.01 ± 0.00 fg0.01 ± 0.00 def0.01 ± 0.00 gh0.02 ± 0.00 bc0.01 ± 0.00 gh0.01 ± 0.00 h0.02 ± 0.00 b
Arg0.01 ± 0.00 b0.02 ± 0.00 b1.73 ± 0.06 a0.03 ± 0.01 b0.01 ± 0.00 b0.01 ± 0.00 b0.01 ± 0.00 b0.02 ± 0.00 b0.03 ± 0.00 bND0.01 ± 0.00 b0.01 ± 0.00 bND0.02 ± 0.00 b
Asn0.01 ± 0.01 b0.01 ± 0.00 b0.16 ± 0.02 a0.02 ± 0.00 b0.01 ± 0.01 b0.01 ± 0.01 b0.01 ± 0.01 b0.01 ± 0.00 b0.03 ± 0.01 b0.01 ± 0.00 b0.01 ± 0.00 b0.01 ± 0.01 b0.01 ± 0.00 b0.01 ± 0.00 b
Results are expressed as mean ± standard deviation (n = 3). Means with different letters in row are significantly different according to Tukey’s HSD test (p < 0.05). ND = non-detectable.

