1. Introduction
Seeds enter an aging process after natural maturity. During this process, the vitality of the seed gradually decreases, which is a common phenomenon during the seed storage period. Seed vigor is an important indicator synthesizing seed germination, seedling rate, seedling growth potential, plant stress resistance and production potential [
1,
2]. For farmers, seeds with low viability will have low germination rates, which will increase their costs. Compared with seeds with low viability, seeds with high vigor which can save time, labor and material resources have obvious advantages [
3]. Thus, an appropriate seed vigor detection method can help farmers engage in agricultural production activities in a better way. For seed companies, the seeds should be dried, processed and stored after harvest. If certain conditions are not suitable for seeds during these processes, it is possible to cause damage to the seeds, therefore, a rapid, non-destructive and high-accuracy method for seed vigor detection is of great help to them too.
The aging process of maize kernels can be influenced by maize varieties and environment factors such as temperature and humidity [
4]. Generally, the natural aging of seeds is a long-duration procedure, which increases the cost of sampling for research purposes. In order to facilitate the research process, artificial accelerated aging tests are applied as a common method to simulate the seed aging procedure in a short time compared with natural aging. Studies have shown that artificial aging tests are an effective method to study seed vigor instead of natural aging. Han et al. identified quantitative trait loci (QTLs) for four maize seed vigor-related traits under artificial aging treatment [
5]. Gelmond et al. applied accelerated aging to obtain six different levels of vigor of sorghum seeds from an identical lot [
6]. Souza et al. also adopted an accelerated aging test during their study of the physiological quality of quinoa seeds under different storage conditions [
7].
Most of the current research methods for seed aging determination are traditional physical and chemical detection methods. Mcdonough et al. studied the effects of accelerated aging on the vigor of maize, sorghum and sorghum powder. They detected both physical and chemical attributes that reveal the vitality of seeds. The density of maize and sorghum physical attribute was tested using a gas comparison pycnometer and tangential abrasive huller. The chemical attribute content of soluble protein in aged maize and sorghum was detected by gel chromatography with reagents [
8]. Among all the seed vigor test methods, the standard germination test is the most widely used method for seed vigor detection, but it needs a complete sprouting procedure with the manual measurement of shoot length, root length and germination, which will take a long time. The disadvantages of traditional physical and chemical methods lies in that they are destructive, inefficient, time-consuming and usually involve complex operating procedures, thus a rapid, non-destructive method is needed for seed vigor detection.
Hyperspectral imaging technology is a new non-destructive test method which combines imaging information and spectral information [
9,
10,
11,
12,
13]. Hyperspectral imaging can obtain the chemical information of heterogeneous samples and the spatial distribution of chemical components [
14,
15,
16,
17,
18,
19,
20]. The hyperspectral imaging can be used to study the quality of seeds. Wei et al. used a visible/near-infrared hyperspectral imaging technique to detect the spatial distribution of aflatoxin B1 in kernels [
21]. Wang et al. used hyperspectral imaging to predict the texture of maize seeds after different storage periods. The established quadrature signal correction-continuous new algorithm-piece partial least squares regression model (OSC-SPA-PLSR) had good prediction results of corn hardness and elasticity [
22]. Williams et al. used near infrared (NIR) hyperspectral imaging to distinguish hard, intermediate and soft maize kernels from inbred lines. They used a Spectral Dimensions MatrixNIR camera and a short wave infrared (SWIR) hyperspectral imaging system to acquire the images of whole maize kernels. The authors used principal component analysis (PCA) to remove background, bad pixels, shading and found histological classes including glassy (hard) and floury (soft) endosperm on the cleaned images. They used PCA to discriminate endosperm from different kinds of maize kernels. Then PLS-DA was applied in classifying two kinds of maize. The result verified the effectiveness of the proposed method [
10].
Hyperspectral imaging technology can also be used to detect the changes in seeds which underwent artificial accelerated aging test. Mcgoverin et al. investigated the viability of barley, wheat and sorghum grains using NIR hyperspectral imaging [
11]. Nansen et al. adopted hyperspectral imaging to detect the germination rate of two native Australian tree species. During the process, hyperspectral images were acquired of individual seeds after 0, 1, 2, 5, 10, 20, 30 and 50 days of standard accelerated aging, and they found the loss of germination was associated with a significant change in seed coat spectral reflectance profiles [
12]. Kandpal et al. predicted the viability of muskmelon seeds using NIR hyperspectral imaging system. After image collection, all seeds underwent a germination test to confirm their viability and vigor. The muskmelon seeds used in the study were vacuum-packed in plastic bags and stored in 45 °C hot water to age for 2, 4 and 6 days, while another set of seeds did not undergo artificial aging and were kept as the control (0 h). They found the spectral reflectance intensity decreases when there was an increment of seed viability, and this could reveal the changes in the chemical components in the seed as the artificial aging time increasing [
13].
The main objective of this study was to explore the feasibility of using hyperspectral imaging to identify maize kernels vigor undergoing different accelerated aging time. The specific objectives were to: (1) conduct qualitative analysis of differences among maize kernels under different aging time by PCA; (2) build classification models and select optimal wavelengths to identify maize kernels undergoing different accelerated aging time; and (3) validate the results of hyperspectral imaging by standard germination tests.
3. Materials and Methods
3.1. Sample Preparation
Two varieties of maize kernels cultivated by a commercial seed company (Jiudingjiusheng Seed Industrial Co., Ltd., Beijing, China) with breed numbers of 106101 and 7879 (in this work the names Maize 1 and Maize 2 were used to refer to maize varieties 106101 and 7879, respectively) instead of their original chemical names, complying with the company rules. The two varieties of maize were sown and harvested in the same experimental field simultaneously in 2016. For each variety, 4800 maize kernels were prepared for artificial accelerated aging. Before accelerating aging treatment, maize kernels were disinfected with 1% hypochlorous acid (HClO) solution for 20 min and then the maize kernels were naturally dried after being rinsed with distilled water. The 4800 maize kernels of each variety were randomly divided into eight categories (600 kernels in each category). One category was selected as control group (0 h) placed at room temperature (20 °C, 60% relative humidity) and the other 7 categorizes were used to conduct aging process under different aging time (12, 24, 36, 48, 72, 96 and 120 h). Then the maize kernels were aged in LH-150S artificial aging box (Ansheng Instrument Ltd., Zhengzhou, Henan, China) with temperature of 45 °C and relative humidity of 99%. After accelerated aging treatment, maize kernels were disinfected, rinsed with distilled water, naturally air-dried, and stored in Kraft paper bags. After the acquisition of hyperspectral images, maize kernels of each category were divided into 30 samples (20 kernels in each sample) for standard germination analysis.
3.2. Hyperspectral Imaging System
The experiment was carried out using a hyperspectral imaging system with the spectral range of 874–1734 nm, the spectral resolution of 5 nm and the spatial resolution of 320 × 256 pixels. The system consisted of an ImSpector N17E imaging spectrograph (Spectral Imaging Ltd., Oulu, Finland), a Xeva 992 camera (Xenics Infrared Solutions, Leuven, Belgium) equipped with an OLES22 lens (Spectral Imaging Ltd., Oulu, Finland), two 150 W tungsten halogen lamps (2900 Lightsource, Illumination Technologies Inc., Elbridge, NY, USA) that were symmetrically placed and served as the light source and a conveyer belt (Isuzu Optics Corp., Taiwan, China). The imaging system was controlled by the software (Xenics N17E, Isuzu Optics Corp.), which can be used to calibrated and analyze the images as well.
3.3. Hyperspectral Image Acquisition and Calibration
The maize kernels were placed on a black plate with a very low reflectivity, so it is easy to isolate maize kernels from the background. During the experiment, the exposure time of the camera was 3500 μs. The distance between the lens and the plate was adjusted to 17.9 cm, and the moving speed of the conveyer belt was set to 13.8 mm/s. The above adjustments were aimed at obtaining a clear image without distortion.
Two reference standards were used to calibrate the raw images (
Iraw). The dark reference image (
Idark) was acquired by covering the lens with lens cap whose reflectivity is about 0%. The white reference image (
Iwhite) was collected from a piece of pure white Teflon board whose reflectivity is about 100%. The calibrated image (
Ic) could be calculated as Equation (1):
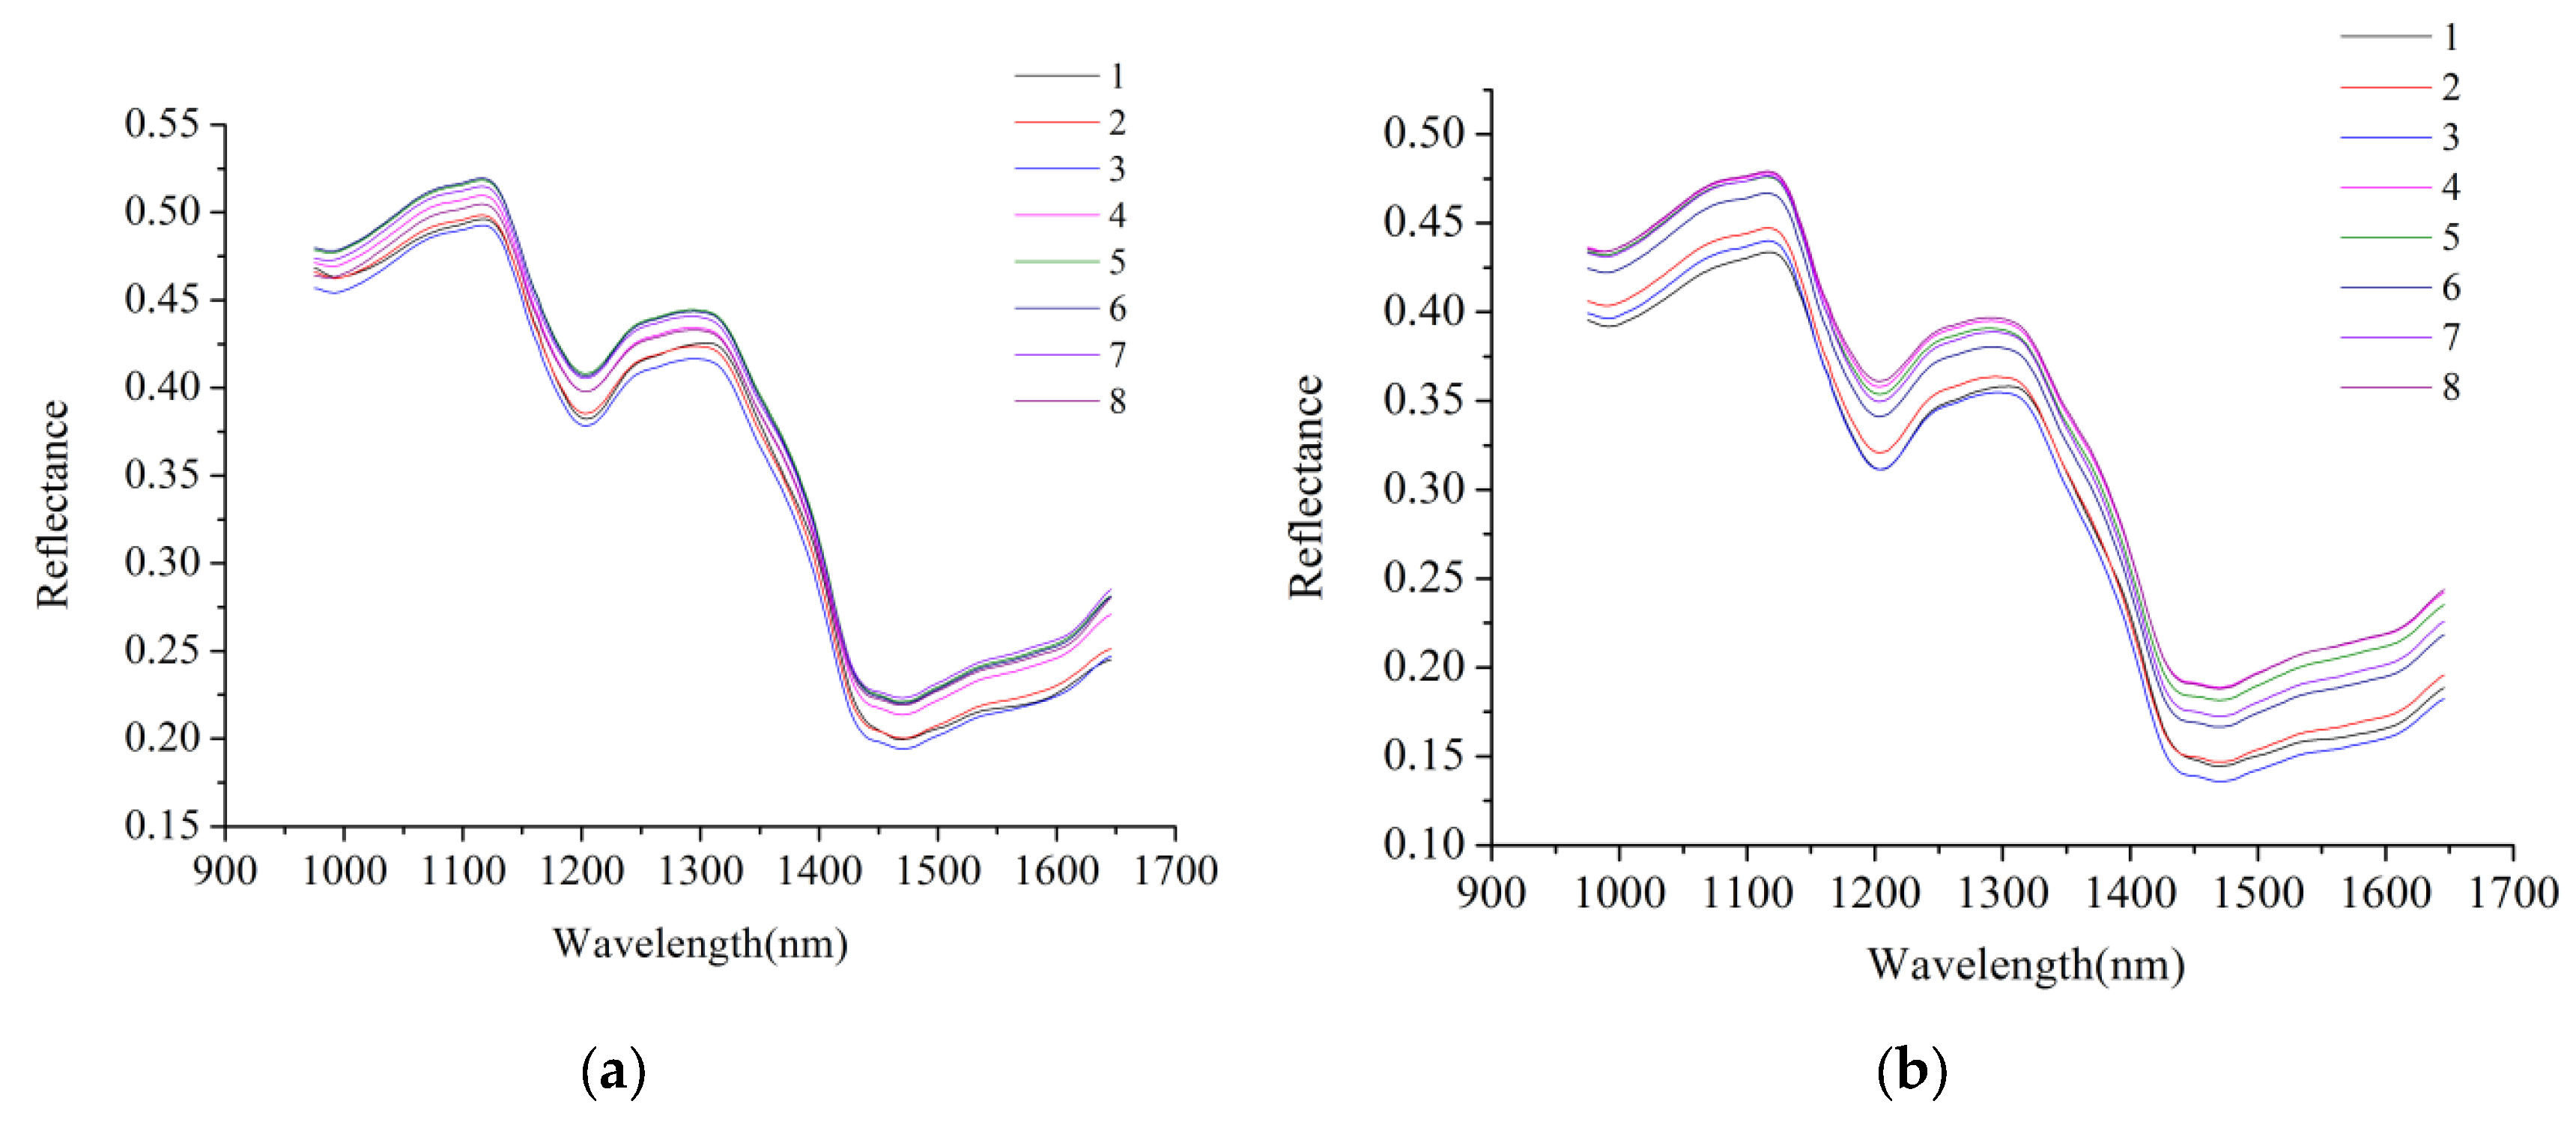
3.4. Spectral Reflectance Extraction and Preprocessing
After image calibration, the spectral reflectance of each maize kernel was extracted from the hyperspectral images. Hyperspectral imaging provides spectral reflectance data and grayscale images at each wavelength. Prior to image processing, the maize kernels were separated from the background by using a mask 14, 26, 27. In this study, the mask was built by conducting image binaryzation on the gray-scale image at 1116 nm to set maize kernel area as 1 and the background as 0. The maize kernels were then isolated from background by applying the mask to the gray-scale images at each wavelength. Then, calibrated hyperspectral images were pre-processed to minimize noise 11, 28, 29. The original pixel-wise spectra were denoised by the wavelet transformation with decomposition level 3 using Daubechies 8 (db8) as the wavelet basis function. Then, the pixel-wise spectra of all pixels within a maize kernel were averaged as one spectrum.
3.5. Standard Germination Tests
Standard germination tests for Maize 1 and Maize 2 were conducted on ten kernels of each sample after acquiring hyperspectral images. For each sample, 10 maize kernels were picked randomly for germination tests. To obtain the vigor of maize kernels, the standard germination tests were performed according to the guidelines of the International Seed Testing Association (ISTA)30. Maize kernels were placed in round holes of sponges, and sponges were placed in seedling basins with enough water. Then all the seedling basins were stored in germination cabinet at 25 °C with 99% relative humidity for 10 days. According to ISTA standards, seeds with 1 cm germ after germination were considered to be seeds with viability. After germination, the germination percentage, shoot length and root length were calculated and measured manually.
3.6. Data analysis Methods
3.6.1. Principal Component Analysis
Principal component analysis (PCA) is a multivariate statistical method that studies the correlation between multiple variables. It examines how a few principal components can be used to reveal the internal relationship between multiple variables. PCA derives principal components from the original variables, and the first few principal components (PCs) contained most of the useful information. The PCs are linear combinations of original variables, and they are orthotropic and irrelevant to each other. The scores of the first few PCs can be used to explore the differences between samples [
24,
25,
26].
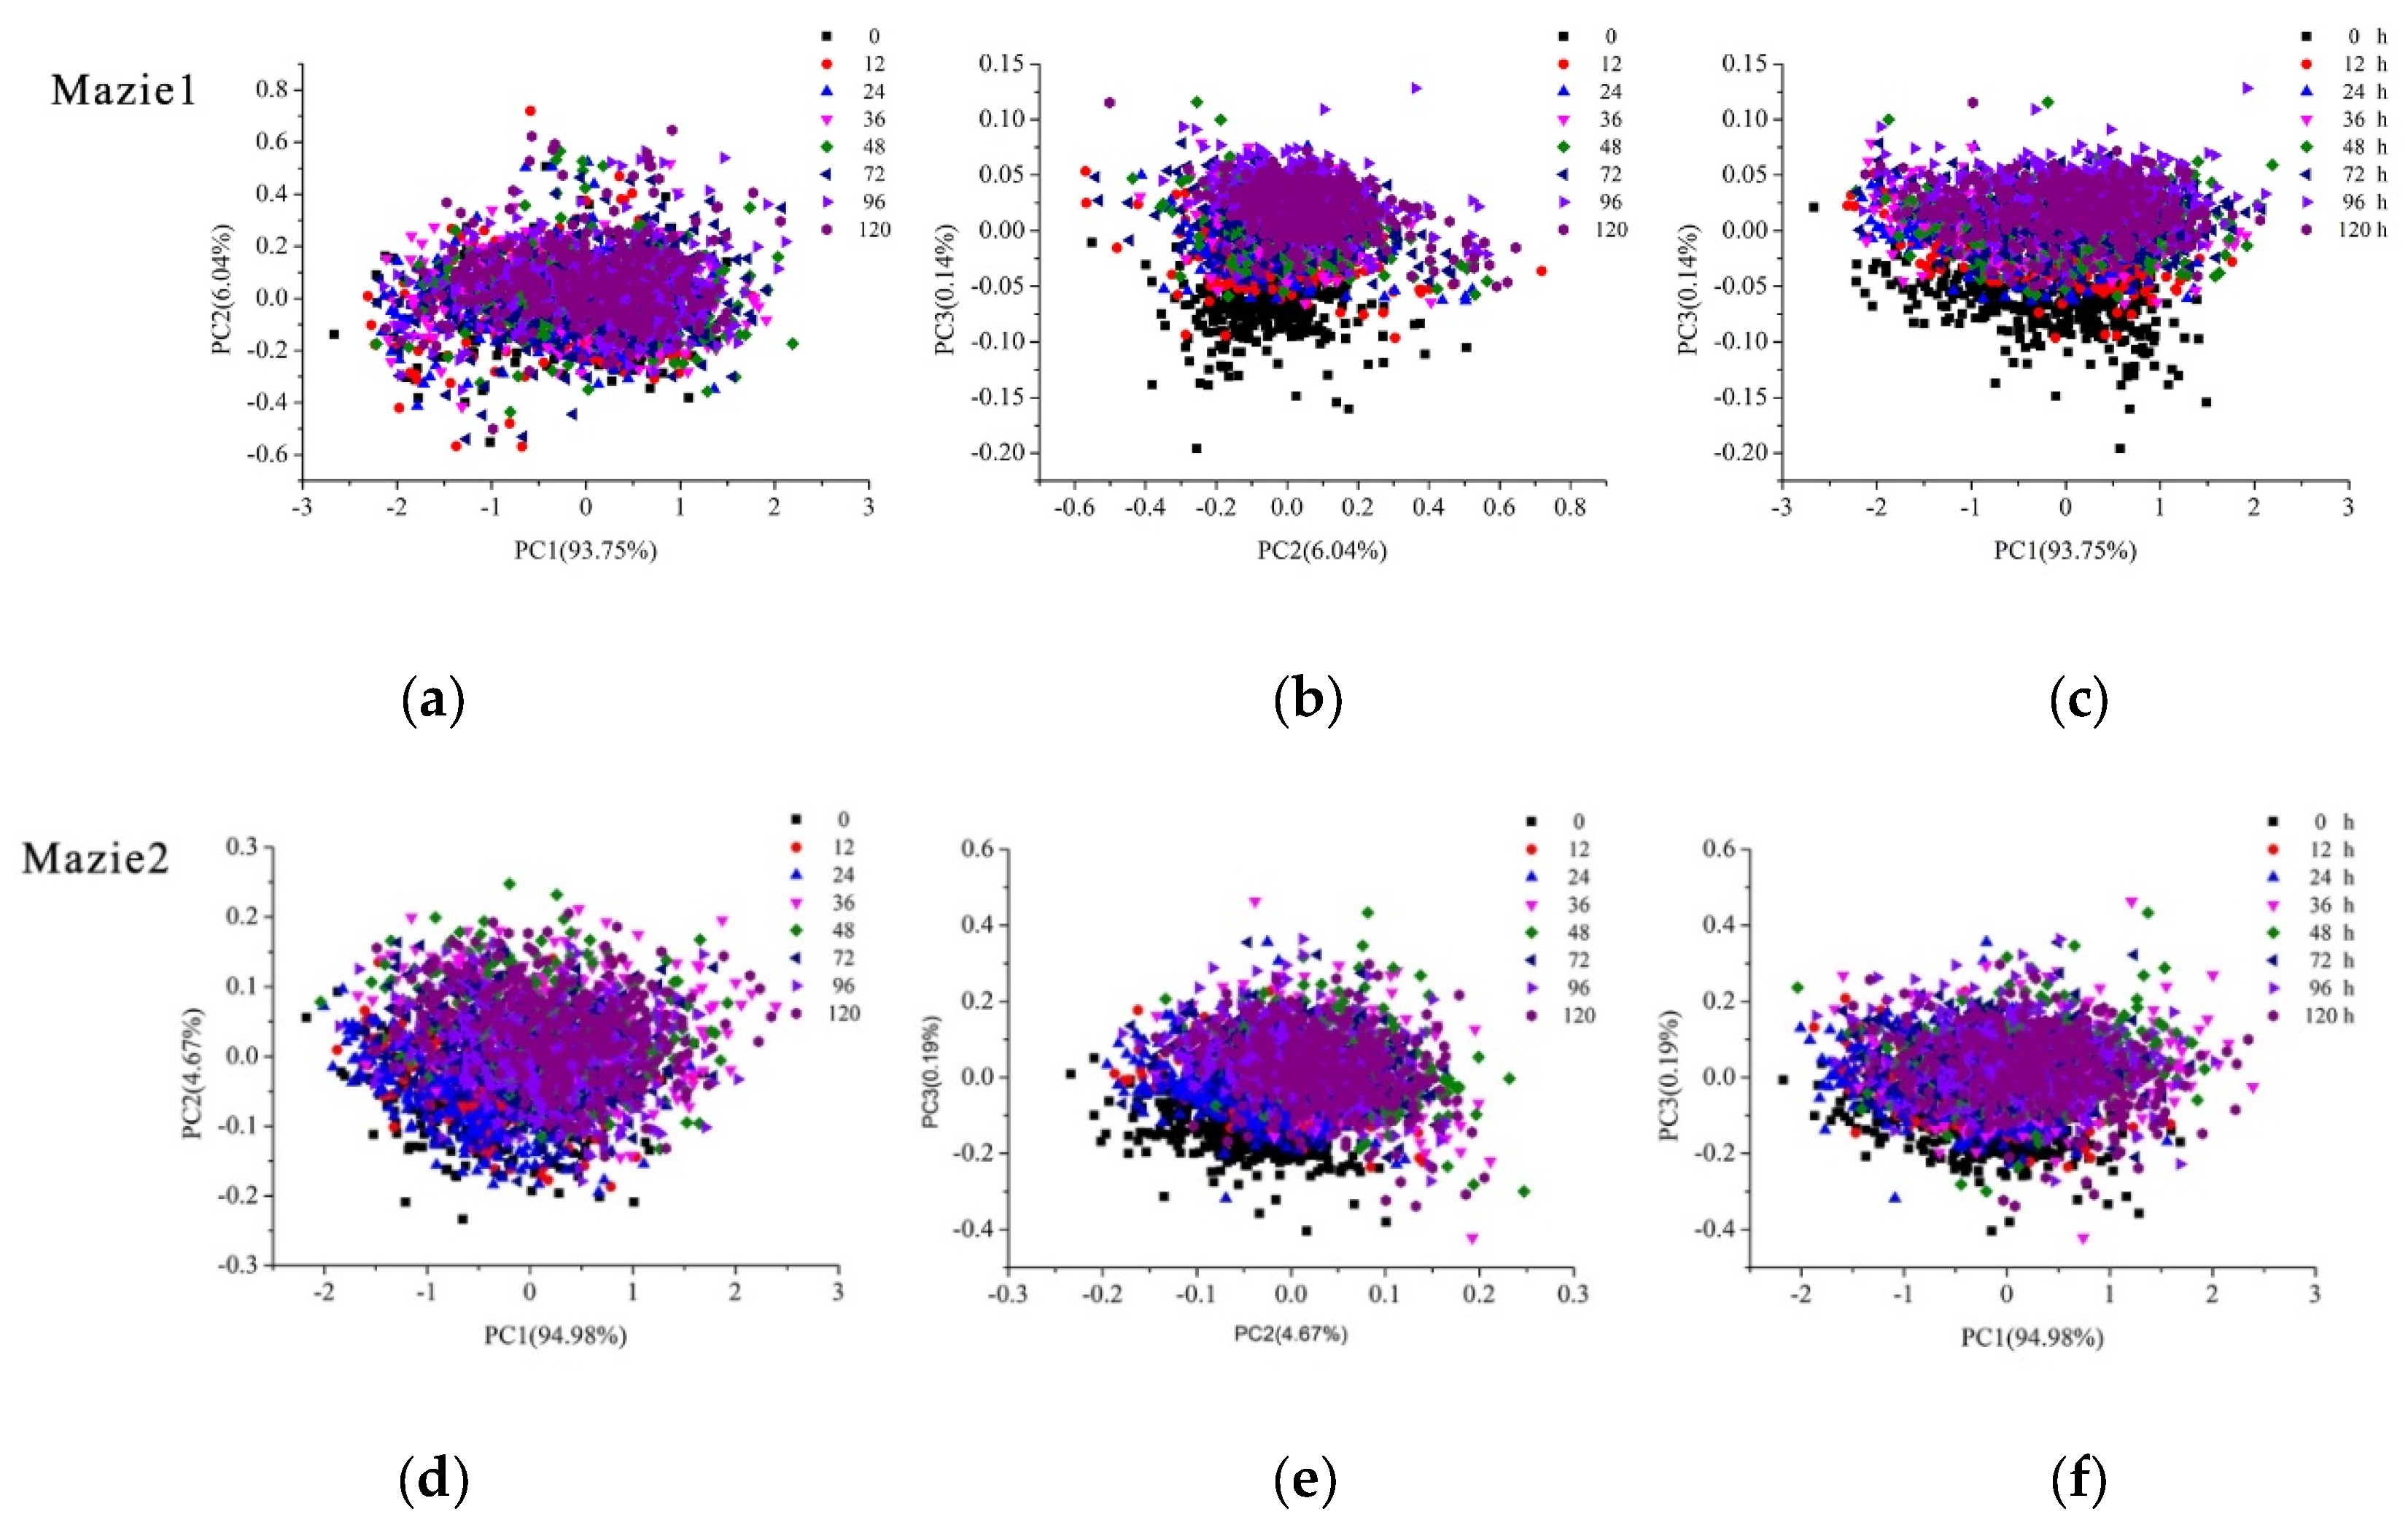
For hyperspectral images, there are two approaches to conduct PCA analysis, pixel-wise analysis and objective-wise analysis [
15]. Pixel-wise analysis is to form PCA scores visualization image. For this method, PCA is calculated on individual pixels of the images. Scores of each pixel within the hyperspectral image of each PC can be obtained to form a scores visualization image. The differences between samples can be visually observed and explored in colormaps for each PC.
Object-wise analysis is to form PCA scores scatter plots. For this method, average spectra of the depicted objects are used instead of individual pixels. The scores of different PCs of samples are scattered in a two-dimensional space or a three-dimensional space. The differences among samples can be explored more clearly in these spaces [
15,
27].
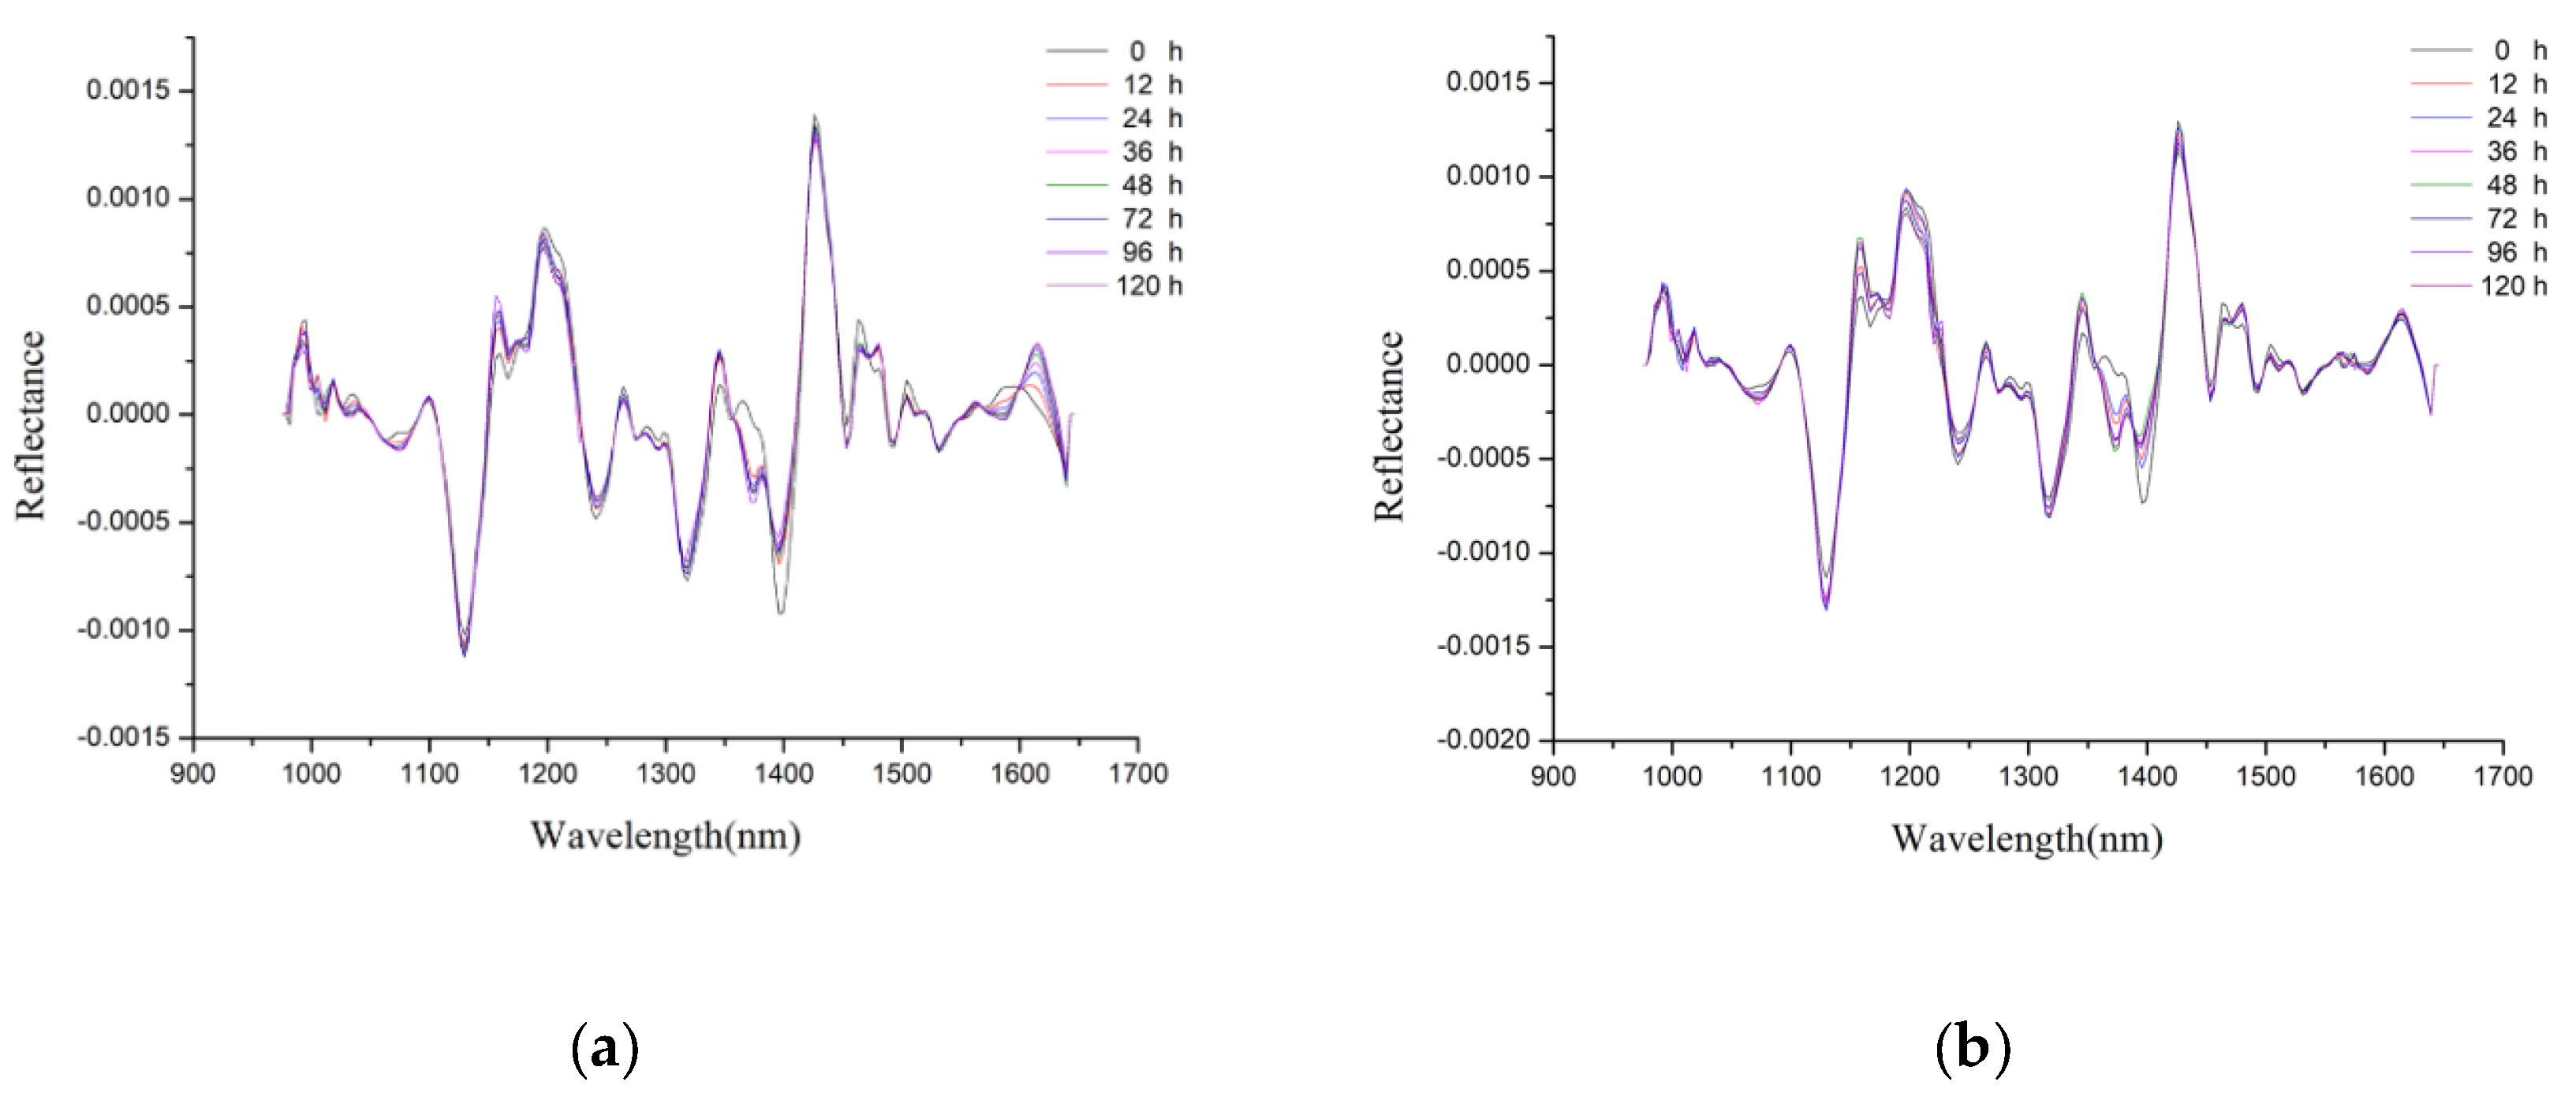
3.6.2. Optimal Wavelength Selection
The spectral data obtained by hyperspectral images usually have a large data volume and contain a lot of useless information like redundant and collinear information. The existence of useless information will increase the data processing burden, which is likely to casue instability of the model and thus result in a poor performance. Meanwhile, processing of a large amount of data places a high burden on computer hardware and increases the calculation time. Thus, it is necessary to select optimal wavelengths to reduce the inputs, which can simplify the model and improve the model performance. The second derivative is an efficient preprocessing method in spectral data analysis. It can eliminate the interference of other backgrounds, improve the spectral resolution and highlight useful information in the spectra. Differences in peaks and valleys of spectra preprocessed by second-order derivative indicate the physical and chemical changes of the samples, which has been used as an efficient method to identify optimal wavelengths [
28,
29]. Peaks and valleys with large differences in second-order derivative spectra can be selected as the optimal wavelengths.
3.6.3. Discriminant Model
Support vector machine (SVM) is a supervised machine learning model used for classification and regression. The main idea of SVM is to create a hyperplane as a decision surface, which maximizes the margins of isolation between different samples. SVM could deal with both linear and nonlinear data efficiently with its good generalization ability. Kernel function is important for conducting SVM, and radial basis function (RBF) is a widely used kernel function. The parameters for SVM models should be determined, including the regularization parameter c and kernel function parameter g. The former determines the tradeoff between minimizing the training error and minimizing model complexity, and the latter defines the non-linear mapping from input space to some high dimensional feature space. The search range for c and g ranged from 2
−8 to 2
8 in this study. The optimal combination of c and g was determined by the SVM model with the highest classification accuracy. Grid-search was applied to optimize the two parameters for SVM in this study [
30,
31,
32].
3.6.4. Significance Test
Duncan’s multiple range tests were applied to calculate for comparison of maize vitality index (germination, shoot and root length) at different accelerated aging duration time at a significance level of 0.05 [
33].
4. Conclusions
Hyperspectral imaging technology combined with SVM models was used to identify the vigor of maize kernels after different aging times. The results of SVM models based on optimal wavelengths were about 10% lower than that of models based on full spectra. However, it was meaningful to conduct optimal wavelengths selection because of the obvious improvement in modeling speed. Confusion matrixes for maize kernels of each category were built for both SVM models using full spectra and optimal wavelengths to reveal the detail of classification results of maize kernels processed under different aging duration. From the results of confusion matrixes, 8 categories of maize kernels could be divided into three groups. Group 1 contained unprocessed maize kernels, Group 2 contained maize kernels aged for 12 and 24 h and Group 3 contained maize kernels with longer aging times (36, 48, 72, 96, 120 h). Maize kernels aged for different durations within one group were more likely to be misclassified with each other. Maize kernels within different groups had fewer misclassified samples. To verify the results of SVM models, traditional seed vigor testing method, standard germination test was conducted. The results of standard germination tests were generally consistent with those of SVM models. Maize kernels belonging to Group 1 (0 h) and Group 2 (12 h and 24 h) had significant differences for root length and shoot length. Maize kernels belonging to Group 3 (36 h, 48 h, 72 h, 96 h and 120 h) had no significant differences with each other comprehensively considering germination rate, root length and shoot length.
The results of this research demonstrate that it is feasible to detect maize kernel vigor with a hyperspectral imaging system combined with SVM models and the second-order derivative spectra could be used to select optimal wavelengths which do great help in shortening modeling time. Thus, as a rapid, non-destructive method, hyperspectral imaging system has great potential for application in seed vigor detection. To improve model performances, different varieties of maize kernels from different crop years, growth locations and storage conditions will be take into consideration to extend the database in the future researches. Variety specific models and non-variety specific models will also be explored for real-world application.


