2.1. Catalyst Support
Since the catalyst support has an important influence on the catalytic performance, the effect of different supports was investigated. Many oxides can be used as the support, among which Al
2O
3 and SiO
2 are the most widely used. The characterization result of the specific surface area and pore structure of the Al
2O
3, SiO
2 and Ni/Al
2O
3, Ni/SiO
2 used are shown in
Table 1. The evaluation result in
Table 2 showed the Ni/SiO
2 was better than Ni/Al
2O
3 in terms of the selectivity of primary amines and condensation byproducts.
Using the bifunctional mechanism [
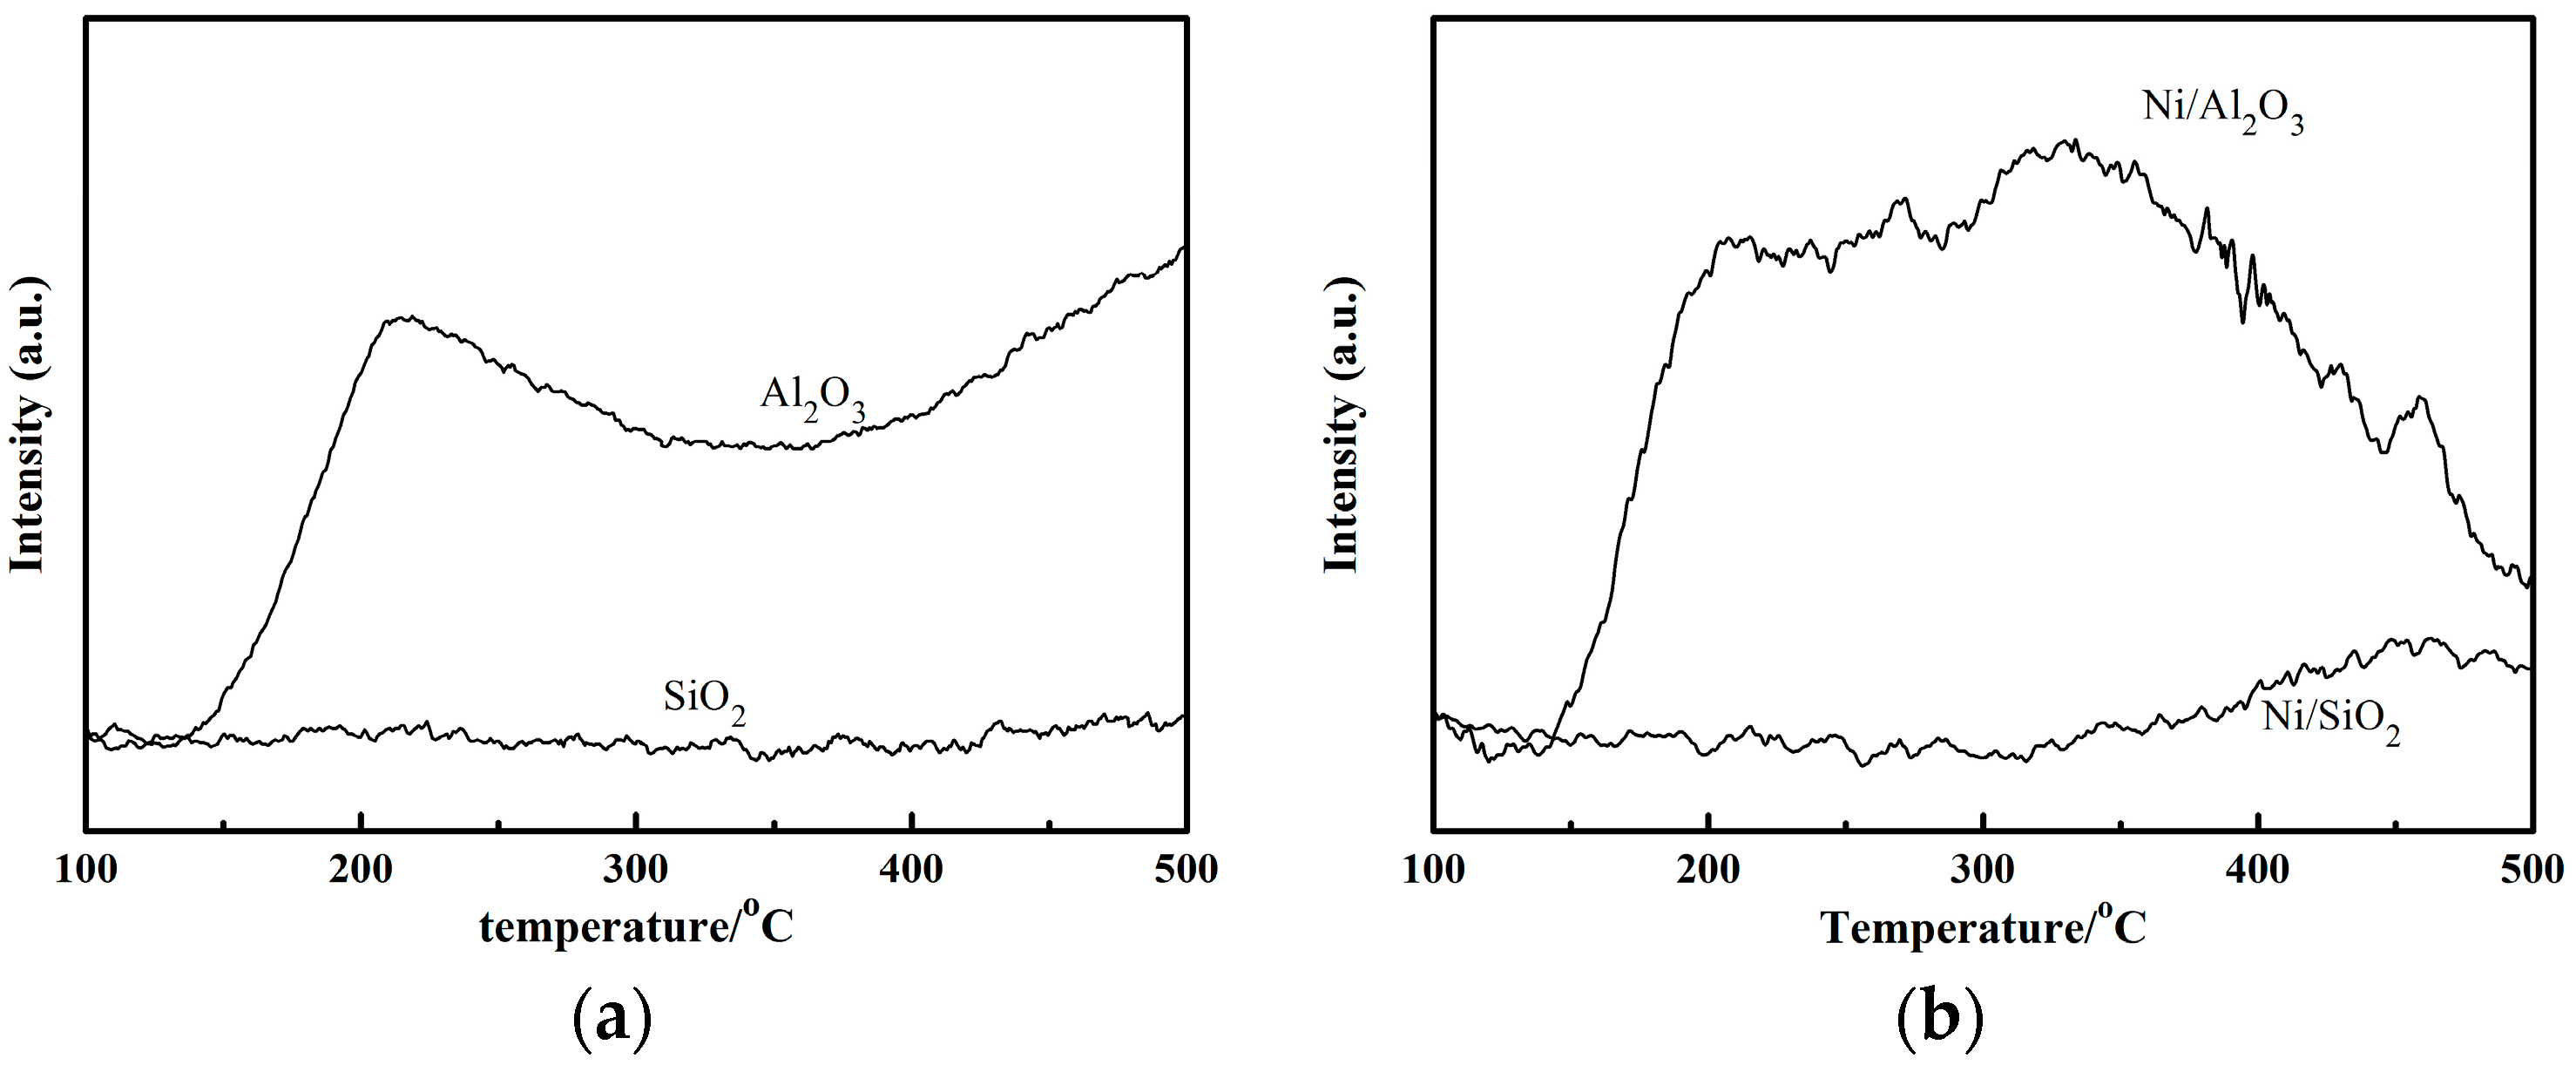
13], it is believed that in a nitrile hydrogenation system, the hydrogenation reactions are catalyzed by metal sites while condensation reactions are catalyzed by acid sites. This would indicate that the acidic properties of the support are crucial to the catalytic performance. A stronger acidity favors the conversion of nitrile but decreases the selectivity to primary amines. The NH
3-TPD data for Al
2O
3 and SiO
2 and their corresponding catalysts are presented in
Figure 2a. Al
2O
3 has a large NH
3 desorption peak in the temperature range from 100 to 500 °C while SiO
2 does not. After the introduction of the Ni, Ni/Al
2O
3 still showed an obvious NH
3 desorption peak in contrast to Ni/SiO
2 as shown in
Figure 2b. The acid sites can absorb imine intermediate and primary amine and cause them to react with each other so that condensation products are produced, which lead to the decreased selectivity of the target products.
Therefore, SiO2 is the more suitable support for the hydrogenation of ADN to ACN and HMD, and SiO2 was used as the support in the following study.
2.2. Direct Reduction Method
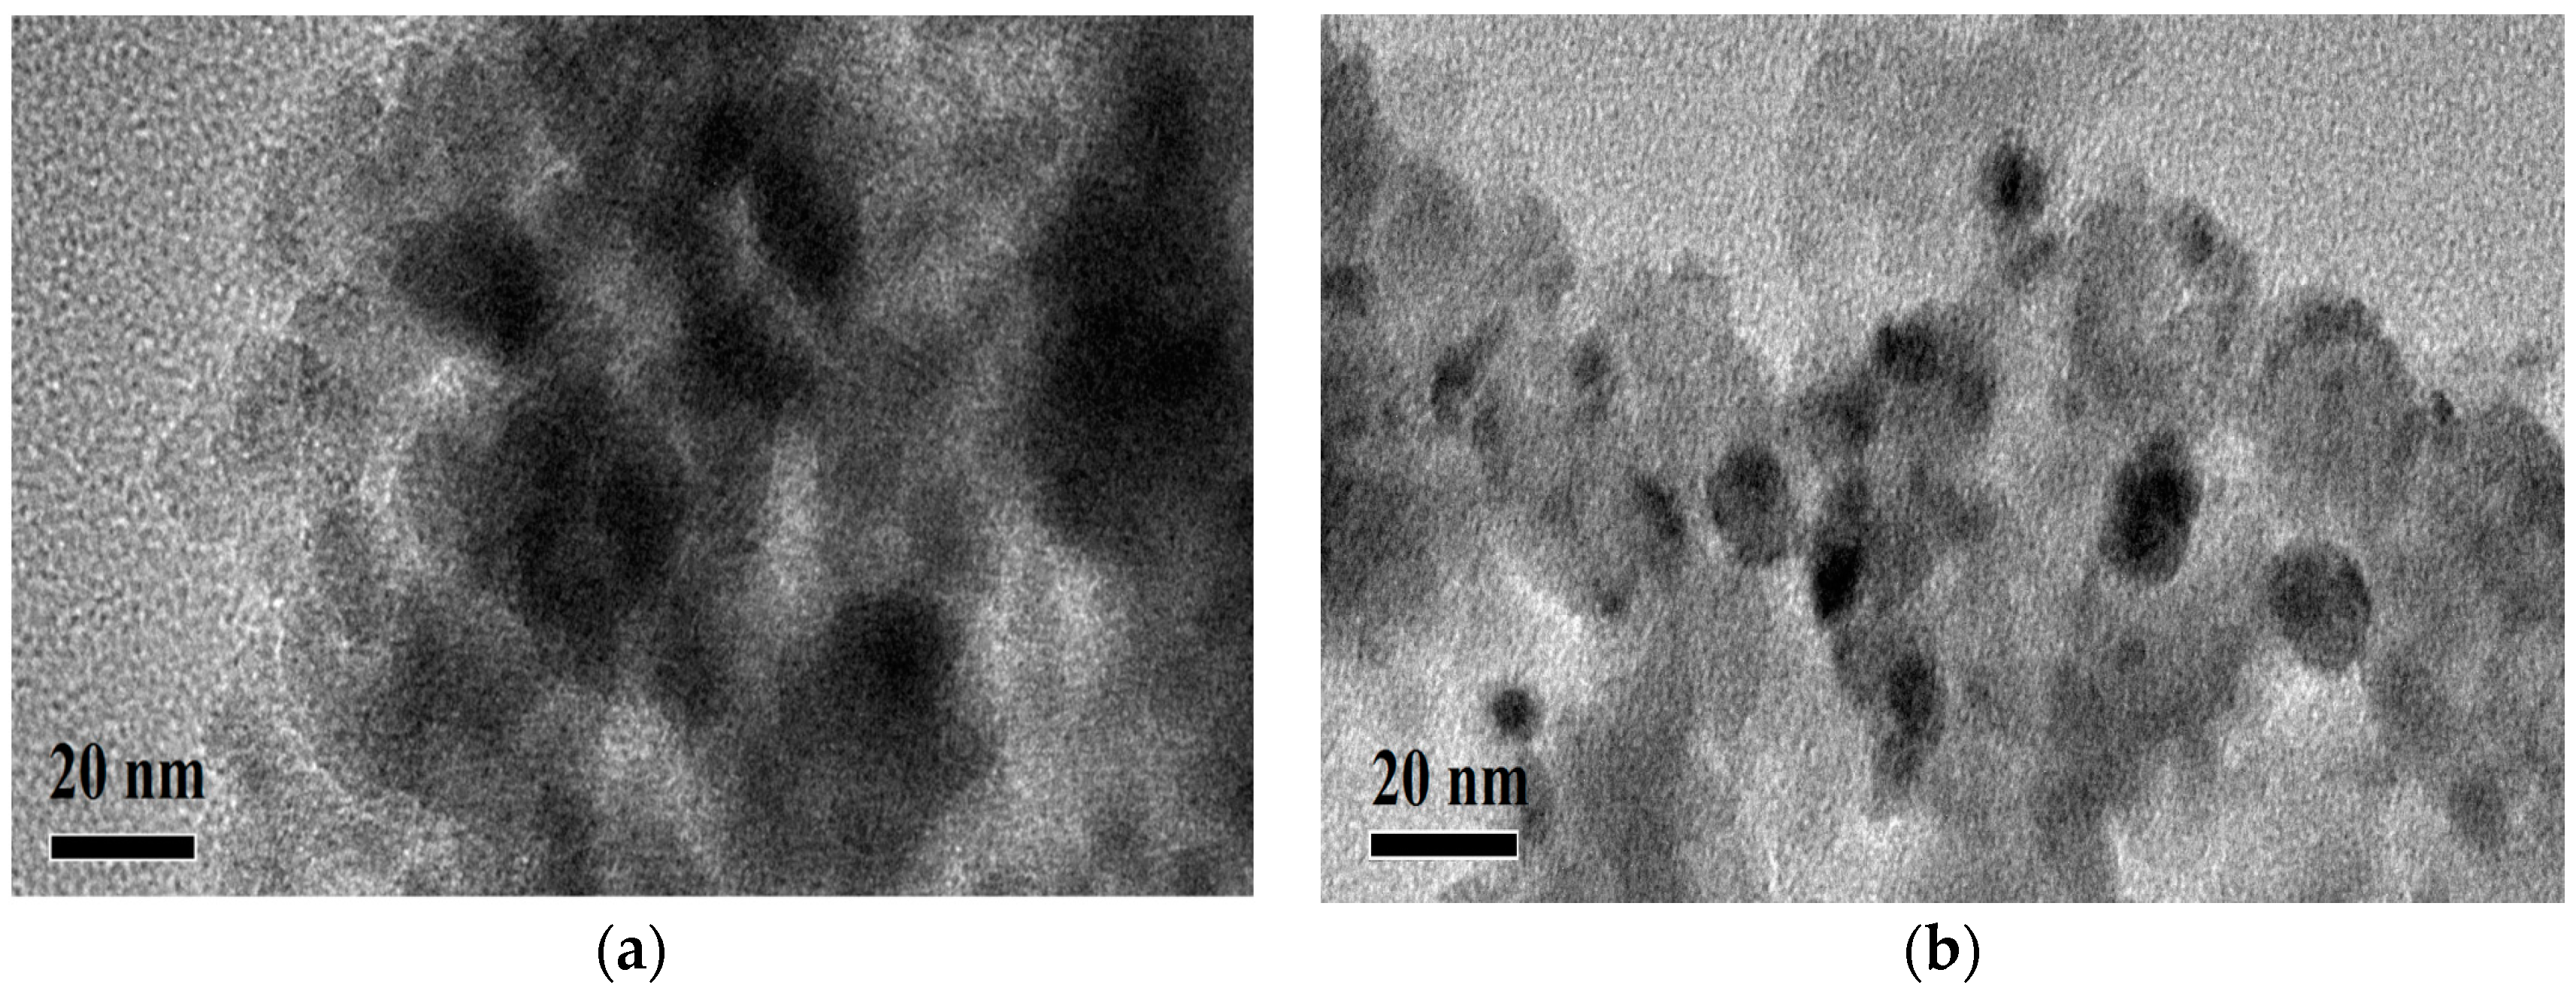
The supported Ni catalyst was prepared by the wetness incipient impregnation method, which consists of three steps: impregnation, calcination and reduction. After calcination and reduction, the Ni(NO3)2 loaded on the supports became metal particles with catalytic activity. The calcination and reduction are key steps and have important influence on the catalytic performance.
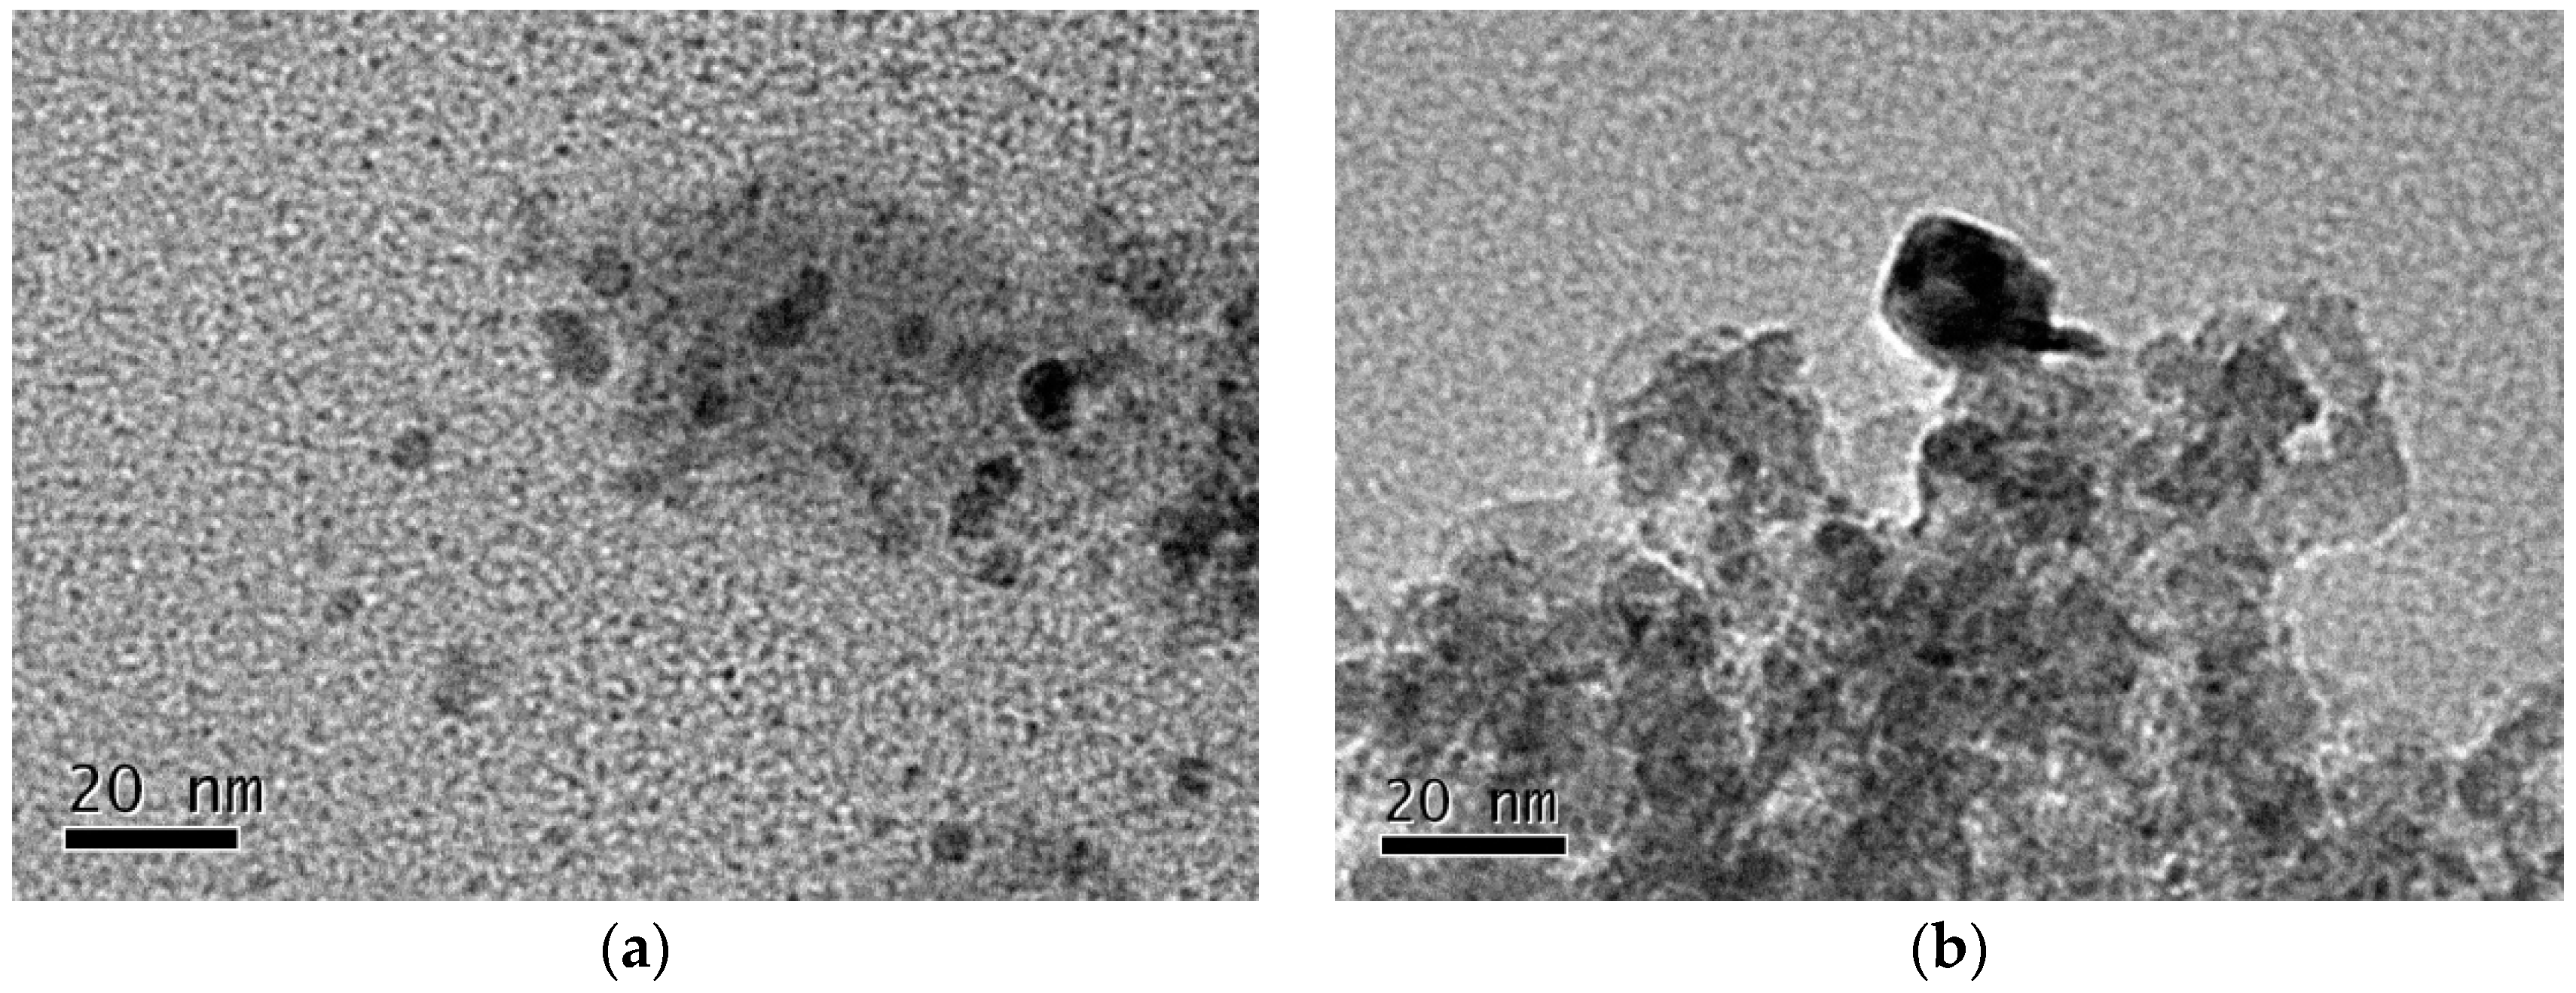
Table 3 shows mean particle sizes of Ni estimated by the two independent methods, TEM and XRD analysis [
14].
Figure 3 showed the TEM images of two catalysts. The particle size of nickel on the Ni
DR/SiO
2 is around 7 nm, while that on the Ni
CR/SiO
2 is much larger. XRD analysis results of the catalysts show the similar information, 6.4 and 17.7 nm, respectively.
The H
2 uptake was 76.2 µmol/g by Ni
DR/SiO
2 while that by Ni
CR/SiO
2 was 15.4 µmol/g, corresponding to the active nickel areas of 30.0 and 6.0 m
2/g [
15]. We can conclude that Ni
DR/SiO
2 had a superior Ni dispersion of 4.50% while that of Ni
CR/SiO
2 is 0.90%, which is in accordance with the TEM and the XRD analysis. Ni(NO
3)
2/SiO
2 catalyst precursor would be totally reduced at 700 °C from H
2-TPR profiles. The H
2-chemisorption data showed the H
2 adsorption capacity of a catalyst partially reduced at 450 °C. This means that H
2-chemisorption data here cannot be used to calculate the mean particle size accurately.
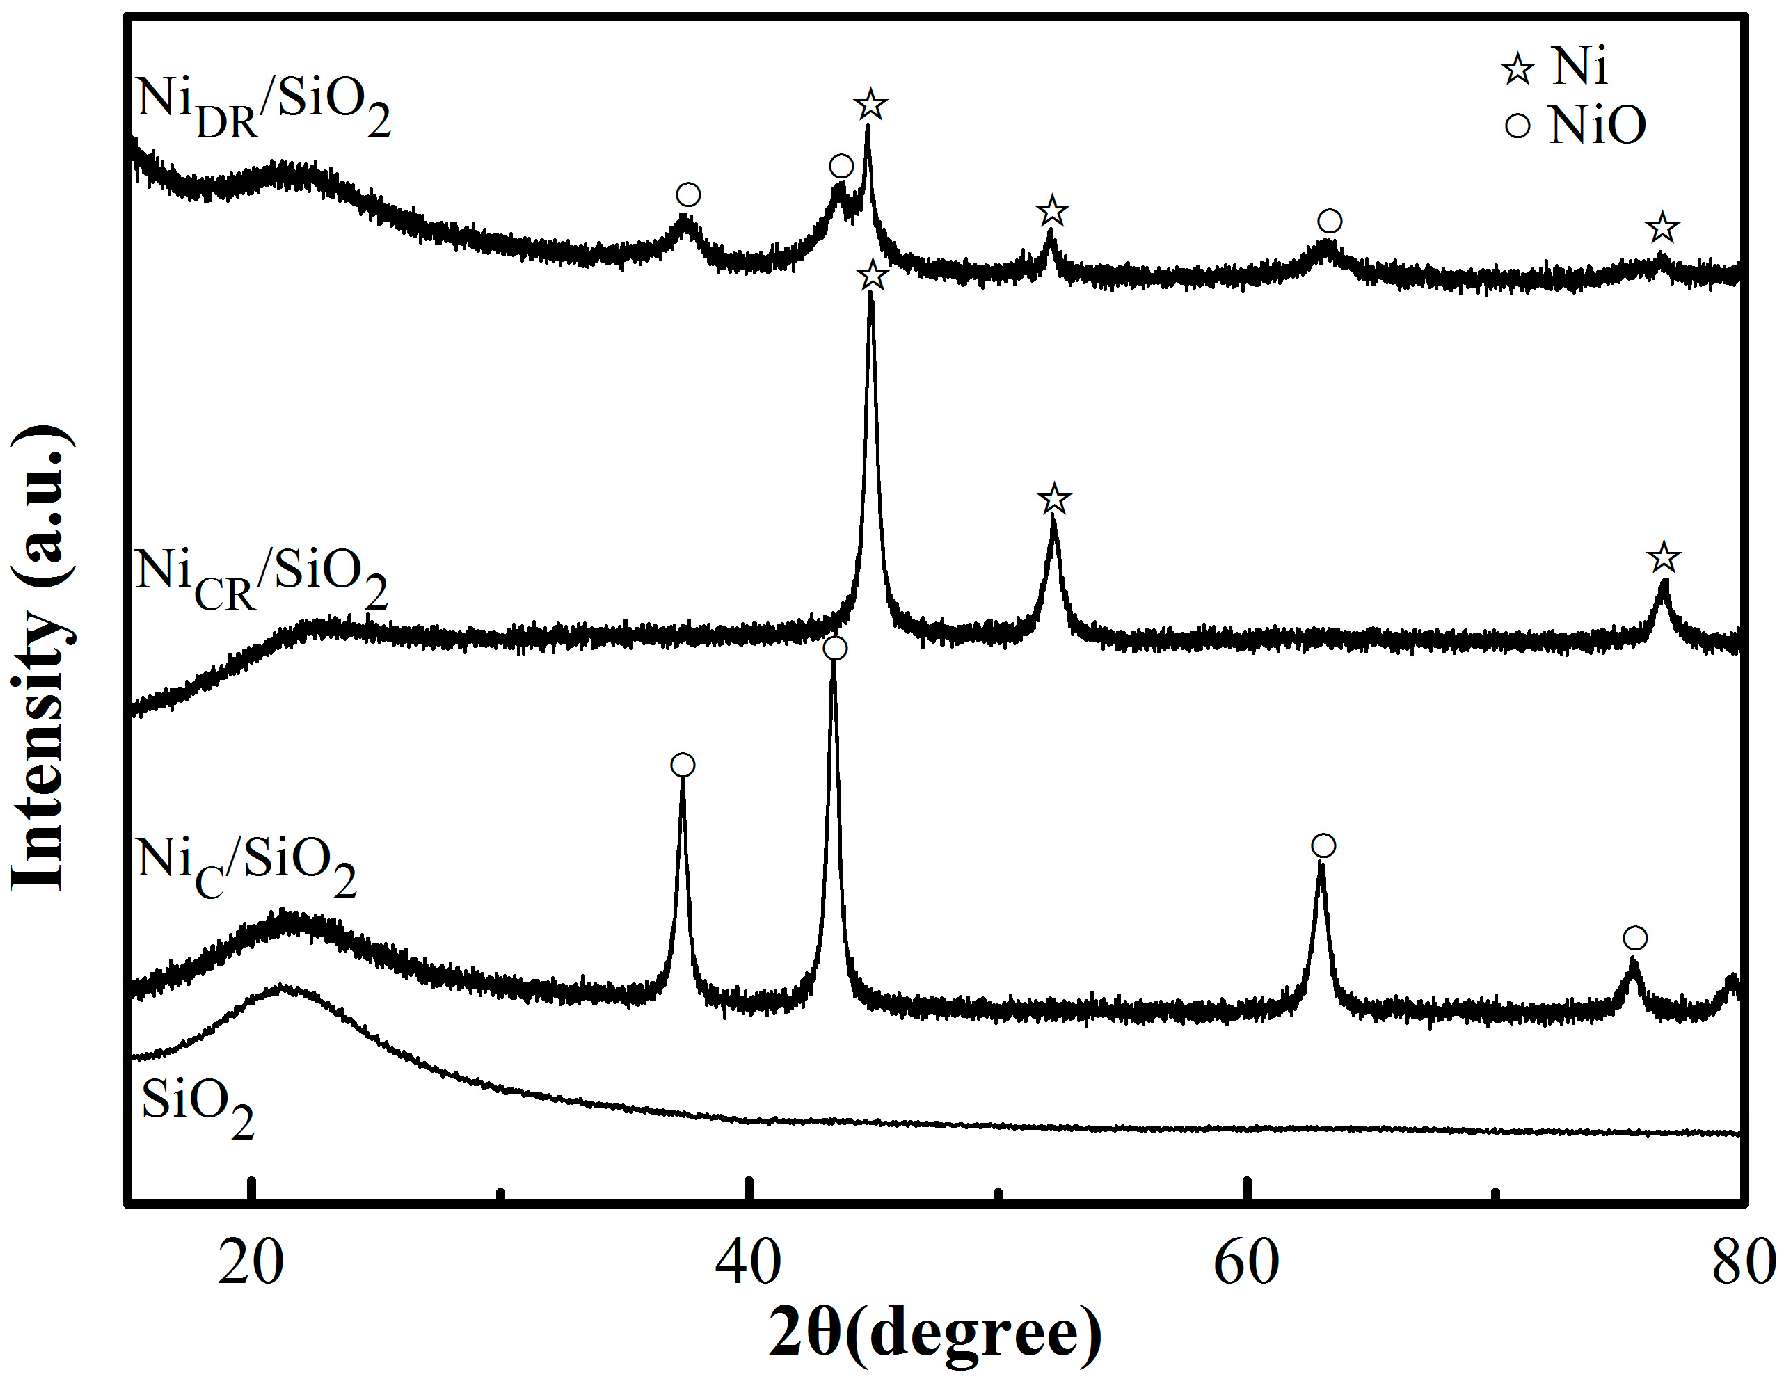
Figure 4 showed the XRD patterns of the catalysts. The characteristic diffraction peaks of NiO in Ni
C/SiO
2 are obvious, which indicated that the nickel mainly existed in the form of nickel oxide. After the reduction in H
2, Ni
CR/SiO
2 showed a very sharp Ni peak while Ni
DR/SiO
2 showed both NiO and Ni diffraction peaks. Louis et al. [
16] have studied supported Ni catalyst and found existence of nickel phyllosilicates, which were located at the surface of catalyst precursor after nickel nitrate impregnated onto silica. The nickel phyllosilicates act as anchoring sites for metallic Ni particles and suppress the formation of large Ni particles. However, calcination before reduction leads to the formation of larger metal particles and to their aggregation. This is probably due to the partial decomposition of nickel phyllosilicates during calcination, the breaking of the anchoring sites for impregnated nickel, which favors nickel migration. Direct reduction of Ni(NO
3)
2/SiO
2 was a moderate reduction process, which sacrificed the reduction degree but gave a superior Ni dispersion.
As described above, the two catalysts prepared by the different methods had different microstructures, which probably caused their catalytic performance for hydrogenation of ADN to be different.
Table 4 shows the evaluation result of the catalysts. Ni
DR/SiO
2 exhibited a better hydrogenation activity of 0.56 mol·kg
cat−1·min
−1 compared to Ni
CR/SiO
2 with 0.25 mol·kg
cat−1·min
−1. The selectivity to the primary amine products over Ni
DR/SiO
2 was higher than that over Ni
CR/SiO
2, which, respectively, were 79% and 54%. Meanwhile, the selectivity to condensation byproducts were inhibited over Ni
DR/SiO
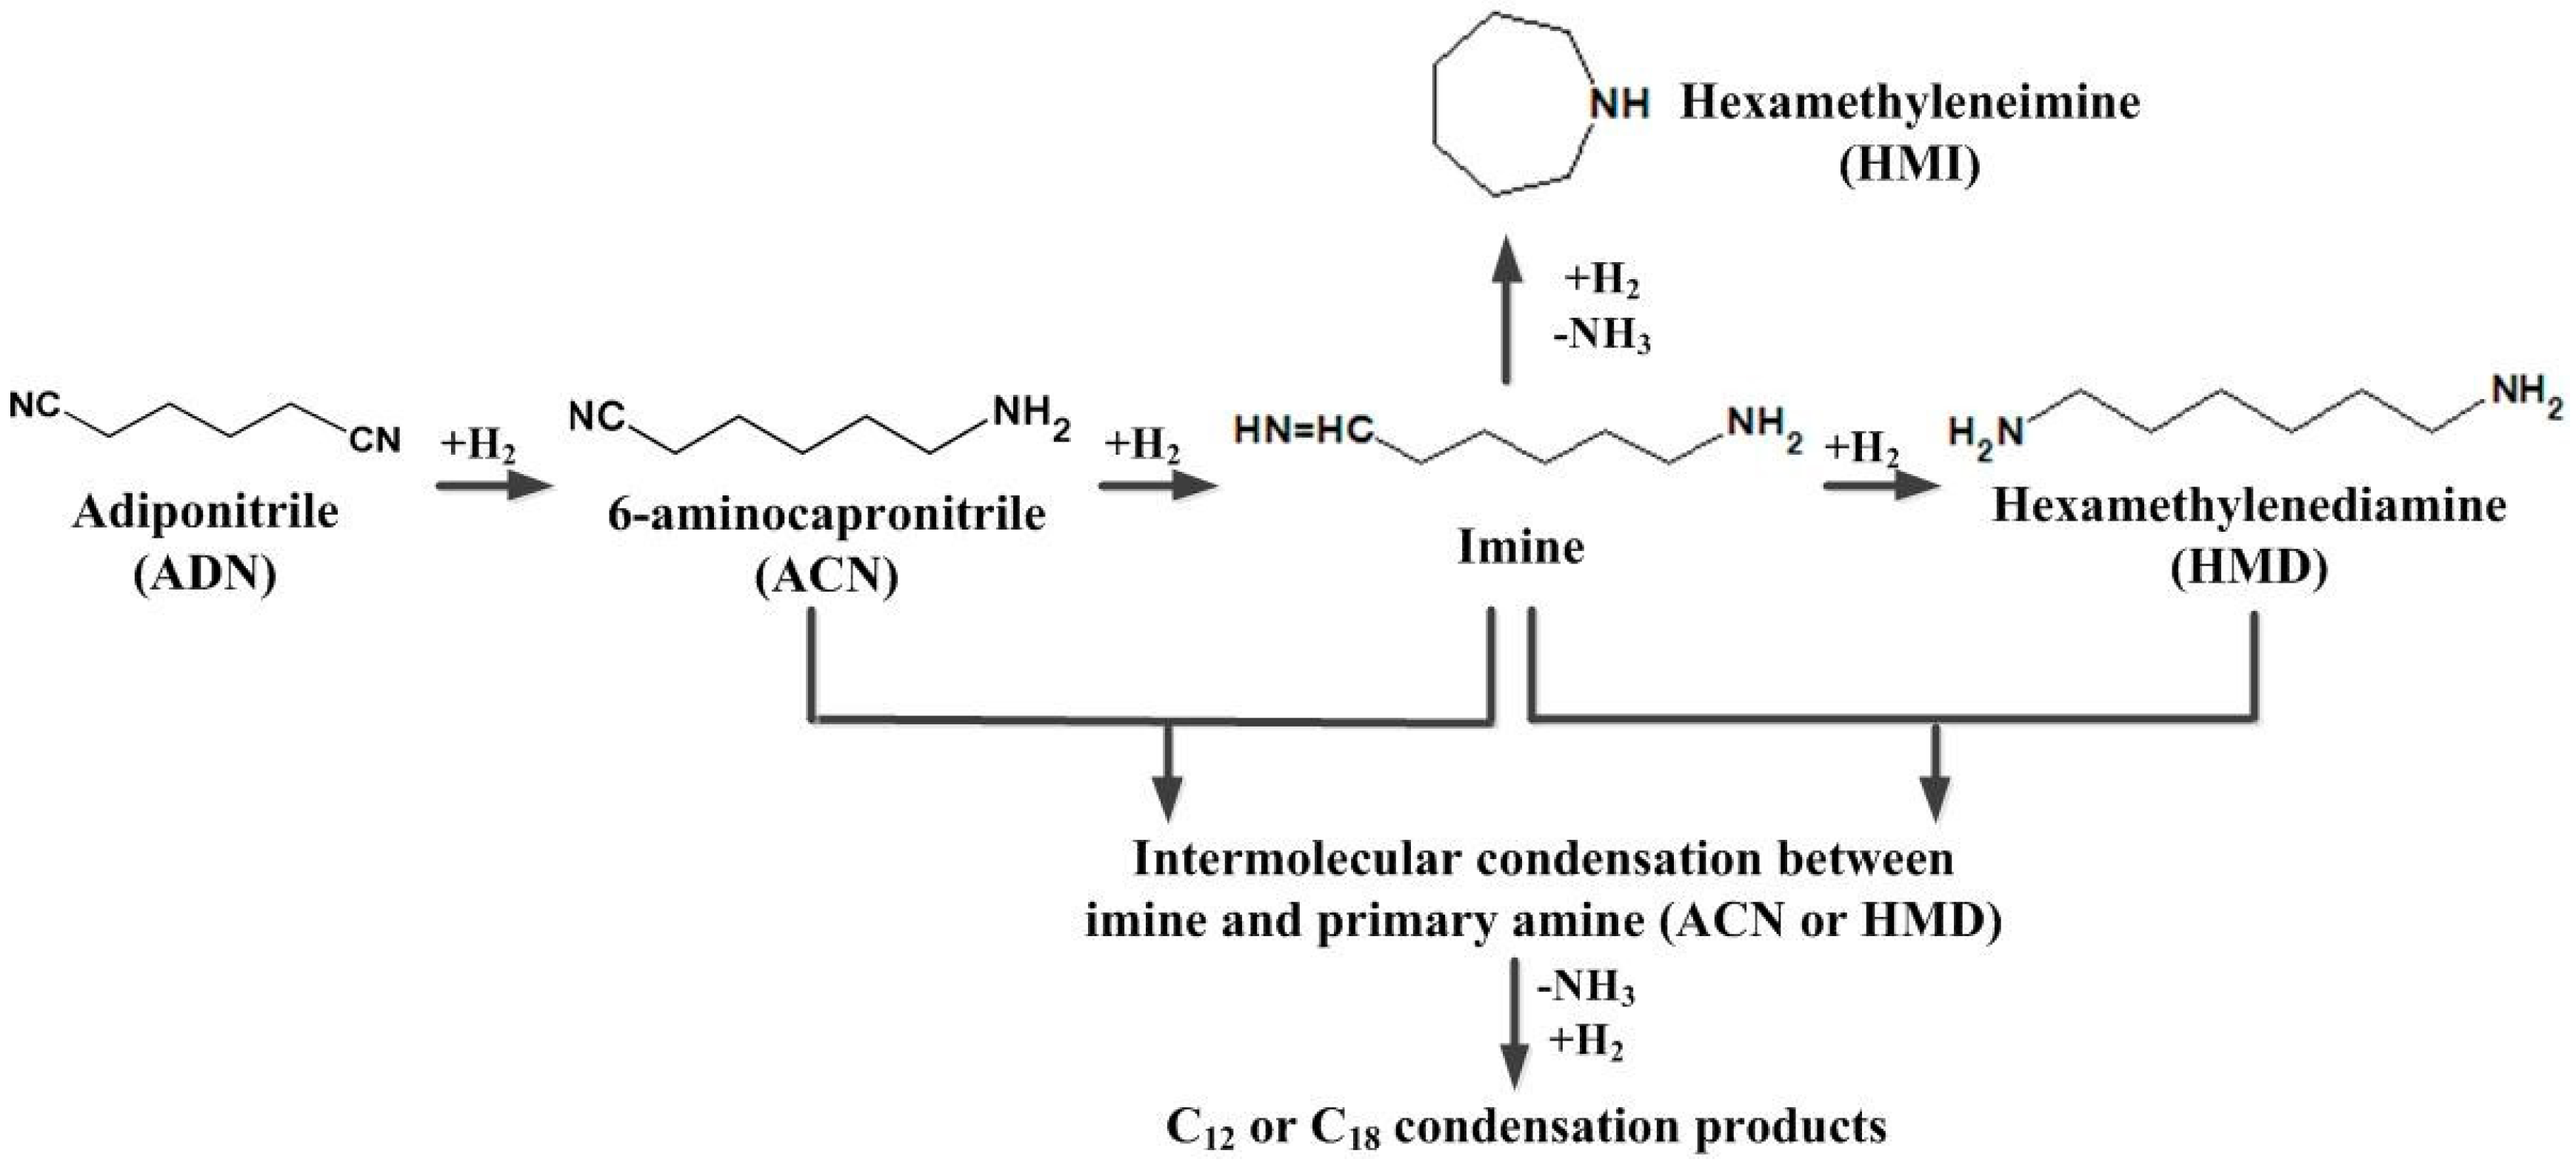
2, which decreased from 37% to 3%. In the sequential reaction, shown in
Figure 1, the highly reactive imine intermediate can further react along three pathways: further hydrogenation, intramolecular condensation to HMI, and intermolecular to condensation byproducts. The three pathways are parallel, that is, the formation of primary amine competes with the side reactions. Ni
DR/SiO
2 exhibited a superior hydrogenation activity, which promoted the hydrogenation and improved the selectivity to ACN and HMD.
The condensation byproducts were secondary and tertiary amines with a high molecular weight which were not eluted and cannot be detected in the GC analysis. The product mixture was analyzed by a mass spectrometer to confirm the existence of condensation byproducts. The result is shown in
Figure 5. The mass to charge ratio of protonated HMI, ACN and HMD are, respectively,
m/
z = 100, 113, 117. The peaks of
m/
z = 200~300 indicated the formation of C
12 and C
18 oligomers. These showed clearly that the condensation byproducts from Ni
DR/SiO
2 was decreased, which verified the GC evaluation result.
Ni
DR/SiO
2 had a higher H
2 adsorption capacity from H
2 uptake result, which would indicate that amines and imine intermediates are more abundantly adsorbed on Ni
DR/SiO
2. The C atoms of imines were subjected to nucleophilic attack by N atoms of the amines [
17], leading to the formation of a secondary imine which can be further hydrogenated to HMI. Ni
DR/SiO
2 was more selective for intramolecular side reaction. As seen in
Table 4, the selectivity to HMI over Ni
CR/SiO
2 was 9% while that over Ni
DR/SiO
2 was 18%. From this point, further developing of the supported Ni catalyst prepared by the direct reduction method is still necessary. The conditions of catalyst preparation and reaction conditions have to be optimized to inhibit the formation of HMI and improve the selectivity to primary amines.
2.3. Reduction Teamperature
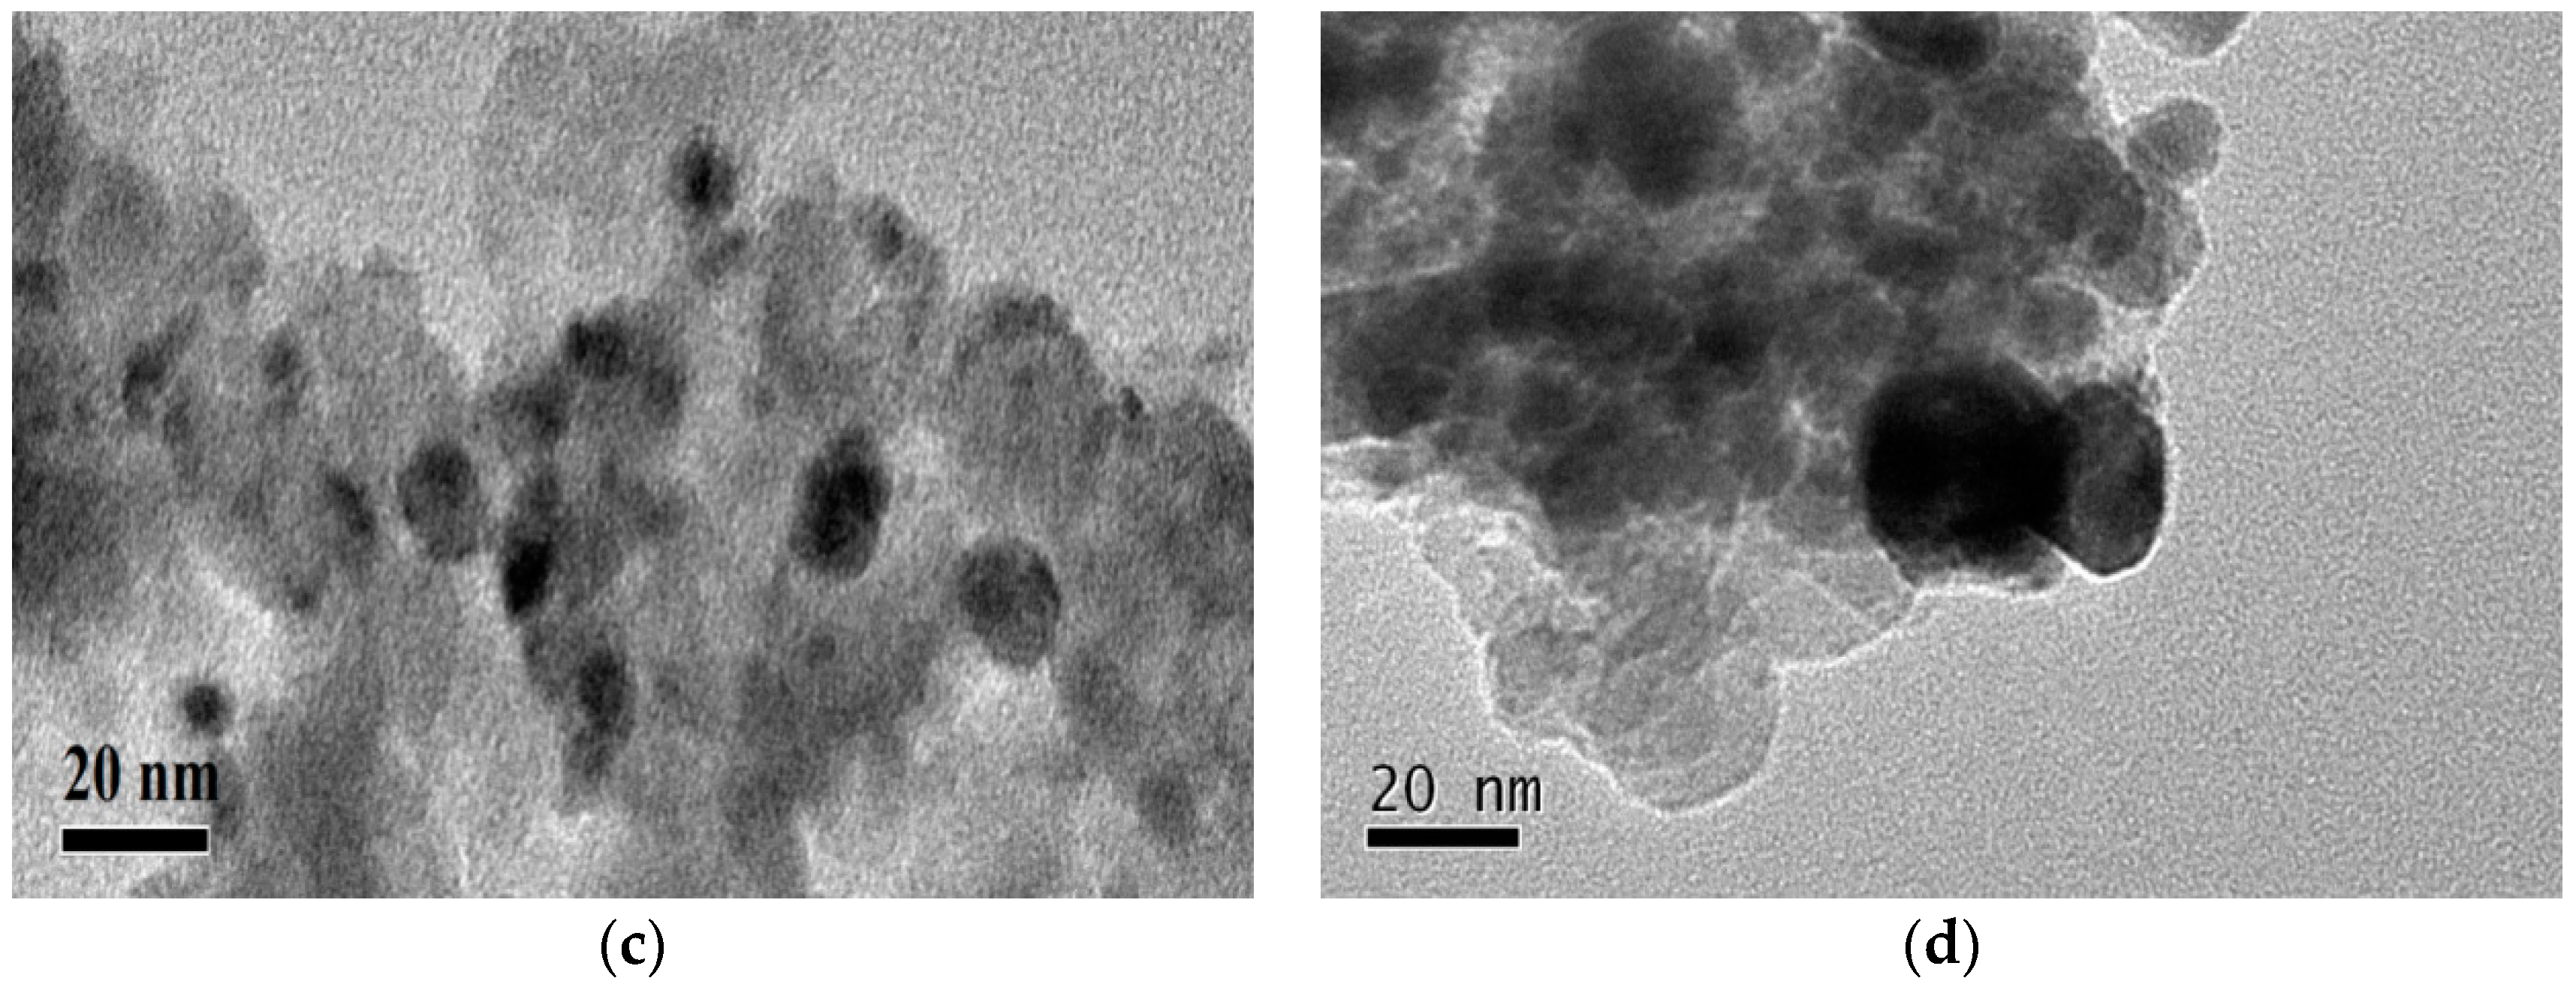
The microstructure of supported Ni catalyst prepared by direct reduction method is affected by reduction temperature significantly. The TEM images of catalysts reduced at different temperature are shown in
Figure 6. The mean particle sizes of Ni became larger with the increase of reduction temperature obviously.
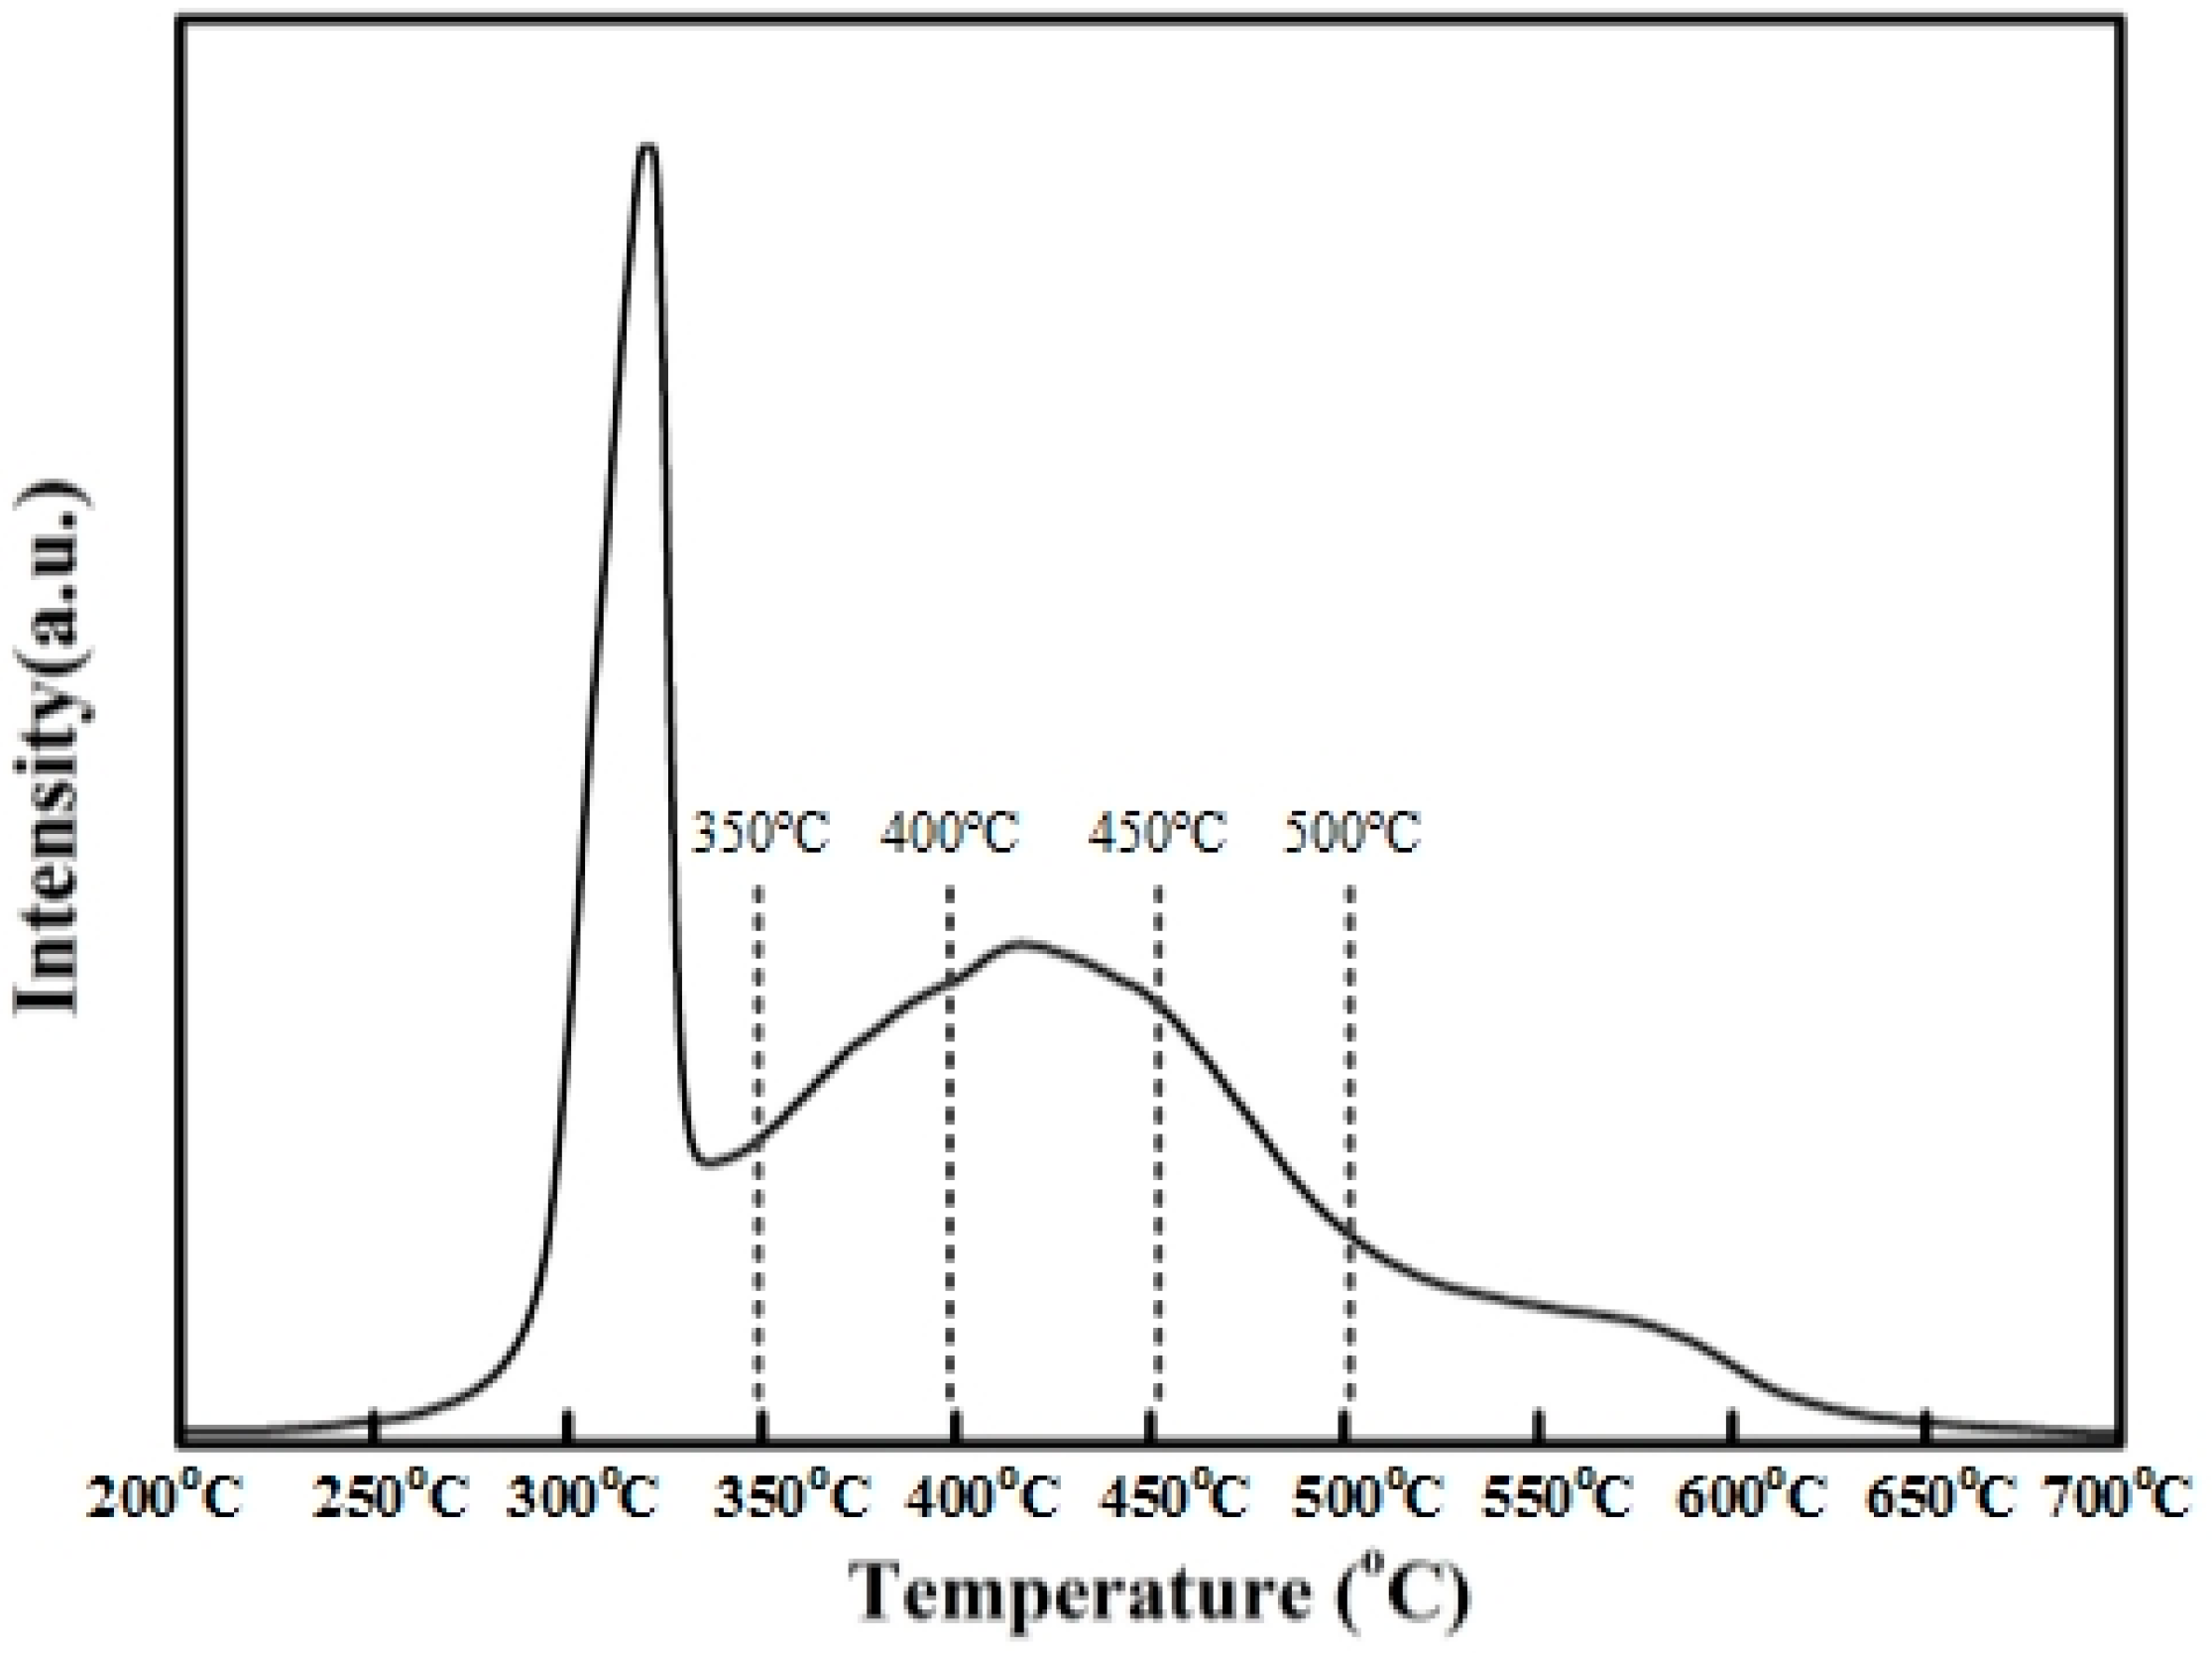
The H
2-TPR profiles of Ni(NO
3)
2/SiO
2 were given in
Figure 7. The TPR profiles of the impregnated catalysts, performed without any previous calcination, exhibit three peaks of hydrogen consumption at 300, 400, and about 550 °C, attributed to the decomposition of nickel nitrate into NiO, the reduction of NiO and the reduction of nickel phyllosilicates. After TPR up to 700 °C, the nickel is totally reduced. Before complete reduction, the nickel phyllosilicates are probably located at the interface between silica and the remaining nickel, for which they act as anchoring sites. During TPR, after nitrate decomposition, the NiO particles located on the phyllosilicates are reduced into Ni
0 at 400 °C without any migration. Between 400 and 700 °C, the increase in metal particle size is due not only to NiO migration induced by thermal effect but also to the reduction of the phyllosilicates by the weakening of the anchoring strength.
The H2-TPR profiles of Ni(NO3)2/SiO2 are in accordance with the TEM analysis of the four catalysts reduced at 350, 400, 450 and 500 °C, respectively.
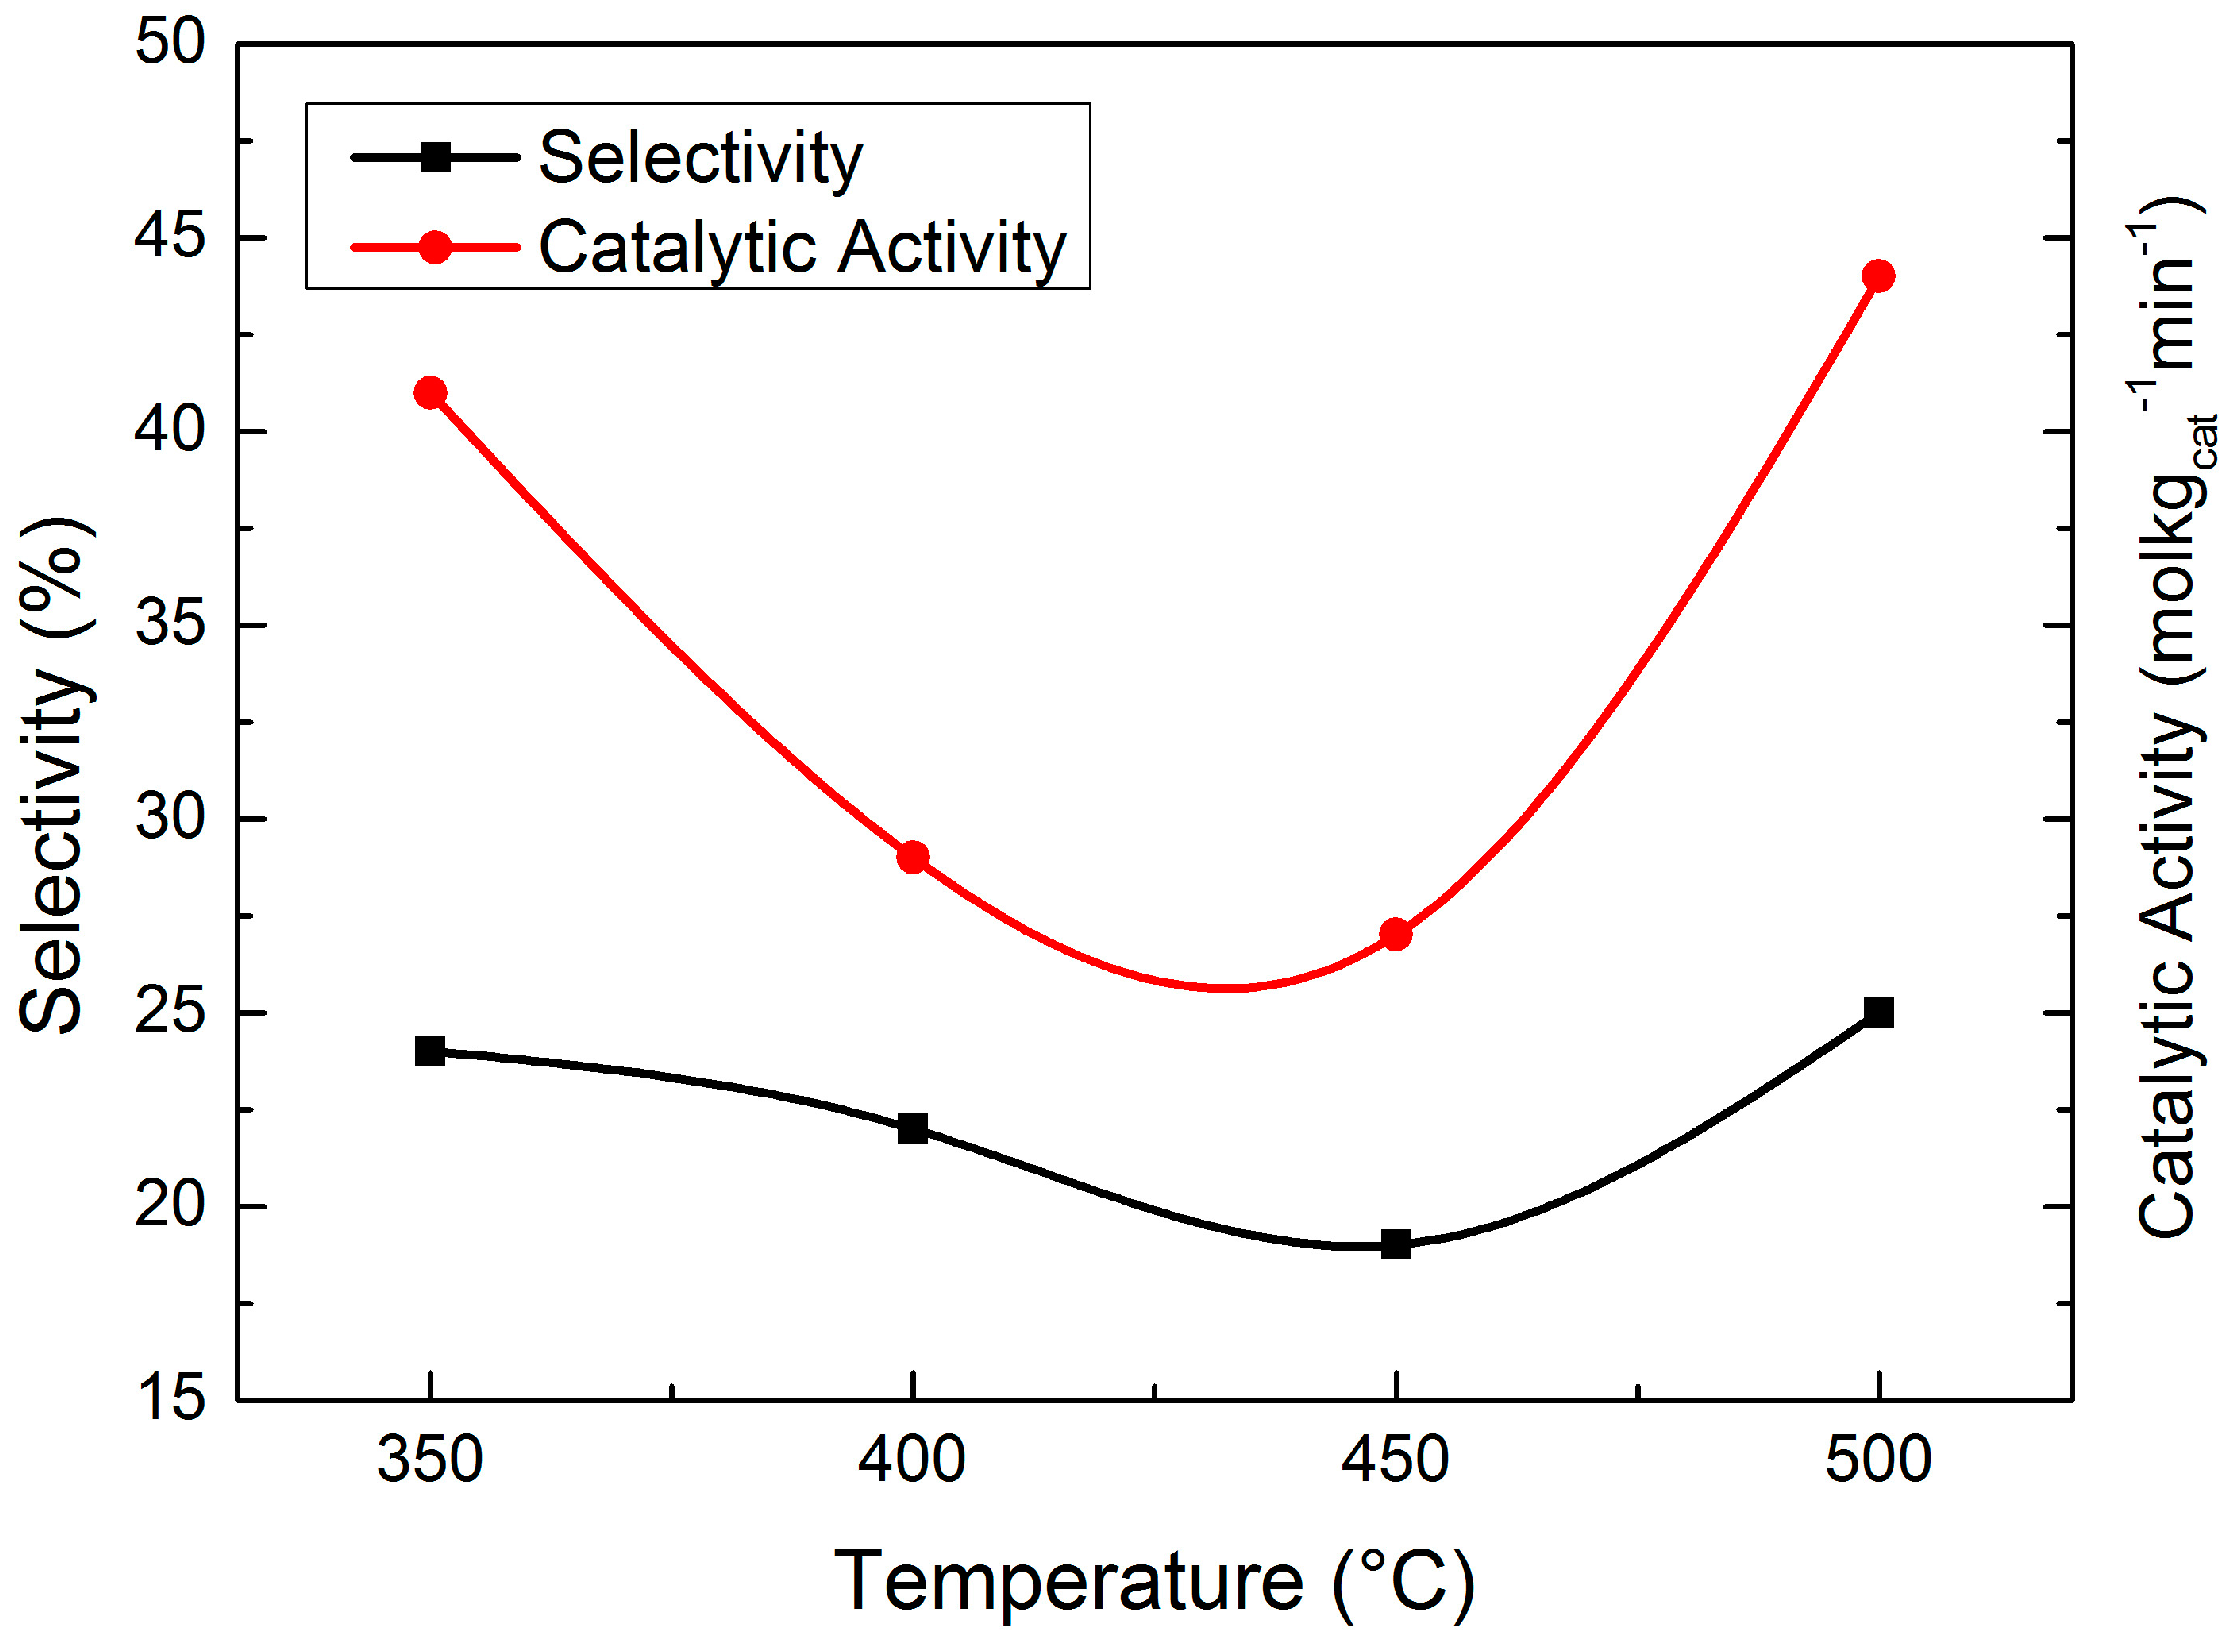
Figure 8 presents the evaluation result of the four catalysts. The catalytic activity first decreased and then increased with the increase of reduction temperature, which can be explained by the reduction degree and Ni dispersion. With the increase of reduction temperature, the reduction degree of the catalysts became higher while the Ni dispersion became lower because the nickel phyllosilicates were gradually decomposed. Ni/SiO
2 reduced at 350 °C had a high hydrogenation activity because of its high Ni dispersion. When the reduction temperature was increased to 400 °C and 450 °C, the migration and aggregation of Ni particles led to a lower metallic Ni dispersion, which caused the catalytic activity decrease. Although the Ni dispersion of Ni/SiO
2 reduced at 500 °C became even lower, the catalytic activity became higher because of its higher reduction degree. In conclusion, Ni dispersion was the key factor to affect the catalytic activity for the reduction temperature range from 350 °C to 450 °C while the reduction degree was the key factor in the temperature range from 450 °C to 500 °C, which explained the variation of catalytic activity.
450 °C was considered the optimum temperature for the reduction when both catalytic activity and selectivity to HMI were taken into account.
2.4. Additive
Most of the side reactions are deamination reactions as shown in
Figure 1. Thermodynamically, adding an alkaline substance as additive to the liquid reaction system would benefit the catalytic activity and selectivity to primary amines [
5,
18]. In ADN hydrogenation, H
2 and nitrile adsorbed on metallic Ni first and then they reacted with each other to imine intermediates and amines. Imines and amines desorbed from the catalyst with difficulty [
19], which would not only suppress the following hydrogenation of nitriles, but also promote the condensation side reactions. The addition of an alkaline substance increases the electron density of metallic Ni on the catalyst surface, which would benefit the desorption of imine and amine [
20].
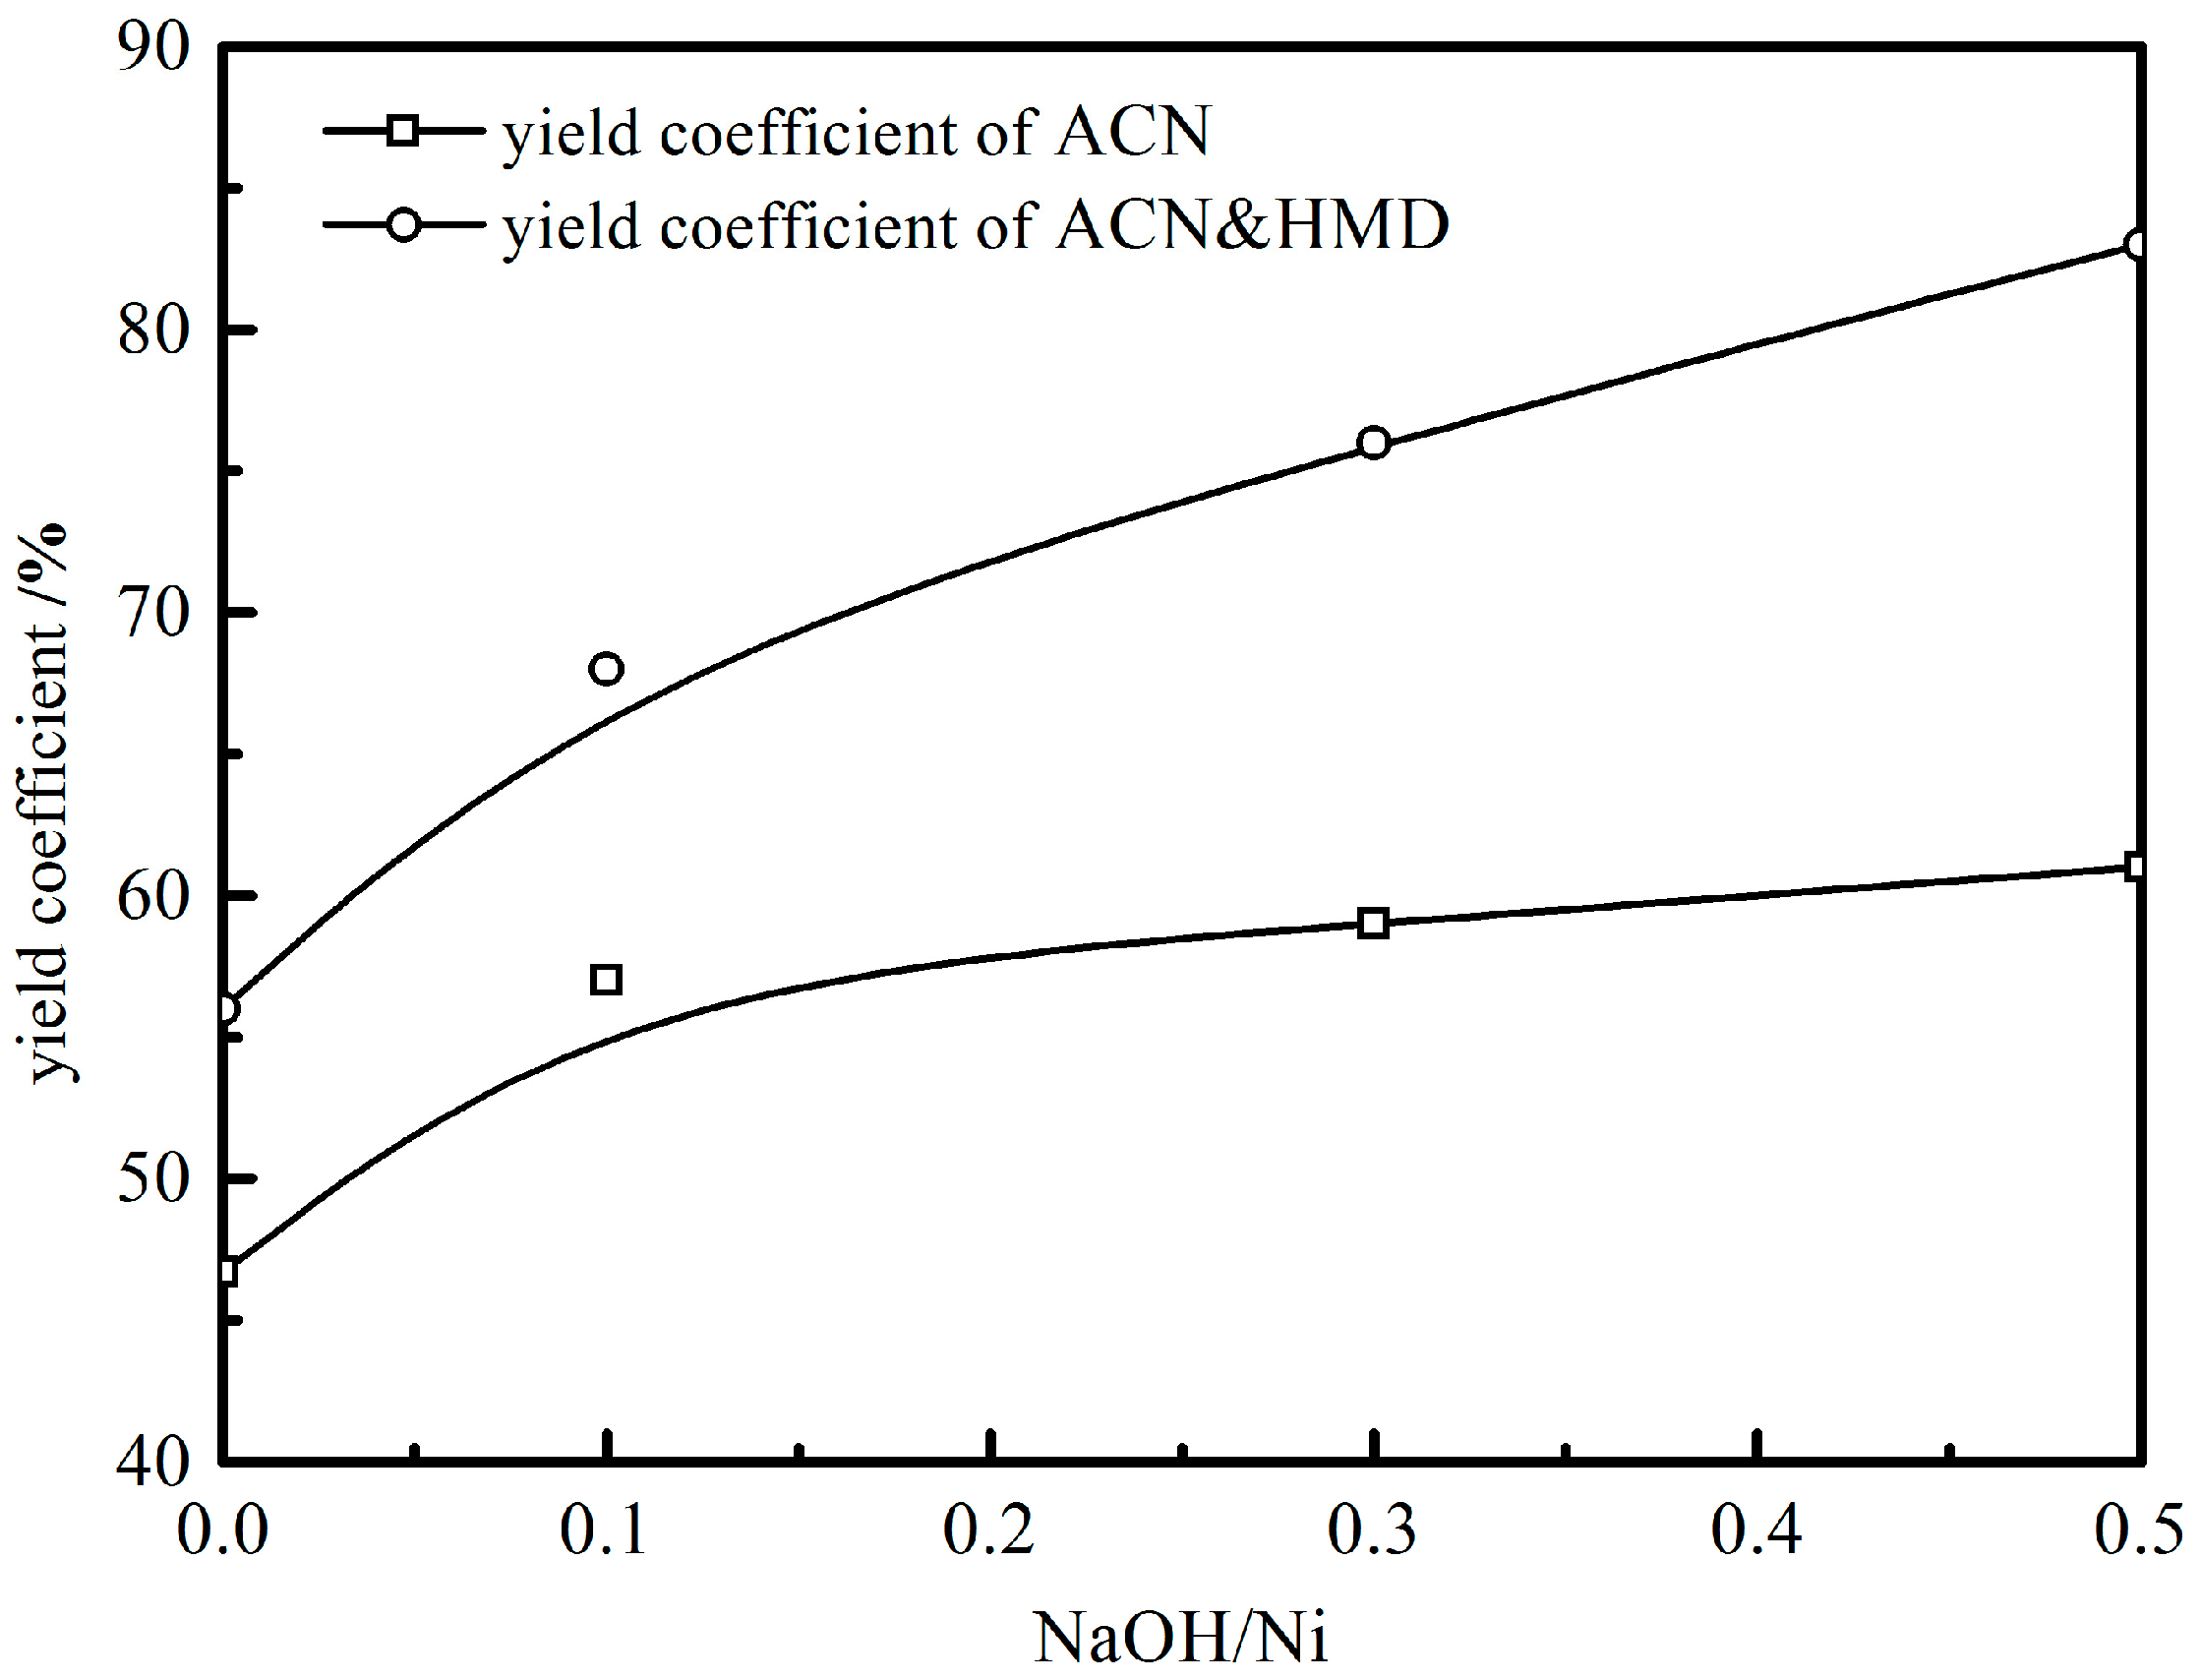
NaOH was chosen as an additive to improve the Ni
DR/SiO
2 catalyst. The evaluation result is presented in
Figure 9 and
Table 5. The mass ratio NaOH/Ni was used as the independent variable. With NaOH/Ni increasing, the catalytic activity rose from 0.39 mol·kg
cat−1·min
−1 to 0.63 mol·kg
cat−1·min
−1 and the selectivity to condensation byproducts decreased from 12% to 1% while that to HMI decreased from 21% to 5%. When the NaOH/Ni was raised to 0.5, the primary selectivity was as high as 94%. Clearly, the effect of NaOH on the catalytic activity and product selectivity was positive.
The addition of NaOH improved the hydrogenation activity and improved the target products selectivity significantly. After the introduction of NaOH, the performance of Ni
DR/SiO
2, reduced at 450 °C, is as excellent as Raney Ni, which is presented in
Table 6.


