Extracting Fitness Relationships and Oncogenic Patterns among Driver Genes in Cancer

Abstract
1. Introduction
2. Materials and Methods
2.1. Data Source
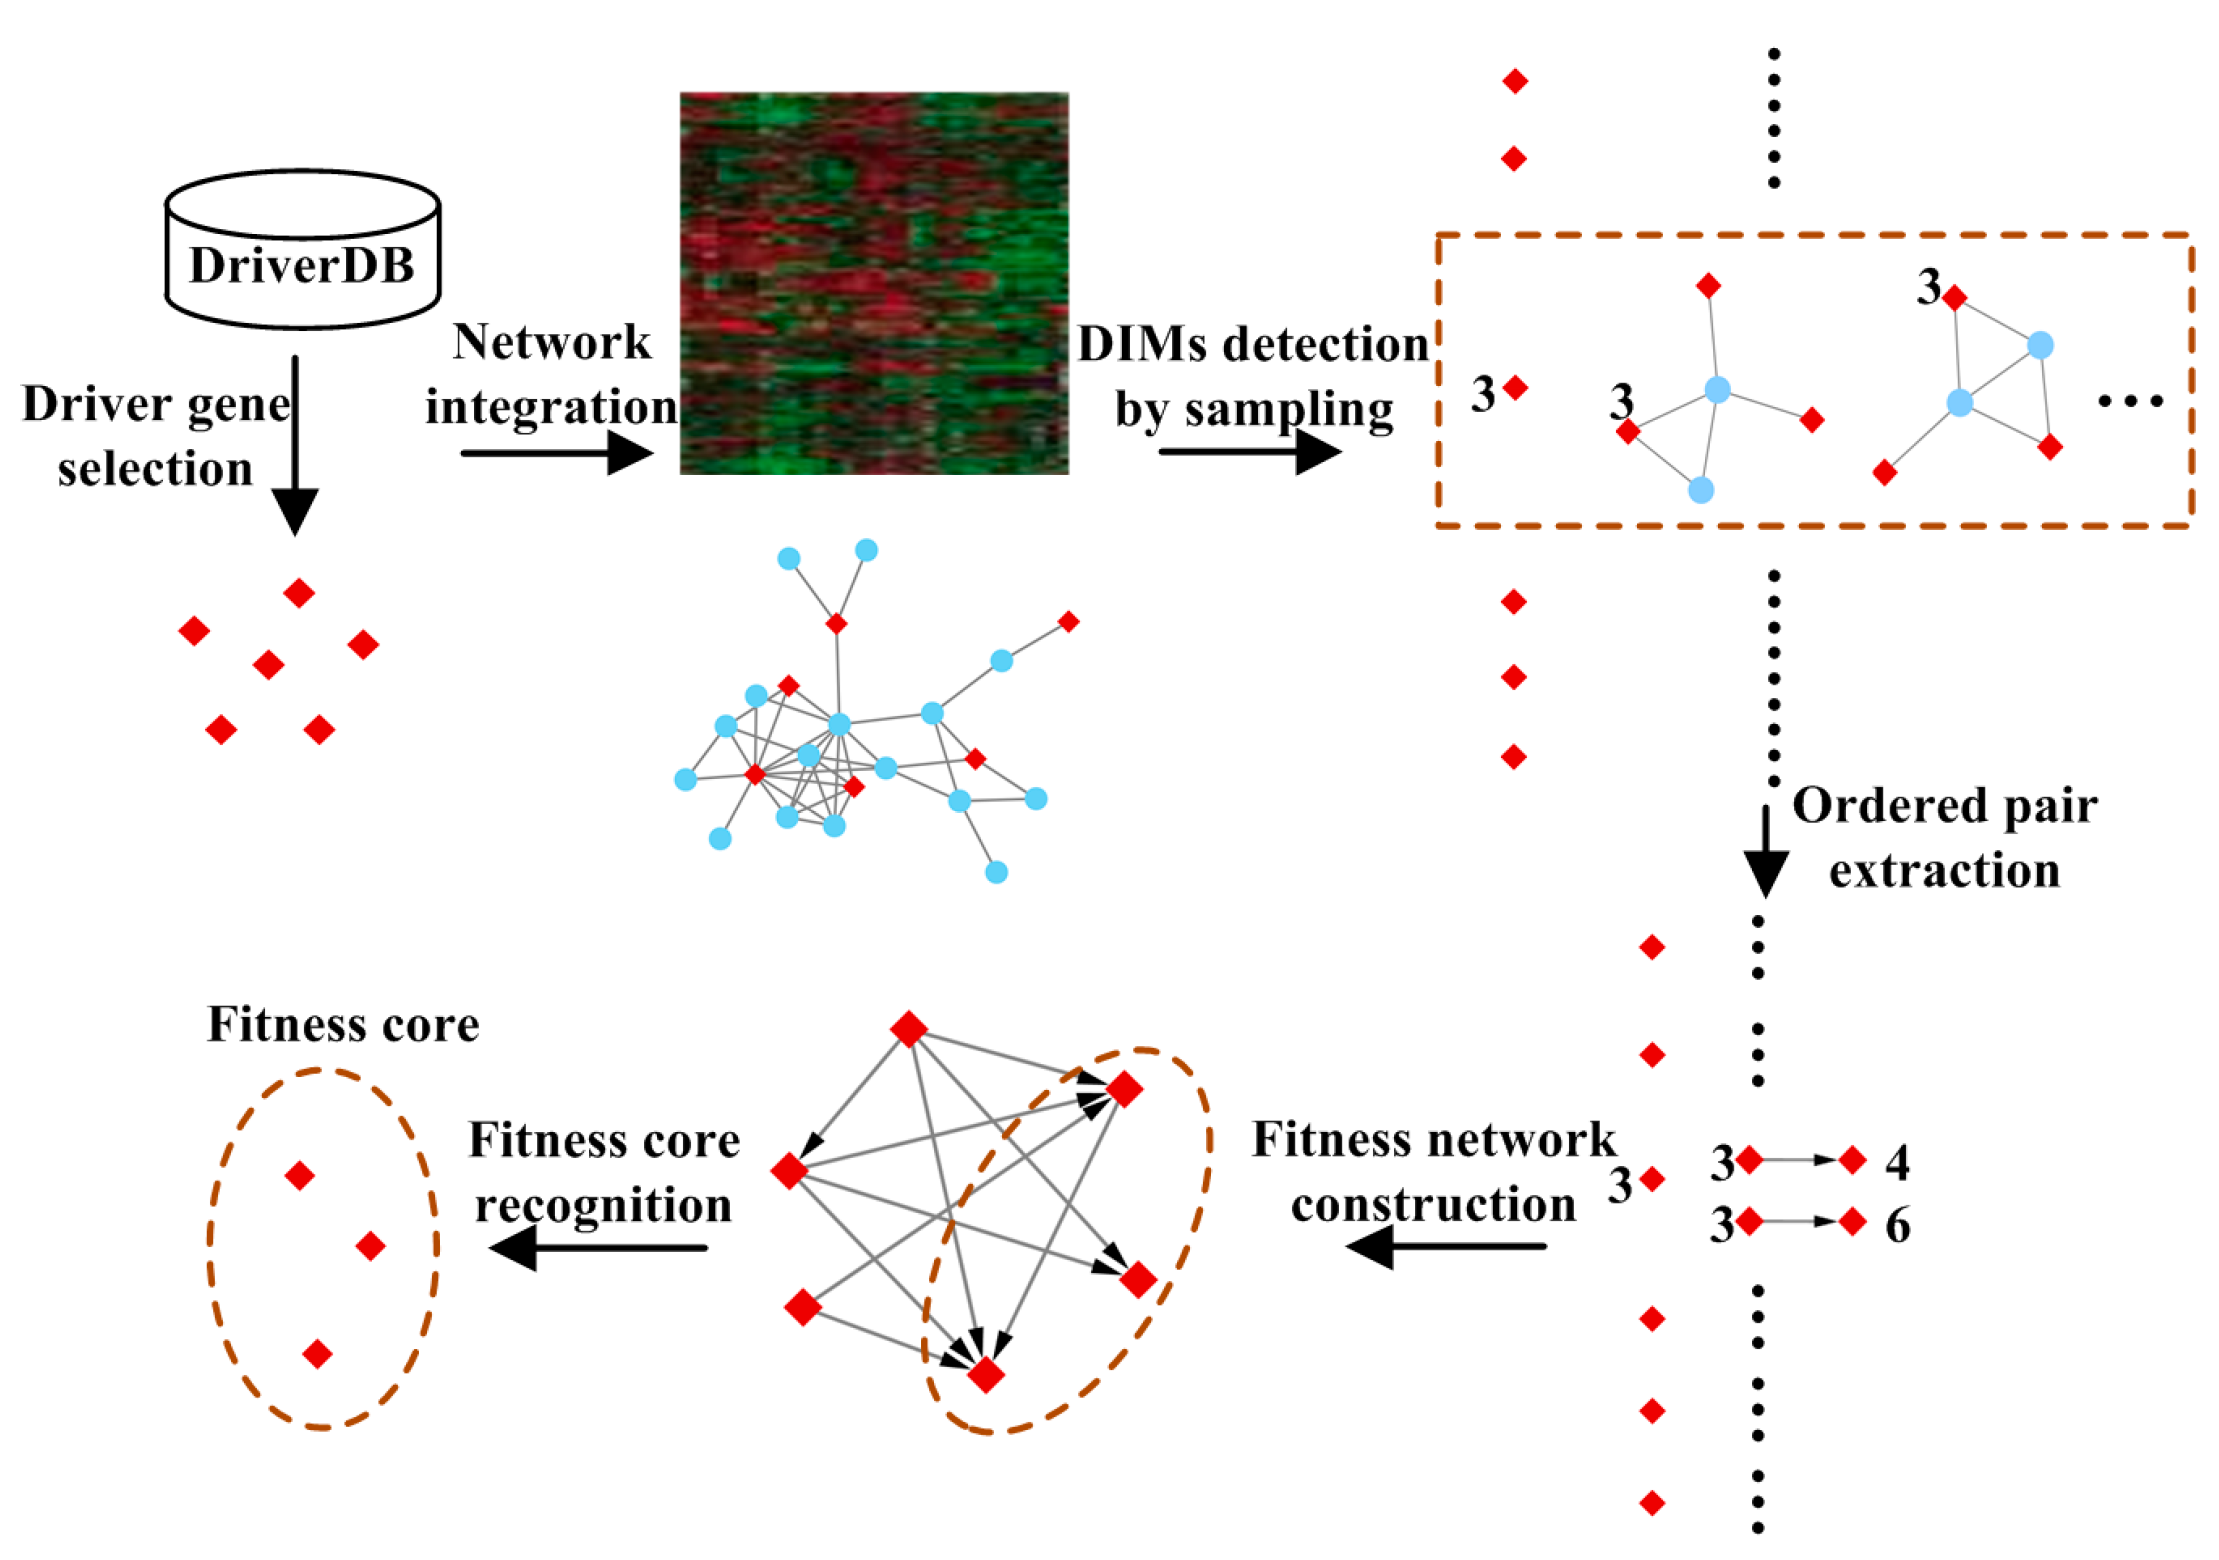
2.2. Methods
2.2.1. Driver Gene Selection
2.2.2. Detecting Driver-Induced Modules (DIMs)
2.2.3. Extracting Ordered Pairs of Driver Genes
2.2.4. Construction of the Fitness Network
2.2.5. Recognition of Fitness Core
2.2.6. Absolute Coverage and Relative Coverage
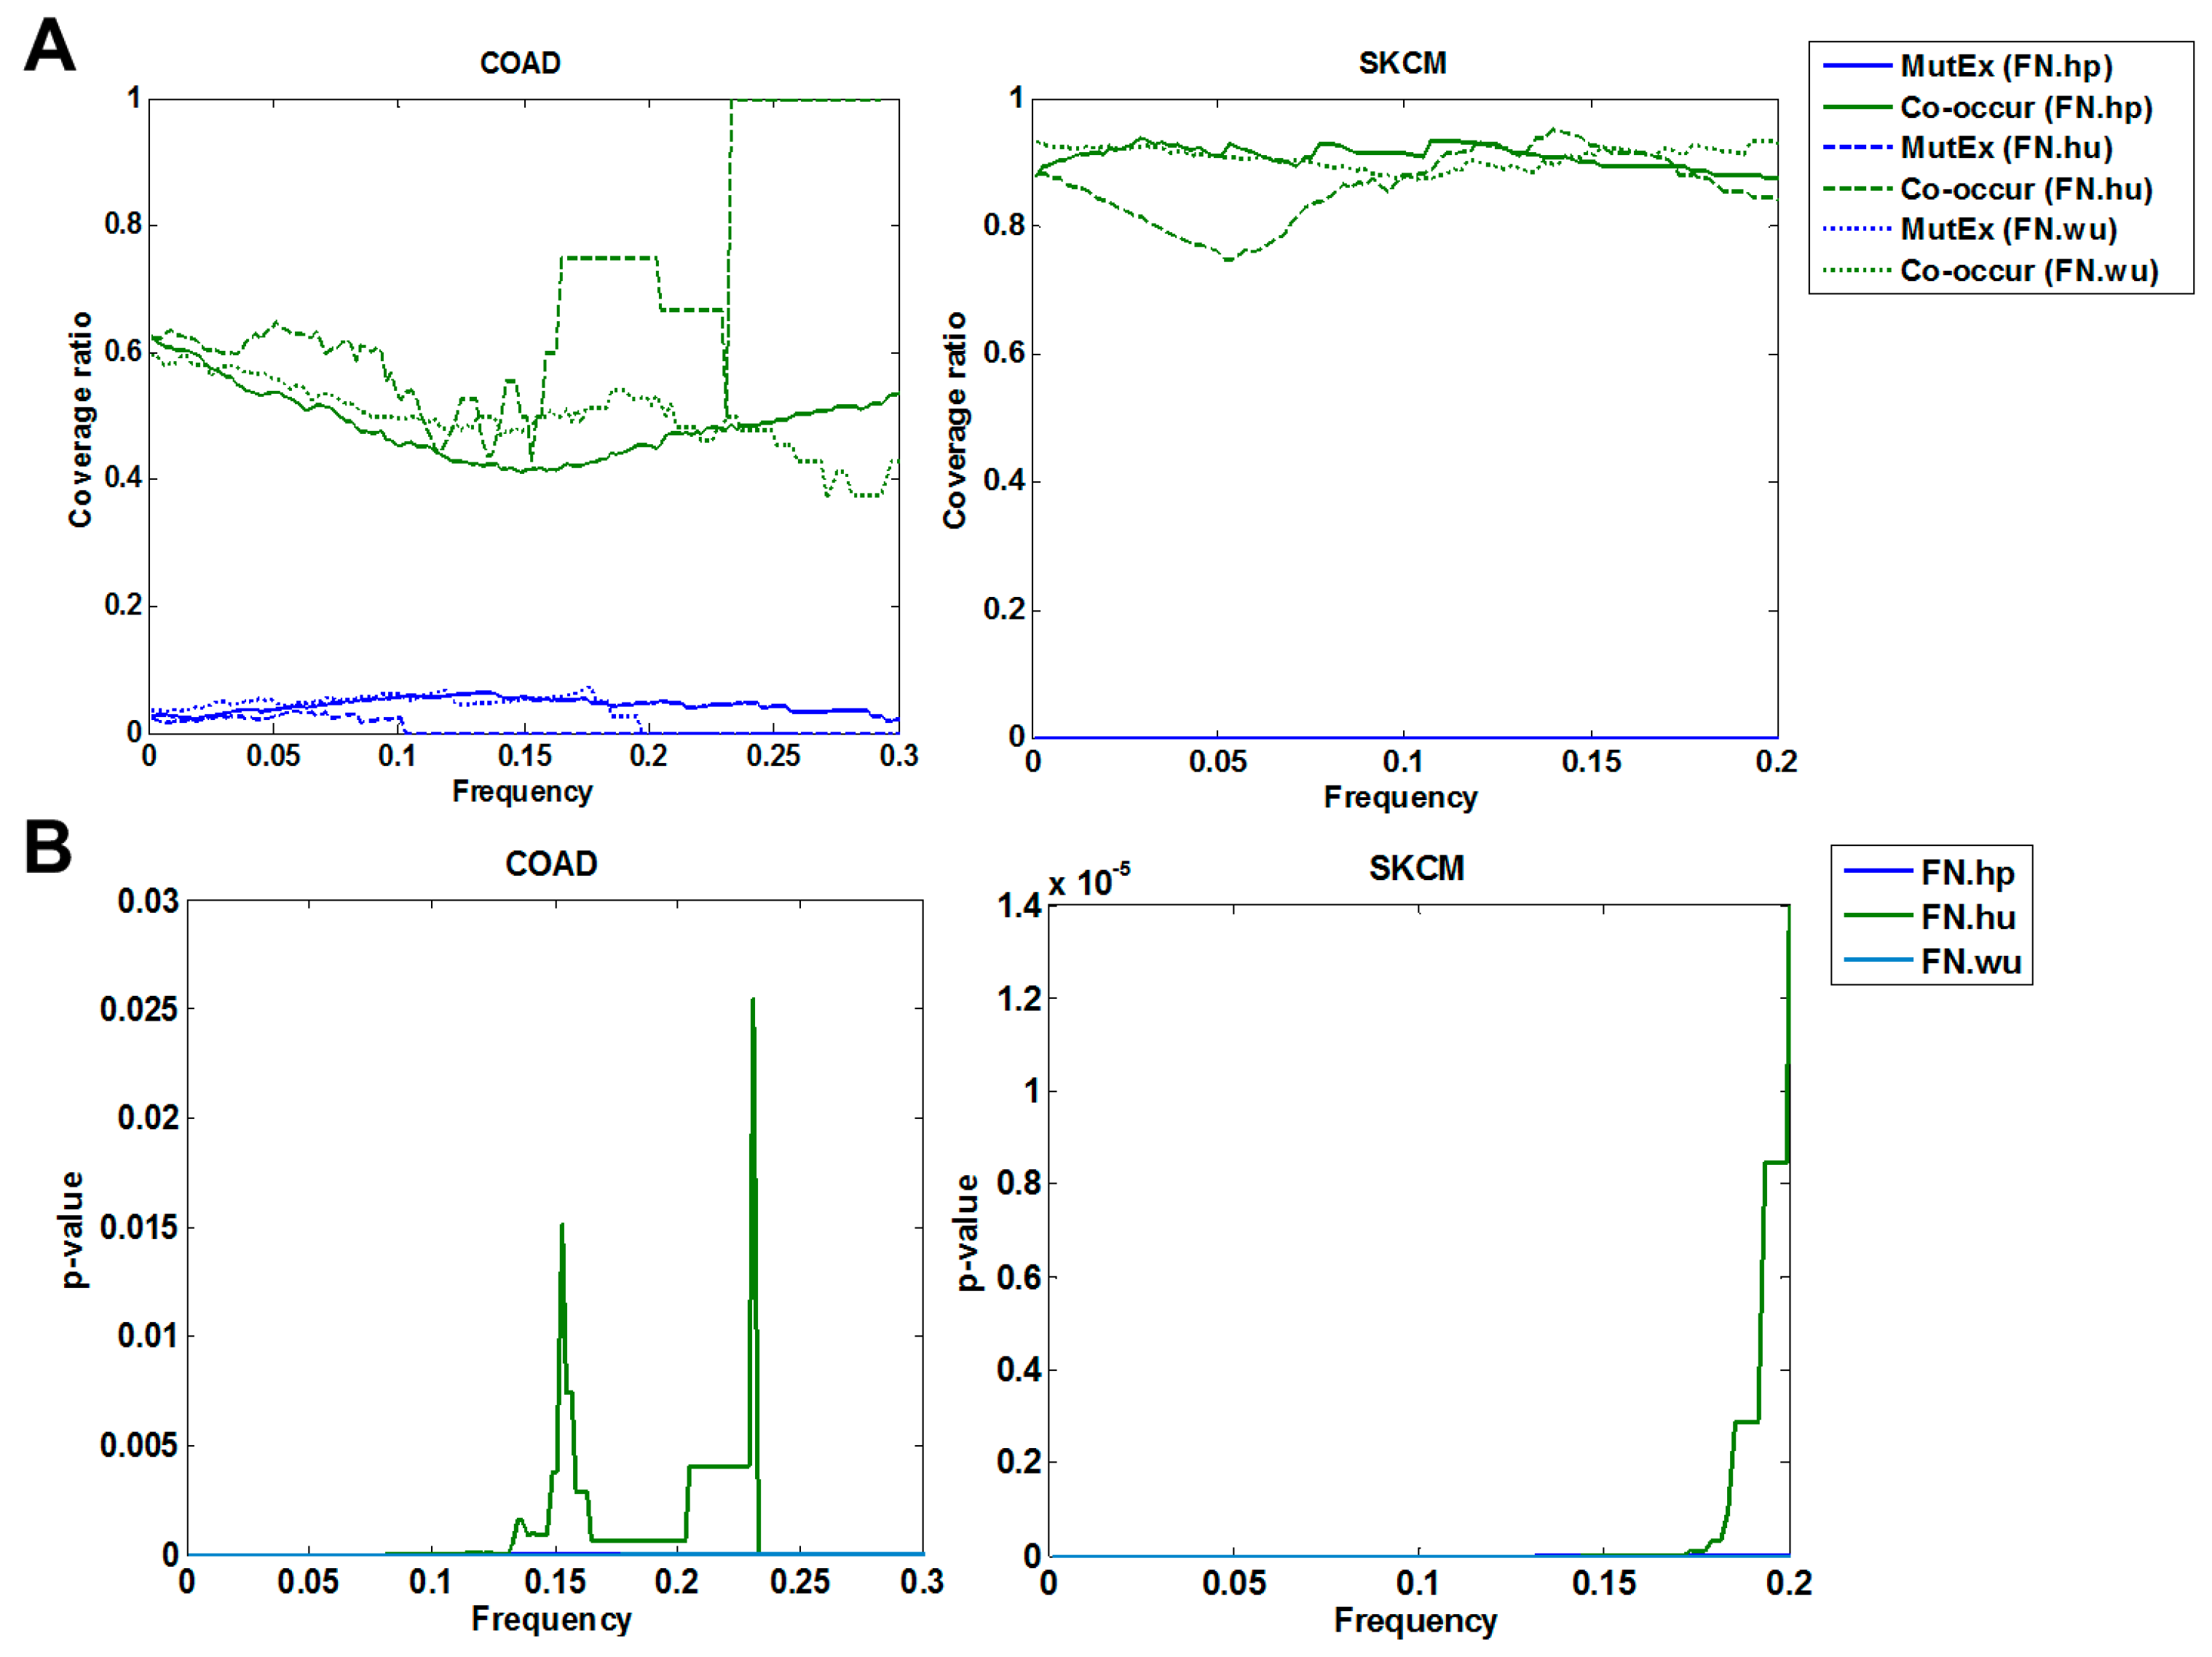
2.2.7. Co-Occurrence and Mutual Exclusivity
3. Results and Discussion
3.1. Validation of Fitness Relationships
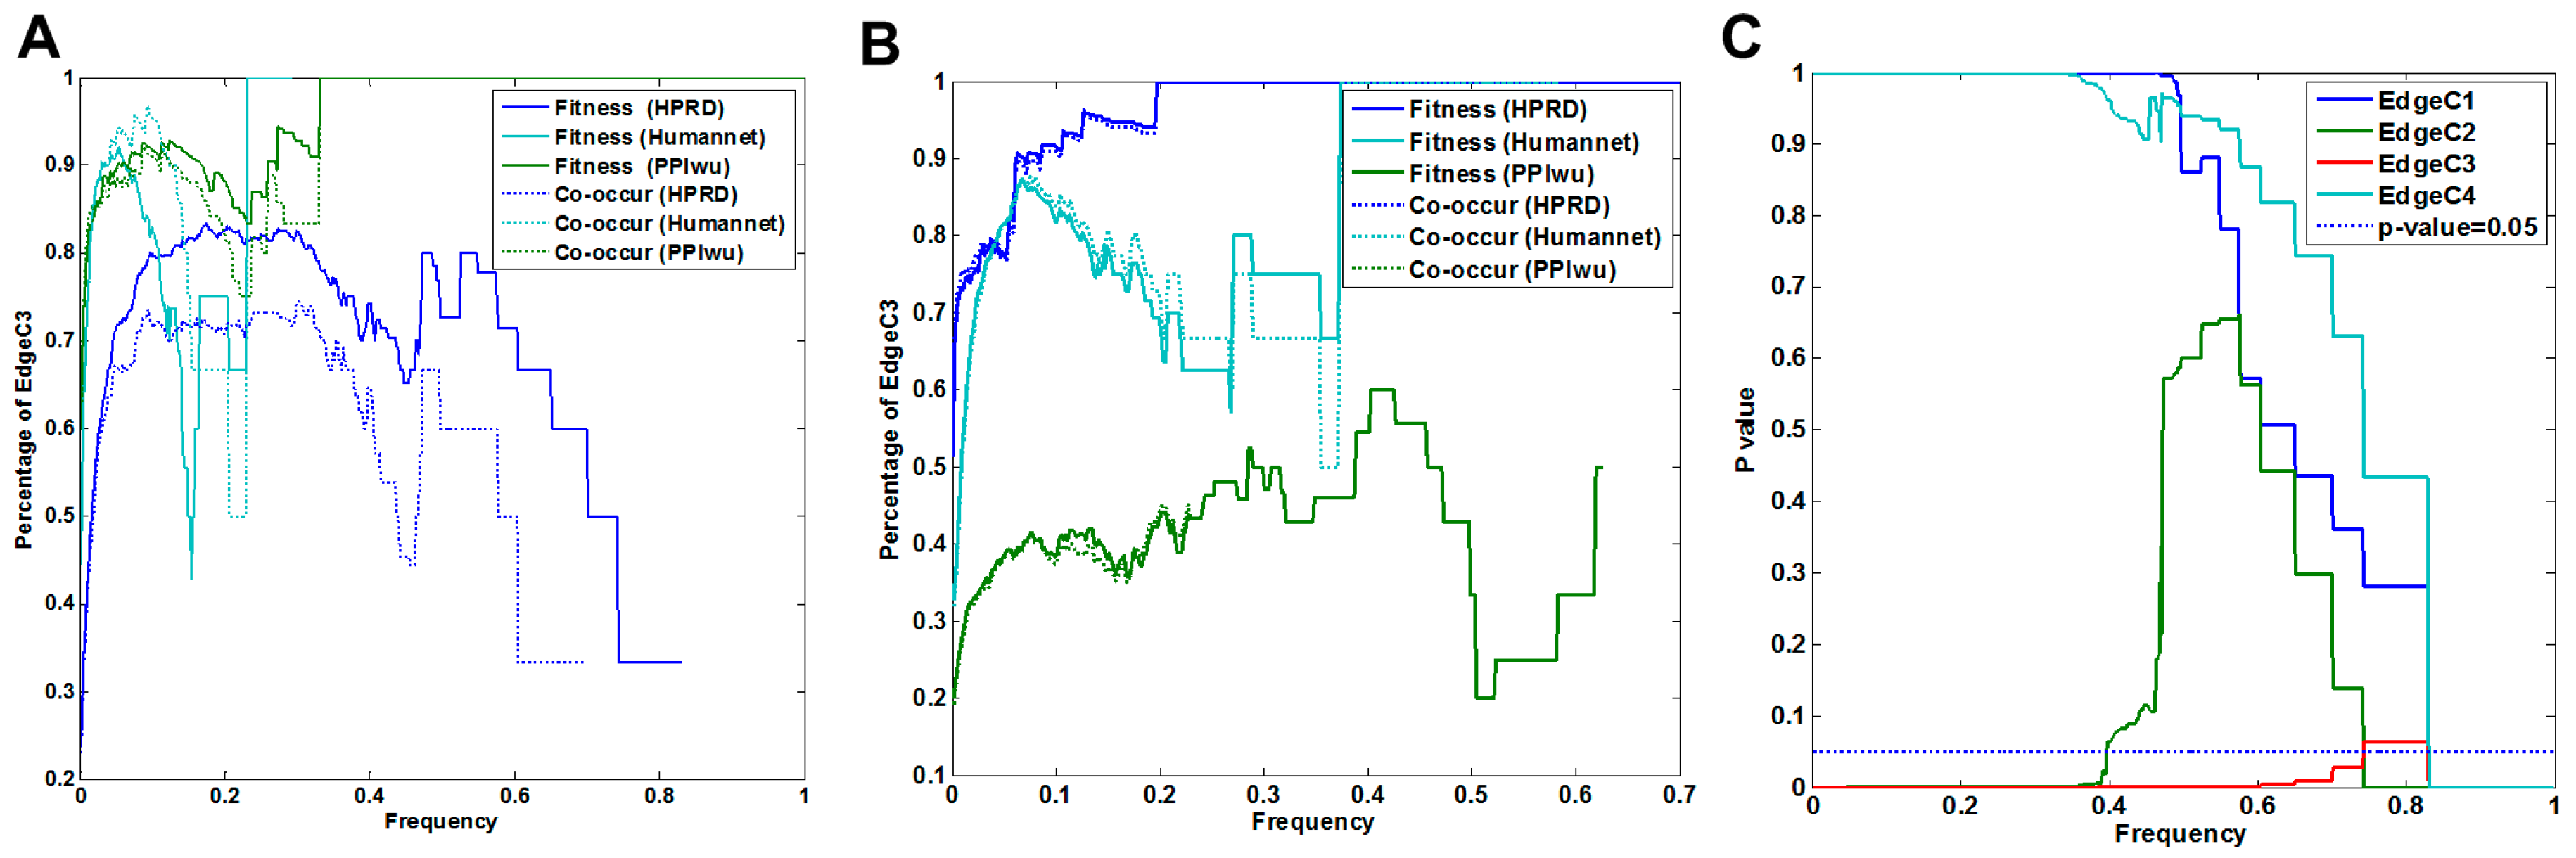
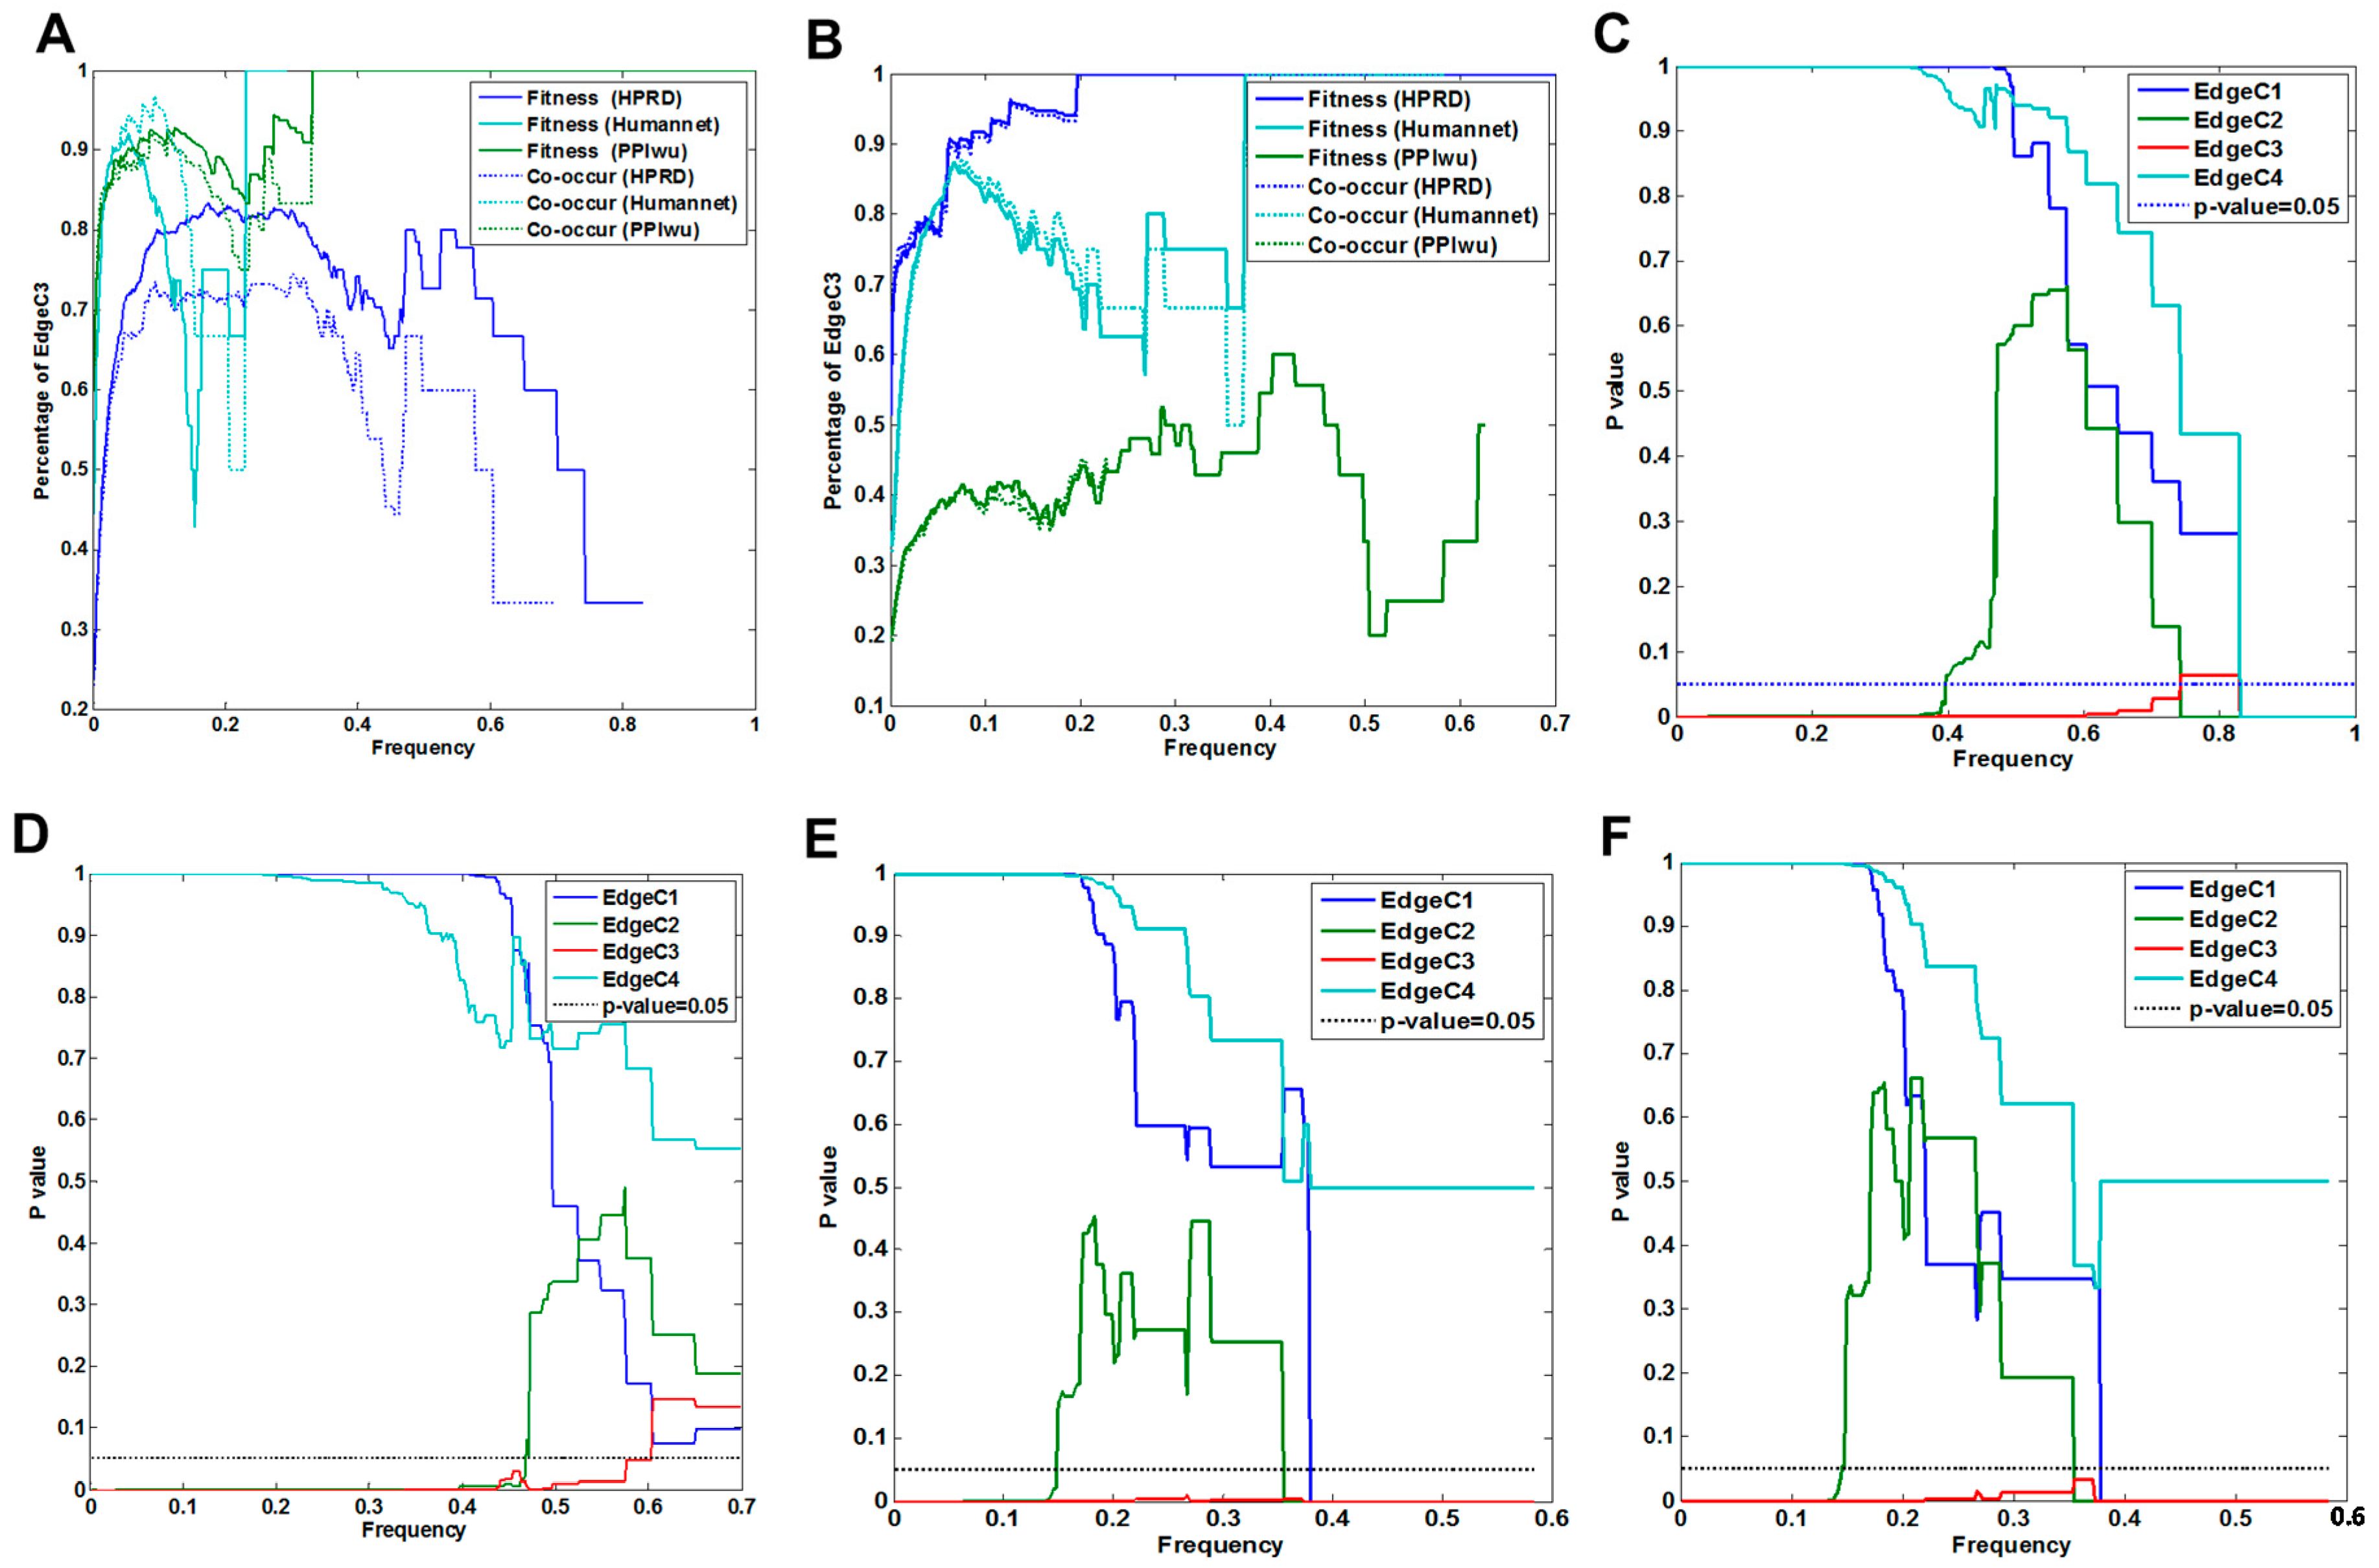
3.1.1. Comparison of Fitness Networks
3.1.2. Cross Validation with Co-Occurrence and Mutual Exclusivity
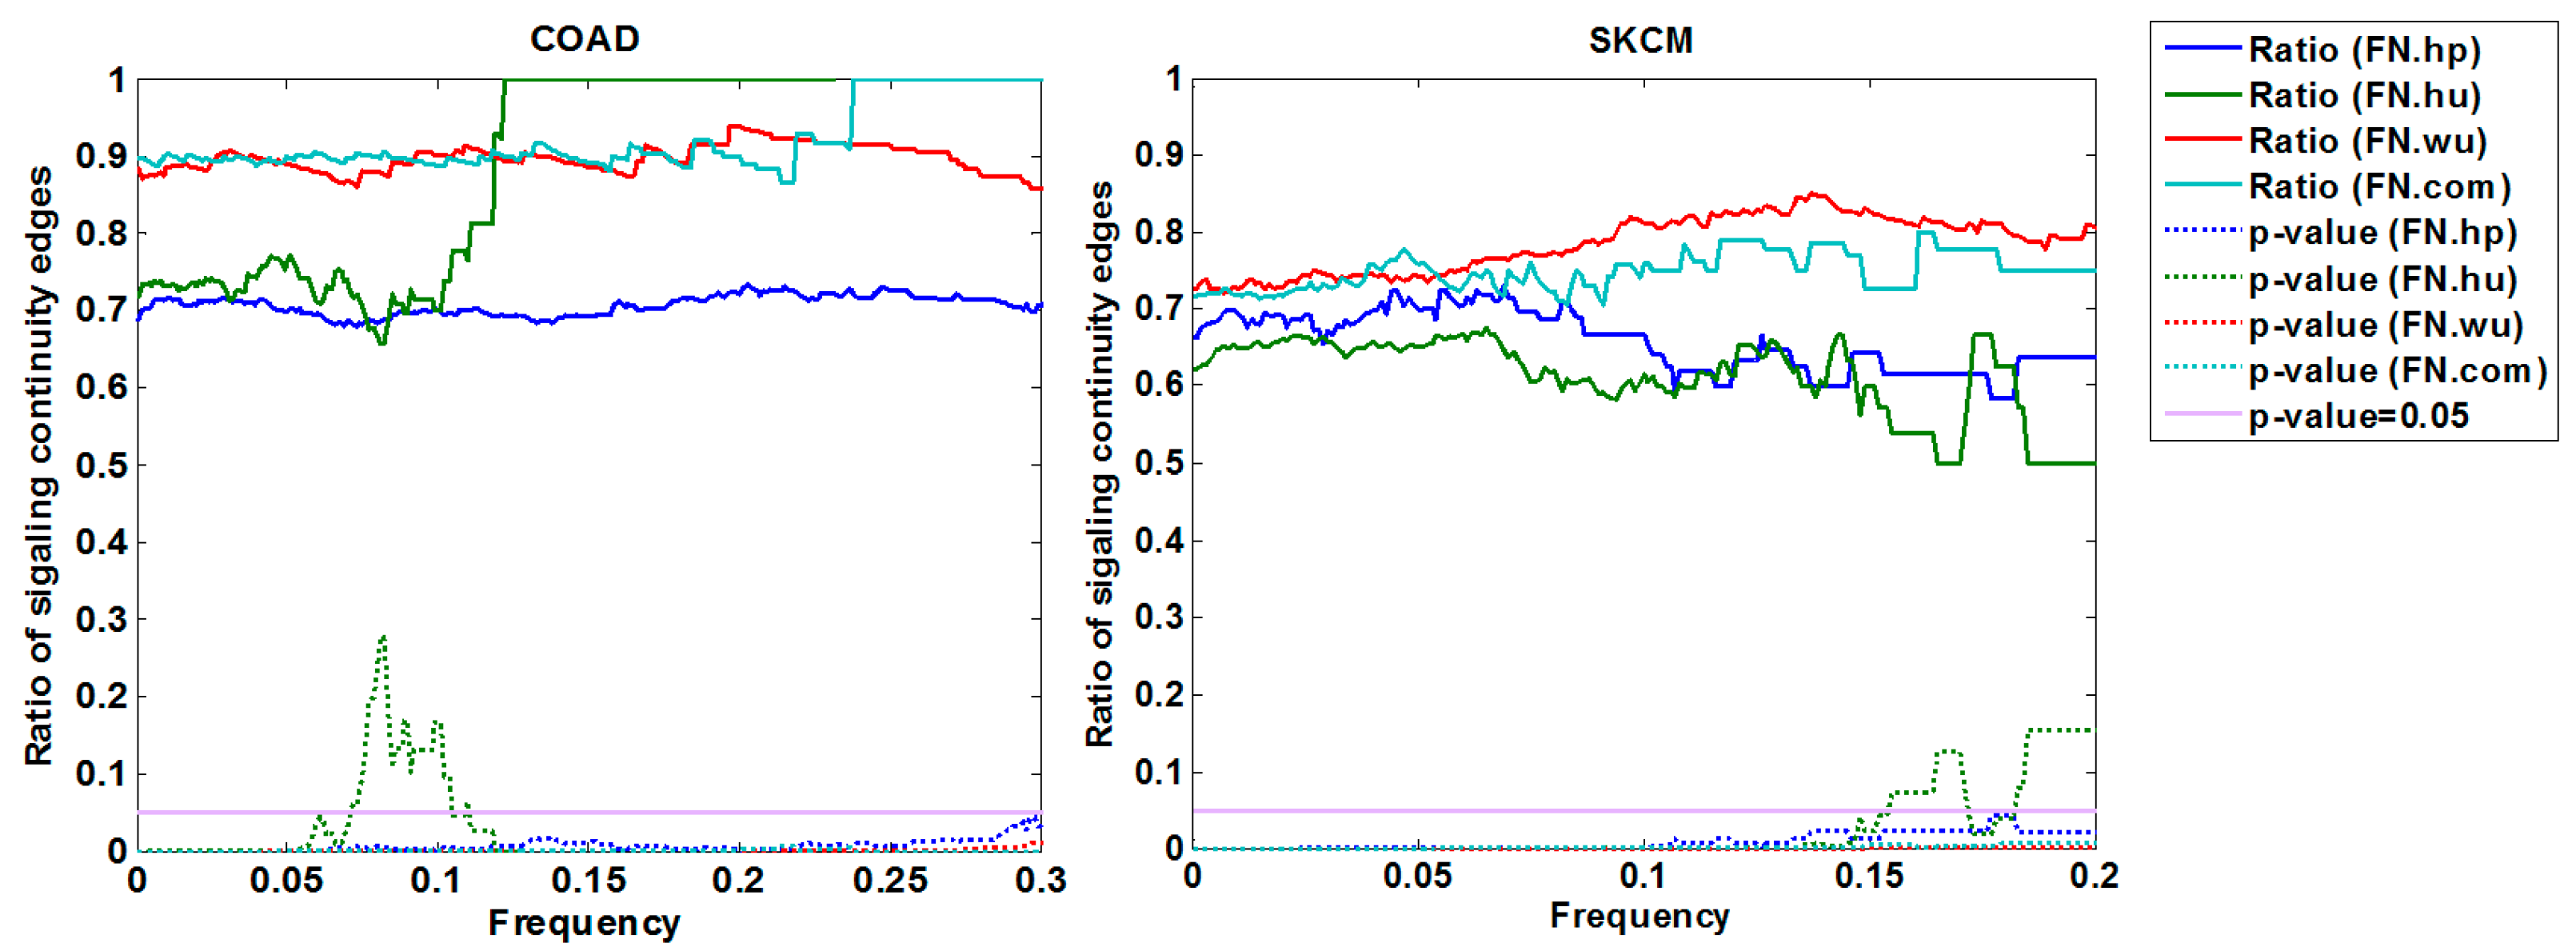
3.1.3. Cross-Validation with Signaling Network
3.2. Analysis of Fitness Core
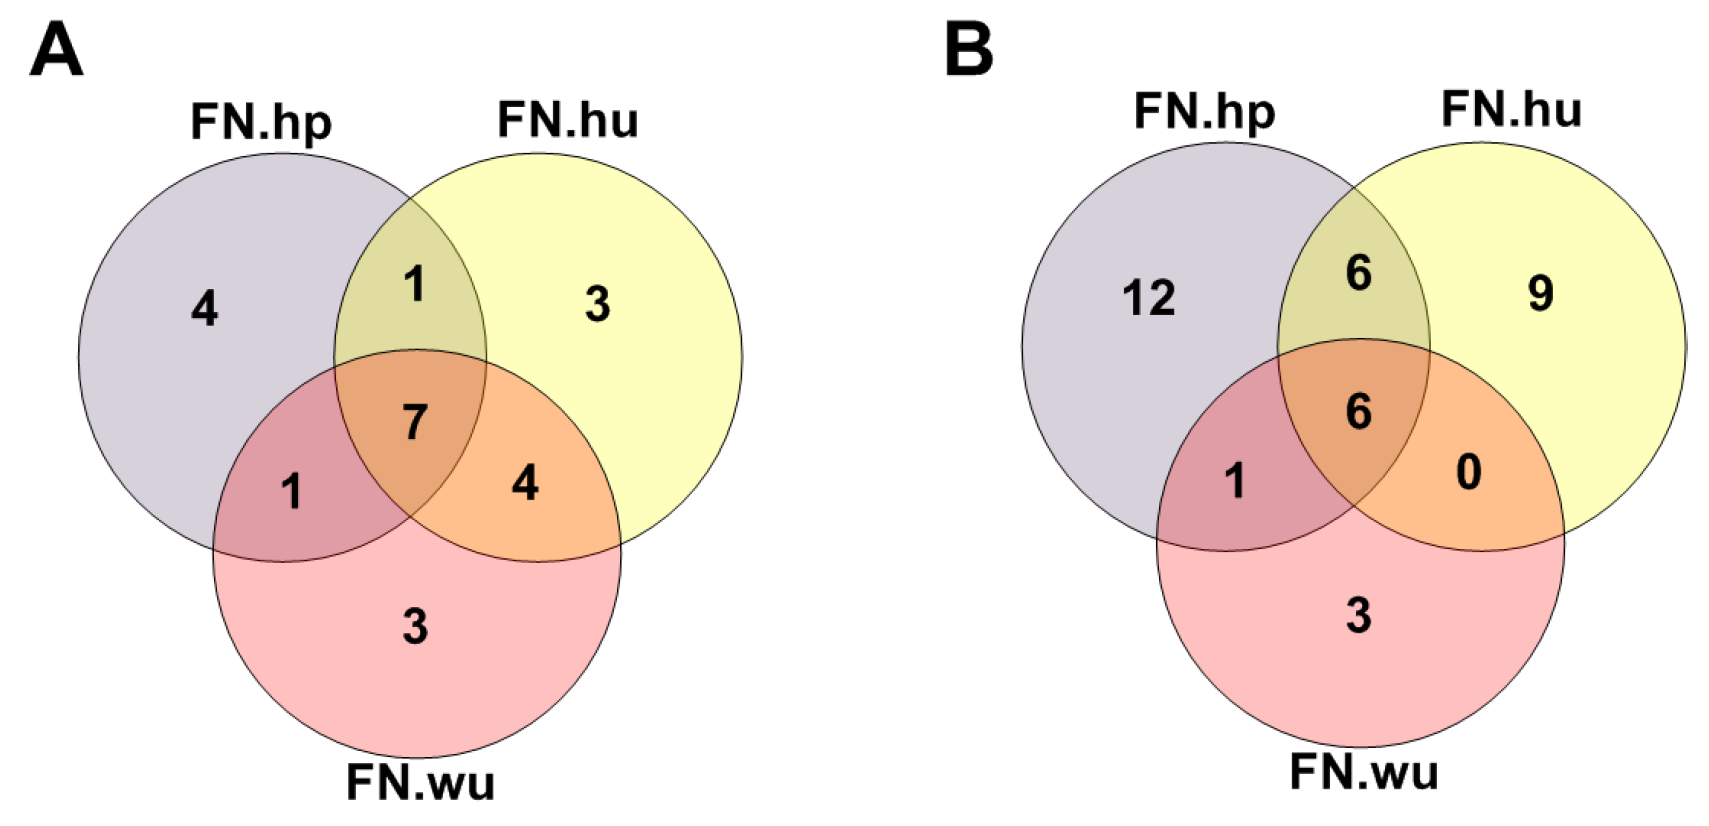
3.2.1. Fitness Core Are Consistent across Fitness Networks
3.2.2. Fitness Core Serves as Common Selective targets of the Majority of Driver Genes
3.2.3. Fitness Core Covers the Majority of Tumor Samples by Minor Genes
3.2.4. Genes in the Fitness Core Play Key Roles in Carcinogenesis and Therapeutic Intervention
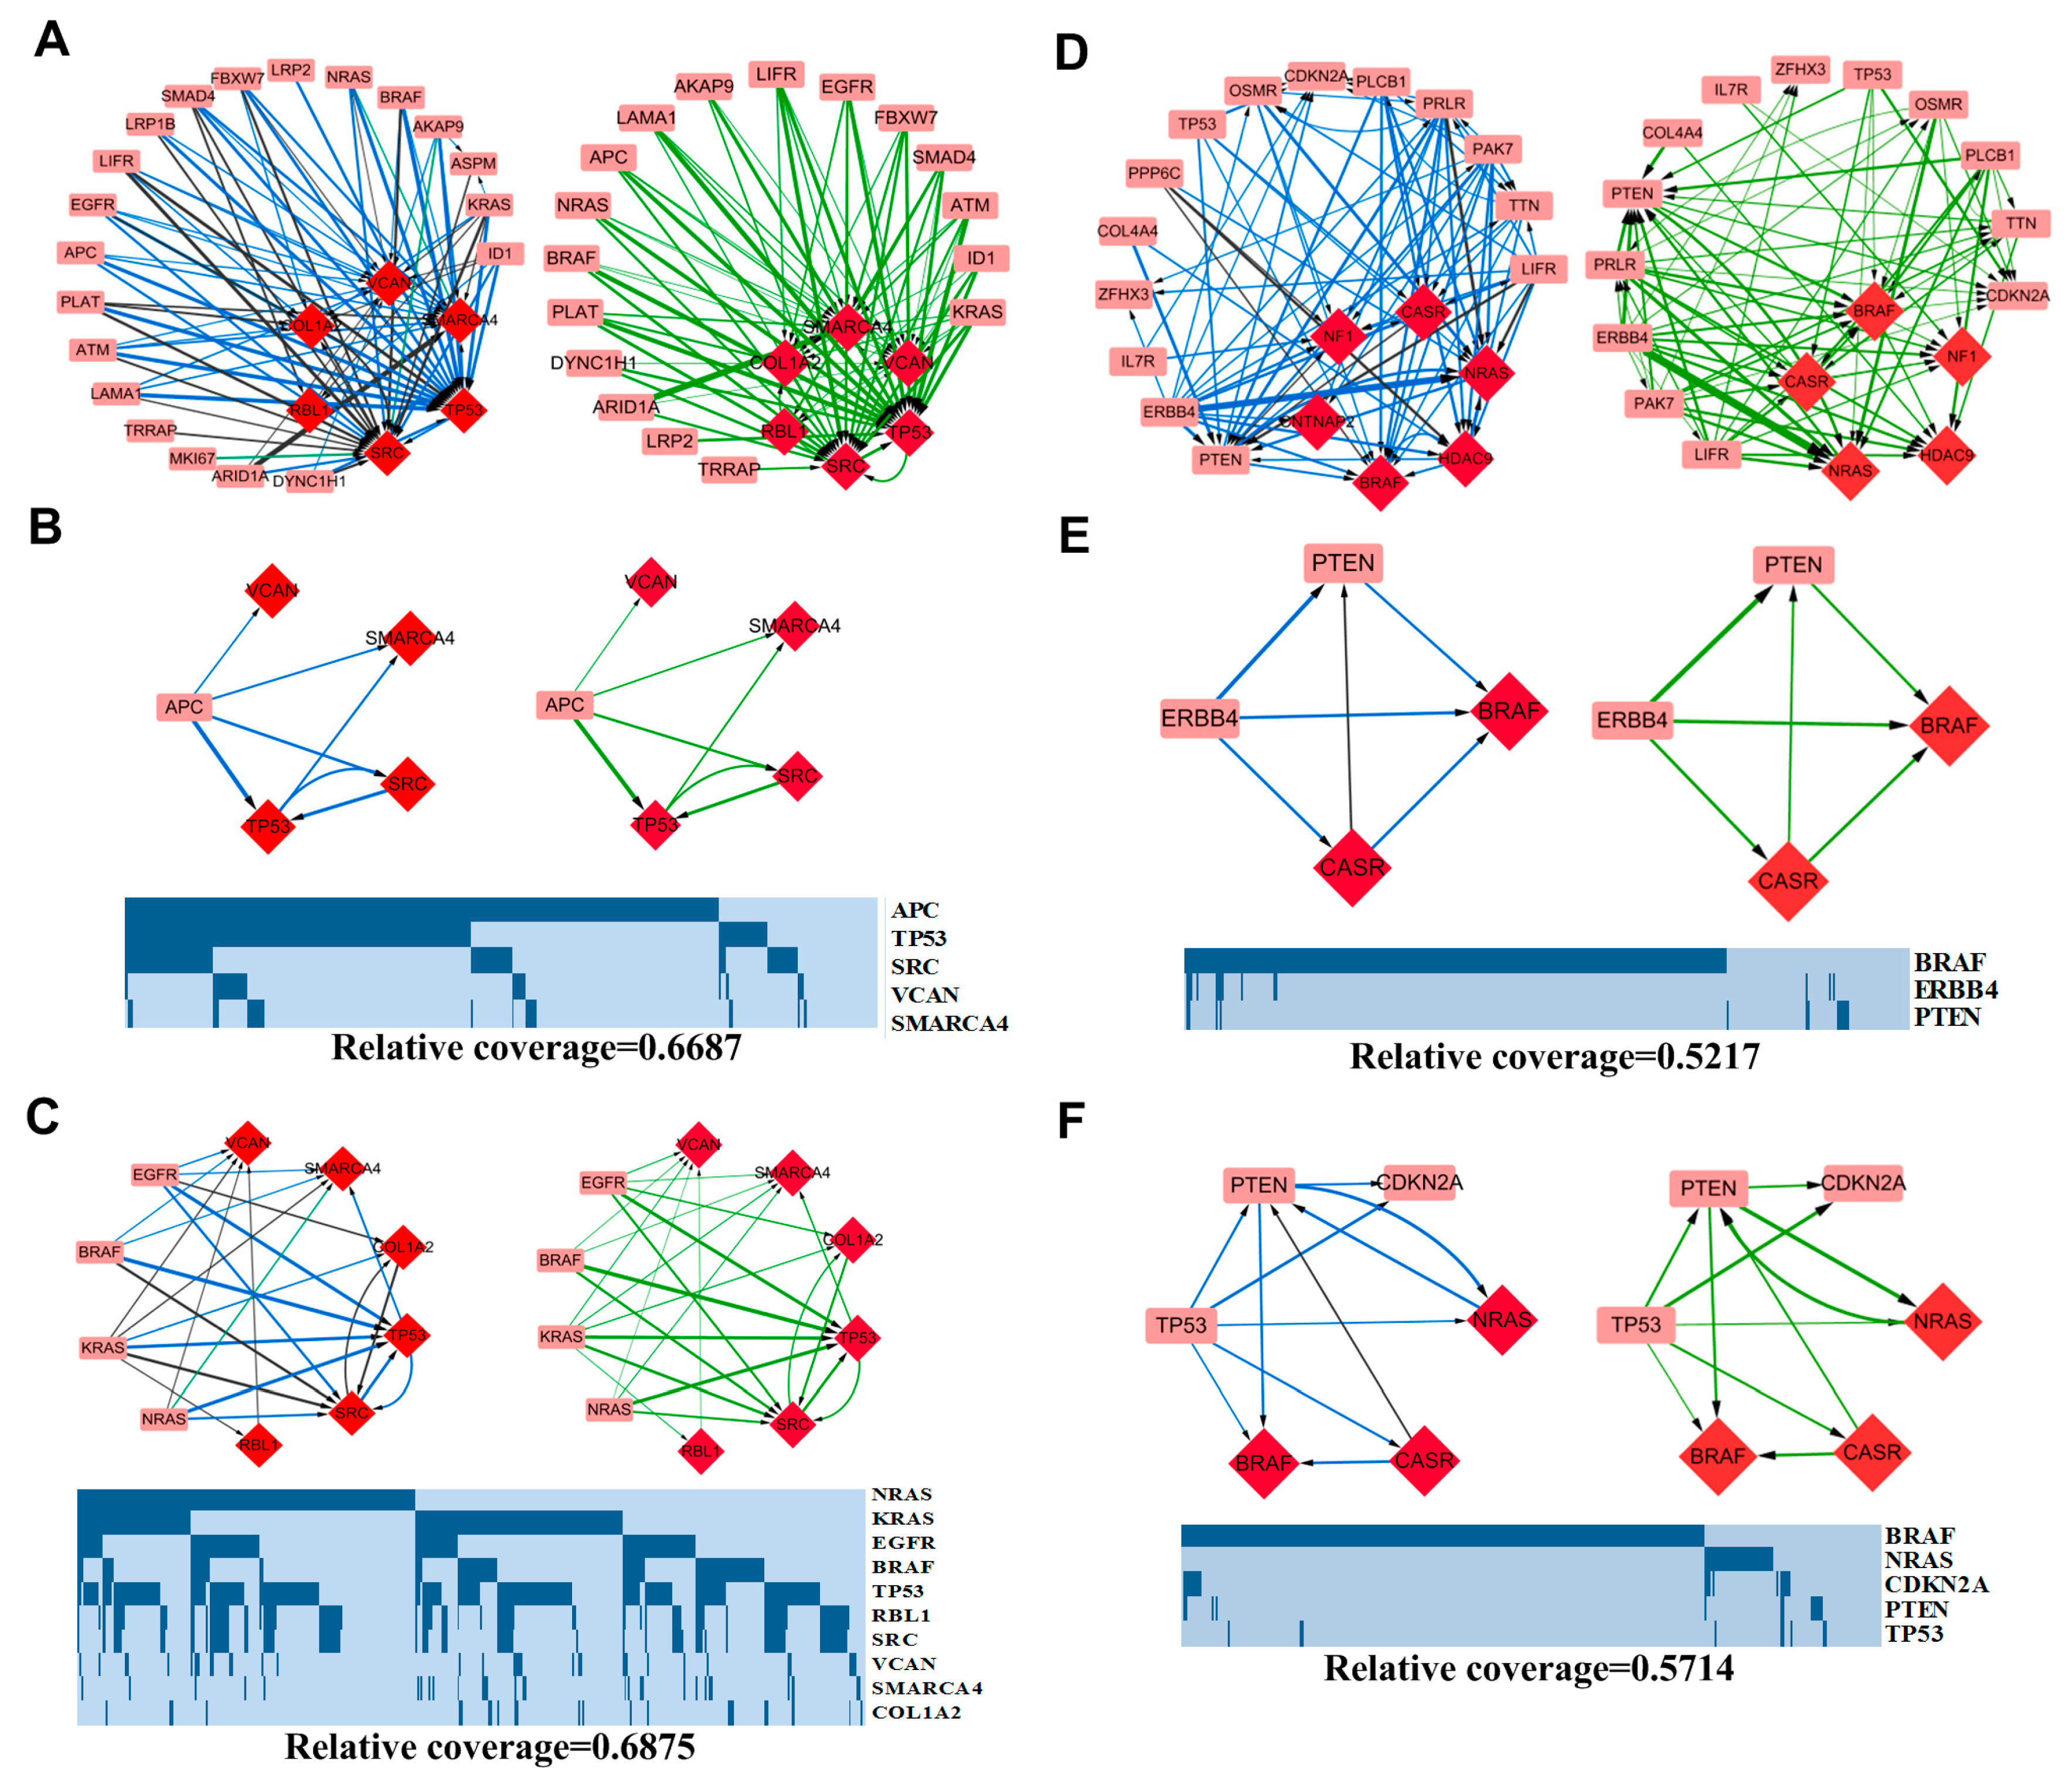
3.3. Pattern Analysis
3.3.1. APC-Related Patterns in COAD
3.3.2. MAPK Signaling Pathway-Related Patterns in COAD
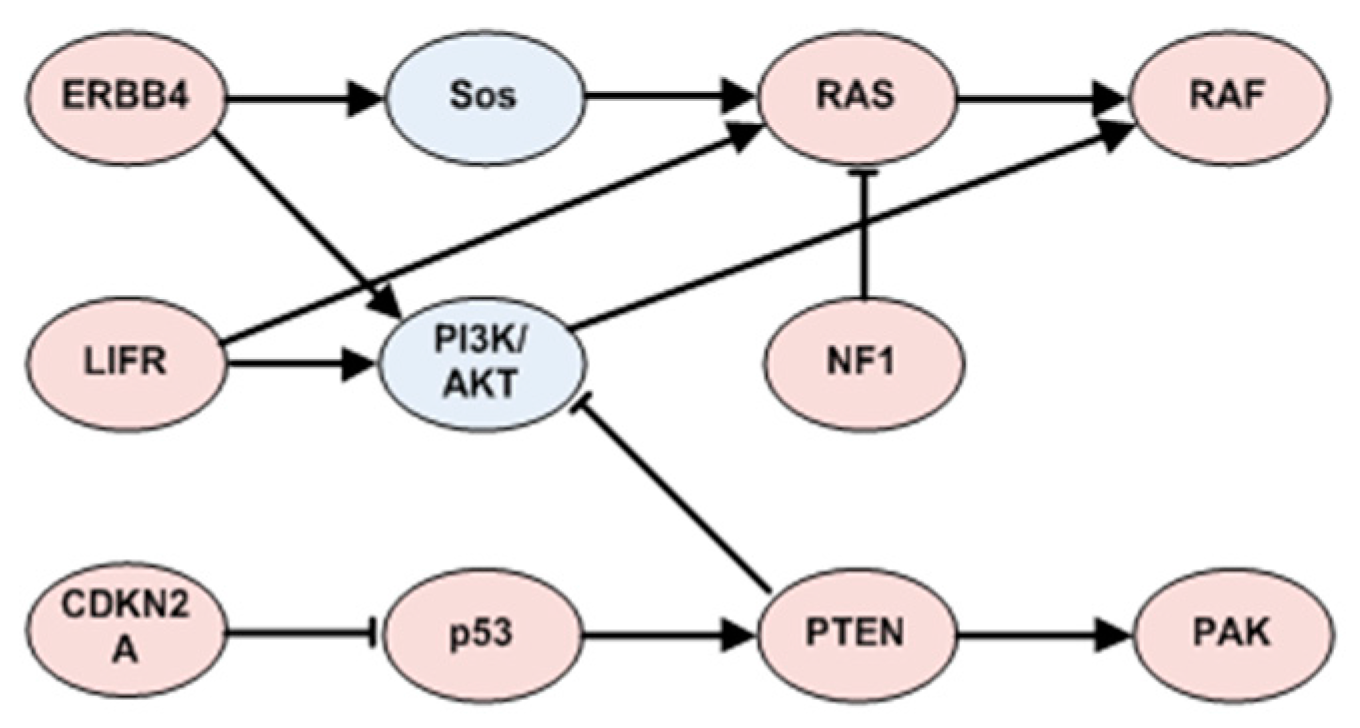
3.3.3. ERBB4 Related Patterns in SKCM
3.3.4. TP53 Related Patterns in SKCM
4. Conclusions
Supplementary Materials
Acknowledgments
Author Contributions
Conflicts of Interest
References
- Akavia, U.D.; Litvin, O.; Kim, J.; Sanchez-Garcia, F.; Kotliar, D.; Causton, H.C.; Pochanard, P.; Mozes, E.; Garraway, L.A.; Pe’er, D. An Integrated Approach to Uncover Drivers of Cancer. Cell 2010, 143, 1005–1017. [Google Scholar] [CrossRef] [PubMed]
- Bozic, I.; Antal, T.; Ohtsuki, H.; Carter, H.; Kim, D.; Chen, S.; Karchin, R.; Kinzler, K.W.; Vogelstein, B.; Nowak, M.A. Accumulation of driver and passenger mutations during tumor progression. Proc. Natl. Acad. Sci. USA 2010, 107, 18545–18550. [Google Scholar] [CrossRef] [PubMed]
- Torkamani, A.; Schork, N.J. Identification of rare cancer driver mutations by network reconstruction. Genome Res. 2009, 19, 1570–1578. [Google Scholar] [CrossRef] [PubMed]
- Torkamani, A.; Schork, N.J. Prediction of Cancer Driver Mutations in Protein Kinases. Cancer Res. 2008, 68, 1675–1682. [Google Scholar] [CrossRef] [PubMed]
- Youn, A.; Simon, R. Identifying cancer driver genes in tumor genome sequencing studies. Bioinformatics 2010, 27, 175–181. [Google Scholar] [CrossRef] [PubMed]
- Vandin, F.; Upfal, E.; Raphael, B.J. De novo discovery of mutated driver pathways in cancer. Genome Res. 2012, 22, 375–385. [Google Scholar] [CrossRef] [PubMed]
- Zhao, J.; Zhang, S.; Wu, L.-Y.; Zhang, X.-S. Efficient methods for identifying mutated driver pathways in cancer. Bioinformatics 2012, 28, 2940–2947. [Google Scholar] [CrossRef] [PubMed]
- Leiserson, M.D.M.; Blokh, D.; Sharan, R.; Raphael, B.J. Simultaneous Identification of Multiple Driver Pathways in Cancer. PLoS Comput. Biol. 2013, 9, e1003054. [Google Scholar] [CrossRef] [PubMed]
- Hudson, A.M.; Yates, T.; Li, Y.; Trotter, E.W.; Fawdar, S.; Chapman, P.; Lorigan, P.; Biankin, A.; Miller, C.J.; Brognard, J. Discrepancies in Cancer Genomic Sequencing Highlight Opportunities for Driver Mutation Discovery. Cancer Res. 2014, 74, 6390–6396. [Google Scholar] [CrossRef] [PubMed]
- Méniel, V.; Megges, M.; Young, M.A.; Cole, A.; Sansom, O.J.; Clarke, A.R. Apc and p53 interaction in DNA damage and genomic instability in hepatocytes. Oncogene 2015, 34, 4118–4129. [Google Scholar] [CrossRef] [PubMed]
- Tomczak, K.; Czerwińska, P.; Wiznerowicz, M. The Cancer Genome Atlas (TCGA): An immeasurable source of knowledge. Contemp. Oncol. 2015, 19, 68–77. [Google Scholar] [CrossRef] [PubMed]
- Barrett, T.; Edgar, R. Gene Expression Omnibus (GEO): Microarray data storage, submission, retrieval, and analysis. Methods Enzymol. 2006, 411, 352–369. [Google Scholar] [PubMed]
- Raskin, L.; Fullen, D.R.; Giordano, T.J.; Thomas, D.G.; Frohm, M.L.; Cha, K.B.; Ahn, J.; Mukherjee, B.; Johnson, T.M.; Gruber, S.B. Transcriptome Profiling Identifies HMGA2 as a Biomarker of Melanoma Progression and Prognosis. J. Investig. Dermatol. 2013, 133, 2585–2592. [Google Scholar] [CrossRef] [PubMed]
- Ciriello, G.; Cerami, E.; Sander, C.; Schultz, N. Mutual exclusivity analysis identifies oncogenic network modules. Genome Res. 2012, 22, 398–406. [Google Scholar] [CrossRef] [PubMed]
- Prasad, T.S.K.; Goel, R.; Kandasamy, K.; Keerthikumar, S.; Kumar, S.; Mathivanan, S.; Telikicherla, D.; Raju, R.; Shafreen, B.; Venugopal, A.; et al. Human Protein Reference Database—2009 update. Nucleic Acids Res. 2009, 37, D767–D772. [Google Scholar] [CrossRef] [PubMed]
- Lee, I.; Blom, U.M.; Wang, P.I.; Shim, J.E.; Marcotte, E.M. Prioritizing candidate disease genes by network-based boosting of genome-wide association data. Genome Res. 2011, 21, 1109–1121. [Google Scholar] [CrossRef] [PubMed]
- Wu, G.; Feng, X.; Stein, L. A human functional protein interaction network and its application to cancer data analysis. Genome Biol. 2010, 11, R53. [Google Scholar] [CrossRef] [PubMed]
- Babur, Ö.; Gönen, M.; Aksoy, B.A.; Schultz, N.; Ciriello, G.; Sander, C.; Demir, E. Systematic identification of cancer driving signaling pathways based on mutual exclusivity of genomic alterations. Genome Biol. 2015, 16, 45. [Google Scholar] [CrossRef] [PubMed]
- Cheng, W.C.; Chung, I.F.; Chen, C.Y.; Sun, H.J.; Fen, J.J.; Tang, W.C.; Chang, T.Y.; Wong, T.T.; Wang, H.W. DriverDB: An exome sequencing database for cancer driver gene identification. Nucleic Acids Res. 2014, 42, D1048–D1054. [Google Scholar] [CrossRef] [PubMed]
- Lawrence, M.S.; Stojanov, P.; Polak, P.; Kryukov, G.V.; Cibulskis, K.; Sivachenko, A.; Carter, S.L.; Stewart, C.; Mermel, C.H.; Roberts, S.A.; et al. Mutational heterogeneity in cancer and the search for new cancer genes. Nature 2013, 499, 214–218. [Google Scholar] [CrossRef] [PubMed]
- Dees, N.D.; Zhang, Q.; Kandoth, C.; Wendl, M.C.; Schierding, W.; Koboldt, D.C.; Mooney, T.B.; Callaway, M.B.; Dooling, D.; Mardis, E.R.; et al. MuSiC: Identifying mutational significance in cancer genomes. Genome Res. 2012, 22, 1589–1598. [Google Scholar] [CrossRef] [PubMed]
- Reimand, J.; Bader, G.D. Systematic analysis of somatic mutations in phosphorylation signaling predicts novel cancer drivers. Mol. Syst. Biol. 2013, 9, 637. [Google Scholar] [CrossRef] [PubMed]
- Cerami, E.; Demir, E.; Schultz, N.; Taylor, B.S.; Sander, C. Automated Network Analysis Identifies Core Pathways in Glioblastoma. PLoS ONE 2010, 5, e8918. [Google Scholar] [CrossRef] [PubMed]
- Lee, E.; Chuang, H.-Y.; Kim, J.-W.; Ideker, T.; Lee, D. Inferring Pathway Activity toward Precise Disease Classification. PLoS Comput. Biol. 2008, 4, e1000217. [Google Scholar] [CrossRef] [PubMed]
- Grijelmo, C.; Rodrigue, C.; Svrcek, M.; Bruyneel, E.; Hendrix, A.; de Wever, O.; Gespach, C. Proinvasive activity of BMP-7 through SMAD4/src -independent and ERK/Rac /JNK -dependent signaling pathways in colon cancer cells. Cell. Signal. 2007, 19, 1722–1732. [Google Scholar] [CrossRef] [PubMed]
- Motoyama, K.; Tanaka, F.; Kosaka, Y.; Mimori, K.; Uetake, H.; Inoue, H.; Sugihara, K.; Mori, M. Clinical Significance of BMP7 in Human Colorectal Cancer. Ann. Surg. Oncol. 2008, 15, 1530–1537. [Google Scholar] [CrossRef] [PubMed]
- Lapenna, S.; Giordano, A. Cell cycle kinases as therapeutic targets for cancer. Nat. Rev. Drug Discov. 2009, 8, 547–566. [Google Scholar] [CrossRef] [PubMed]
- Sidle, A.; Palaty, C.; Dirks, P.; Wiggan, O.N.; Kiess, M.; Gill, R.M.; Wong, A.K.; Hamel, P.A. Activity of the Retinoblastoma Family Proteins, pRB, p107, and p130, during Cellular Proliferation and Differentiation. Crit. Rev. Biochem. Mol. Biol. 1996, 31, 237–271. [Google Scholar] [CrossRef] [PubMed]
- Sun, A.; Bagella, L.; Tutton, S.; Romano, G.; Giordano, A. From G0 to S phase: A view of the roles played by the retinoblastoma (Rb) family members in the Rb-E2F pathway. J. Cell. Biochem. 2007, 102, 1400–1404. [Google Scholar] [CrossRef] [PubMed]
- Medina, P.P.; Sanchez-Cespedes, M. Involvement of the chromatin-remodeling factor BRG1/SMARCA4 in human cancer. Epigenetics 2008, 3, 64–68. [Google Scholar] [CrossRef] [PubMed]
- Reisman, D.; Glaros, S.; Thompson, E.A. The SWI/SNF complex and cancer. Oncogene 2009, 28, 1653–1668. [Google Scholar] [CrossRef] [PubMed]
- Biegel, J.A.; Busse, T.M.; Weissman, B.E. SWI/SNF Chromatin Remodeling Complexes and Cancer. Am. J. Med. Genet. Part C Semin. Med. Genet. 2014, 166, 350–366. [Google Scholar] [CrossRef] [PubMed]
- Mao, W.; Irby, R.; Coppola, D.; Fu, L.; Wloch, M.; Turner, J.; Yu, H.; Garcia, R.; Jove, R.; Yeatman, T.J. Activation of c-Src by receptor tyrosine kinases in human colon cancer cells with high metastatic potential. Oncogene 1997, 15, 3083–3090. [Google Scholar] [CrossRef] [PubMed]
- Chen, J. Is Src the key to understanding metastasis and developing new treatments for colon cancer? Nat. Clin. Pract. Gastroenterol. Hepatol. 2008, 5, 306–307. [Google Scholar] [CrossRef] [PubMed]
- Brunton, V.G.; Ozanne, B.W.; Paraskeva, C.; Frame, M.C. A role for epidermal growth factor receptor, c-Src and focal adhesion kinase in an in vitro model for the progression of colon cancer. Oncogene 1997, 14, 283–293. [Google Scholar] [CrossRef] [PubMed]
- Hollstein, M.; Sidransky, D.; Vogelstein, B.; Harris, C.C. p53 mutations in human cancers. Science 1991, 253, 49–53. [Google Scholar] [CrossRef] [PubMed]
- Bouvet, M.; Ellis, L.M.; Nishizaki, M.; Fujiwara, T.; Liu, W.; Bucana, C.D.; Fang, B.; Lee, J.J.; Roth, J.A. Adenovirus-mediated Wild-Type p53 Gene Transfer Down-Regulates Vascular Endothelial Growth Factor Expression and Inhibits Angiogenesis in Human Colon Cancer. Cancer Res. 1998, 58, 2288–2292. [Google Scholar] [PubMed]
- Resnick, M.B.; Routhier, J.; Konkin, T.; Sabo, E.; Pricolo, V.E. Epidermal Growth Factor Receptor, c-MET, β-Catenin, and p53 Expression as Prognostic Indicators in Stage II Colon Cancer: A Tissue Microarray Study. Clin. Cancer Res. 2004, 10, 3069–3075. [Google Scholar] [CrossRef] [PubMed]
- Chapman, P.B.; Hauschild, A.; Robert, C.; Haanen, J.B.; Ascierto, P.; Larkin, J.; Dummer, R.; Garbe, C.; Testori, A.; Maio, M.; et al. Improved Survival with Vemurafenib in Melanoma with BRAF V600E Mutation. N. Engl. J. Med. 2011, 364, 2507–2516. [Google Scholar] [CrossRef] [PubMed]
- Bollag, G.; Hirth, P.; Tsai, J.; Zhang, J.; Ibrahim, P.N.; Cho, H.; Spevak, W.; Zhang, C.; Zhang, Y.; Habets, G.; et al. Clinical efficacy of a RAF inhibitor needs broad target blockade in BRAF-mutant melanoma. Nature 2010, 467, 596–599. [Google Scholar] [CrossRef] [PubMed]
- Maldonado, J.L.; Fridlyand, J.; Patel, H.; Jain, A.N.; Busam, K.; Kageshita, T.; Ono, T.; Albertson, D.G.; Pinkel, D.; Bastian, B.C. Determinants of BRAF mutations in primary melanomas. J. Natl. Cancer Inst. 2003, 95, 1878–1890. [Google Scholar] [CrossRef] [PubMed]
- Pavey, S.; Spoerri, L.; Haass, N.K.; Gabrielli, B. DNA repair and cell cycle checkpoint defects as drivers and therapeutic targets in melanoma. Pigment Cell Melanoma Res. 2013, 26, 805–816. [Google Scholar] [CrossRef] [PubMed]
- Dimitrova, N.; de Lange, T. MDC1 accelerates nonhomologous end-joining of dysfunctional telomeres. Genes Dev. 2006, 20, 3238–3243. [Google Scholar] [CrossRef] [PubMed]
- Nissan, M.H.; Pratilas, C.A.; Jones, A.M.; Ramirez, R.; Won, H.; Liu, C.; Tiwari, S.; Kong, L.; Hanrahan, A.J.; Yao, Z.; et al. Loss of NF1 in cutaneous melanoma is associated with RAS activation and MEK dependence. Cancer Res. 2014, 74, 2340–2350. [Google Scholar] [CrossRef] [PubMed]
- Johnson, M.R.; Look, A.T.; DeClue, J.E.; Valentine, M.B.; Lowy, D.R. Inactivation of the NF1 gene in human melanoma and neuroblastoma cell lines without impaired regulation of GTP.Ras. Proc. Natl. Acad. Sci. USA 1993, 90, 5539–5543. [Google Scholar] [CrossRef] [PubMed]
- Perkinson, N.G. Melanoma arising in a café au lait spot of neurofibromatosis. Am. J. Surg. 1957, 93, 1018–1020. [Google Scholar] [CrossRef]
- Maertens, O.; Johnson, B.; Hollstein, P.; Frederick, D.T.; Cooper, Z.A.; Messiaen, L.; Bronson, R.T.; McMahon, M.; Granter, S.; Flaherty, K.; et al. Elucidating distinct roles for NF1 in melanomagenesis. Cancer Discov. 2013, 3, 338–349. [Google Scholar] [CrossRef] [PubMed]
- Tsao, H.; Goel, V.; Wu, H.; Yang, G.; Haluska, F.G. Genetic Interaction between NRAS and BRAF Mutations and PTEN/MMAC1 Inactivation in Melanoma. J. Investig. Dermatol. 2004, 122, 337–341. [Google Scholar] [CrossRef] [PubMed]
- Omholt, K.; Platz, A.; Kanter, L.; Ringborg, U.; Hansson, J. NRAS and BRAF Mutations Arise Early during Melanoma Pathogenesis and Are Preserved throughout Tumor Progression. Clin. Cancer Res. 2003, 9, 6483–6488. [Google Scholar] [PubMed]
- Jakob, J.A.; Bassett, R.L.; Ng, C.S.; Curry, J.L.; Joseph, R.W.; Alvarado, G.C.; Rohlfs, M.L.; Richard, J.; Gershenwald, J.E.; Hwu, P.; et al. NRAS Mutation Status is an Independent Prognostic Factor in Metastatic Melanoma. Cancer 2012, 118, 4014–4023. [Google Scholar] [CrossRef] [PubMed]
- Kelleher, F.C.; McArthur, G.A. Targeting NRAS in Melanoma. Cancer J. 2012, 18, 132–136. [Google Scholar] [CrossRef] [PubMed]
- Paraiso, K.H.T.; Xiang, Y.; Rebecca, V.W.; Abel, E.V.; Chen, Y.A.; Munko, A.C.; Wood, E.; Fedorenko, I.V.; Sondak, V.K.; Anderson, A.R.A.; et al. PTEN loss confers BRAF inhibitor resistance to melanoma cells through the suppression of BIM expression. Cancer Res. 2011, 71, 2750–2760. [Google Scholar] [CrossRef] [PubMed]
- Madhunapantula, S.V.; Robertson, G.P. The PTEN-AKT3 Signaling Cascade as a Therapeutic Target in Melanoma. Pigment Cell Melanoma Res. 2009, 22, 400–419. [Google Scholar] [CrossRef] [PubMed]
- Steelman, L.S.; Bertrand, F.E.; McCubrey, J.A. The complexity of PTEN: Mutation, marker and potential target for therapeutic intervention. Expert Opin. Ther. Targets 2004, 8, 537–550. [Google Scholar] [CrossRef] [PubMed]
- Yu, J.; Wu, W.K.K.; Li, X.; He, J.; Li, X.-X.; Ng, S.S.M.; Yu, C.; Gao, Z.; Yang, J.; Li, M.; et al. Novel recurrently mutated genes and a prognostic mutation signature in colorectal cancer. Gut 2015, 64, 636–645. [Google Scholar] [CrossRef] [PubMed]
- De Wit, M.; Belt, E.J.T.; Diemen, P.M.D.; Carvalho, B.; Coupé, V.M.H.; Stockmann, H.B.A.C.; Bril, H.; Beliën, J.A.M.; Fijneman, R.J.A.; Meijer, G.A. Lumican and Versican Are Associated with Good Outcome in Stage II and III Colon Cancer. Ann. Surg. Oncol. 2013, 20 (Suppl. 3), 348–359. [Google Scholar] [CrossRef] [PubMed]
- Wagner, A.H.; Coffman, A.C.; Ainscough, B.J.; Spies, N.C.; Skidmore, Z.L.; Campbell, K.M.; Krysiak, K.; Pan, D.; McMichael, J.F.; Eldred, J.M.; et al. DGIdb 2.0: Mining clinically relevant drug–gene interactions. Nucleic Acids Res. 2016, 44, D1036–D1044. [Google Scholar] [CrossRef] [PubMed]
- Morin, P.J.; Sparks, A.B.; Korinek, V.; Barker, N.; Clevers, H.; Vogelstein, B.; Kinzler, K.W. Activation of β-Catenin-Tcf Signaling in Colon Cancer by Mutations in β-Catenin or APC. Science 1997, 275, 1787–1790. [Google Scholar] [CrossRef] [PubMed]
- Zhang, T.; Otevrel, T.; Gao, Z.; Gao, Z.; Ehrlich, S.M.; Fields, J.Z.; Boman, B.M. Evidence That APC Regulates Survivin Expression: A Possible Mechanism Contributing to the Stem Cell Origin of Colon Cancer. Cancer Res. 2001, 61, 8664–8667. [Google Scholar] [PubMed]
- Wu, G.S. The functional Interactions between the MAPK and p53 Signaling Pathways. Cancer Biol. Ther. 2004, 3, 156–161. [Google Scholar] [CrossRef] [PubMed]
- Lin, A.W.; Barradas, M.; Stone, J.C.; van Aelst, L.; Serrano, M.; Lowe, S.W. Premature senescence involving p53 and p16 is activated in response to constitutive MEK/MAPK mitogenic signaling. Genes Dev. 1998, 12, 3008–3019. [Google Scholar] [CrossRef] [PubMed]
- Santarpia, L.; Lippman, S.M.; El-Naggar, A.K. Targeting the MAPK–RAS–RAF signaling pathway in cancer therapy. Expert Opin. Ther. Targets 2012, 16, 103–119. [Google Scholar] [CrossRef] [PubMed]
- Young, A.; Lyons, J.; Miller, A.L.; Phan, V.T.; Alarcón, I.R.; McCormick, F. Chapter 1 Ras Signaling and Therapies. Adv. Cancer Res. 2009, 102, 1–17. [Google Scholar] [PubMed]
- Maurer, G.; Tarkowski, B.; Baccarini, M. Raf kinases in cancer-roles and therapeutic opportunities. Oncogene 2011, 30, 3477–3488. [Google Scholar] [CrossRef] [PubMed]
- Settleman, J. A Therapeutic Opportunity in Melanoma: ErbB4 Makes a Mark on Skin. Cancer Cell 2009, 16, 278–279. [Google Scholar] [CrossRef] [PubMed]
- Rudloff, U.; Samuels, Y. A growing family: Adding mutated Erbb4 as a novel cancer target. Cell Cycle 2010, 9, 1487–1503. [Google Scholar] [CrossRef] [PubMed]
- Kurppa, K.; Elenius, K. Mutated ERBB4: A novel drug target in metastatic melanoma? Pigment Cell Melanoma Res. 2009, 22, 708–710. [Google Scholar] [CrossRef] [PubMed]
- Kanehisa, M.; Sato, Y.; Kawashima, M.; Furumichi, M.; Tanabe, M. KEGG as a reference resource for gene and protein annotation. Nucleic Acids Res. 2016, 44, D457–D462. [Google Scholar] [CrossRef] [PubMed]
- Bishop, D.T.; Demenais, F.; Goldstein, A.M.; Bergman, W.; Bishop, J.N.; Paillerets, B.B.-D.; Chompret, A.; Ghiorzo, P.; Gruis, N.; Hansson, J.; et al. Geographical Variation in the Penetrance of CDKN2A Mutations for Melanoma. J. Natl. Cancer Inst. 2002, 94, 894–903. [Google Scholar] [CrossRef] [PubMed]
- Monzon, J.; Liu, L.; Brill, H.; Goldstein, A.M.; Tucker, M.A.; From, L.; McLaughlin, J.; Hogg, D.; Lassam, N.J. CDKN2A Mutations in Multiple Primary Melanomas. N. Engl. J. Med. 1998, 338, 879–887. [Google Scholar] [CrossRef] [PubMed]
- Safran, M.; Dalah, I.; Alexander, J.; Rosen, N.; Stein, T.I.; Shmoish, M.; Nativ, N.; Bahir, I.; Doniger, T.; Krug, H.; et al. GeneCards Version 3: The human gene integrator. Database 2010, 2010, baq020. [Google Scholar] [CrossRef] [PubMed]
Sample Availability: Samples of the compounds are available from the authors. |


| Cancer Type (Background Network) | Number of Driver Genes (Valid/All) | Fitness Network (Node/Edge) | Number of Genes in Fitness Core |
|---|---|---|---|
| COAD (HPRD) | 102/120 | 98/4021 | 13 |
| COAD (Huannet) | 117/120 | 100/2705 | 15 |
| COAD (PPIwu) | 95/120 | 62/922 | 15 |
| SKCM (HPRD) | 129/197 | 98/1798 | 25 |
| SKCM (Humannet) | 147/197 | 140/6912 | 21 |
| SKCM (PPIwu) | 117/197 | 92/2512 | 10 |
| FN-Cancer | Number of Core Genes in Common | The Relative Coverage | The Absolute Coverage |
|---|---|---|---|
| FN.hp-COAD | 7 | (440, 307, 0.6977) | (440, 307, 0.6977) |
| FN.hu-COAD | 7 | (439, 307, 0.6993) | (439, 307, 0.6993) |
| FN.wu-COAD | 7 | (439, 307, 0.6993) | (439, 307, 0.6993) |
| FN.hp-SKCM | 6 | (167, 123, 0.7365) | (350, 298, 0.8514) |
| FN.hu-SKCM | 6 | (195, 144, 0.7385) | (357, 298, 0.8347) |
| FN.wu-SKCM | 6 | (138, 99, 0.7174) | (348, 298, 0.8563) |
© 2017 by the authors. Licensee MDPI, Basel, Switzerland. This article is an open access article distributed under the terms and conditions of the Creative Commons Attribution (CC BY) license (http://creativecommons.org/licenses/by/4.0/).
Share and Cite
Zhang, X.; Gao, L.; Jia, S. Extracting Fitness Relationships and Oncogenic Patterns among Driver Genes in Cancer. Molecules 2018, 23, 39. https://doi.org/10.3390/molecules23010039
Zhang X, Gao L, Jia S. Extracting Fitness Relationships and Oncogenic Patterns among Driver Genes in Cancer. Molecules. 2018; 23(1):39. https://doi.org/10.3390/molecules23010039
Chicago/Turabian StyleZhang, Xindong, Lin Gao, and Songwei Jia. 2018. "Extracting Fitness Relationships and Oncogenic Patterns among Driver Genes in Cancer" Molecules 23, no. 1: 39. https://doi.org/10.3390/molecules23010039
APA StyleZhang, X., Gao, L., & Jia, S. (2018). Extracting Fitness Relationships and Oncogenic Patterns among Driver Genes in Cancer. Molecules, 23(1), 39. https://doi.org/10.3390/molecules23010039