Article

Reference Gene Selection for Quantitative Real-Time Reverse-Transcriptase PCR in Annual Ryegrass (Lolium multiflorum) Subjected to Various Abiotic Stresses

1
Department of Grassland Science, Animal Science and Technology College, Sichuan Agricultural University, Chengdu 611130, China
2
National Animal Husbandry Service, Ministry of Agriculture, Beijing 100000, China
3
Department of Horticulture, Virginia Polytechnic Institute and State University, 490 West Campus Dr., Blacksburg, VA 24061, USA
*
Author to whom correspondence should be addressed.
These authors contributed equally to this work.
Molecules 2018, 23(1), 172; https://doi.org/10.3390/molecules23010172
Submission received: 23 November 2017 / Revised: 12 January 2018 / Accepted: 13 January 2018 / Published: 16 January 2018

Abstract

:
To select the most stable reference genes in annual ryegrass (Lolium multiflorum), we studied annual ryegrass leaf tissues exposed to various abiotic stresses by qRT-PCR and selected 11 candidate reference genes, i.e., 18S rRNA, E2, GAPDH, eIF4A, HIS3, SAMDC, TBP-1, Unigene71, Unigene77, Unigene755, and Unigene14912. We then used GeNorm, NormFinder, and BestKeeper to analyze the expression stability of these 11 genes, and used RefFinder to comprehensively rank genes according to stability. Under different stress conditions, the most suitable reference genes for studies of leaf tissues of annual ryegrass were different. The expression of the eIF4A gene was the most stable under drought stress. Under saline-alkali stress, Unigene14912 has the highest expression stability. Under acidic aluminum stress, SAMDC expression stability was highest. Under heavy metal stress, Unigene71 expression had the highest stability. According to the software analyses, Unigene14912, HIS3, and eIF4A were the most suitable for analyses of abiotic stress in tissues of annual ryegrass. GAPDH was the least suitable reference gene. In conclusion, selecting appropriate reference genes under abiotic stress not only improves the accuracy of annual ryegrass gene expression analyses, but also provides a theoretical reference for the development of reference genes in plants of the genus Lolium.

1. Introduction

Annual ryegrass (Lolium multiflorum) is cultivated in temperate and subtropical regions worldwide and is used in forage and livestock systems as silage and green fodder owing to its high palatability and digestibility [1,2]. It is one of the most widely cultivated plants in the world, and grows in warm and humid climates. It is mainly used for artificial grass, clipping, and grazing [3]. However, environmental degradation from natural challenges, saline-alkali, acidic aluminum, drought, and heavy metals threatens the production of annual ryegrass. To enable more detailed and in-depth studies of gene expression, it is necessary to identify appropriate reference genes.
Quantitative reverse transcription PCR (qRT-PCR) is widely used to determine the expression of genes in different plant tissues owing to its high sensitivity, specificity, accuracy, and repeatability [4]; it is a powerful technical method to detect gene expression levels. However, the accuracy of qRT-PCR is affected by the quality of RNA, the efficiency of RNA reverse transcription, the design of primers, the initial sample capacity, etc. [5]. To accurately detect differences in gene expression, a reference gene is used as the calibration standard [6]. The ideal reference gene should exhibit steady expression in all cells, physiological states, and sample types. However, no reference gene is expressed stably under various experimental conditions [7] and it is therefore important to choose stable reference genes for specific experimental conditions.
Recent studies have explored appropriate reference genes for different plant species, plant organs, and experimental conditions [8]. GAPDH is the most stable among different tissues in the precocious grass [9], but in Brachypodium distachyon, it is not suitable [10]. EF-1 alpha exhibits the most stable expression under abiotic stress, but in the tomato, it is the least stable under light stress [11]. During leaf development, 18S rRNA is the most reliable reference gene, while 18S rRNA is the least stable gene during floral development [12]. In black medic root tissue, GAPDH is the most stable gene [13], but in switchgrass root tissue, it is ranked last [14]. In the non-heading Chinese cabbage, for eight different tissues, including the root and stem at the third leaf stage, leaves after bolting, flower buds, petioles, stamens, pistils, and seed pods, PP2A had the greatest stability among thirteen candidate reference genes [15]. Under different experimental conditions, it is easy to obtain different results. For example, in potato, 18S rRNA is the most stable reference gene for biotic stress (late blight exposure), and L2 + Cyclophilin are the most stable genes for abiotic stress (salt and cold stress) [16]. Therefore, it is necessary to screen stable reference genes for different plant species and experimental treatments.
In order to accurately analyze the stability of candidate reference genes, we used four software packages for analysis. Each software package implements a unique statistical algorithm. GeNorm (ver.3.5) [17], a Visual Basic Application (VBA) tool for Microsoft Excel, was employed as a means of analyzing the expression stability of the candidate reference genes based on the principle that the expression ratio of two perfect reference genes should be constant under different treatments. The expression stability value M1 based on the average pairwise expression ratio was calculated by this method. NormFinder (ver.0.953) [18] is a VBA applet based on a variance estimation approach; it ranks candidate reference genes according to their stability under differential experimental conditions, and stable gene expression is indicated by low average expression stability values (M2) (Ferreira et al., 2013) [19]. BestKeeper (ver.1.0) [5] is an Excel-based software tool that analyzes the stability of candidate reference genes based on the coefficient of variation (CV) and the standard deviation (SD). Finally, RefFinder [20], a user-friendly comprehensive web-based tool, was developed for evaluating reference gene stability from extensive experimental datasets. Therefore, these four software packages were used for comprehensive analyses in this study.
Advances in molecular biology are expected to lead to the identification of more stable and novel genes as reference genes, rather than traditional screening approaches for reference gene identification. In this study, seven traditional reference genes and four Unigenes from transcriptome sequencing data in annual ryegrass were evaluated under different abiotic stress treatments by qRT-PCR. This study aims to examine annual ryegrass leaf tissue under abiotic stress to determine the most stable reference genes and provide a theoretical basis and data correction method for studies of gene expression under abiotic stress. These findings can also provide support for studies of the annual ryegrass genome in the future.

2. Results

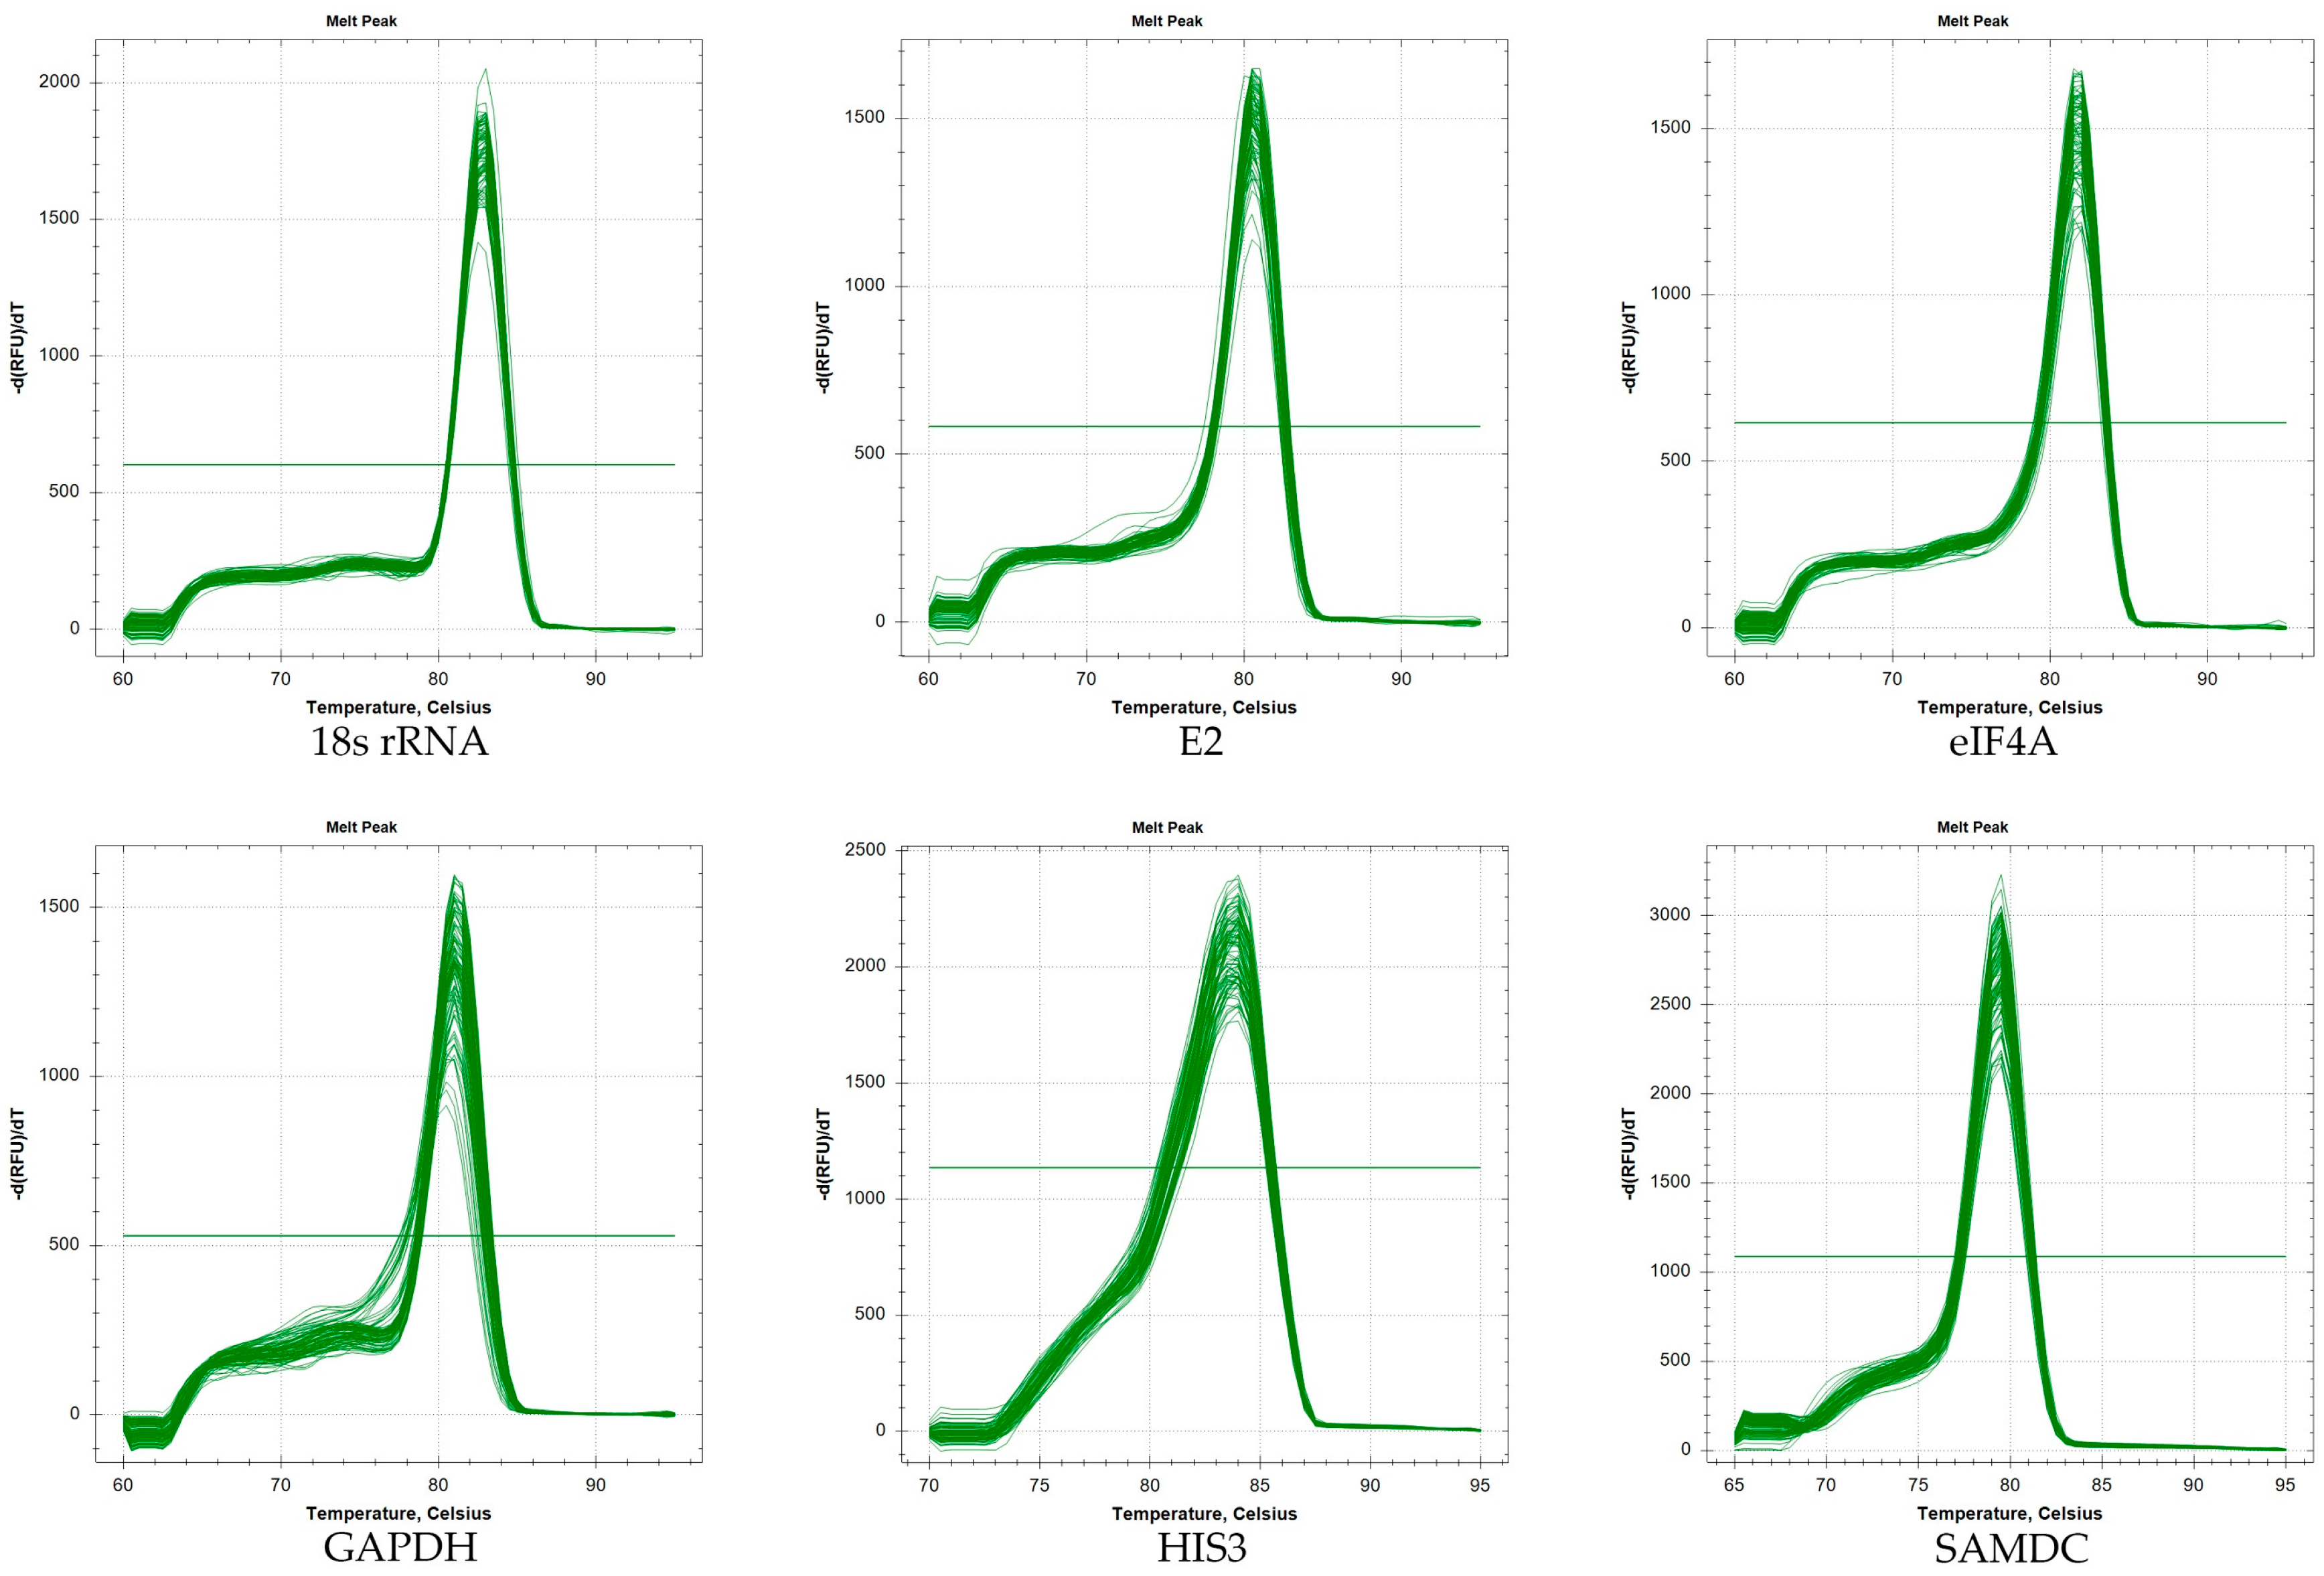
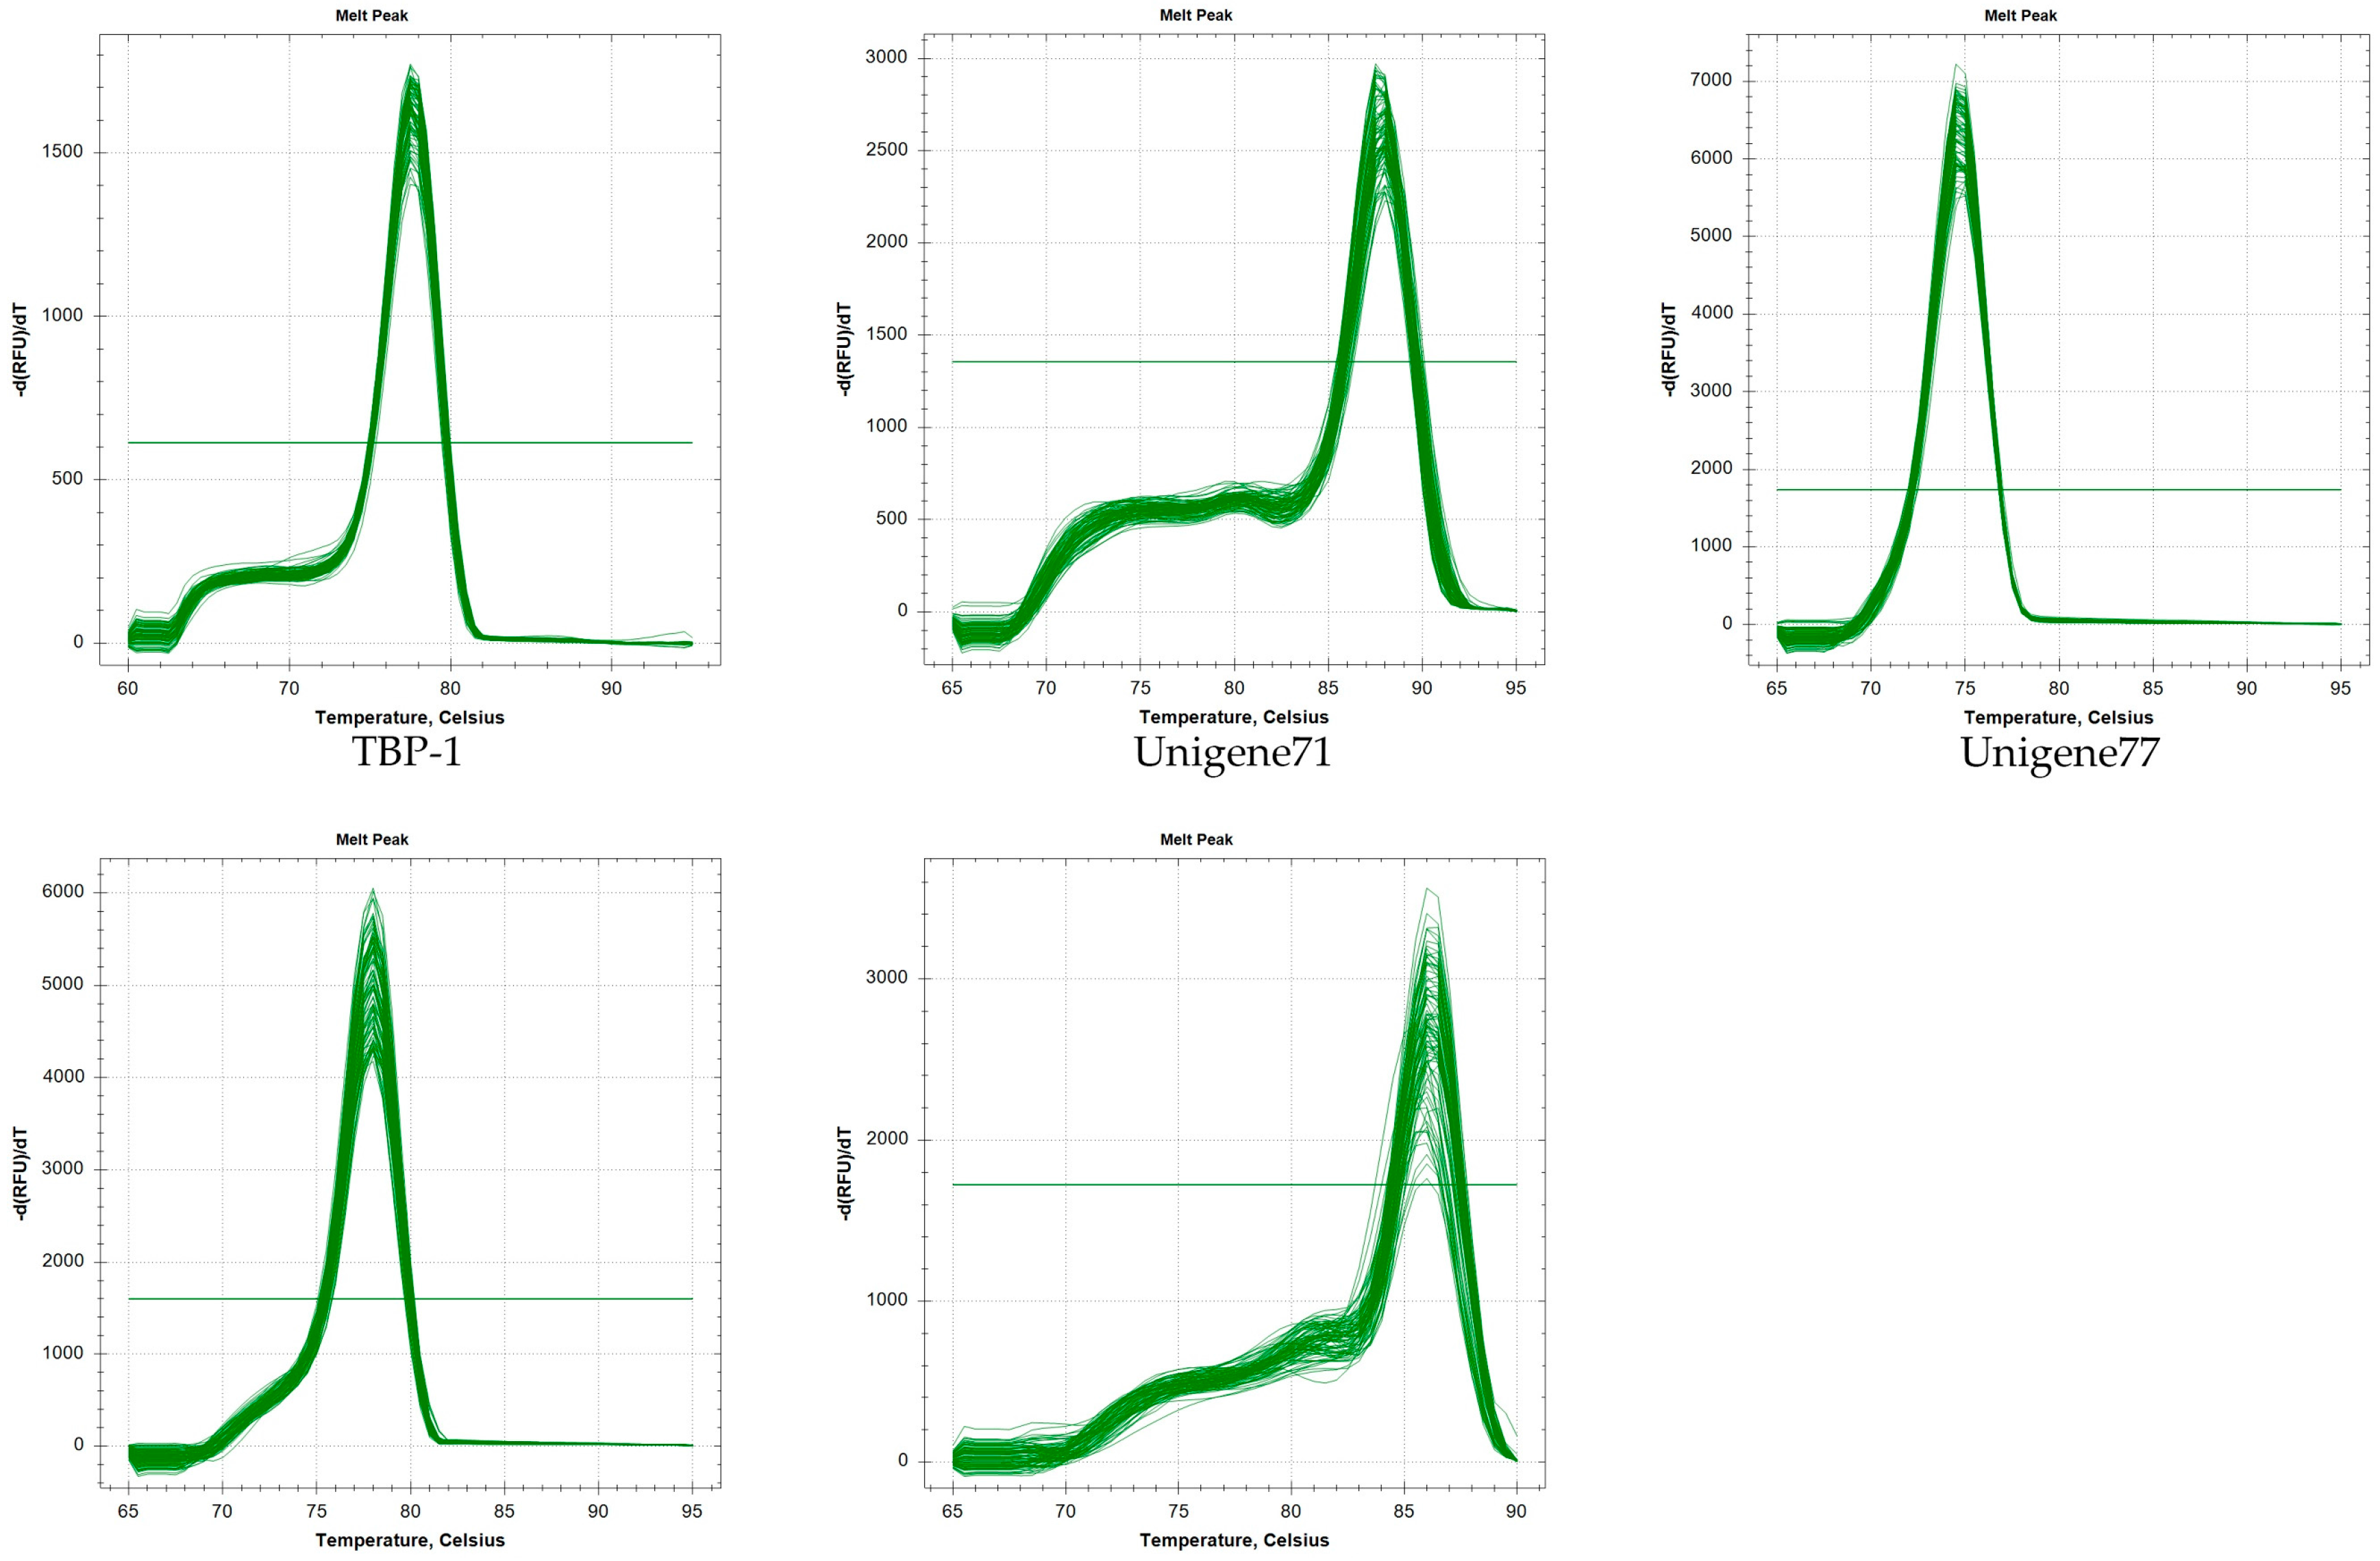
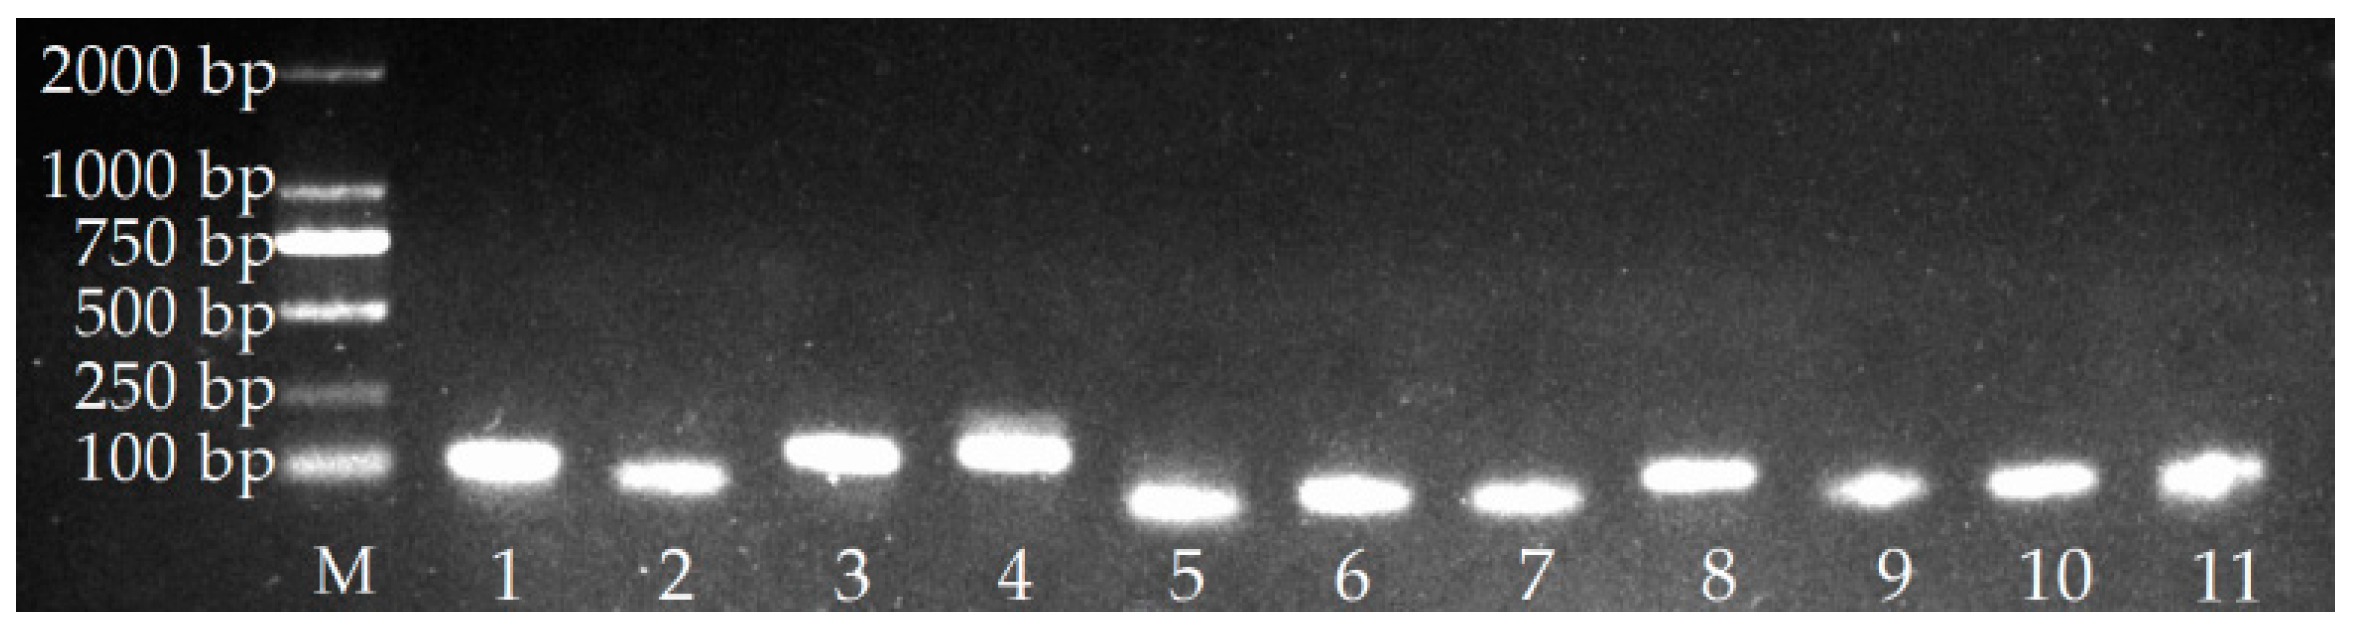
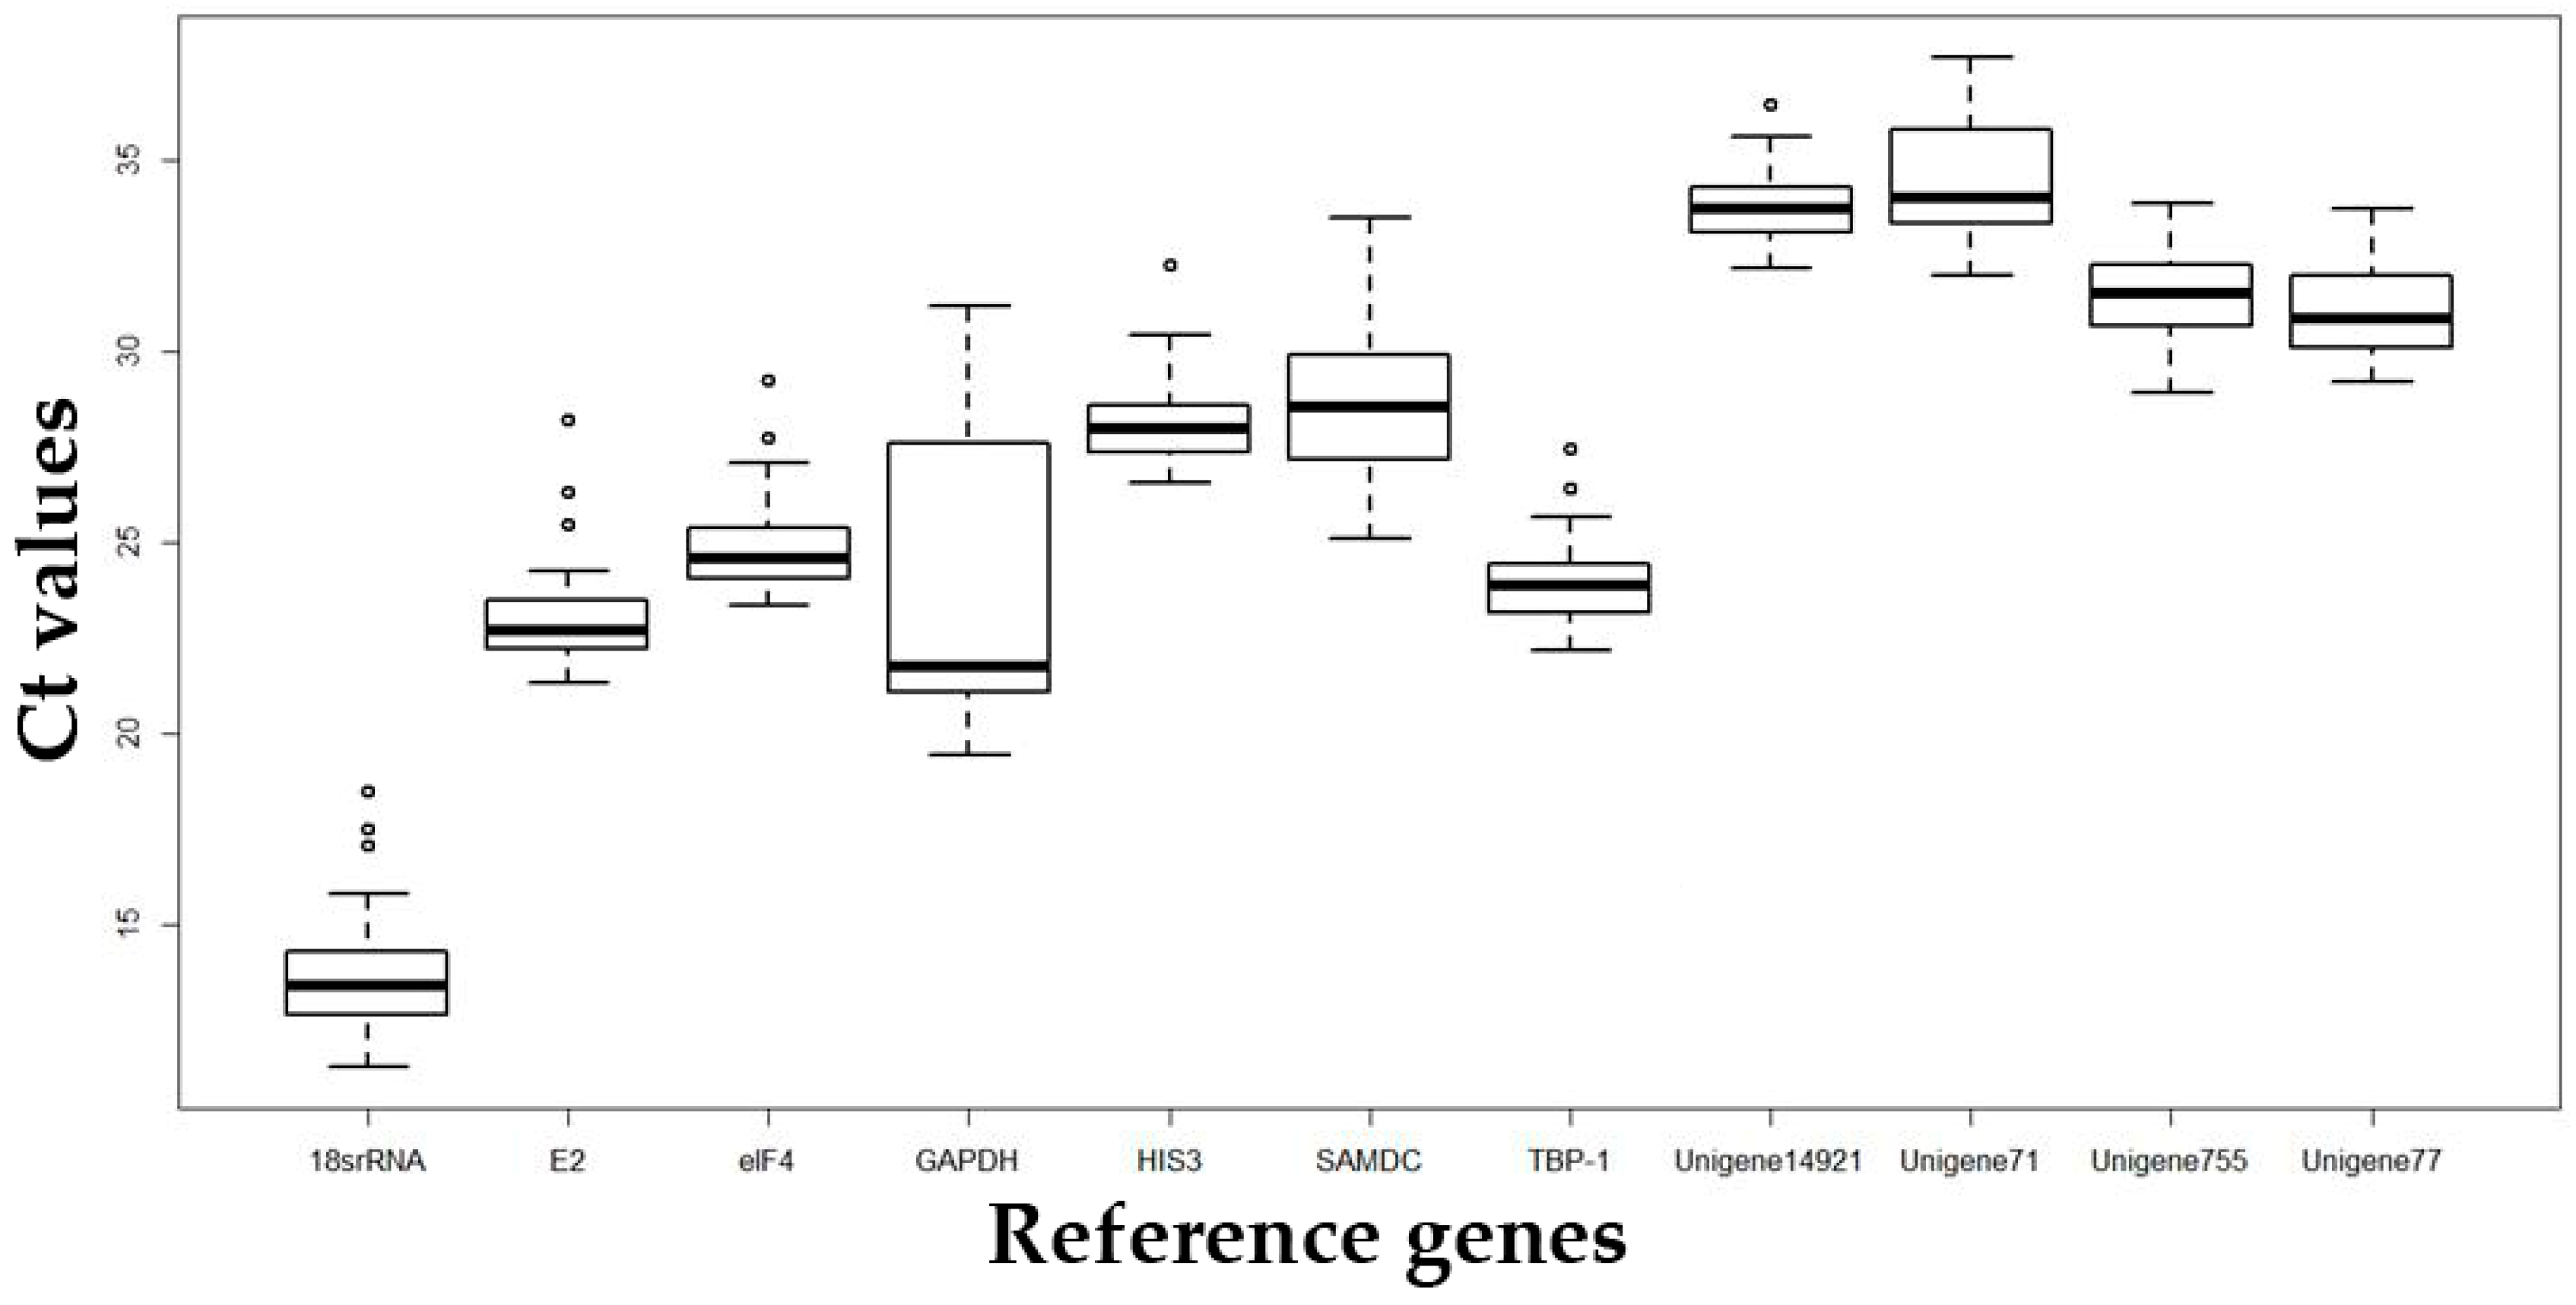
2.1. Verification of PCR Amplicons, Primer Specificity, and Gene-Specific PCR Amplification Efficiency

Using 1.5% agarose gel electrophoresis, fragments of 80–200 bp of HIS3, 18S rRNA, SAMDC, GAPDH, TBP-1, eIF4A, E2, Unigene71, Unigene77, Unigene755, and Unigene14912 clearly amplified, consistent with the expected fragment sizes, and no impurities or primer dimers were observed (Figure 1), indicating that the primers for the 11 candidate reference gene were highly specific and can be used for qRT-PCR analyses.
Most of the candidate reference genes in various abiotic stress conditions exhibited melting curves with a single peak, showing that the primers are highly specific. Gene amplification curves for each sample had good repeatability, showing that the qRT-PCR results were accurate and reliable (Figure 2). However, in some samples, a miscellaneous peak of GAPDH indicated that the primer was not highly stable.

2.2. Analysis of the Expression Stability of Reference Genes under Different Types of Abiotic Stress

Analysis of the raw expression levels across all samples identified variation among reference genes is shown in Figure 3. We present detailed data in Supplementary Table S1. Ct values for the 11 genes ranged from 11.24 to 37.73, and the majority of these values were between 23.44 and 31.94. 18S rRNA was highly expressed compared to the other genes, reaching threshold fluorescence after only 13.6 amplification cycles, whereas the Ct average of all reference genes within the datasets was approximately 27 cycles. As a result, the 18S rRNA transcripts were around 10,000-fold more abundant than the average for the dataset. Unigene71 and Unigene14912 transcripts were least abundant, with Ct values of 34.03 and 33.75, respectively. The individual reference genes had different expression ranges across all studied RNA samples. However, before we performed the software analysis, we observed that GAPDH has the most discrete data and therefore its ranking should be lowest in subsequent analyses. By contrast, E2, eIF4A, HIS3, TBP-1, and Unigene14912 were expected to perform well in subsequent analyses. The wide expression ranges of the eleven tested reference genes confirmed that it is of the utmost importance to select a reliable reference gene to normalize gene expression under certain conditions.

2.3. Stability Ranking of Candidate Reference Genes for Different Abiotic Stresses

In this study, GeNorm, BestKeeper, NormFinder, and RefFinder were used to analyze the expression of relatively stable reference genes in different abiotic stress conditions. The results showed that reference gene exhibited expression differences depending on the abiotic stress.

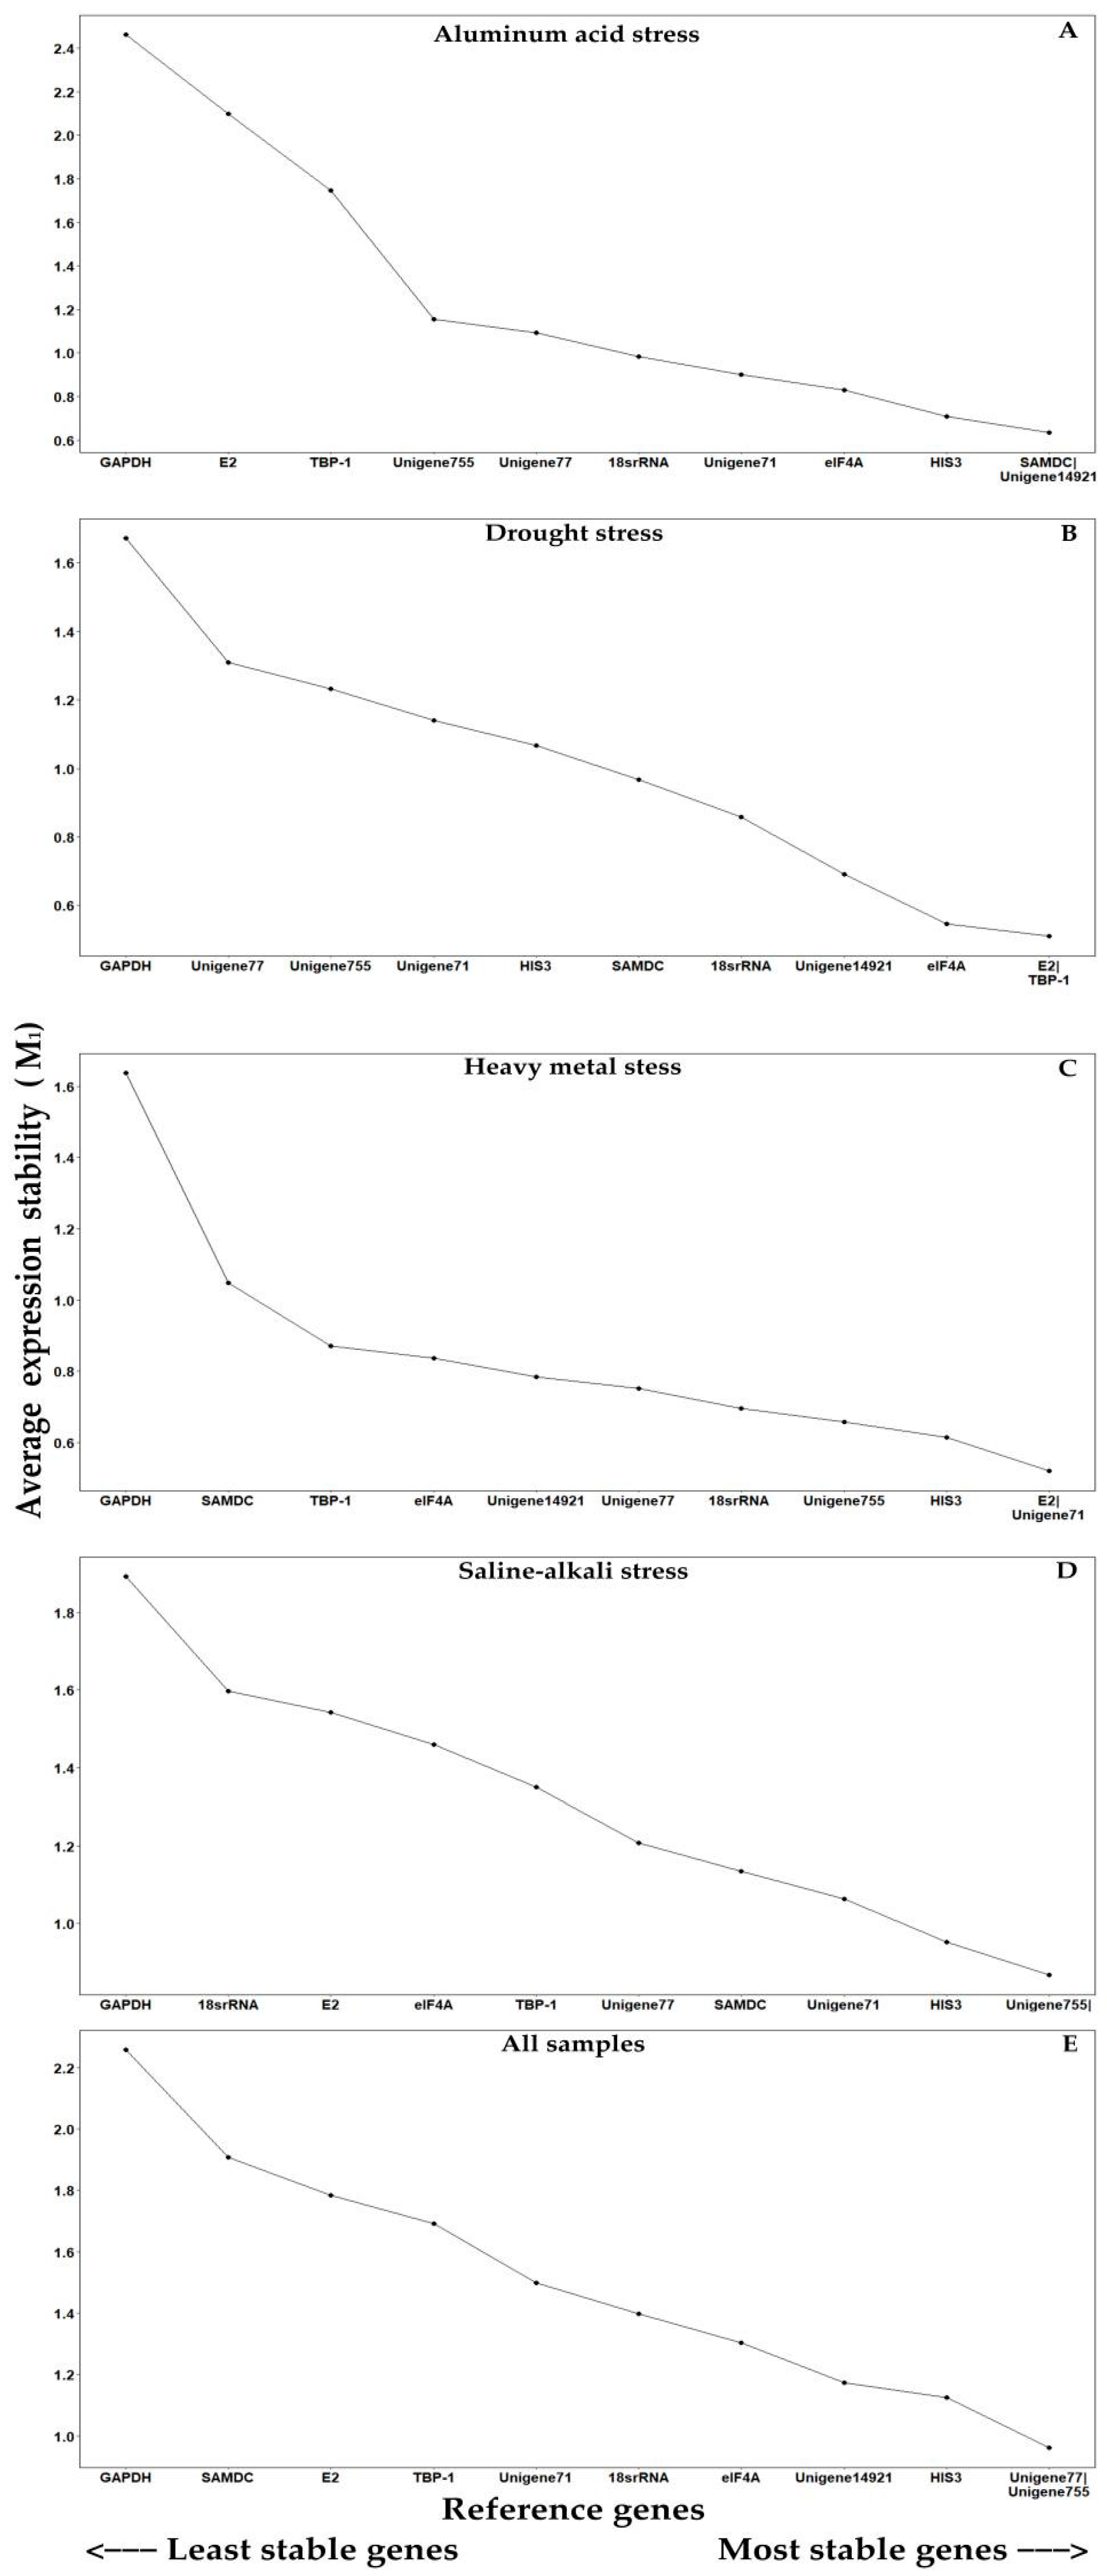
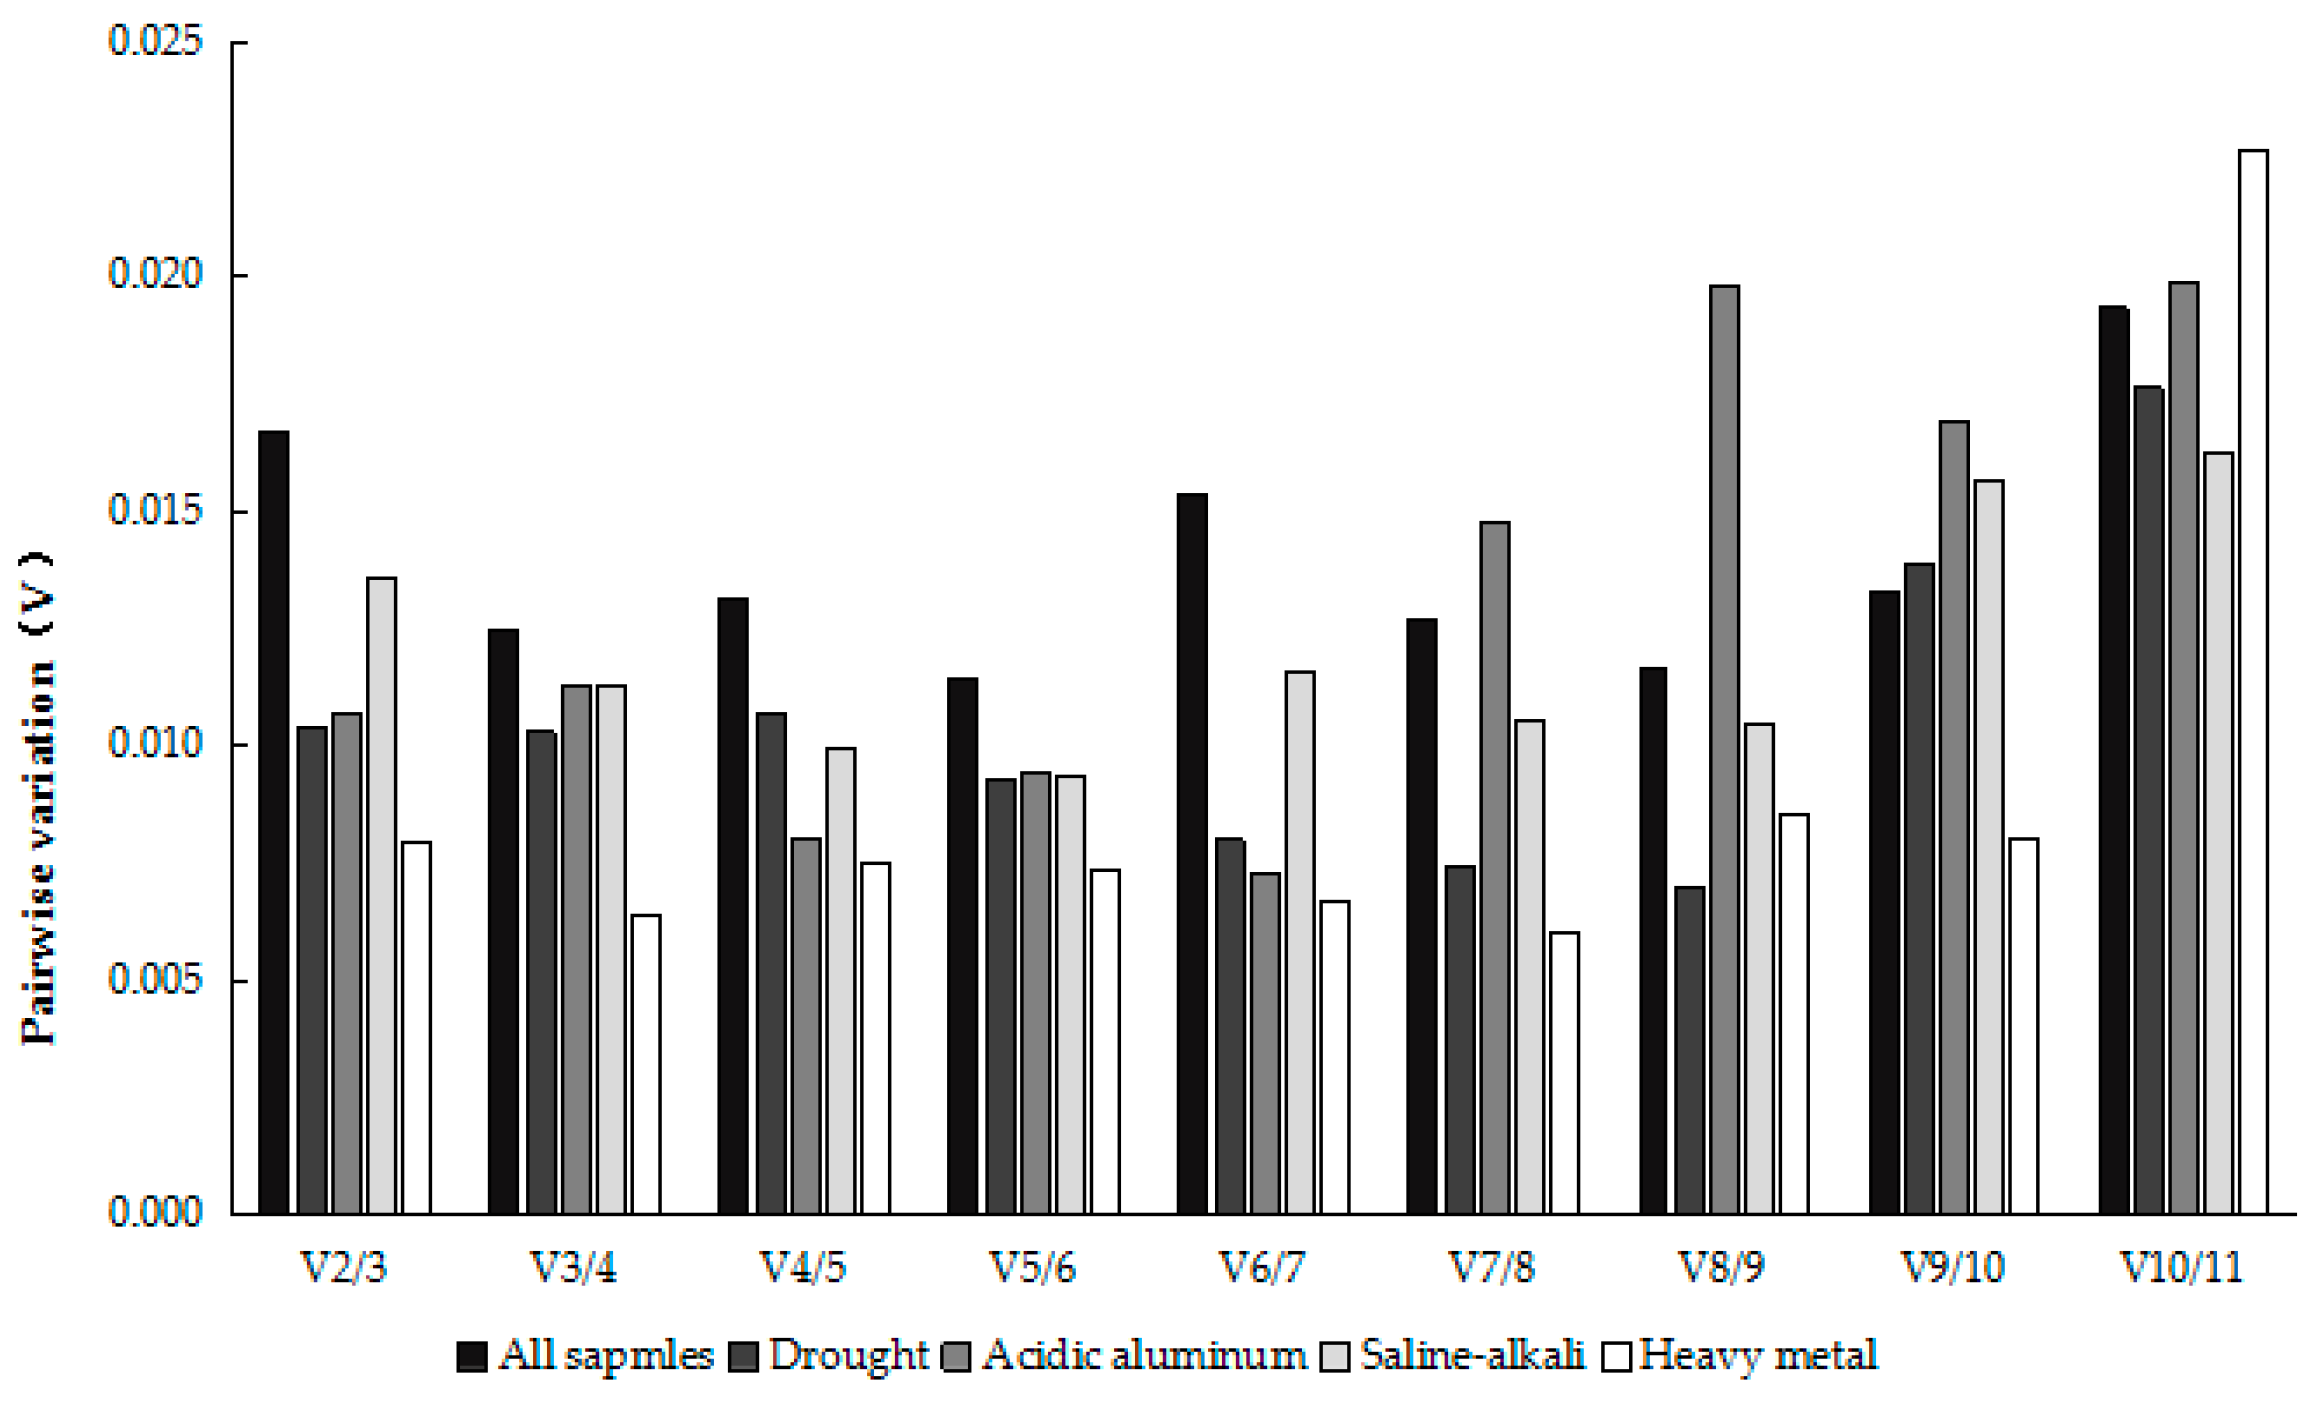
2.3.1. GeNorm Analysis

GeNorm was used to rank the reference genes with respect to expression stability by calculating average pairwise expression ratios (M1), where values below 1.5 indicate stable expression. In this study, Unigene77 and Unigene755, with the same M1 value of 0.962, were the most stably expressed in all samples, while GAPDH, with an M1 value of 2.257, was the least stably expressed gene (Figure 4E). For the samples subjected to acidic aluminum stress, drought stress, heavy metal stress, and saline-alkali stress, the pairs SAMDC and Unigene14912, E2 and TBP-1, E2 and Unigene71, and Unigene755 and Unigene14912 ranked the highest, respectively, suggesting that these gene pairs were stable and could be used as references (Figure 4A–D).
In some gene expression analysis of study, sometimes to express quantitatively the high precision requirements, or in some less obvious purpose gene expression quantity change, using a single reference genes cannot accord with the requirement of the experiment. Therefore, it has become a new criterion in quantitative PCR research to correct the expression of the target gene with two or more stable reference genes [21]. Accordingly, this study analyzed the pairwise variation of each reference gene (Figure 5), and the results showed that the pairwise variation of the two to eleven reference gene was less than 0.15. Vandesompele et al. [17] suggested that when the paired variation V value was less than 0.15, there was no need to add multiple reference genes for the correction. Therefore, we can see that the optimal number of reference genes is two.

2.3.2. BestKeeper Analysis

BestKeeper was used to analyze the expression stability of genes by determining which genes had the lowest CV ± SD (Table 1). Our results indicated that Unigene71 had the lowest CV values under acidic aluminum and heavy metal stress; Unigene14912 showed the lowest CV values for drought stress, saline-alkali stress, and all samples. However, GAPDH showed the highest CV values of 14.04 ± 3.44, 11.84 ± 2.90, 14.26 ± 3.31 and 12.12 ± 2.82 when plant materials were subjected to acidic aluminum, drought, heavy metal, and saline-alkali stress, respectively, and had the highest CV values for all samples (Table 1).

2.3.3. NormFinder Analysis

NormFinder was used to rank gene expression stability based on comparisons of the average pairwise variation of a gene to all other genes (M2). The stability values of reference genes were calculated by NormFinder and are shown in Table 2. Under different conditions, the lowest M2 values were assigned to different candidate reference genes. Unigene14912 ranked highest for all samples with an M2 value of 0.889. For acidic aluminum stress, 18S rRNA was the most-stable gene with an M2 value of 0.545. Under drought, heavy metal, and saline-alkali stress, eIF4A, Unigene71, and TBP-1 were the most suitable genes, with M2 values of 0.273, 0.26 and 0.455, respectively.

2.3.4. RefFinder Analysis

Finally, RefFinder was used produce a comprehensive ranking of the most stable candidate reference genes under each stress condition (Table 3).
The expression levels of eIF4A, E2, and TBP-1 were most stable under drought stress (Table 3). Under saline-alkali treatment, Unigene14912, TBP-1, and HIS3 were most stable (Table 3). Under the stress of acidic aluminum, SAMDC, HIS3, and Unigene14912 were the most stable among the internal reference genes (Table 3). Under heavy metal stress, Unigene71, HIS3, and E2 were most stable (Table 3).

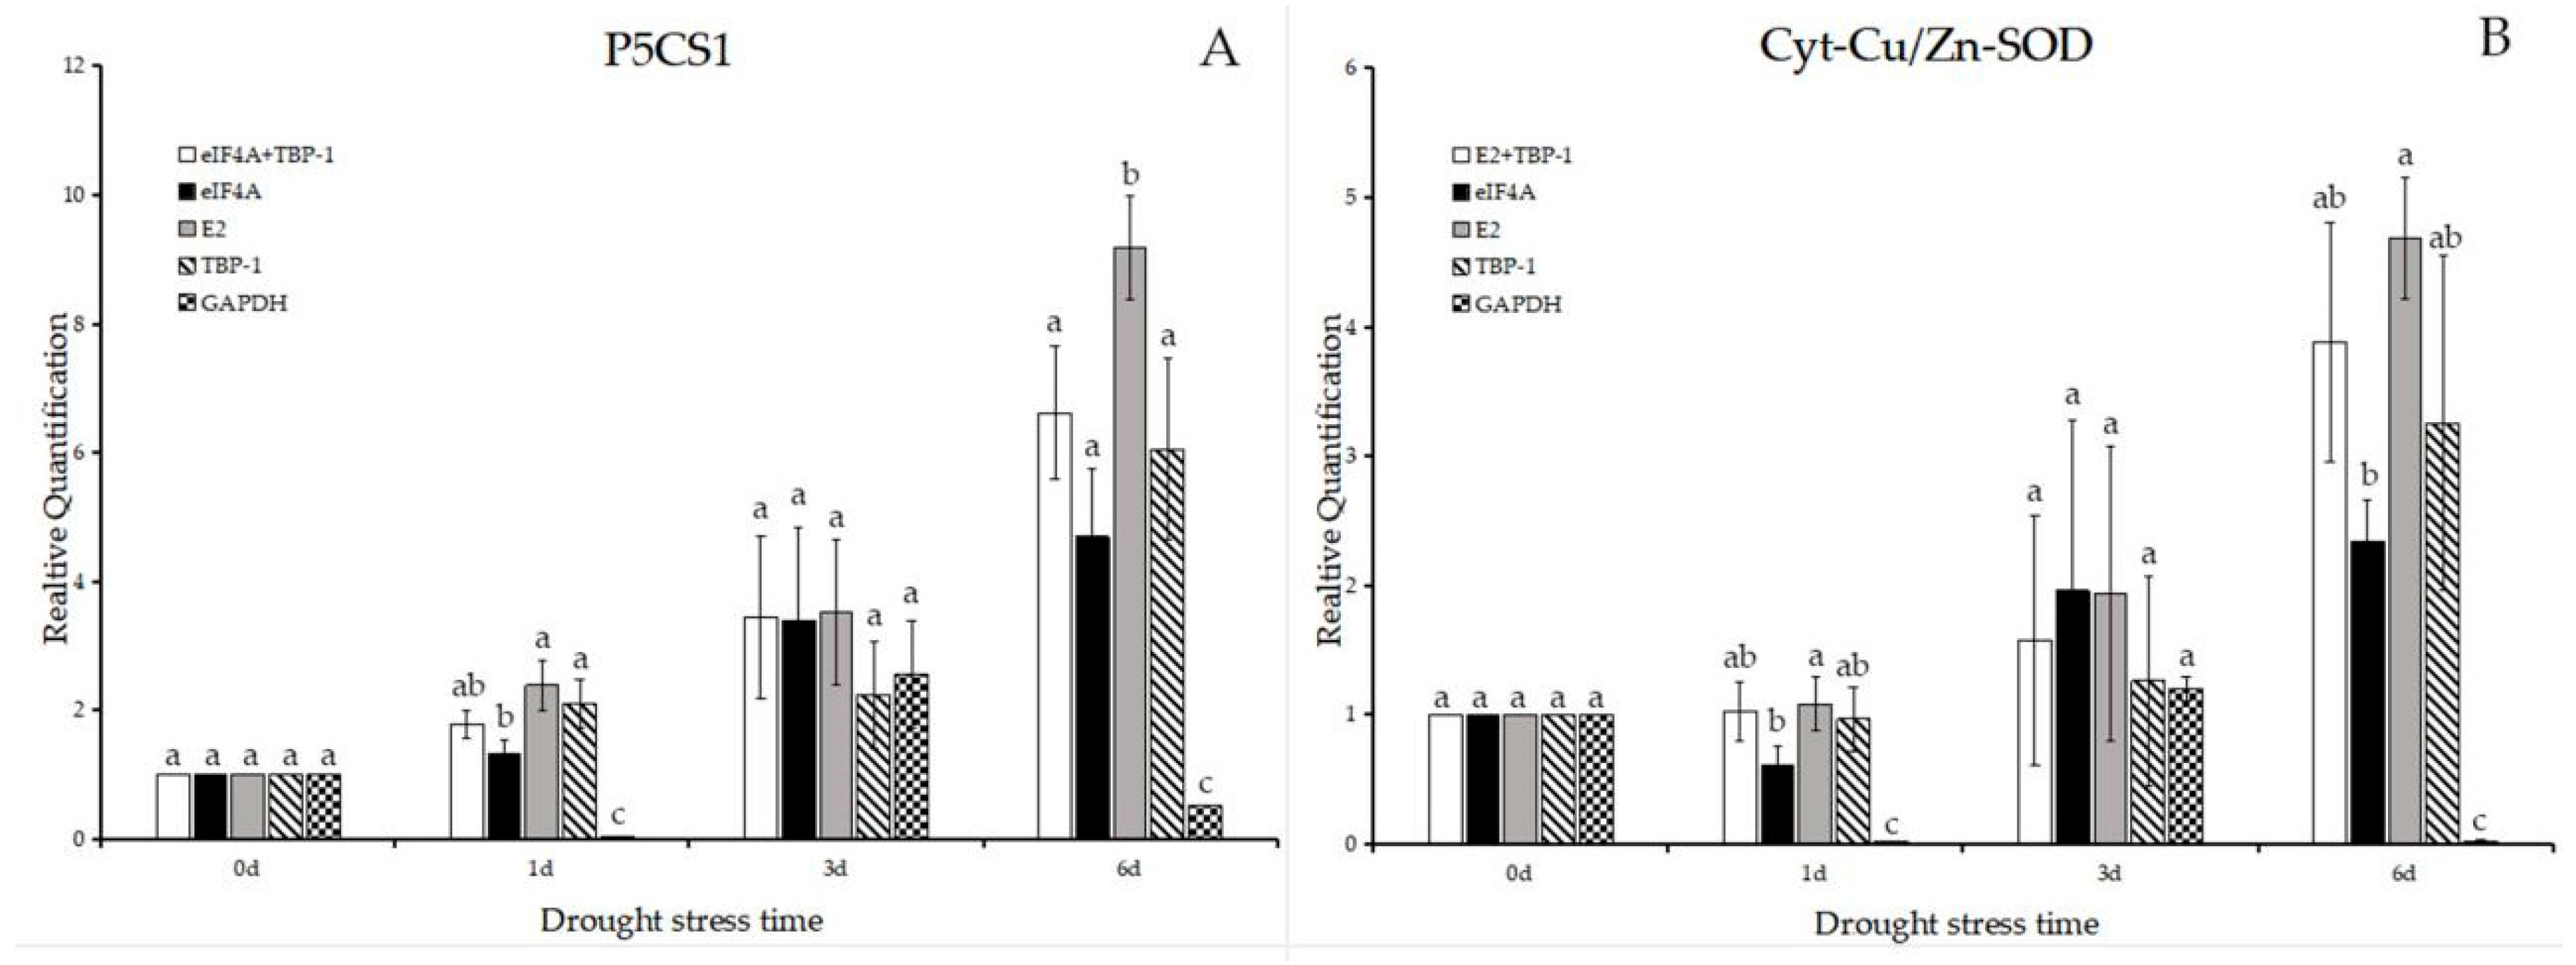
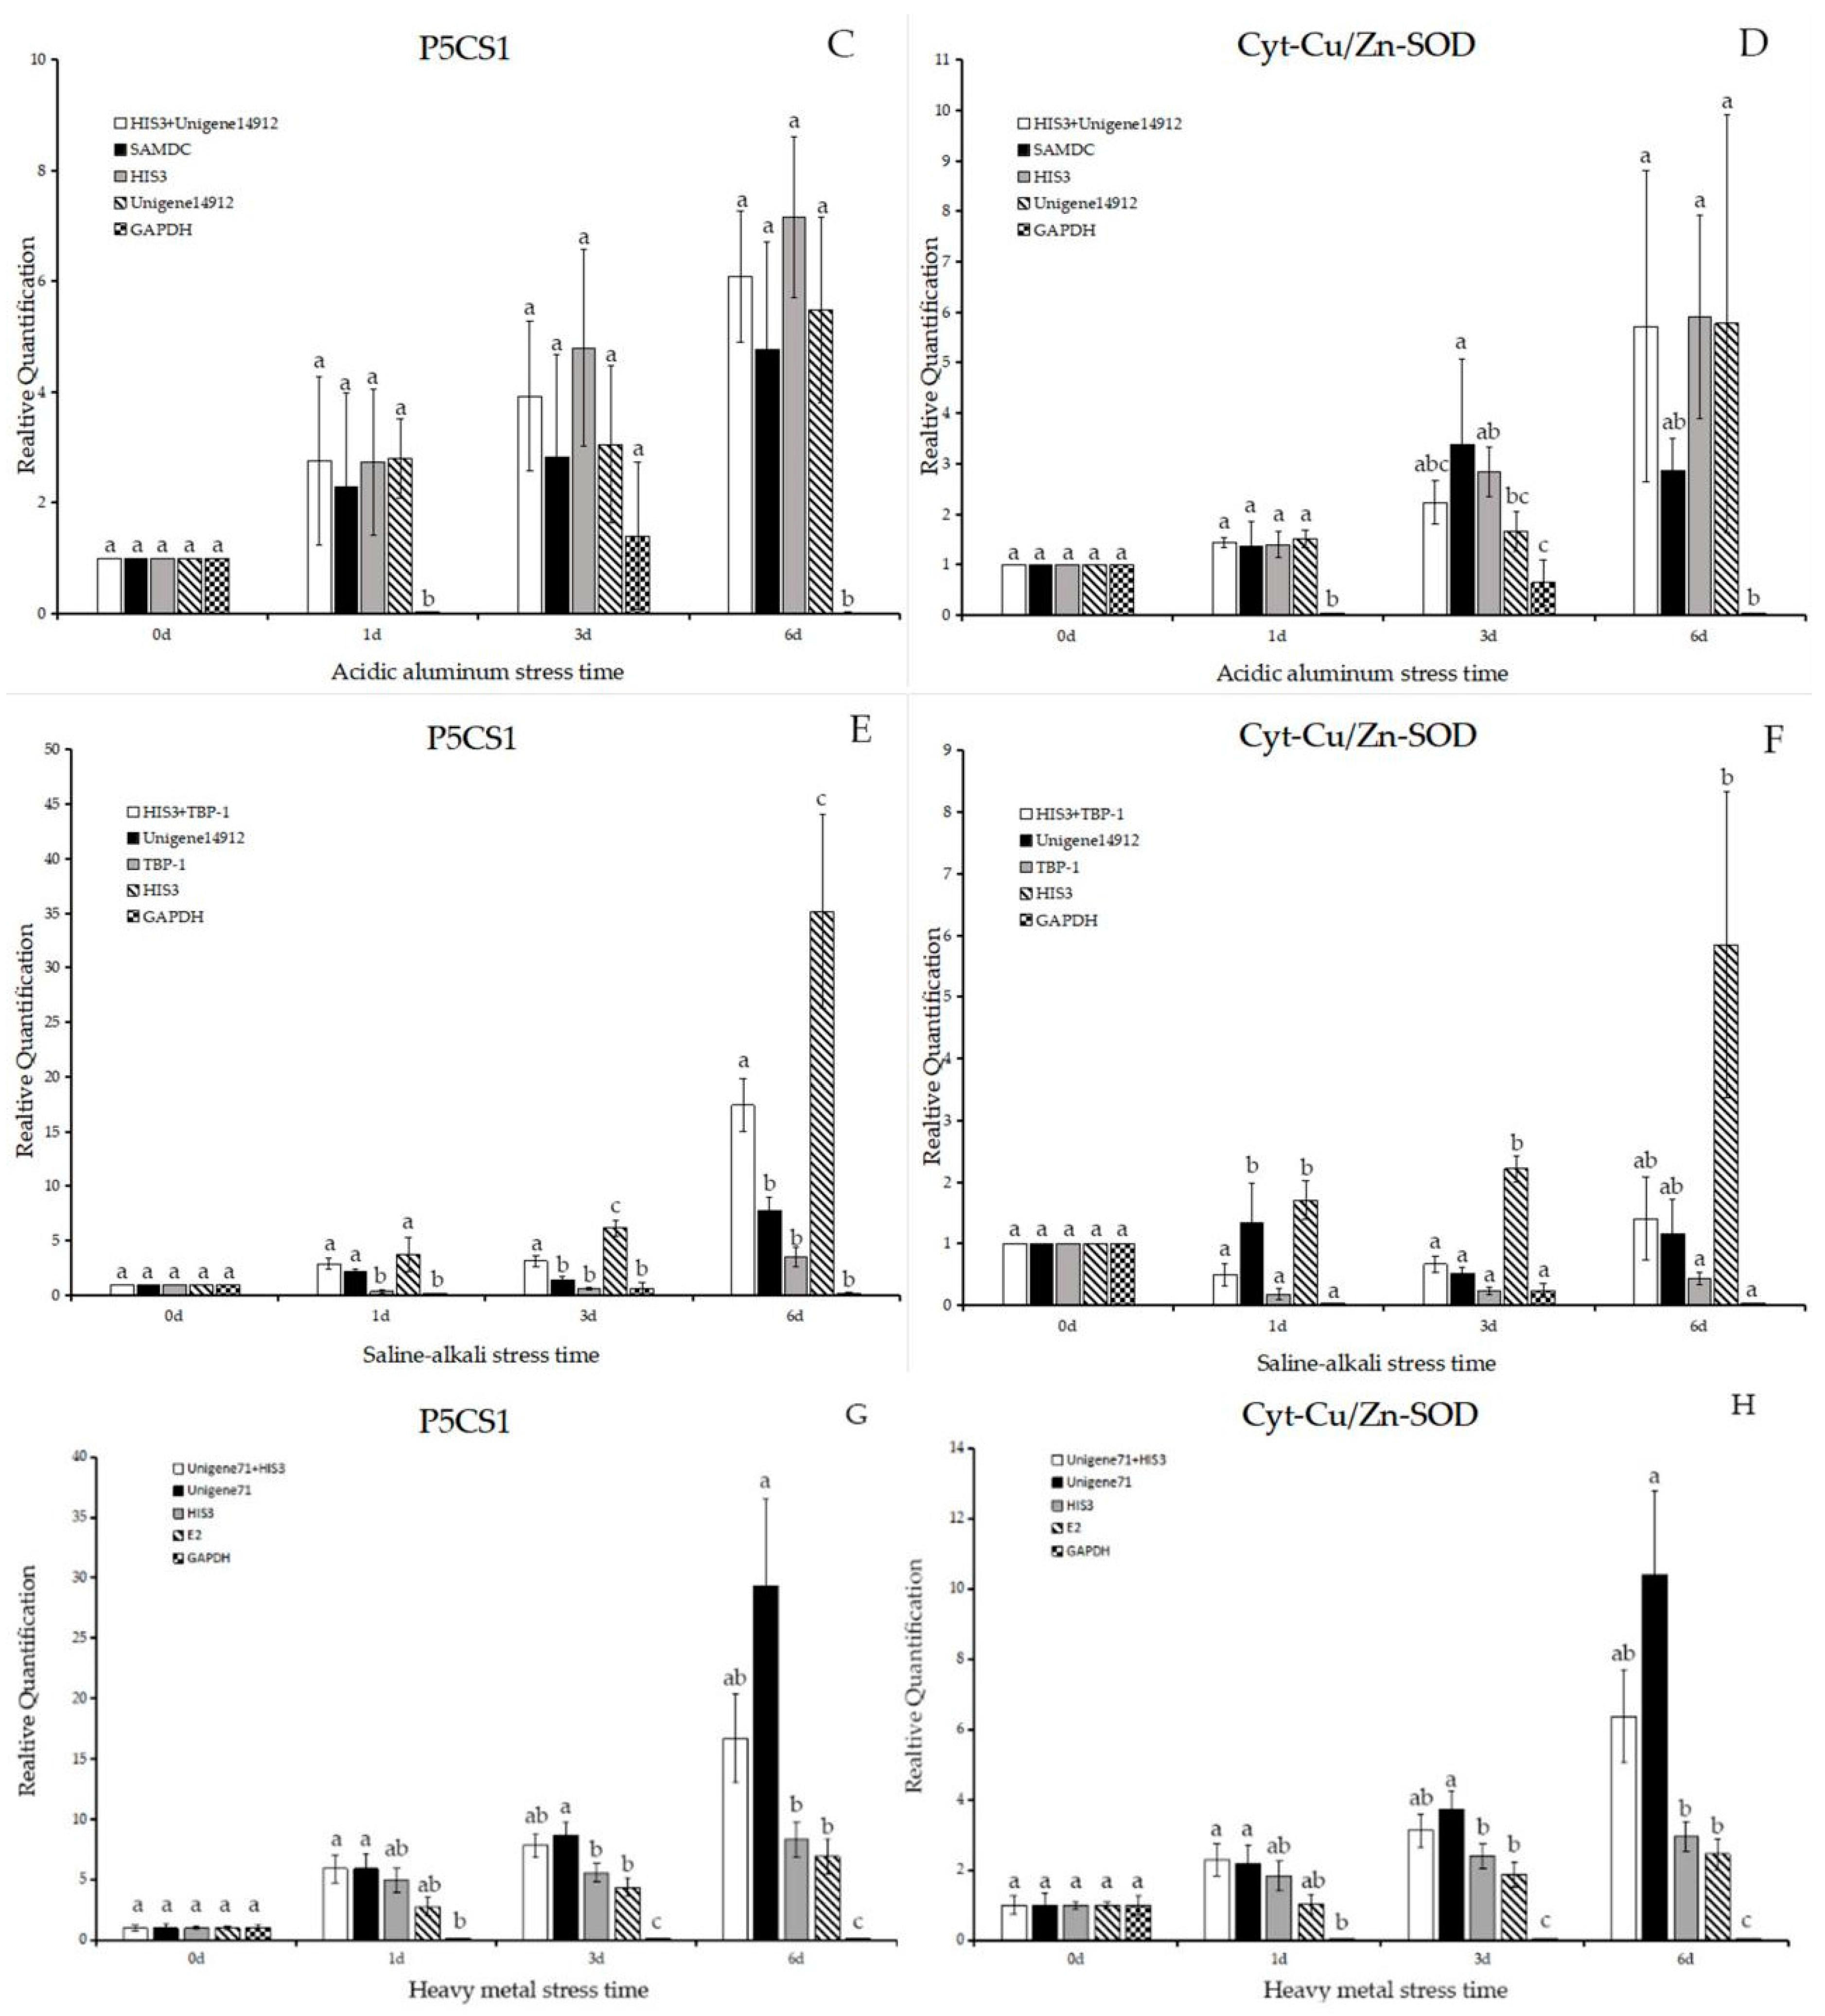
2.4. Validation of the Usefulness of the Reference Genes Identified from This Study

To verify that reference genes influence qRT-PCR results for annual ryegrass leaves, the expression patterns of delta-1-pyrroline-5-carboxylate (P5CS1) and Cyt-Cu/Zn superoxide dismutase (Cyt-Cu/Zn SOD) were analyzed in varied abiotic stresses by using five different reference genes identified in previous results including three most stable reference genes, the combination of reference gene and the worst reference gene. P5CS1 is a critical gene for proline biosynthesis rate-limiting enzymes regulating the balance of osmotic and preventing the cell turgor pressure increases to adapt severe environment [22,23,24]. SOD is a kind of metalloenzyme commonly found in plants. When plants are under heavy metal stress, SOD is the first line of defense against oxidative damage [25]. SOD will work for hydrogen peroxide and oxygen molecules by disproportionation on superoxide anion, which is efficient removal of oxygen free radicals in plants and protects cells from oxidative damage [26]. Advanced plants have Cu/Zn SOD, which exists in the cytoplasm and chloroplasts [27].
We utilized the 2−ΔΔCt method to calculate the expression of P5CS1 and Cyt-Cu/Zn SOD under different stresses. As shown in Figure 6A,B, P5CS1 had same expression patterns using eIF4A + TBP-1, eIF4A, E2 and TBP-1 for normalization under drought stress. The similar results were obtained in Cyt-Cu/Zn SOD expression patterns. Specially, using TBP-1 for normalization, the expression of P5CS1 was induced with a 2-fold increase on the first day, 4-fold increase on the 3rd day, and 9-fold increase on the 6th day.
Under acidic aluminum stress, P5CS1 and Cyt-Cu/Zn SOD had same expression patterns using HIS3 + Unigene14912, HIS3, and Unigene14912 for normalization (Figure 6C,D). Using Unigene14912 for normalization, the expression of P5CS1 was induced with a 3-fold increase on the first day, 5-fold increase on the 3rd day, and 7-fold increase on the 6th day, while the expression of Cyt-Cu/Zn SOD was induced with a 1.5-fold increase on the first day, 3-fold increase on the 3rd day, and 6-fold increase on the 6th day.
The HIS3 had the best efficient for analyzing the expression patterns of P5CS1 and Cyt-Cu/Zn SOD under saline-alkali stress. The expression of P5CS1 was induced with a 3-fold increase on the first day, a 5-fold increase on the 3rd day, and a 35-fold increase on the 6th day (Figure 6E,F). The similar results were obtained for Cyt-Cu/Zn SOD.
As the results show (Figure 6G,H) that P5CS1 had same expression patterns using Unigene71, HIS3, and E2 for normalization under heavy metal stress. The same results were obtained in Cyt-Cu/Zn SOD that both two target genes were up-regulated. Of note, using Unigene71 for normalization, the expression of P5CS1 was induced with a 5-fold increase on the first day, 8-fold increase on the 3rd day, and 29-fold increase on the 6th day.

3. Discussion

qRT-PCR has become an important technique for the analysis of gene expression owing to its sensitivity, accuracy, and high-throughput nature [28]. The accuracy of qRT-PCR depends on the stability of reference genes used for data normalization [29]. Under different conditions, changes in reference gene expression may lead to incorrect analyses of real-time data. Hence, it is important to identify suitable reference genes for gene expression analyses by qRT-PCR for each condition, rather than relying on reference genes from published data for different plant species [8].
With rapid developments in biotechnology, traditional reference genes have not met the needs of researchers. Accordingly, more stable reference genes are needed for gene expression analyses to detect very small differences in gene expression. In this study, seven traditional reference genes and four transcriptome Unigenes were analyzed to assess traditional reference genes and explore unknown and stable genes. We compared three different statistical applets, GeNorm, BestKeeper, and NormFinder to evaluate the 11 reference genes in annual ryegrass. The three applets yielded different rankings of stable reference genes depending on treatment (Table 3). It is worth noting that Unigene14912 is the most stable reference gene for all samples and under saline-alkali stress. Additionally, Unigene71 was the most stable of the reference gene under heavy metal stress. By contrast, the traditional reference genes SAMDC and eIF4A only performed well under acidic aluminum and drought stress, respectively. In this study, two new stable reference genes, Unigene14912 and Unigene71, were successfully identified, providing more potential reference genes for future studies.
BestKeeper and NormFinder identified Unigene14912 as the most stable reference gene, followed by eIF4A for all samples. GeNorm identified Unigene77 and Unigene755 as the best reference genes, followed by HIS3. GAPDH ranked last using all three methods. The most stable reference genes varied among the three methods used in this study, but the identification of unstable genes was consistent, and the inconsistent results may be explained by the different models associated with each statistical algorithm [30,31].
The results of this study were consistent with results obtained for other species. Three methods showed that under abiotic stress, annual ryegrass eIF4A was highly stable, similar to the results for closely related species, e.g., Lolium perenne under abiotic stress [32], darnel (Lolium temulentum) [33], and the Kentucky bluegrass [9], indicating that it is the most suitable for reference gene. GAPDH exhibits similar results across species, such as papaya (Carica papaya) [34], rice (Oryza sativa) [35], and tobacco (Nicotiana tabacum) [36], in which it was not suitable for use as a reference gene, but is involved in other biochemical reactions during abiotic stress.
The transcript abundances of Unigenes were generally low. In order to improve reliability of the result, the combination of traditional and novel reference genes are recommended. In the validation experiment under saline-alkali and heavy metal stress, the standard deviation of the combination of the reference gene for normalization is smaller than single reference gene, which indicating that the combination of the reference gene was more accurate and powerful in gene expression analysis. The most suitable reference gene combination was HIS3 + TBP-1 and Unigene71 + HIS3 under saline-alkali stress and heavy metal stress, respectively.
The material we use is a single variety of leaves. Although it has been able to meet the research needs, it is not perfect. In future studies, we will explore between different varieties, different sites, and different developmental stages, reference genes perform excellent.

4. Materials and Methods

4.1. Materials

This experimental subject is “Chuannong NO.1”, developed by the Sichuan Agricultural University (Chengdu, China). Seeds were sown in 25 × 19 × 6 cm pots and the matrix was silica sand. They were placed in an incubator with a light intensity of 100 μmol/(m·s), 25 °C and day/night cycles of 16 and 8 h. When the leaf counts of the plants reached 5–6, stress treatments were initiated. Under drought stress, plants were treated with 15% PEG6000 for 6 days. For acidic aluminum treatment, plants were treated with 0.1 mol/L AlCl3 (pH 2.9) for 6 days. For heavy metal treatment, the nutrient solution was filled with 200 mg/L Cr6+ Hoagland’s for 6 days. For saline-alkali stress, plants were treated with 0.1 mol/L NaHCO3 (pH 8.2) for 6 days. We take a sample of several seedlings (upper leaves) in the same pot. Take three mixed samples at four time points (0, 1, 3, 6 days) under four treatments (drought, saline-alkali, acidic aluminum, heavy metal). There are three biological repeats for each sampling point. We treat the before treatment (0 day) as a control group in each treatment, as described by Huang L et al. [37]. All samples frozen in liquid nitrogen, and stored at −80 °C for later use. The 48 annual ryegrass samples during the study and which datasets they were included in Supplementary Table S2.

4.2. Reagents and Instruments

We used the following reagents. RNA extraction reagent from the RNA Simple Total RNA Kit (TianGen Biotech Co., Ltd., Beijing, China), reverse transcriptase reagent from the iScript cDNA Synthesis Kit (Bio-Rad Laboratories Inc., Hercules, CA, USA), and quantitative fluorescence PCR kitswere purchased from TAKARA (Shiga, Japan). Primers were obtained from Sangon Biological Engineering (Shanghai), Beijing branch (China). A fluorescence quantitative instrument was used for fluorescence quantitative PCR (CFX-96; Bio-Rad).

4.3. RNA Extraction and First-Strand cDNA Synthesis

The RNA simple Total RNA Kit (TianGen Biotech Co., Ltd., Beijing, China) was used to extract RNA from annual ryegrass material and RNase-free DNase I (GBC, Beijing, China) was used to remove DNA. The Ultramicro Spectrophotometer (NanoVue Plus Spectrophotometer, Wilmington, DE, USA) was used to detect RNA purity and concentration at A260 nm/A280 nm and A260 nm/A230 nm. After 1% agarose gel electrophoresis, the iScript cDNA Synthesis Kit (Bio-Rad Laboratories Inc.) was used to reverse transcribe total RNA samples into cDNA, and samples were diluted 1:5 with ultrapure water and stored at −80 °C for later use.

4.4. Selection of Reference Genes and PCR Primer Design

Six common reference genes from perennial ryegrass (Lolium perenne L.) (18S rRNA, SAMDC, GAPDH, E2, eIF4A, and TBP-1) and four Unigenes obtained from annual ryegrass transcriptome data [38] (Unigene71, Unigene77, Unigene755, and Unigene14912) were selected as candidate reference genes. For HIS3, available expressed sequence tags of Betula luminifera H. Winkl were used. The target genes P5CS1 and Cyt-Cu/Zn SOD were obtained from my group [39]. We used these gene sequences for cloning, followed by blast searches and primer design using the online tool Primer3 (http://frodo.wi.mit.edu/primer/) (Table 4). The primer design conditions were as follows: Tm, 58–62 °C; PCR product length, 75–150 bp; Length of primers, 18–24 bp; GC content, 45–55%. The amplification efficiency of all primers ranged from 87.1% (18S rRNA) to 108% (HIS3) (Table 4).

4.5. qRT-PCR Amplification Procedure

In a fluorescence quantitative PCR tube (TLS-0851; Bio-Rad), 2 μL of cDNA (30 ng/μL), 1.5 μL ofreverse primer (10 μmol/L), 1.5 μL of forward primer (10 μmol/L), 10 μL 2 × SYBR Premix Ex Taq (5 U/μL), and 5 μL of ddH2O were added for a total volume of 20 μL. The procedure was repeated 3 times for each biological sample and 4 times for each technology. The amplification procedure was as follows: 95 °C for 30 s, followed by 95 °C for 5 s, and 64 °C for 30 s, repeated 40 times. Then, an extension phase was performed from 60 °C to 95 °C, where the temperature for each cycle increased by 0.5 °C for 5 s to obtain Tm and fluorescent signals for the melting curve. All qRT-PCRs were run in quadruplicate for technical samples and triplicate for biological samples.

4.6. Data Analysis

qRT-PCR analyses and GeNorm, NormFinder, and BestKeeper were used to analyze the stability of 11 candidate reference genes. Finally, RefFinder was used to sequence the 11 reference genes and select the gene with the highest stability under different stress conditions. The top three ranked genes for heavy metal stress and lowest ranked gene were used to calculate P5CS1 and Cyt-Cu/Zn SOD gene expression to evaluate the effectiveness of the reference genes.

5. Conclusions

In this study, the expression levels of 11 candidate reference genes under various types of stress were analyzed in annual ryegrass. For different abiotic stresses, the most stable reference genes differed. The eIF4Aexpression was most stable under drought stress; the most appropriate reference gene is HIS3+TBP-1 under saline-alkali stress; the expression of HIS3 is best suited for the reference gene under acidic aluminum stress; Unigene71 + HIS3 is the optimal choice of reference gene under heavy metal stress. Unigene14912 was the best gene when considering all samples. The four treatments differed with respect to the most stable gene, suggesting that no single gene can be consistently used for data normalization across different conditions [40], but we found that HIS3, Unigene14912, E2 and TBP-1 were stable in two or more treatments. Based on the analysis of GeNorm software for pairwise variation, we concluded that the combination of Unigene14912 and HIS3 should be selected as the reference gene. The study results indicate genes that can be used as suitable candidate reference genes under different stresses in annual ryegrass, and provide a basis for Lolium expression analyses.

Supplementary Materials

The supplementary materials are available online, Table S1: The Ct values was collected from each treatment and time point by triplicate for biological, Table S2: The 48 annual ryegrass samples during the study and which datasets they were included in.

Acknowledgments

We thank all participants for their contributions to this study. This work was supported by the Earmarked Fund for the Modern Agro-Industry Technology Research System (#CARS-34) and the National Key Basic Research Program of China (973 Program) (#2014CB138705).

Author Contributions

Xinquan Zhang conceived the project and designed the experiments. Qiuxu Liu performed the experiment. Qiuxu Liu, Xiao Qi and Gang Nie wrote the paper. All authors discussed the results and commented on the manuscript.

Conflicts of Interest

The authors declare no conflict of interest.

References

  1. Castanheira, N.; Dourado, A.C.; Alves, P.I.; Cortéspallero, A.M.; Delgadorodríguez, A.I.; Prazeres, Â.; Borges, N.; Sánchez, C.; Barreto Crespo, M.T.; Fareleira, P. Annual ryegrass-associated bacteria with potential for plant growth promotion. Microbiol. Res. 2014, 169, 768–779. [Google Scholar] [CrossRef] [PubMed]
  2. Wang, S.; Li, H.; Lin, C. Physiological, biochemical and growth responses of Italian ryegrass to butachlor exposure. Pestic. Biochem. Physiol. 2013, 106, 21–27. [Google Scholar] [CrossRef]
  3. Zeng, K. Study on Genetic Diversity of Germplasm Resources of Lolium L. J. Anhui Agric. Sci. 2007, 35, 3252–3254. [Google Scholar]
  4. Huggett, J.; Dheda, K.; Bustin, S.; Zumla, A. Real-time RT-PCR normalisation; strategies and considerations. Genes Immun. 2005, 6, 279–284. [Google Scholar] [CrossRef] [PubMed]
  5. Pfaffl, M.W. Relative quantification. In Real-Time PCR; Dorak, T., Ed.; Taylor and Francis Group: New York, NY, USA, 2006; pp. 63–82. [Google Scholar]
  6. Quackenbush, J. Microarray data normalization and transformation. Nat. Genet. 2002, 32, 496–501. [Google Scholar] [CrossRef] [PubMed]
  7. Volkov, R.A.; Panchuk, I.I.; Schöffl, F. Heat-stress-dependency and developmental modulation of gene expression: The potential of house-keeping genes as internal standards in mRNA expression profiling using real-time RT-PCR. J. Exp. Bot. 2003, 54, 2343–2349. [Google Scholar] [CrossRef] [PubMed]
  8. Remans, T.; Smeets, K.; Opdenakker, K.; Mathijsen, D.; Vangronsveld, J.; Cuypers, A. Normalisation of real-time RT-PCR gene expression measurements in Arabidopsis thaliana exposed to increased metal concentrations. Planta 2008, 227, 1343–1349. [Google Scholar] [CrossRef] [PubMed]
  9. Zhang, L.; Tan, P.H.; Teng, K.; Yan, M.J.; He, C.Y.; Gan, L.; Yin, S.X.; Zhang, L.; Tan, P.H.; Teng, K. Screening of reference genes for real-time fluorescence quantitative PCR in Kentucky bluegrass. Acta Pratacult. Sin. 2017, 3, 75–81. [Google Scholar]
  10. Hong, S.Y.; Seo, P.J.; Yang, M.S.; Xiang, F.; Park, C.M. Exploring valid reference genes for gene expression studies in Brachypodium distachyon by real-time PCR. BMC Plant Biol. 2008, 8, 112. [Google Scholar] [CrossRef] [PubMed]
  11. Løvdal, T.; Lillo, C. Reference gene selection for quantitative real-time PCR normalization in tomato subjected to nitrogen, cold, and light stress. Anal. Biochem. 2009, 387, 238–242. [Google Scholar] [CrossRef] [PubMed]
  12. Yi, S.; Qian, Y.; Han, L.; Sun, Z.; Fan, C.; Liu, J.; Ju, G. Selection of reliable reference genes for gene expression studies in Rhododendron micranthum Turcz. Sci. Hortic. 2012, 138, 128–133. [Google Scholar] [CrossRef]
  13. Sun, Y.L.; Zhang, D.H.; Zhao, L.; Xia, C.C.; Minxia, C. Reference gene selection for real-time quantitative PCR in black medic (Medicago lupulina L.) root tissue under copper stress. J. Agric. Biotechnol. 2014. [Google Scholar] [CrossRef]
  14. Jiang, X.M.; Zhang, X.Q.; Yan, H.D.; Zhang, Y.; Yang, S.T.; Huang, L.K. Reference gene selection for Real-time quantitative PCR normalization in switchgrass (Panicum virgatum L.) root tissue. J. Agric. Biotechnol. 2014, 22, 55–63. [Google Scholar]
  15. Xiao, D.; Zhang, N.W.; Zhao, J.J.; Bonnema, G.; Hou, X.L. Validation of reference genes for real-time quantitative PCR normalisation in non-heading Chinese cabbage. Funct. Plant Biol. 2012, 39, 342–350. [Google Scholar] [CrossRef]
  16. Nicot, N.; Hausman, J.F.; Hoffmann, L.; Evers, D. Reference gene selection for RT-qPCRnormalization in potato during biotic and abiotic stress. J. Exp. Bot. 2005, 56, 2907–2914. [Google Scholar] [CrossRef] [PubMed]
  17. Vandesompele, J.; Preter, K.D.; Pattyn, F.; Poppe, B.; Roy, N.V.; Paepe, A.D.; Speleman, F. Accurate normalization of real-time quantitative RT-PCR data by geometric averaging of multiple internal control genes. Genome Biol. 2002, 3, research0034.1. [Google Scholar] [CrossRef] [Green Version]
  18. Andersen, C.L.; Jensen, J.L.; Ørntoft, T.F. Normalization of real-time quantitative reverse transcription-PCR data: A model-based variance estimation approach to identify genes suited for normalization, applied to bladder and colon cancer data sets. Cancer Res. 2004, 64, 5245–5250. [Google Scholar] [CrossRef] [PubMed]
  19. Ferreira, V.; Matos, M.; Correia, S.; Martins, N.; Gonçalves, S.; Romano, A.; Pinto-Carnide, O. Genetic diversity of two endemic and endangered Plantago species. Biochem. Syst. Ecol. 2013, 51, 37–44. [Google Scholar] [CrossRef]
  20. Xie, F.; Sun, G.; Stiller, J.W.; Zhang, B. Genome-Wide Functional Analysis of the Cotton Transcriptome by Creating an Integrated EST Database. PLoS ONE 2011, 6, e26980. [Google Scholar] [CrossRef] [PubMed]
  21. Hellemans, J.; Mortier, G.; Paepe, A.D.; Speleman, F.; Vandesompele, J. qBase relative quantification framework and software for management and automated analysis of real-time quantitative PCR data. Genome Biol. 2007, 8, R19. [Google Scholar] [CrossRef] [PubMed]
  22. Kumar, V.; Shriram, V.; Kishor, P.B.K.; Jawali, N.; Shitole, M.G. Enhanced proline accumulation and salt stress tolerance of transgenic indica rice by over-expressing P5CSF129A gene. Plant Biotechnol. Rep. 2010, 4, 37–48. [Google Scholar] [CrossRef]
  23. Chinnusamy, V.; Zhu, J.; Zhu, J.K. Cold stress regulation of gene expression in plants. Trends Plant Sci. 2007, 12, 444–451. [Google Scholar] [CrossRef] [PubMed]
  24. Greenway, H.; Munns, R. Mechanisms of Salt Tolerance in Nonhalophytes. Annu. Rev. Plant Biol. 2003, 31, 149–190. [Google Scholar] [CrossRef]
  25. Murgia, I.; Tarantino, D.; Vannini, C.; Bracale, M.; Carravieri, S.; Soave, C. Arabidopsis thaliana plants overexpressing thylakoidal ascorbate peroxidase show increased resistance to Paraquat-induced photooxidative stress and to nitric oxide-induced cell death. Plant J. 2004, 38, 940–953. [Google Scholar] [CrossRef] [PubMed]
  26. Mccord, J.M.; Fridovich, I. Superoxide dismutase. An enzymic function for erythrocuprein (hemocuprein). J. Biol. Chem. 1969, 244, 6049–6055. [Google Scholar] [PubMed]
  27. Baum, J.A.; Scandalios, J.G. Developmental Expression and Intracellular Localization of Superoxide Dismutases in Maize. Differentiation 1979, 13, 133–140. [Google Scholar] [CrossRef]
  28. Bustin, S.A. Absolute quantification of mRNA using real-time reverse transcription polymerase chain reaction assays. J. Mol. Endocrinol. 2000, 25, 169–193. [Google Scholar] [CrossRef] [PubMed]
  29. Hamalainen, H.K.; Tubman, J.C.; Vikman, S.; Kyrölä, T.; Ylikoski, E.; Warrington, J.A.; Lahesmaa, R. Identification and validation of endogenous reference genes for expression profiling of T helper cell differentiation by quantitative real-time RT-PCR. Anal. Biochem. 2001, 299, 63–70. [Google Scholar] [CrossRef] [PubMed]
  30. Paolacci, A.R.; Tanzarella, O.A.; Porceddu, E.; Ciaffi, M. Identification and validation of reference genes for quantitative RT-PCR normalization in wheat. BMC Mol. Biol. 2009, 10, 1–27. [Google Scholar] [CrossRef] [PubMed] [Green Version]
  31. Reid, K.E.; Olsson, N.; Schlosser, J.; Peng, F.; Lund, S.T. An optimized grapevine RNA isolation procedure and statistical determination of reference genes for real-time RT-PCR during berry development. BMC Plant Biol. 2006, 6, 27. [Google Scholar] [CrossRef] [PubMed]
  32. Lee, J.M.; Roche, J.R.; Donaghy, D.J.; Thrush, A.; Sathish, P. Validation of reference genes for quantitative RT-PCR studies of gene expression in perennial ryegrass (Lolium perenne L.). BMC Mol. Biol. 2010, 11, 8. [Google Scholar] [CrossRef] [PubMed]
  33. Dombrowski, J.E.M. Ruth C, Evaluation of reference genes for quantitative RT-PCR in Lolium temulentum under abiotic stress. Plant Sci. 2009, 176, 390–396. [Google Scholar] [CrossRef]
  34. Zhu, X.; Li, X.; Chen, W.; Chen, J.; Lu, W.; Lei, C.; Fu, D. Evaluation of New Reference Genes in Papaya for Accurate Transcript Normalization under Different Experimental Conditions. PLoS ONE 2012, 7, e44405. [Google Scholar] [CrossRef] [PubMed]
  35. Kim, B.R.; Nam, H.Y.; Kim, S.U.; Kim, S.I.; Chang, Y.J. Normalization of reverse transcription quantitative-PCR with housekeeping genes in rice. Biotechnol. Lett. 2003, 25, 1869–1872. [Google Scholar] [CrossRef] [PubMed]
  36. Schmidt, G.W.; Delaney, S.K. Stable internal reference genes for normalization of real-time RT-PCR in tobacco (Nicotiana tabacum) during development and abiotic stress. Mol. Genet. Genom. MGG 2010, 283, 233–241. [Google Scholar] [CrossRef] [PubMed]
  37. Huang, L.; Yan, H.; Jiang, X.; Zhang, Y.; Zhang, X.; Ji, Y.; Zeng, B.; Xu, B.; Yin, G.; Lee, S. Reference gene selection for quantitative real-time reverse-transcriptase PCR in orchardgrass subjected to various abiotic stresses. Gene 2014, 553, 158–165. [Google Scholar] [CrossRef] [PubMed]
  38. Ling, P.; Zhang, X.; Wang, J.; Xiao, M.; Zhou, M.; Huang, L.K.; Gang, N.; Wang, P.; Yang, Z.; Ji, L. Transcriptional Profiles of Drought-Related Genes in Modulating Metabolic Processes and Antioxidant Defenses in Lolium multiflorum. Front. Plant Sci. 2016, 7, 519. [Google Scholar] [CrossRef]
  39. Wang, X.; Ma, X.; Huang, L.; Zhang, X. Identification of the Valid Reference Genes for Quantitative RT-PCR in Annual Ryegrass (Lolium multiflorum) under Salt Stress. Molecules 2015, 20, 4833–4847. [Google Scholar] [CrossRef] [PubMed]
  40. Gu, C.; Chen, S.; Liu, Z.; Shan, H.; Luo, H.; Guan, Z.; Chen, F. Reference gene selection for quantitative real-time PCR in Chrysanthemum subjected to biotic and abiotic stress. Mol. Biotechnol. 2011, 49, 192–197. [Google Scholar] [CrossRef] [PubMed]
Sample Availability: Samples of the compounds are available from the authors.
Figure 1. PCR products for 11 reference genes. M: DNA marker, 1: 18S rRNA, 2: E2, 3: eIF4A, 4: GAPDH, 5: HIS3, 6: SAMDC, 7: TBP-1, 8: Unigene71, 9: Unigene77, 10: Unigene755, 11: Unigene14912.
Molecules 23 00172 g001
Figure 2. Melting curves for eleven genes.
Molecules 23 00172 g002aMolecules 23 00172 g002b
Figure 3. qRT-PCR Ct values for all candidate reference genes in annual ryegrass leaf samples under various abiotic stress conditions. Variation is displayed as medians (lines), 25th to 75th percentiles (boxes), and ranges (whiskers).
Molecules 23 00172 g003
Figure 4. Average expression stability values (M1) of candidate reference genes by GeNorm analysis: (A) acidic aluminum stress exposure; (B) drought stress exposure; (C) heavy metal stress exposure; (D) saline-alkali stress exposure; (E) all samples.
Molecules 23 00172 g004
Figure 5. Pairwise variation (V) measure of the candidate reference genes. When Vn/Vn+1 < 0.15, then the optimal number of reference genes is N.
Molecules 23 00172 g005
Figure 6. Expression levels of P5CS1 and Cyt-Cu/Zn SOD in annual ryegrass leaves under different stresses(drought stress, saline-alkali stress, acidic aluminum stress, heavy metal stress) at different times (days 0, 1, 3 and 6). (AH) represent expression levels of P5CS1 and Cyt-Cu/Zn SOD. Bars indicate standard errors and different letters above the bars represent significant differences (p < 0.05).
Molecules 23 00172 g006aMolecules 23 00172 g006b
Table 1. Expression stability values for annual ryegrass candidate reference genes calculated using BestKeeper.
RankAcidic Aluminum StressDrought StressHeavy Metal StressSaline-Alkali StressAll Samples
1Unigene71Unigene14912 Unigene71Unigene14912 Unigene14912
(1.48 ± 0.49)(1.75 ± 0.58)(0.86 ± 0.29)(2.43 ± 0.82)(2.14 ± 0.72)
2eIF4AUnigene71HIS3HIS3Unigene755
(1.76 ± 0.43)(1.98 ± 0.71)(1.56 ± 0.43)(2.46 ± 0.71)(2.95 ± 0.93)
3Unigene14912 eIF4AUnigene755Unigene71HIS3
(1.9 ± 0.64)(2.29 ± 0.55)(1.56 ± 0.49)(2.59 ± 0.93)(3.08 ± 0.87)
4HIS3E2E2SAMDCeIF4A
(2.01 ± 0.56)(2.68 ± 0.61)(2.09 ± 0.47)(2.78 ± 0.78)(3.35 ± 0.83)
5SAMDCTBP-1Unigene14912TBP-1Unigene77
(2.41 ± 0.71)(3.02 ± 0.72)(2.26 ± 0.77)(3.45 ± 0.86)(3.4 ± 1.06)
6Unigene755SAMDCUnigene77Unigene755Unigene71
(2.51 ± 0.79)(3.27 ± 0.87)(2.3 ± 0.71)(3.59 ± 1.13)(3.69 ± 1.27)
7Unigene77HIS3TBP-1Unigene77TBP-1
(2.63 ± 0.80)(4.14 ± 1.19)(2.44 ± 0.57)(3.96 ± 1.25)(4.39 ± 1.06)
818S rRNAUnigene755eIF4AeIF4AE2
(6.46 ± 0.84)(4.14 ± 1.30)(2.62 ± 0.65)(4.11 ± 1.06)(5.2 ± 1.21)
9TBP-1Unigene77SAMDCE2SAMDC
(8.25 ± 2.03)(4.23 ± 1.32)(3.78 ± 1.15)(5.15 ± 1.25)(5.22 ± 1.50)
10E218S rRNA18S rRNA18S rRNA18S rRNA
(8.83 ± 2.06)(8.82 ± 1.17)(5.09 ± 0.67)(9.7 ± 1.46)(8.57 ± 1.17)
11GAPDHGAPDHGAPDHGAPDHGAPDH
(14.04 ± 3.44)(11.84 ± 2.90)(14.26 ± 3.31)(12.12 ± 2.82)(13.36 ± 3.19)
Note: expression stability and ranking of 11 candidate reference genes calculated with BestKeeper under all sample conditions, acidic aluminum, drought, heavy metal, and saline-alkali stress. The stability of eleven reference genes was identified based on the coefficient of variation (CV) and standard deviation (SD).
Table 2. Expression stability values for annual ryegrass candidate reference genes calculated using NormFinder.
RankAcidic Aluminum Stress Drought StressHeavy Metal StressSaline-Alkali StressAll Samples
118S rRNAeIF4AUnigene71TBP-1Unigene14912
(0.545)(0.273)(0.26)(0.445)(0.899)
2SAMDCE2HIS3Unigene14912eIF4A
(0.843)(0.594)(0.374)(0.764)(0.928)
3Unigene71Unigene14912TBP-1eIF4AHIS3
(0.955)(0.606)(0.426)(0.892)(1.003)
4HIS3TBP-1eIF4AUnigene755Unigene755
(0.962)(0.734)(0.483)(1.043)(1.074)
5Unigene14912HIS3Unigene755HIS318S rRNA
(1.092)(0.874)(0.511)(1.195)(1.162)
6eIF4ASAMDCE2E2Unigene77
(1.207)(0.891)(0.550)(1.232)(1.318)
7Unigene755Unigene7118S rRNA18S rRNAUnigene71
(1.417)(1.122)(0.895)(1.319)(1.562)
8Unigene77Unigene755Unigene77Unigene77TBP-1
(1.425)(1.129)(0.976)(1.474)(1.684)
9TBP-118S rRNAUnigene14912SAMDCE2
(3.224)(1.327)(1.015)(1.487)(1.803)
10E2Unigene77SAMDCUnigene71SAMDC
(3.319)(1.472)(1.604)(1.693)(2.062)
11GAPDHGAPDHGAPDHGAPDHGAPDH
(3.707)(3.174)(4.223)(3.064)(3.564)
Note: expression stability and ranking of 11 candidate reference genes were calculated with NormFinder under all samples, acidic aluminum, drought, heavy metal and saline-alkali stress. Lower average stability (M2 value) indicates more stable expression.
Table 3. Stability ranking of candidate reference genes.
MethodStability (High→Low)
1234567891011
All samples
BestKeeperUnigene14912eIF4AHIS3Unigene755Unigene77TBP-118S rRNAE2Unigene71SAMDCGAPDH
NormFinderUnigene14912eIF4AHIS3Unigene75518S rRNAUnigene77Unigene71TBP-1E2SAMDCGAPDH
GeNormUnigene77|Unigene755HIS3Unigene14912eIF4A18S rRNAUnigene71TBP-1E2SAMDCGAPDH
RefFinderUnigene14912HIS3eIF4AUnigene755Unigene7718S rRNATBP-1Unigene71E2SAMDCGAPDH
Drought stress
BestKeepereIF4AUnigene14912E2Unigene71TBP-1SAMDC18S rRNAHIS3Unigene755Unigene77GAPDH
NormFindereIF4AE2Unigene14912TBP-1HIS3SAMDCUnigene71Unigene75518S rRNAUnigene77GAPDH
GeNormE2|TBP-1eIF4AUnigene1491218S rRNASAMDCHIS3Unigene71Unigene755Unigene77GAPDH
RefFindereIF4AE2TBP-1Unigene14912SAMDCHIS3Unigene7118S rRNAUnigene755Unigene77GAPDH
Saline-alkali stress
BestKeeperHIS3SAMDCUnigene14912TBP-1Unigene71eIF4AUnigene755Unigene77E218S rRNAGAPDH
NormFinderTBP-1Unigene14912eIF4AUnigene755HIS3E218S rRNAUnigene77SAMDCUnigene71GAPDH
GeNormUnigene755|Unigene14912HIS3Unigene71SAMDCUnigene77TBP-1eIF4AE218S rRNAGAPDH
RefFinderUnigene14912TBP-1HIS3Unigene755eIF4ASAMDCUnigene71E2Unigene7718S rRNAGAPDH
Acidic aluminum stress
BestKeepereIF4AUnigene71HIS3Unigene14912SAMDCUnigene755Unigene7718S rRNATBP-1E2GAPDH
NormFinder18S rRNASAMDCUnigene71HIS3Unigene14912eIF4AUnigene755Unigene77TBP-1E2GAPDH
GeNormSAMDC|Unigene14912HIS3eIF4AUnigene7118S rRNAUnigene77Unigene755TBP-1E2GAPDH
RefFinderSAMDCHIS3Unigene14912eIF4A18S rRNAUnigene71Unigene755Unigene77TBP-1E2GAPDH
Heavy metal stress
BestKeeperUnigene71HIS3E2Unigene755TBP-1eIF4A18S rRNAUnigene77Unigene14912SAMDCGAPDH
NormFinderUnigene71HIS3TBP-1eIF4AUnigene755E218S rRNAUnigene77Unigene14912SAMDCGAPDH
GeNormE2|Unigene71HIS3Unigene75518S rRNAUnigene77Unigene14912eIF4ATBP-1SAMDCGAPDH
RefFinderUnigene71HIS3E2Unigene755TBP-1eIF4A18S rRNAUnigene77Unigene14912SAMDCGAPDH
Table 4. Primer sequences for eleven reference genes used in the real-time qRT-PCR analysis.
Genes NameAccession IDGenes DescriptionPrimer Sequence (5′→3′) Forward and ReverseTm/°CAmplicon Length/bpAmplification EfficiencyR2
18S rRNANC003071.718S ribosomal RNAF:GATAGGAAGAGCCGACAT
R:ATACGAACCGTGAAAGCG
58.515687.1%0.999
SAMDCHO177535S-adenosylmethionine decarboxylaseF:TAGCCTGTTCATCTACTC
R:AAGAATCCTTGGAATGGT
558292.2%0.982
GAPDHGR518033Glyceraldehyde-3-phosphate dehydrogenaseF:TCTGACCGTTAGACTTGAGAAGG
R:CTTGAGCTTACCCTCAGACTCCT
59135100.8%0.991
TBP-1GO924783Proteasome regulatory subunit 6A homologF:TGCTTAGTTCCCCTAAGATAGTGA
R:CTGAGACCAAACACGATTTCA
60112104.2%0.993
eIF4AGO924770Eukaryotic initiation factor4 alphaF:AACTCAACTTGAAGTGTTGGAGTG
R:AGATCTGGTCCTGGAAAGAATATG
5916895.4%0.991
E2GO924794Ubiquitin-conjugatingenzymeF:CGGTTCTGTGCCAAAATGT
R:CAGCTATCTCCAACGGTTCA
61.611192.9%0.990
HIS3KM454863.1Imidazoleglycerol-phosphate dehydrataseF:ACTTCAAGACTGATCTGCGTTTCC
R:CATGGATGGCACAAAGGTTGG
63.380108%0.994
Unigene71 unknownF:CTTGGAGGAAGAGGGACGAG
R:GAGACAGGAGAGAGTGGCGG
61.313493.4%0.992
Unigene77 unknownF:CAGGTAAAAGGAACAAACAT
R:TCAATTCAGTAATCAAAGGC
56.99889.6%0.980
Unigene755 unknownF:AAATGATAAACTGACCAAAC
R:CCACTCAAGAGCCAAAATAG
5510191.3%0.980
Unigene14912 unknownF:TACACCCATGAGAATGCCAC
R:TGTTACCTTGAGGAGTCGGA
59.411091.2%0.982
P5CS1JX470539Delta-1-pyrroline-5-carboxylateF:ATAACCAATGCTATCCCTGAC
R:TCTTAGTCGTTGCCTTGA
51160
Cyt-Cu/Zn SODJQ269677Cytosolic Cu/Zn superoxideF:GGCTGAGTATCCCATTT
R:CTGCCTTTGCTGTTCT
5787

