Article

Multi-Dimensional Spectrum-Effect Relationship of the Impact of Chinese Herbal Formula Lichong Shengsui Yin on Ovarian Cancer

1
College of Pharmacy, Heilongjiang University of Traditional Medicine, Harbin 150040, China
2
Disha Pharmaceutical Group, Qingdao 266100, China
3
The First Affiliated Hospital, Heilongjiang University of Chinese Medicine, Harbin 150040, China
*
Author to whom correspondence should be addressed.
These authors contributed equally to this work.
Molecules 2017, 22(6), 979; https://doi.org/10.3390/molecules22060979
Submission received: 3 May 2017 / Revised: 3 June 2017 / Accepted: 5 June 2017 / Published: 13 June 2017
(This article belongs to the Special Issue Natural Products and Chronic Diseases)

Abstract

:
Lichong Shengsui Yin (LCSSY) is an effective and classic compound prescription of Traditional Chinese Medicines (TCMs) used for the treatment of ovarian cancer. To investigate its pharmacodynamic basis for treating ovarian cancer, the multi-dimensional spectrum-effect relationship was determined. Four compositions (I to IV) were obtained by extracting LCSSY successively with supercritical CO2 fluid extraction, 75% ethanol reflux extraction, and the water extraction-ethanol precipitation method. Nine samples for pharmacological evaluation and fingerprint analysis were prepared by changing the content of the four compositions. The specific proportions of the four compositions were designed according to a four-factor, three-level L9(34) orthogonal test. The pharmacological evaluation included in vitro tumor inhibition experiments and the survival extension rate in tumor-bearing nude mice. The fingerprint analyzed by chromatographic condition I (high-performance liquid chromatography-photodiode array detec tor,HPLC-PDA) identified 19 common peaks. High-performance liquid chromatography-photodiode array detector-Evaporative Light-scattering Detector (HPLC-PDA-ELSD )hyphenated techniques were used to compensate for the use of a single detector, and the fingerprint analyzed by chromatographic condition II identified 28 common peaks in PDA and 23 common peaks in ELSD. Furthermore, multiple statistical analyses were utilized to calculate the relationships between the peaks and the pharmacological results. The union of the regression and the correlation analysis results were the peaks of X5, X9, X11, X12, X16, X18, Y5, Y8, Y12, Y14, Y20, Z4, Z5, Z6, and Z8. The intersection of the regression and the correlation analysis results were the peaks of X11, X12, X16, X18, Y5, Y12, and Z5. The correlated peaks were assigned by comparing the fingerprints with the negative control samples and reference standard samples, and identifying the structure using high-performance liquid chromatography-mass spectrometry detector(HPLC-MS). The results suggested that the pharmacodynamic basis of LCSSY on anti-ovarian cancer activities were germacrone, furandiene, β-elemene, calycosin-7-glucoside, ononin, epimedin B, icariin, ginsenoside Rc, astragaloside, ginsenoside Rd, astragaloside II, and some unknown components.

Graphical Abstract

1. Introduction

Traditional Chinese medicines (TCMs) have played an increasingly significant role in protecting human health and fighting against disease in China for thousands of years [1]. TCMs have a long history of clinical use and are effective in the treatment of numerous diseases, especially various incurable diseases [2]. Following the increased incidence of cancer and chronic diseases, most therapies with chemical drugs still do not yield satisfactory outcomes in patients, and TCMs are widely accepted by billions of people all around the world. Compared with chemical drugs, the advantages of TCMs are that they have multi-target, multi-level, and multi-composition characteristics. This means that the beneficial efficacy of TCMs is determined by the synergy between multiple compositions. However, an overabundance of ingredients can cause difficulties in investigating the mechanisms involved, identifying effective substances, and controlling the quality of TCMs. To promote the development of TCMs, numerous investigations and various methods have been devised to solve these problems [3,4,5]. Of these methods, the spectrum-effect relationship method has become a research hotspot in TCM studies.
The spectrum-effect relationship is a scientific method based on the fingerprint of TCM, which determines the correlations between fingerprint and activity. The method can clarify the pharmacodynamic basis and establish evaluation methods to control TCM quality [6]. Establishment of the fingerprint, the pharmacodynamic evaluation and the data processing are important factors in spectrum-effect relationship studies. The fingerprints of TCMs can be obtained using a variety of equipment and instruments, such as HPLC [7,8], high performance thin layer chromatography (HPTLC) [9], gas chromatography-mass spectrometry (GC-MS) [10], infrared spectroscopy (IR) [11], high performance capillary electrophoresis (HPCE) [12], and other new technology [13,14,15]. However, none of these describe the entire chemical information of TCMs [16]. Therefore, multidimensional and multivariate fingerprinting was proposed to achieve better fingerprints. This is not a new invention and does not use new equipment, but utilizes two or more sets of equipment associated with two or more detectors to obtain as much information as possible from the fingerprints of TCMs. This method is more appropriate for compound prescriptions of TCMs.
Lichong Shengsui Yin (LCSSY) composed of Curcumae Rhizome, Sparganii Rhizome, Astragali Radix, Ginseng Radix et Rhizoma, Fritillariae Thunbergii Bulbus, Cervi Cornu Pantotrichum, Epimedii Folium, and Hirudo, as an effective and classic compound prescription of TCMs, is derived from Li Chong Wan in Yi Xue Zhong Zhong Can Xi Lu which is well known for treating many gynecological diseases. Many pharmacodynamics experiments have been carried out to verify the therapeutic efficacy of LCSSY in ovarian cancer [17,18,19,20,21,22,23], but the therapeutic mechanism and pharmacodynamic basis are unclear. This study aims to investigate the pharmacodynamic basis of LCSSY for treating ovarian cancer using the spectrum-effect relationship method.

2. Results and Discussion

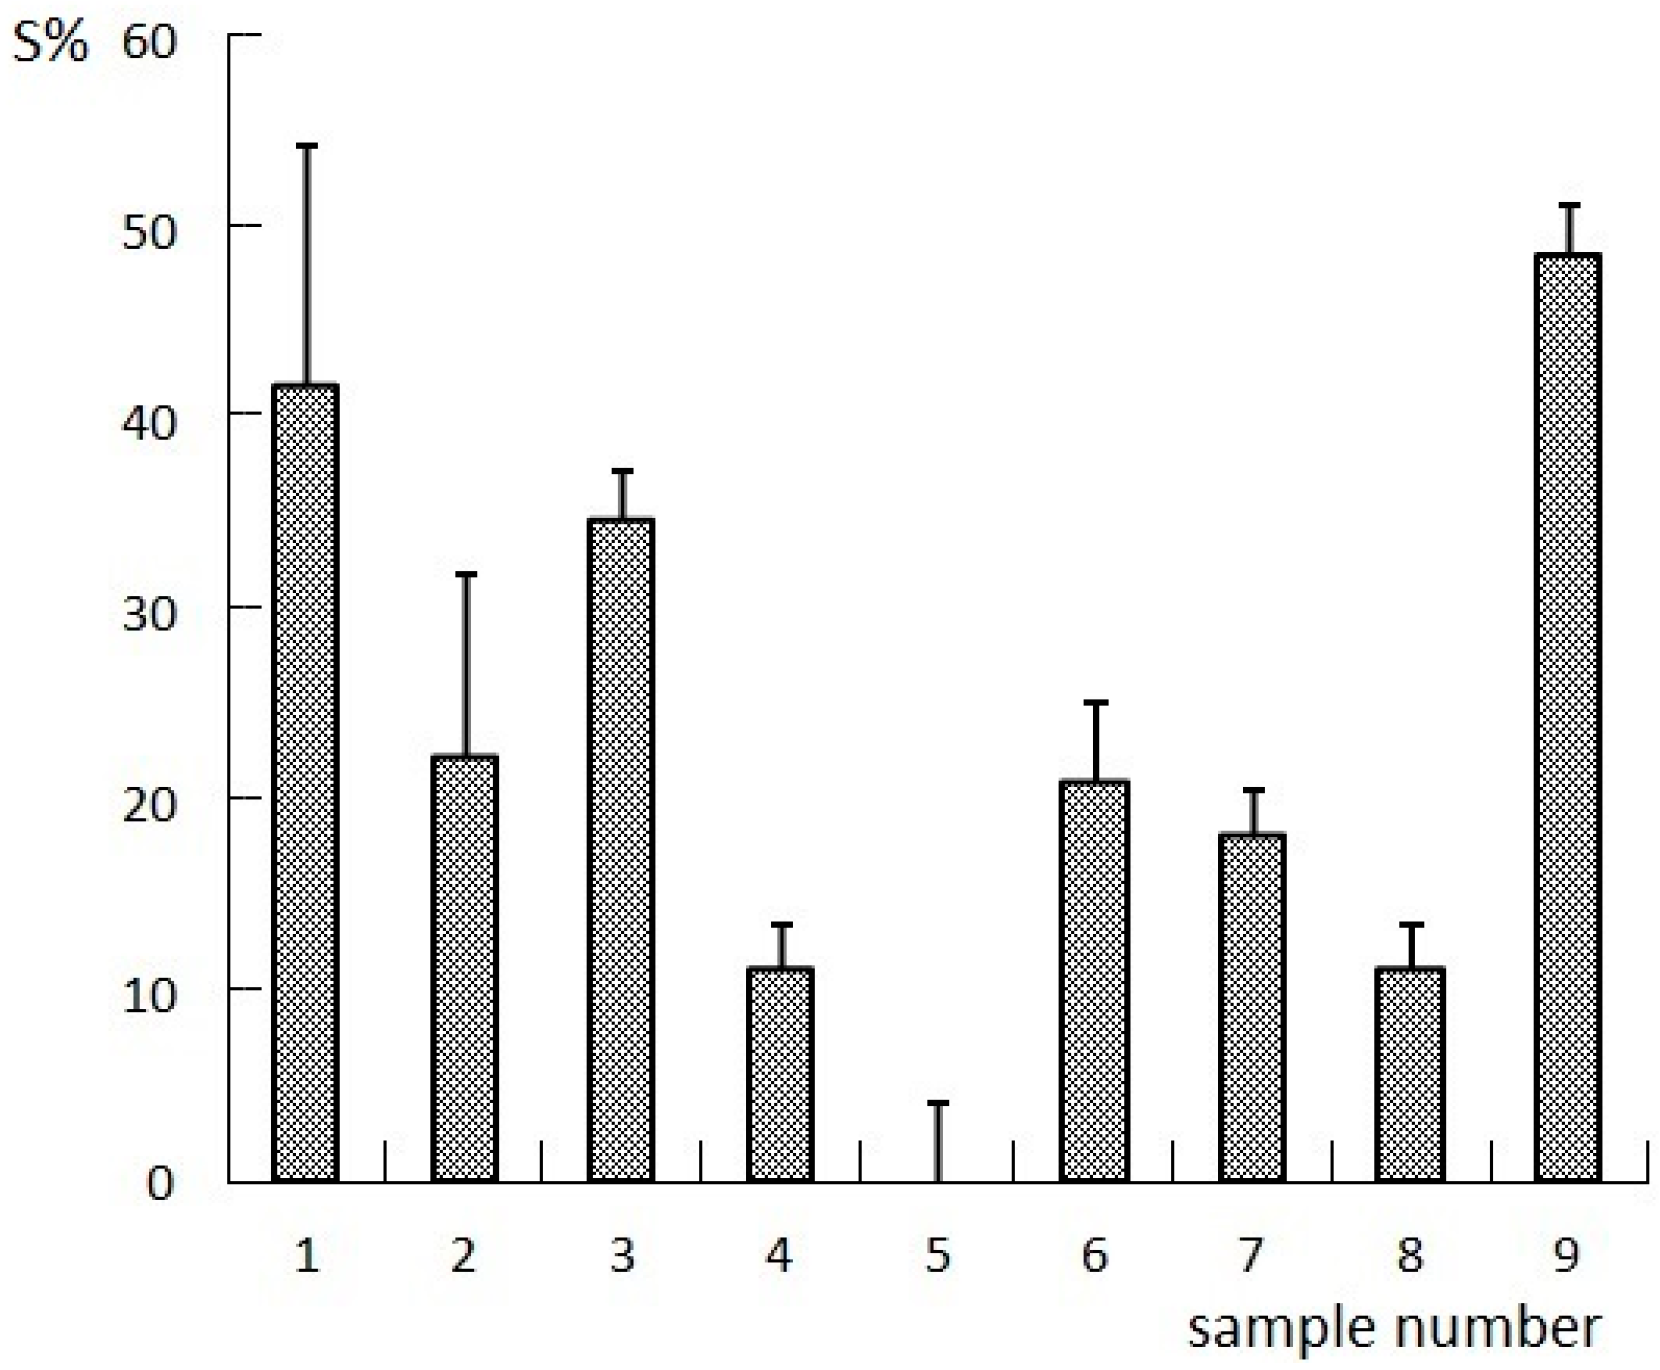
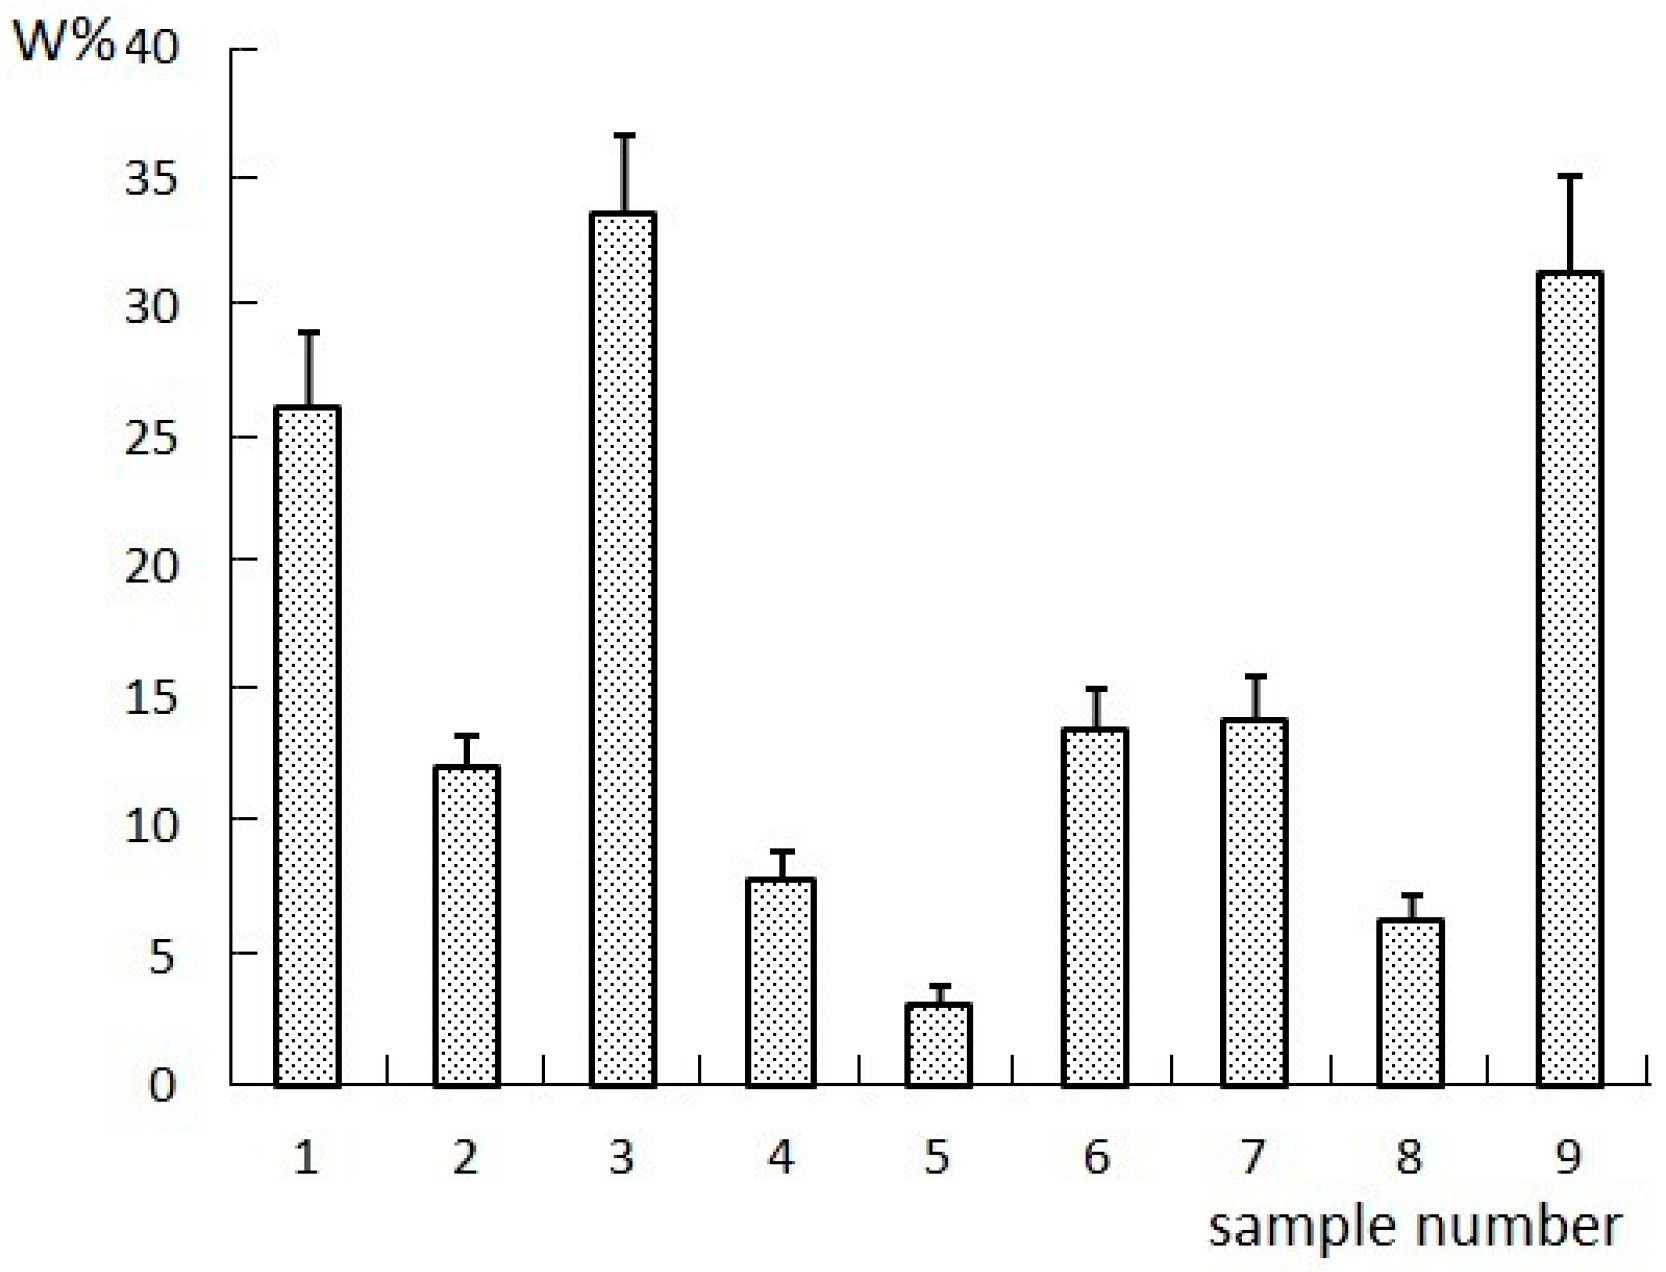
2.1. Results of the Orthogonal Compatibility Anticancer Experiment

The Chinese herbal formulas for spectrum-effect relationship studies are generally divided into different batches, different extraction methods, or different combinations [6]. Different combinations refer to the herbs, extracts, or compositions in an orthogonal compatibility combination. In this study, four compositions (I to IV) were obtained by extracting LCSSY successively with supercritical CO2 fluid extraction, 75% ethanol reflux extraction, and the water extraction-ethanol precipitation method. Nine samples for pharmacological evaluation and fingerprint analysis were prepared by changing the content of the four compositions. The specific proportions of the four compositions were designed according to a four-factor, three-level L9(34) orthogonal test. The pharmacological evaluation included in vitro tumor inhibition experiments and survival extension rate in tumor-bearing nude mice. The results of the anticancer experiment are shown in Figure 1 and Figure 2.

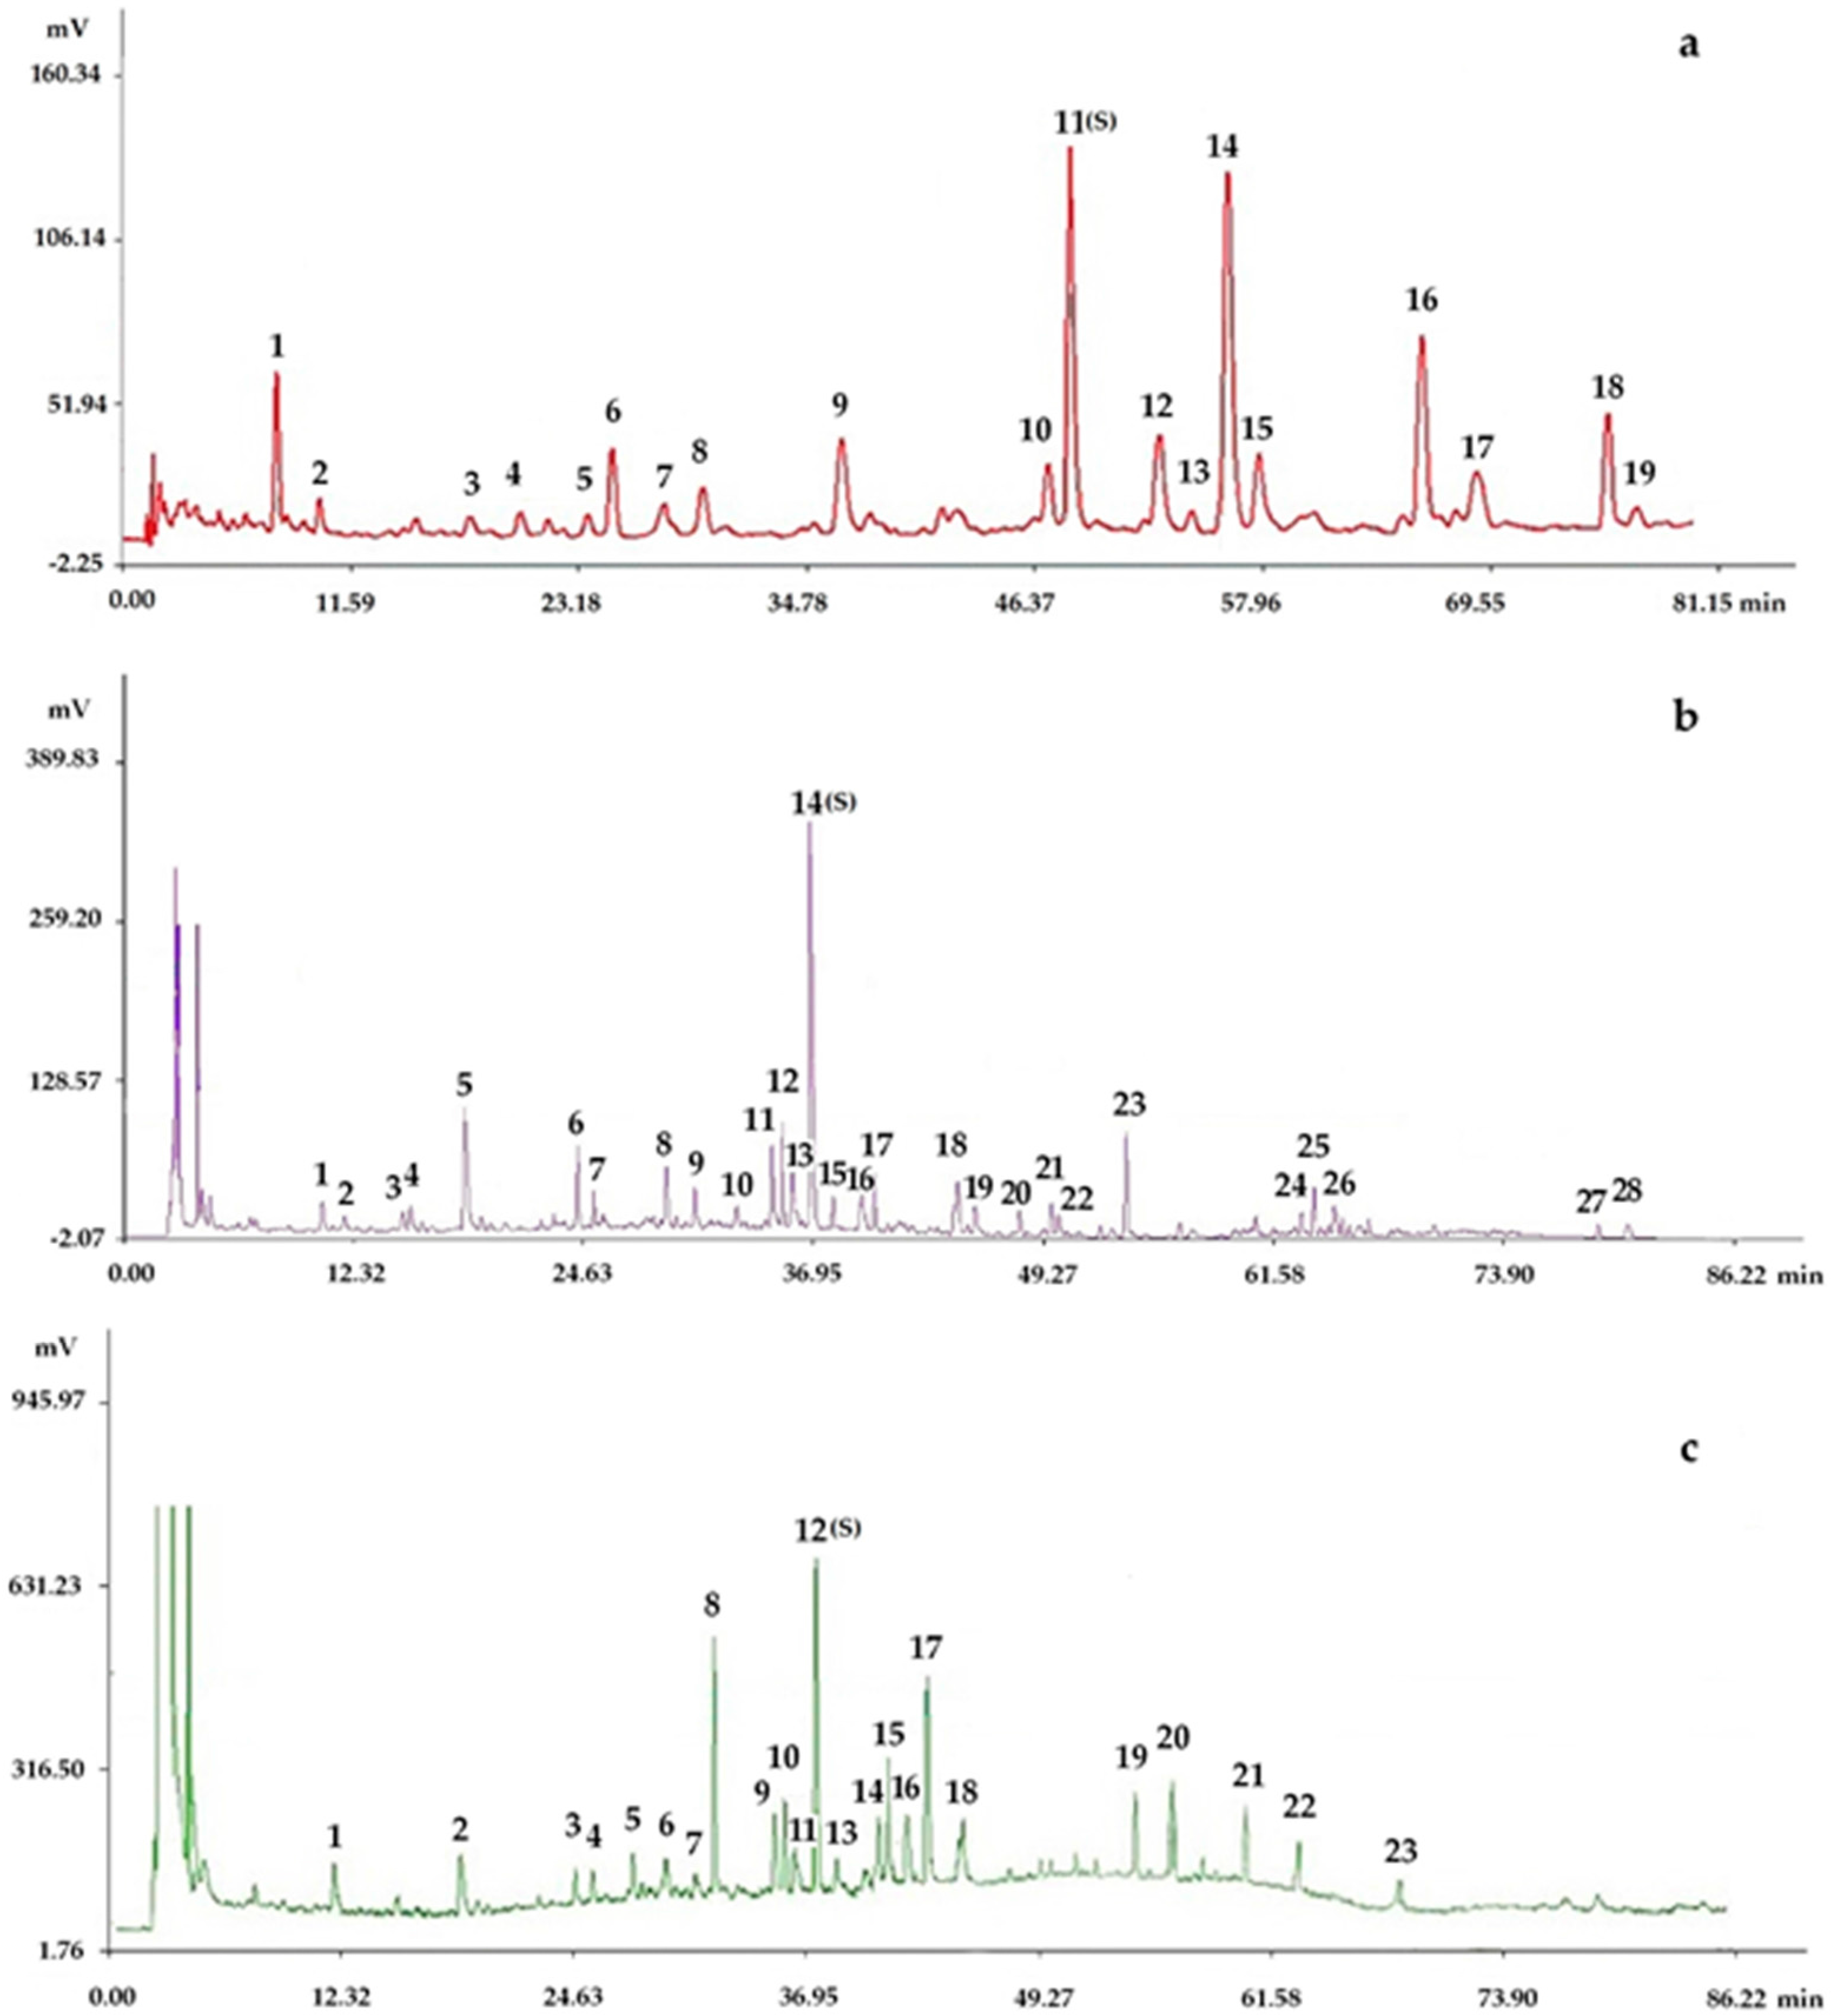
2.2. Results of the HPLC Experiment

Due to the complex chemical composition of Chinese herbal formulas, and the large differences in physical and chemical properties, obtaining the “spectrum” which reflects the entire chemical information is the key in the spectrum-effect relationship. LCSSY is comprised of Curcumae Rhizome, Sparganii Rhizome, Astragali Radix, Ginseng Radix et Rhizoma, Fritillariae Thunbergii Bulbus, Cervi Cornu Pantotrichum, Epimedii Folium, and Hirudo. There are also volatile oils, flavonoids, and saponins in LCSSY. In order to obtain more comprehensive chemical information on LCSSY, two methods of fingerprint analysis were established.

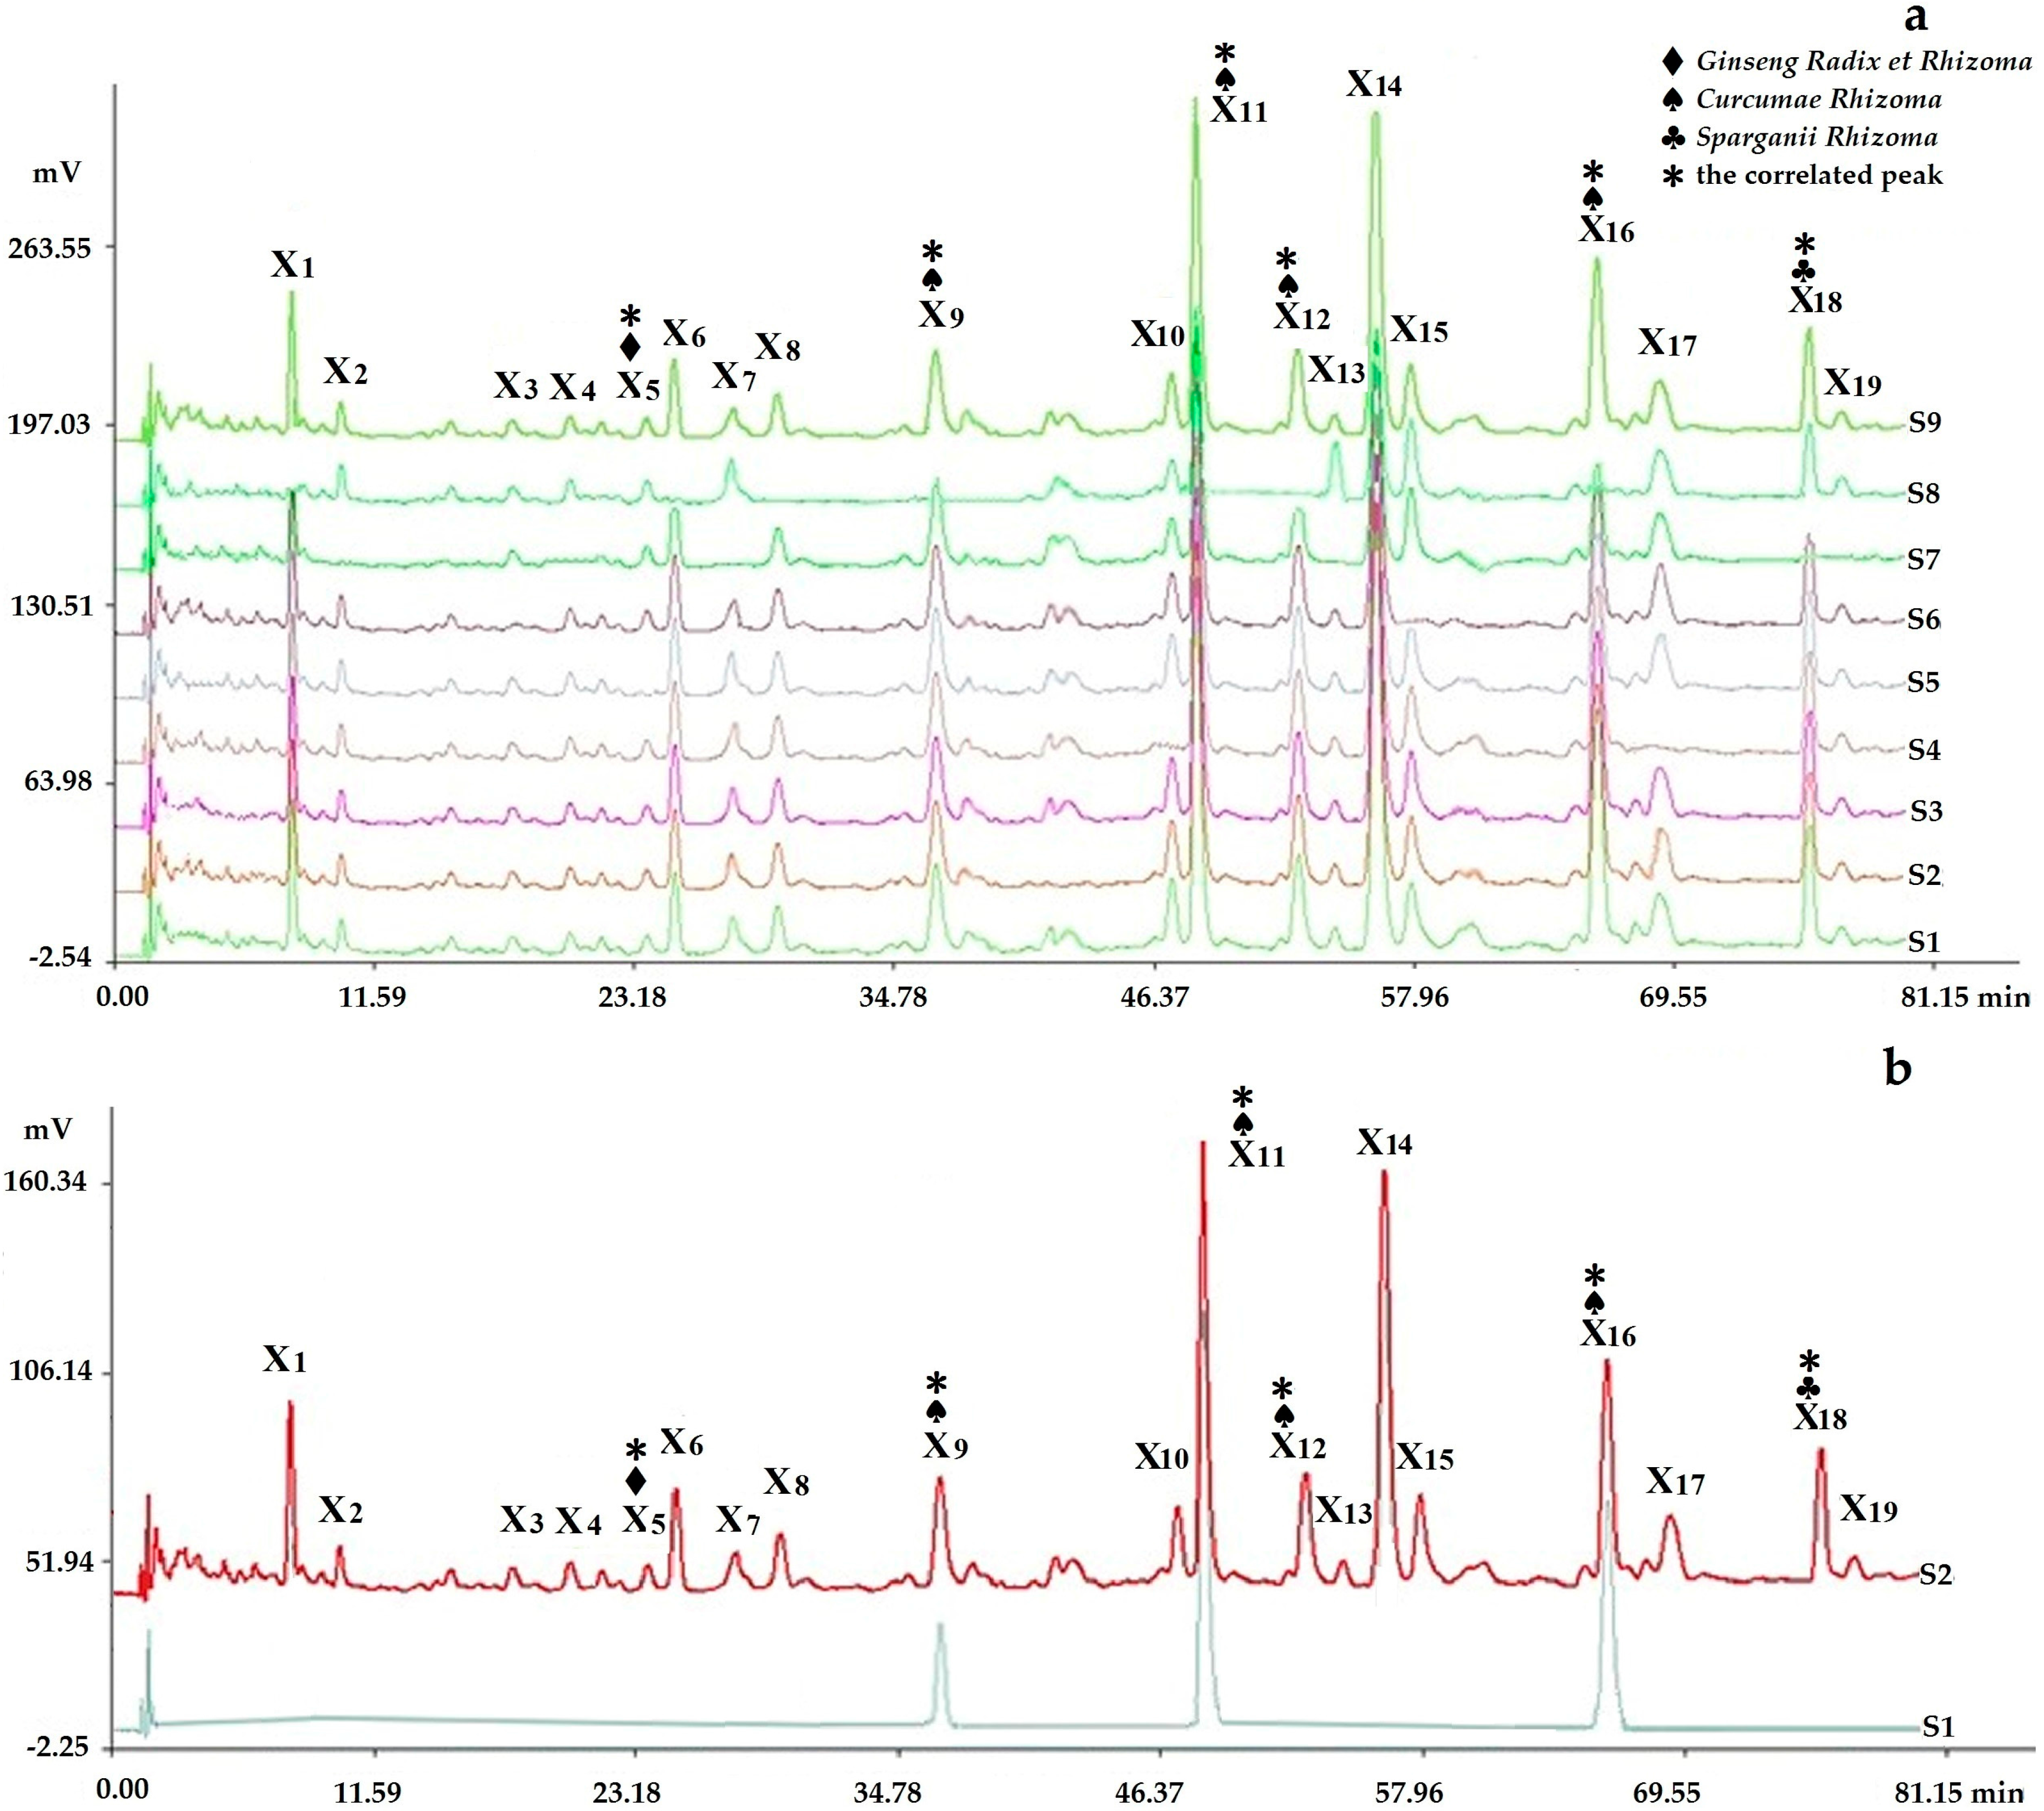
2.2.1. Fingerprints Analyzed by Chromatographic Condition I (HPLC-PDA)

The results of the methodology validation showed that the relative standard deviation(R.S.D.) of the relative retention time and relative peak area of the characteristic for precision were less than 0.32% and 1.5%, for stability were less than 0.42% and 3%, and for repeatability were less than 0.64% and 2.5%, respectively. These results demonstrate that the method used for the HPLC fingerprint analysis was stable and reliable.

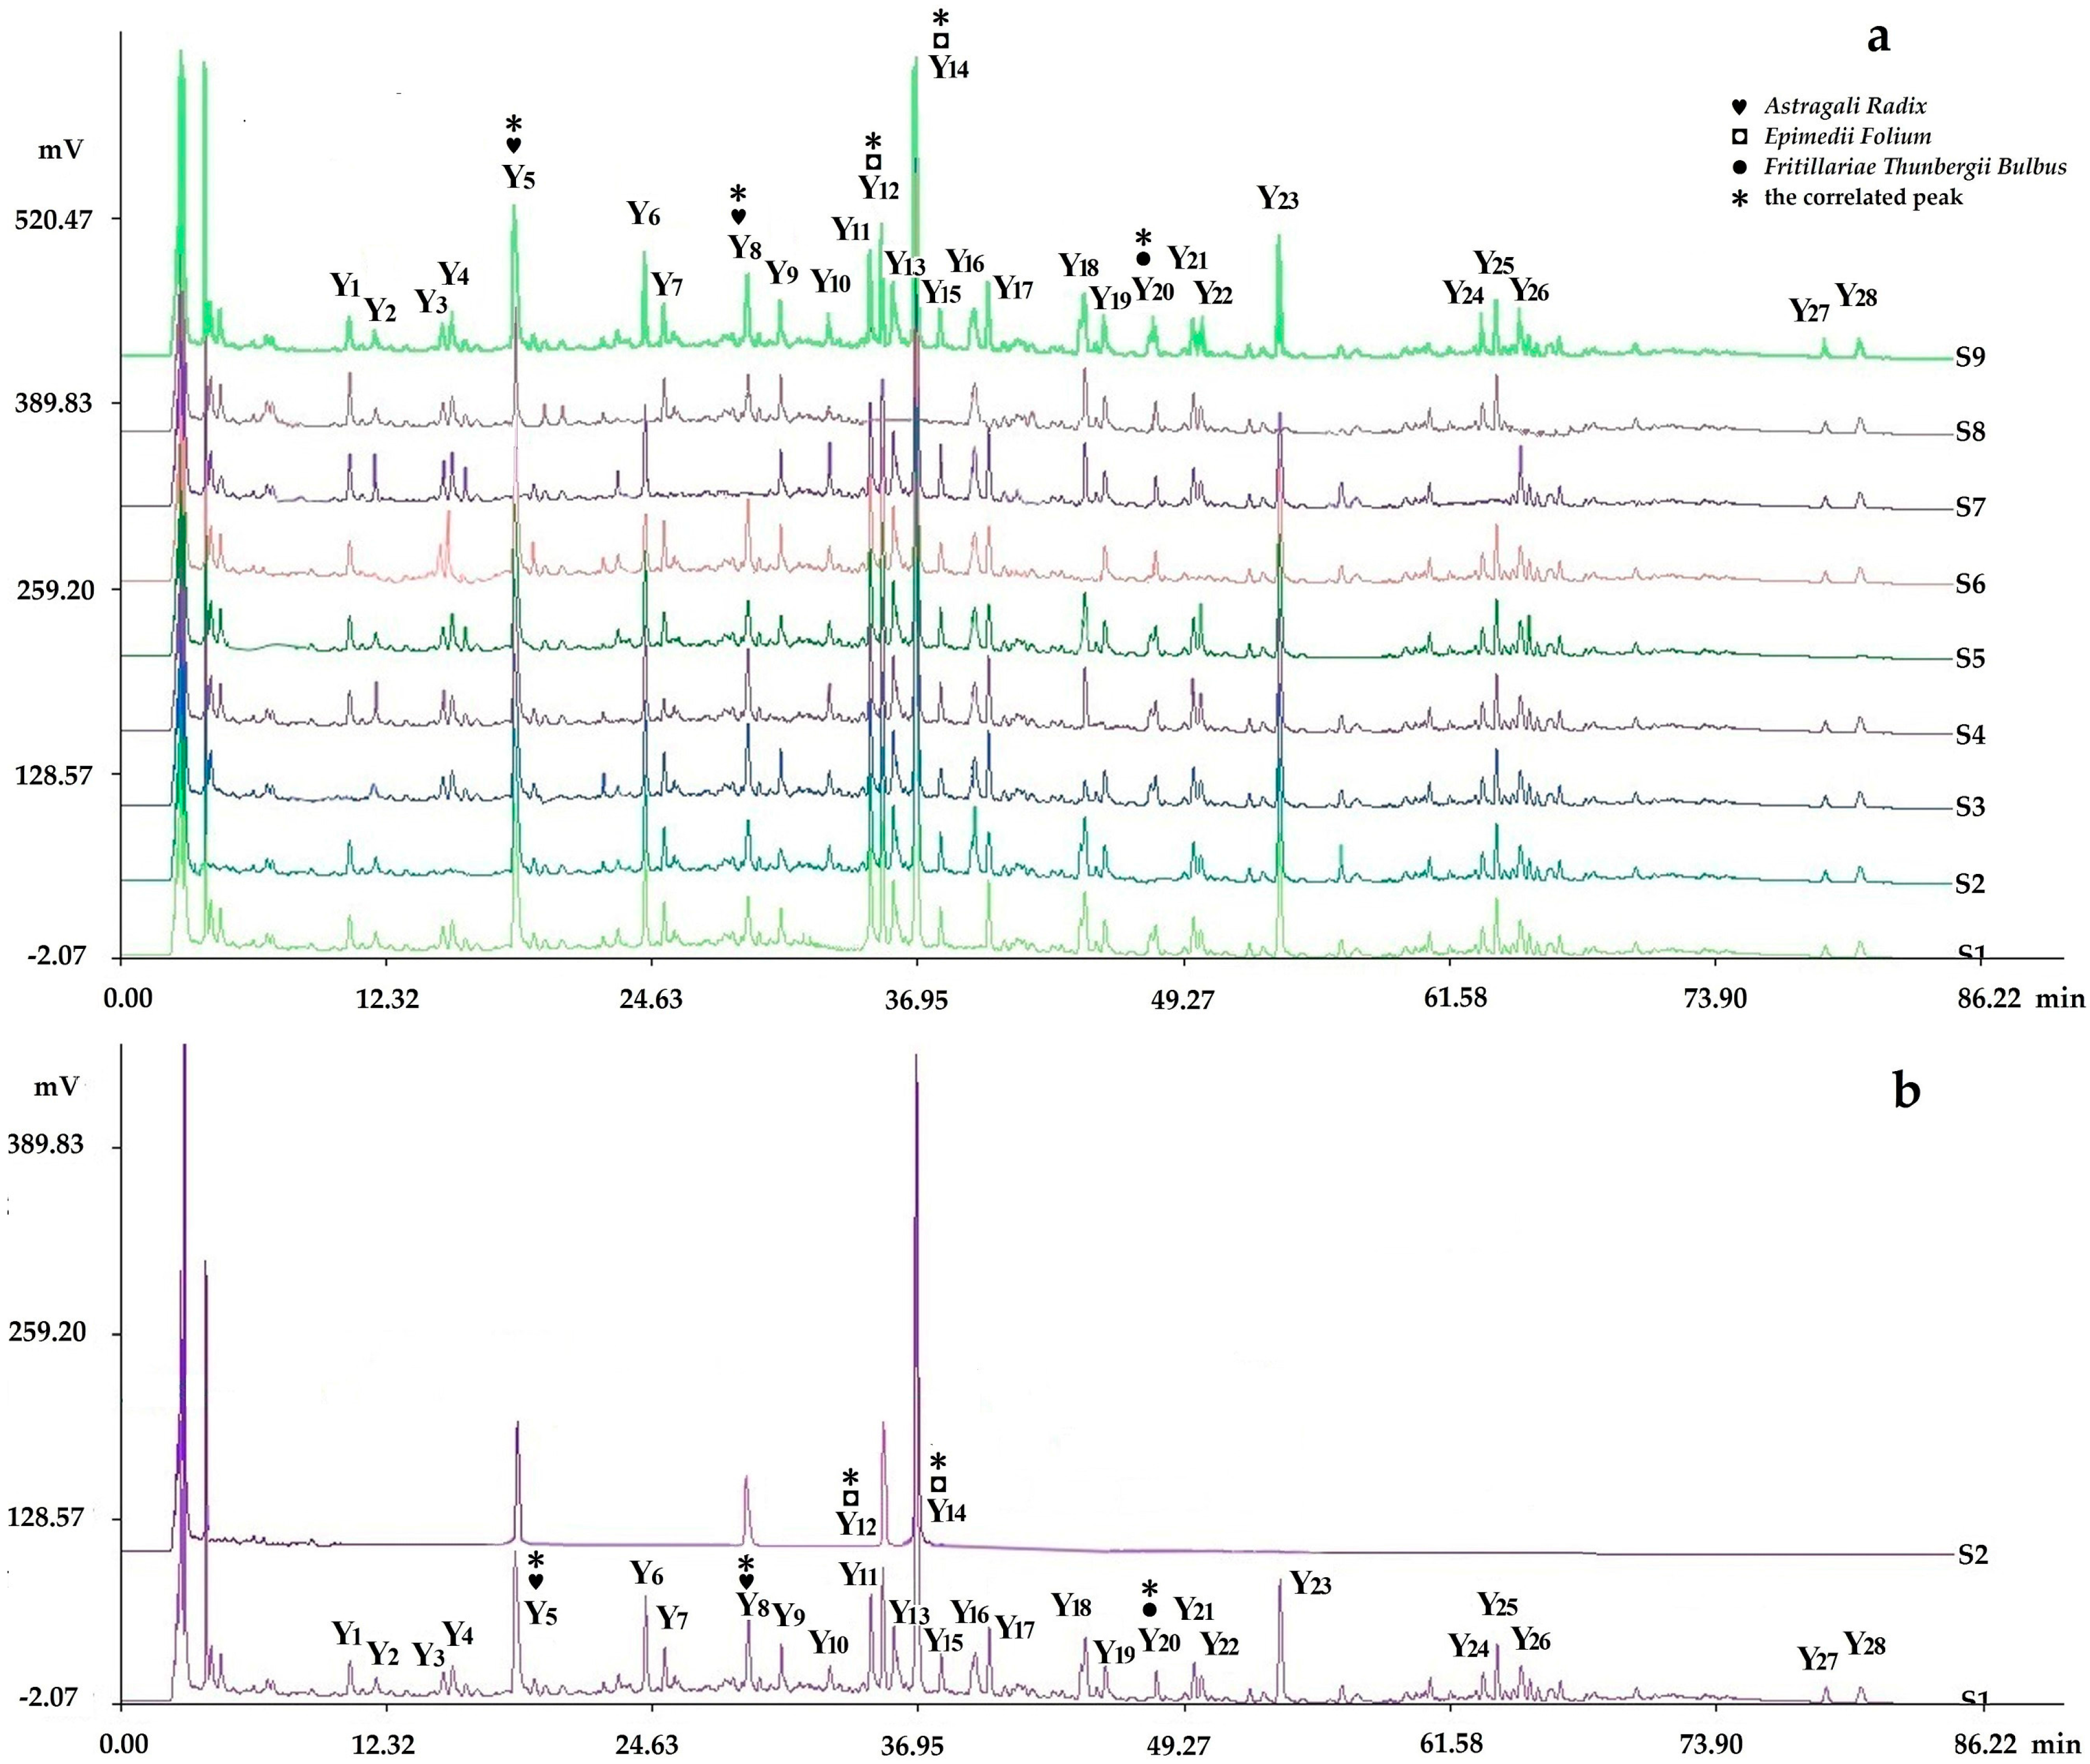
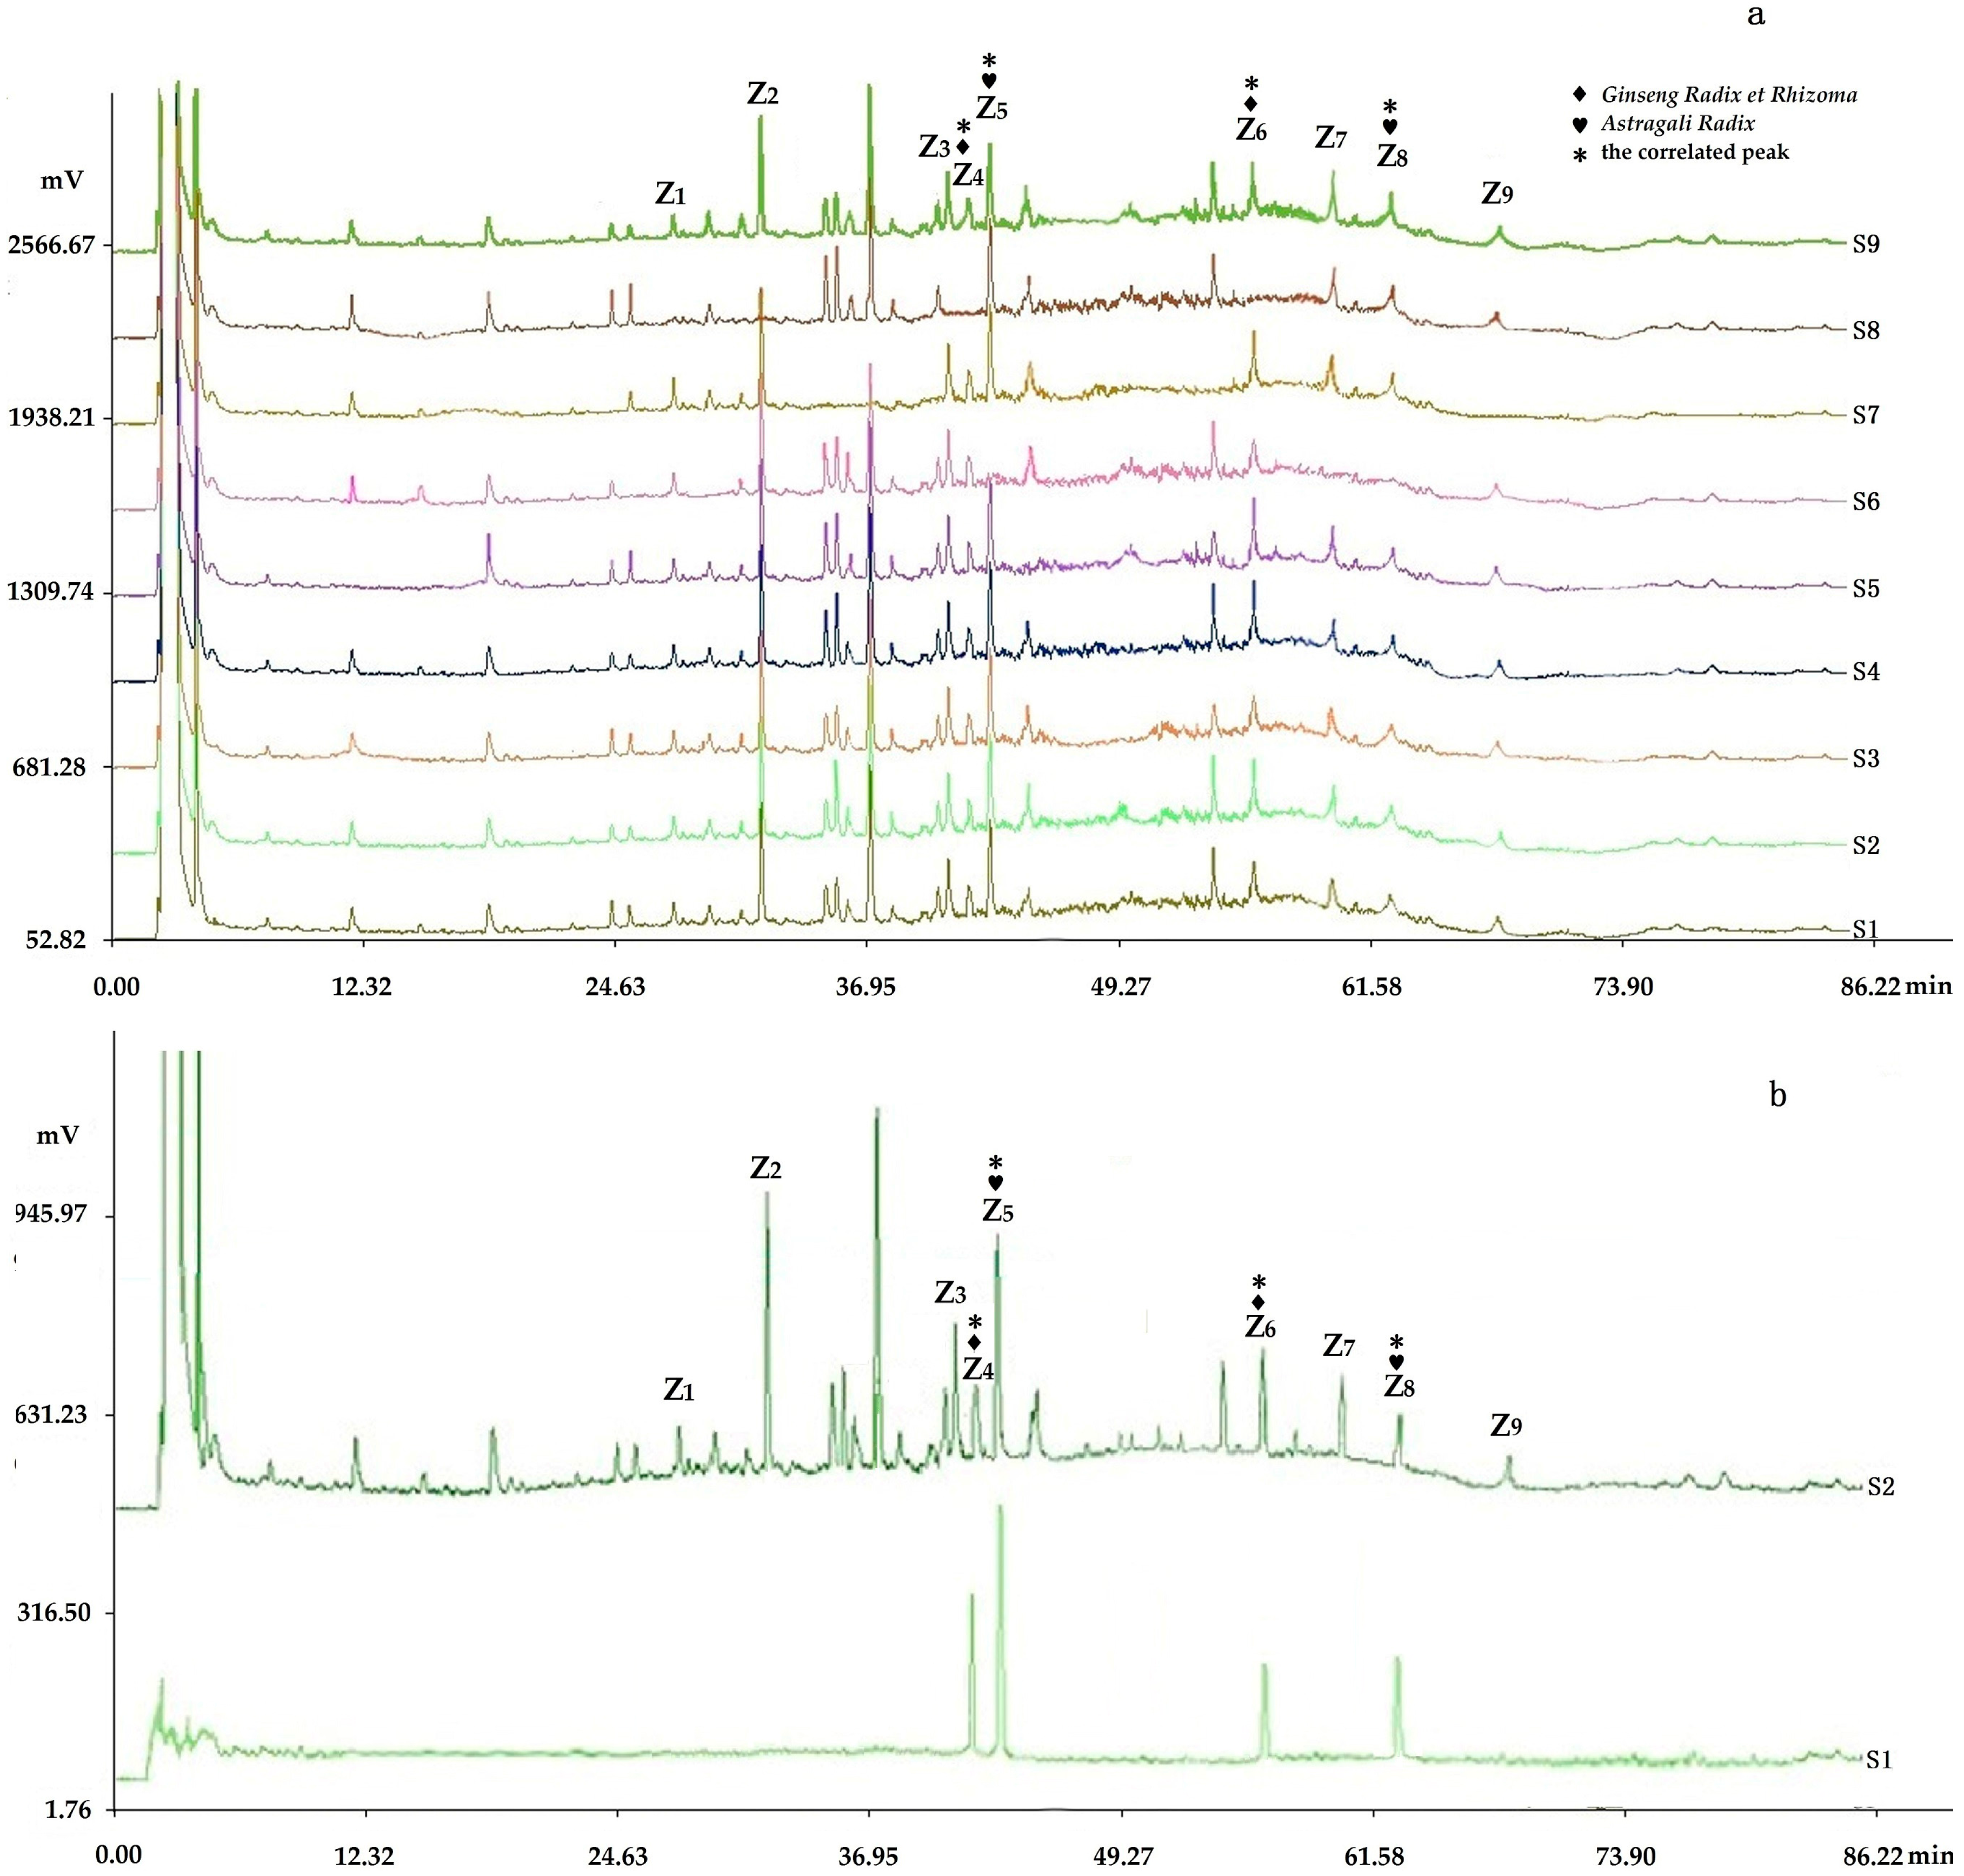
2.2.2. Fingerprints Analyzed by Chromatographic Condition II (HPLC-PDA-ELSD)

HPLC-PDA-ELSD hyphenated techniques were used to compensate for the use of a single detector. The results of the methodology validation showed that the R.S.D. of the relative retention time and relative peak area of the characteristic for precision were less than 0.5% and 1.5% in PDA and less than 1% and 1.8% in ELSD, for stability were less than 0.2% and 2% in both PDA and ELSD, and for repeatability were less than 1% and 2.5% in PDA and less than 1.3% and 3% in ELSD, respectively. These results demonstrate that the method used for the HPLC fingerprint analysis was stable and reliable.

2.2.3. Determination of Fingerprints

The representative fingerprints of the nine samples designed by the L9(34) orthogonal test are shown in Figure 3.

2.3. The Analysis of Spectrum-Effect Relationships

To avoid repeated analysis of some of the same compositions in PDA and ELSD [24] analyzed by chromatographic condition II, fourteen peaks were regarded as redundant peaks and excluded from the statistical calculations. Thus, 28 characteristic peaks marked as Y1 to Y28 in the PDA fingerprint analyzed by chromatographic condition II (HPLC-PDA), 9 characteristic peaks marked as Z1 to Z9 in the ELSD fingerprint analyzed by chromatographic condition II (HPLC-ELSD), and 19 characteristic peaks marked as X1 to X19 in the fingerprint analyzed by chromatographic condition I (HPLC-PDA) were selected to investigate the spectrum-effect relationships between the components and the pharmacological effect. Finally, the peak areas of nine prescriptions associated with the cell proliferation inhibition rate of W and survival extension rate of S formed a 9*56 data matrix for subsequent statistical analysis. The data processing methods used in the “spectrum-effect relationship” studies mainly included correlation analysis, regression analysis, and principal component analysis. Different methods have different focus points. Therefore, one or more data processing methods are commonly used in combination.

2.3.1. Regression Analysis

ENTER Method

The ENTER regression equation of W and S was respectively established by analyzing the independent variable of peak area and the dependent variables of W and S. Eight peaks were included in the equations which were X5, X11, X12, X16, X18, Y5, Y12, and Z6, the equations of which were:
W1 = 0.023X5 + 0.006X11 − 0.003X12 − 1.027 × 10−6X16 + 0.017X18 − 0.008Y5 + 0.031Y12 − 0.002Z6 − 50.90;
S1 = 0.003X5 − 0.020X11 + 0.007X12 − 0.008X16 − 0.023X18 − 0.004Y5 + 0.003Y12 + 0.011Z6 − 38.833.
Scientific notation The residuals statistics of Durbin–Watson reflected the independence between residuals in the range of 2 ± 1.5. The determination coefficient was 0.912 in W1 and 0.881 in S1, and both the residuals statistics were 2.382. The results of variance analysis demonstrated statistical significance (p < 0.05).

STEPWISE Method

The STEPWISE regression equations of W and S were respectively established by analyzing the independent variable of peak area and the dependent variables of W and S. Four peaks were retained in the equations: X11, X12, Y5, and Z4, the equations of which were:
W2 = −0.005X11 + 0.007X12 − 0.008Y5 + 0.003Z4 − 145.66;
S2 = 0.007 Z5 + 706.429.
The determination coefficient was 0.896 in W2 and 0.901 in S2, and both residuals statistics were 3.012. The results of variance analysis demonstrated statistical significance (p < 0.05).

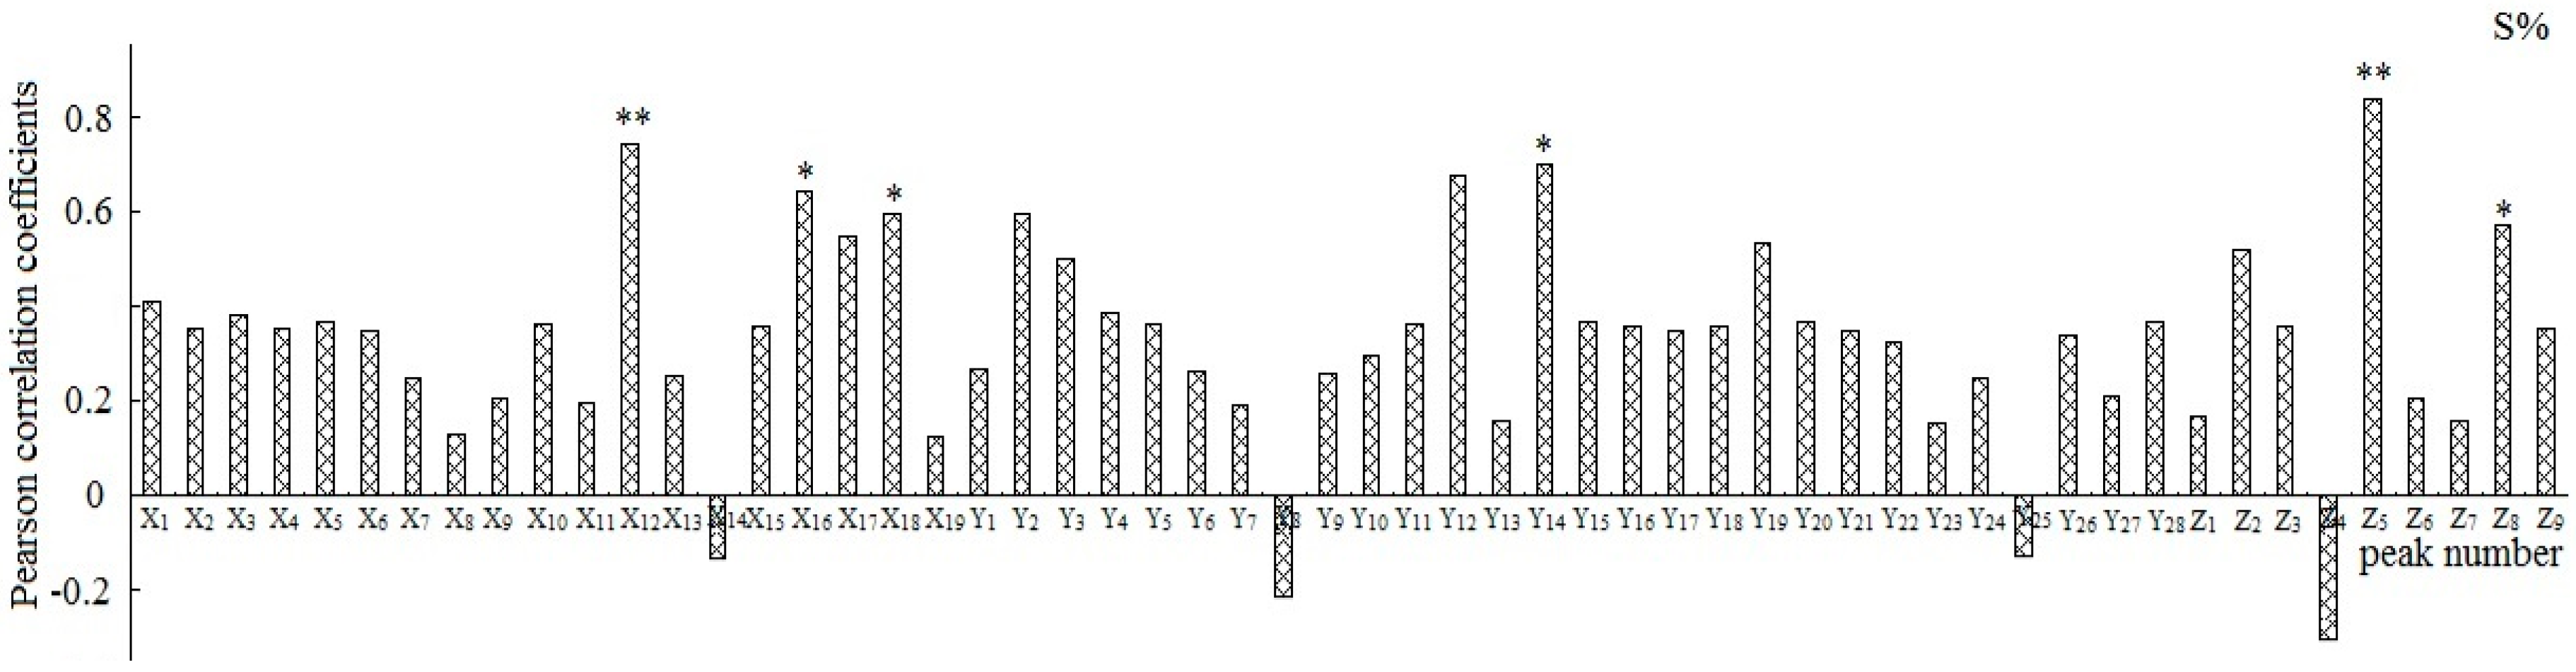
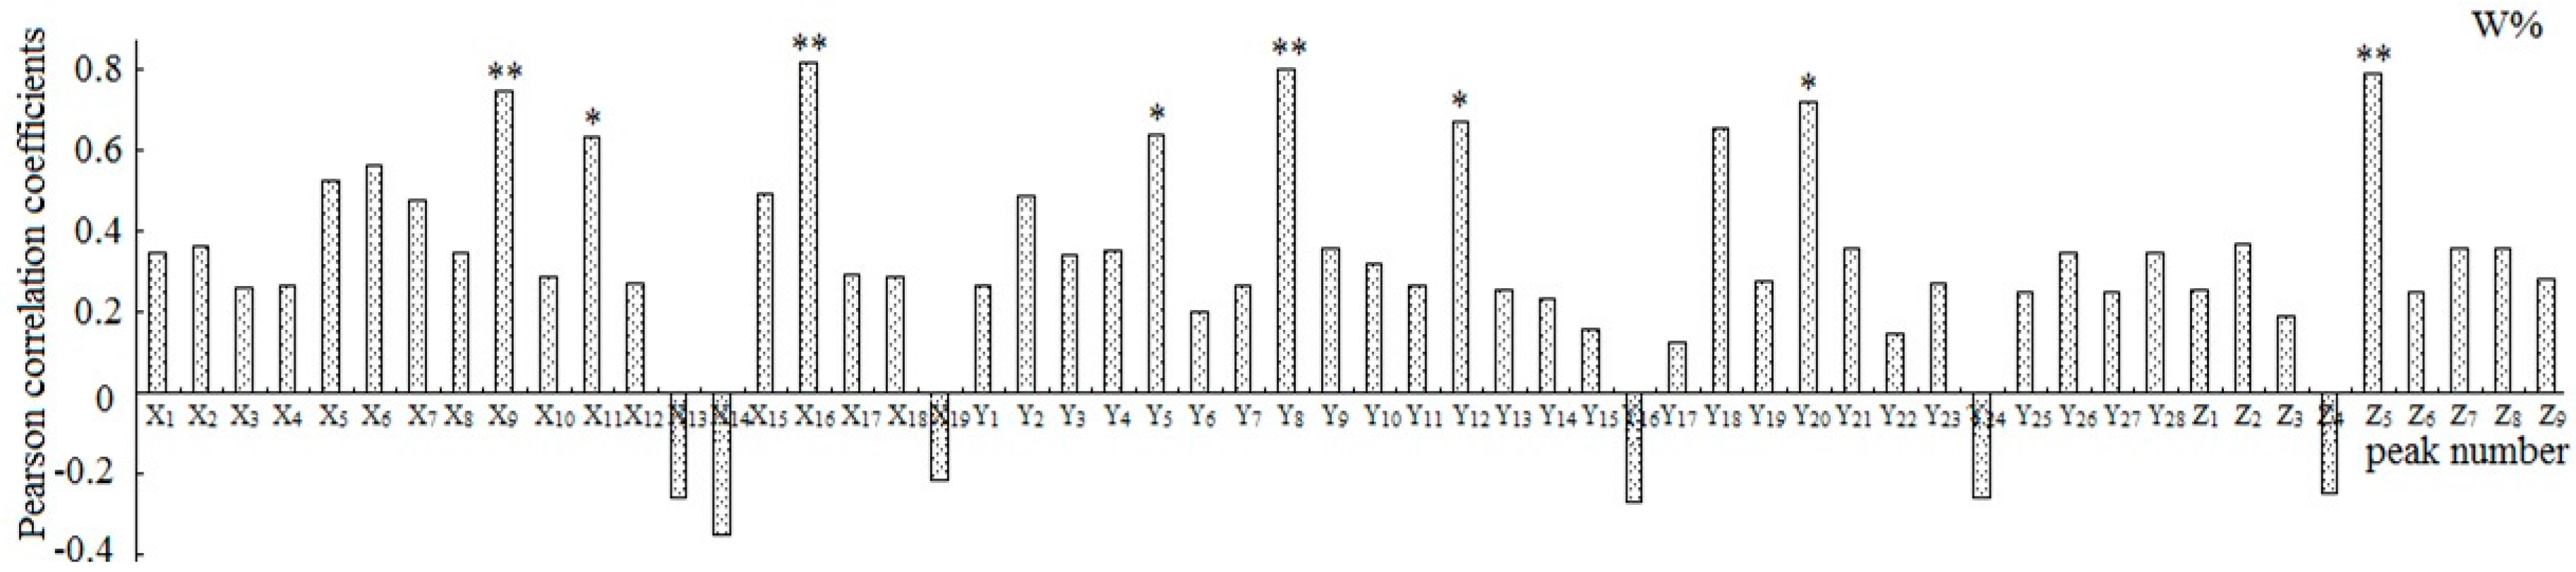
2.3.2. Correlation Analysis

Each of the peaks was respectively analyzed with the W and S, and the relationships between the peak area and the pharmacological results were reflected by Pearson’s correlation coefficient (Figure 4 and Figure 5). The results demonstrated that the peaks X9, X11, X16, Y5, Y8, Y12, Y20, and Z5 to W and the peaks X12, X16, X18, Y14, Z5, and Z8 to S showed statistical significance (p < 0.05).

2.3.3. Integration of the Analytical Results

The union of the ENTER and STEPWISE results in the regression were the peaks of X5, X11, X12, X16, X18, Y5, Y12, Z4, Z5, and Z6. The results in the correlation analysis were the peaks X9, X11, X12, X16, X18, Y5, Y8, Y12, Y14, Y20, Z5, and Z8. The union of the regression and the correlation analysis results were the peaks of X5, X9, X11, X12, X16, X18, Y5, Y8, Y12, Y14, Y20, Z4, Z5, Z6, and Z8. The intersection of the regression and the correlation analysis results were the peaks of X11, X12, X16, X18, Y5, Y12, and Z5.

2.3.4. Assignments of the Correlated Peaks

The results of the chromatograms comparing the fingerprints with negative control samples and reference standard samples (Figure 6, Figure 7 and Figure 8) and the structural identification of the correlated peaks analyzed by HPLC-MS (Table 1) showed that X5 was an unknown component from Ginseng Radix et Rhizoma; X9 was germacrone from Curcumae Rhizoma; X11 was furandiene from Curcumae Rhizoma; X12 was an unknown component from Curcumae Rhizoma; X16 was β-elemene from Curcumae Rhizoma; X18 was an unknown component from Sparganii Rhizoma; Y5 was calycosin-7-glucoside from Astragali Radix; Y8 was ononin from Astragali Radix; Y12 was epimedin B from Epimedii Folium; Y14 was icariin from Epimedii Folium; Y20 was an unknown component from Fritillariae Thunbergii Bulbus; Z4 was ginsenoside Rc from Ginseng Radix et Rhizoma; Z5 was astragaloside from Astragali Radix; Z6 was ginsenoside Rd from Ginseng Radix et Rhizoma; and Z8 was astragaloside II from Astragali Radix.
The above results suggest that the pharmacodynamic basis of the anti-ovarian cancer activities of LCSSY were germacrone, furandiene, β-elemene, calycosin-7-glucoside, ononin, epimedin B, icariin, ginsenoside Rc, astragaloside, ginsenoside Rd, astragaloside II, and some unknown components.
Germacrone and furandiene are the main indices for the quality control of zedoary turmeric oil. It was reported that germacrone can inhibit the proliferation of human ovarian cancer A2780 cells, colon cancer HCT, and nasopharyngeal carcinoma KB3 [25], and furandiene can inhibit the proliferation of many types of tumor cells, such as HL60 leukemia cells [26], and human hepatocellular carcinoma cells [27].
Numerous studies have reported that β-elemene has broad-spectrum anticancer effects, such as in ovarian cancer [28], glioblastoma cells [29], lung cancer [30,31], liver cancer, breast cancer, and brain cancer. Elemene can not only induce cell cycle arrest of different types according to different types of tumor cells, but also fights against drug-resistance.
Astragaloside is recognized as the main effective compound of Astragali Radix. It was reported that astragaloside could inhibit tumor growth in lung cancer [32,33]. It was reported that astragaloside II showed strong potency in increasing 5-fluorouracil cytotoxicity toward 5-fluorouracil-resistant human hepatic cancer cells Bel-7402/FU and may be a potential adjunctive agent for hepatic cancer chemotherapy [34]. Ginsenoside Rd can significantly inhibit the proliferation of human cervical cancer HeLa cells [35] and both gastric and breast cancer cells [36]. It was found that ginsenoside Rc can induce c-fos in MCF-7 human breast carcinoma cells at both the mRNA and protein levels [37].
Icariin has broad anticancer effects, such as in breast cancer [38], hepatoma [39], gastric cancer [40], melanoma [41], and ovarian cancer [42]. To date, there are few data on the anticancer effects of calycosin-7-glucoside, ononin, and epimedin B. The present study indicated the potential activity of these components, which requires further research.
The results mentioned in the above reports were in accordance with the results in the present study.

3. Materials and Methods

3.1. Reagents and Materials

All raw herbs comprising LCSSY, such as Curcumae Rhizome, Sparganii Rhizome, Astragali Radix, Ginseng Radix et Rhizoma, Fritillariae Thunbergii Bulbus, Cervi Cornu Pantotrichum, Epimedii Folium, and Hirudo were supplied by the First Affiliated Hospital, Heilongjiang University of Chinese Medicine (Harbin, China). Professor Huifeng Sun (College of Pharmacy, Heilongjiang University of Traditional Medicine, Harbin, China) authenticated these herbs and voucher specimens were deposited in the College of Pharmacy, Heilongjiang University of Traditional Medicine (Harbin, China).
SKOV3 tumor cell lines were purchased from Jiangsu Qishi Biological Science and Technology Co. Ltd. (Shanghai, China), incubated in fresh complete culture solution composed of 90% RPMI 1640, 10% fetal bovine serum, and 1% myllicin, and were then adjusted to yield approximately 107 CFU/mL in each fresh complete culture solution.
Wistar rats (mean weight 200 ± 20 g, mean age 6 weeks) were bought from the Safety Evaluation Center of Heilongjiang University of Chinese Medicine (Harbin, China), and nude mice (mean weight 16 ± 2 g, mean age 4–6 weeks) inoculated with SKOV3 tumor cells were bought from Beijing Weitong Lihua Co. Ltd. (Beijing, China). Both the rats and nude mice were bred and the experiments were carried out in the Safety Evaluation Center of Heilongjiang University of Chinese Medicine (Harbin, China) according to the current national legislation on animal experiments. All animals were female and were randomized to the different treatment groups. The experimental protocol was approved by the Animal Ethics Committee of Heilongjiang University of Chinese Medicine and conformed to the National Institute of Health and Nutrition Guide for Care and Use of Laboratory Animals.
HPLC-grade acetonitrile and methanol were from Sigma-Aldrich (St. Louis, MO, USA). Methanol, ethanol, formic acid, and all other reagents were AR grade from Shanghai Wujin Chemical Regent Factory (Shanghai, China). Water was obtained from Watsons (Hong Kong, China).

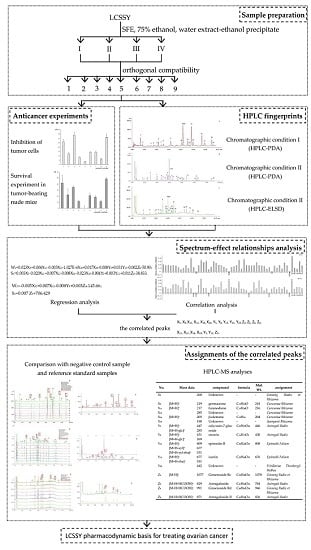
3.2. Sample Preparation

A prescription volume of LCSSY was extracted by supercritical CO2 to obtain Composition I under the conditions of 30 Kpa extraction pressure and 50 °C extraction temperature, and was resolved at 6 Kpa and 50 °C with a SFE Device (Nantonghua’an Company, Nantong, China). The first deposits were added to 75% ethanol to extract Composition II. After filtration, Composition III and Composition IV were acquired by the water extraction-ethanol precipitation method from the second deposits.
The original proportion of each composition was regarded as Level 1 of the orthogonal experiment, no Composition as Level 2, and twice the proportion as Level 3 with the four compositions used as the factors to design the orthogonal compatibility experiment by L9(34) in Table 2 and Table 3. Experiments on the nine samples were then performed, followed by anticancer experiments and HPLC analysis.

3.3. Anticancer Experiments

3.3.1. Inhibition of Tumor Cells

All nine samples comprising the four compositions (Table 3) were dissolved in 150 mL sterilized distilled water and were gavaged to nine groups of Wistar rats (six in each group) at an equivalent clinical dosage. The dosage of administration was 2 mL/200 g, twice a day, and continuous administration for three days. Three days later, fundus blood from Wistar rats was obtained 2 h after gavage administration to obtain serum in order to investigate the effect of the prescriptions on SKOV3 tumor cell lines [43,44]. After incubation under 5% CO2 at 37 °C for 24 h, SKOV3 cells (104 cells per well) were subsequently inoculated onto 96-well plates. After incubation for 12 h, the supernatant was discarded, 100 µL drug serum (10% drug serum + 90% RPMI1640) was added, and 100 µL serum (10% serum + 90% RPMI1640) was added to the control group. After treatment for 24 h, the supernatant was discarded, 100 µL DMSO was added, the 96-well plate was mixed on a microvibrator for an additional 10 min, and the proliferation inhibition rate of SKOV3 tumor cell lines in MTT [3-(4,5-dimethyl-2-thiazolyl)-2,5-diphenyl-2H-tetrazolium bromide] was measured at 490 nm using a microplate reader (THERMO Multiskan MK3 series, Waltham, MA, USA). The experiment was performed in triplicate and an average value was used to determine the final result after the measurement was repeated three times.
The formula used was as follows:
W n = 1 A n / A 0
where Wn was the cell proliferation inhibition rate, An was the OD value of n-th group, A0 was the original OD value, and n was one of the nine prescriptions.

3.3.2. Survival Experiment in Tumor-Bearing Nude Mice

SKOV3 cells were suspended in phosphate buffered saline and 1 × 1070 cells were inoculated by intraperitoneal (i.p.) injection into 6-week-old female nude mice. After two weeks, the model nude ice were randomly divided into ten groups: model control group and nine prescription treatment groups (six in each group). The model control group of nude mice was administered sterilized distilled water by gavage. All nine prescriptions comprising the four compositions (Table 3) were dissolved in 100 mL sterilized distilled water and were administered by gavage to nine groups of nude mice at an equivalent clinical dosage. The dosage of administration was 0.2 mL/20 g, twice a day, and continuous administration for three weeks. Survival extension was observed, and the survival extension rate was calculated by comparing with the model control group. The prescriptions were administered between meals [45].
The formula used was as follows:
S n = ( D 0 42 D n 42 ) + ( D 0 48 D n 48 ) + ( D 0 54 D n 54 ) + ( D 0 60 D n 60 ) / 4
where Sn was the survival extension rate. D 0 42 , D 0 48 , D 0 54 , D 0 60 were the death rates on the observation day in the reference group, D 0 42 , D 0 48 , D 0 54 , D 0 60 were the rates in the n-th group and n was one of the nine prescriptions.

3.4. Analysis of HPLC Fingerprints

For the analysis of multiple constituents in LCSSY, a Waters 2695 HPLC system was equipped with a Waters 2996 Photodiode Array (PDA) detector (Waters Corporation, Milford, MA, USA) and an Alltech 2000 Evaporative Light-scattering Detector (ELSD) (Alltech Associates, Waukegan, IL, USA), connected to Waters Empower 2.0 Software.

3.4.1. Preparation of Sample Solutions

The samples were accurately weighed and dissolved in ethanol for chromatographic condition I and in methanol for chromatographic condition II, respectively, and then filtered through a 0.22 µm micropore film to yield the sample solution for HPLC to obtain the HPLC fingerprints.

3.4.2. HPLC Conditions

Chromatographic condition I (HPLC-PDA). A Kromasil C18 column (250 mm × 4.6 mm, 5 µm) was used for all analyses and maintained at 30 °C. The mobile phase was a 0.1% formic acid water solution (A) and methanol (B) system. The gradient elution profile was as follows: 0–10 min A:B (50:50, v/v), 10–25 min A:B (50:50, v/v) to A:B (35:65, v/v), 25–30 min A:B (35:65, v/v), 30–40 min A:B (35:65, v/v) to A:B (20:80, v/v), 40–45 min A:B (20:80, v/v), 45–55 min A:B (20:80, v/v) to A:B (15:85, v/v), 55–70 min A:B (15:85, v/v) to A:B (5:95, v/v), 70–80 min A:B (5:95, v/v) to A:B (0:100, v/v). The flow rate was 1.0 mL/min and the effluent was monitored at 210 nm with the sample injection volume of 10 µL.
Chromatographic condition II (HPLC-PDA-ELSD). A Kromasil C18 column (250 mm × 4.6 mm, 5 µm) was used for all analyses and maintained at 30 °C. The mobile phase was a 0.05% formic acid water solution (A) and methanol solution (B) system. The gradient elution profile was as follows: 0–15 min A:B (95:5, v/v) to A:B (80:20, v/v), 15–30 min A:B (80:20, v/v), 30–55 min A:B (80:20, v/v) to A:B (55:45, v/v), 55–60 min A:B (55:45, v/v) to A:B (20:80, v/v), 60–70 min A:B (20:80, v/v) to A:B (5:95, v/v), 70–80 min A:B (5:95, v/v) to A:B (0:100, v/v), 80–85 min A:B (0:100, v/v). The flow rate was 0.8 mL/min and the effluent was monitored at 270 nm with the sample injection volume of 10 µL. The ELSD was then connected to the PDA and set to a drift tube temperature of 103 °C at gain 4 and the N2 flow rate was 2.5 L/min.

3.4.3. Validation of Methodology

According to the established HPLC condition programs, the method precision was assessed by the successive analysis of six injections of sample solutions, which had the best peak shapes, responses, and peak resolution among the samples in preliminary experiments, and repeatability was assessed by the successive analysis of six replicates of the same samples, respectively. In addition, the analysis of different time periods in a day (0, 2, 4, 8, 16, 24 h) was used to evaluate the stability of these samples over 24 h. The relative standard deviation (R.S.D.) of the relative retention time and relative peak area of the characteristic peaks were calculated to evaluate the method, respectively.

3.4.4. Determination of Fingerprints

The fingerprints of the nine samples designed by the L9(34) orthogonal test were respectively determined by chromatographic condition I (HPLC-PDA) and chromatographic condition II (HPLC-PDA-ELSD).

3.5. Analysis of Spectrum-Effect Relationships

The peak areas in the fingerprints analyzed by chromatographic condition I (HPLC-PDA) and II (HPLC-PDA-ELSD) were respectively marked as Xn, Yn, and Zn, which were associated with the pharmacological results of W and S and constituted the data matrix for regression analysis and correlation analysis. Finally, the components with correlated relationships to the pharmacological results were calculated by SPSS statistics software (SPSS for Windows 19.0, SPSS International Business Machines Corp., Armonk, NY, USA) to obtain the union and intersection results in both analyses.

3.5.1. Regression Analysis

Regression is a statistical method used to verify the linearity of the non-linear relationship between one or more independent variables and a dependent variable, and was used to study the spectrum-effect relationships [46,47]. In this study, the ENTER and STEPWISE methods in regression were respectively used to obtain the union results.

3.5.2. Correlation Analysis

Correlation is a statistical method used to study the closeness between variables. The correlation coefficients were calculated by the method of bivariate in correlation [48].

3.5.3. Assignments of the Correlated Peaks

Comparison of the Fingerprints with Negative Control Samples and Reference Standard Samples

According to the extraction method of LCSSY mentioned in Section 3.2, eight types of negative control samples were prepared including the formula without Hirudo, Epimedii Folium, Cervi Cornu Pantotrichum, Fritillariae Thunbergii Bulbus, Ginseng Radix et Rhizoma, Astragali Radix, Sparganii Rhizoma, and Curcumae Rhizoma, respectively.
The mixed standard solution A, containing 45.5 µg/mL germacrone, 20.3 µg/mL furandiene, and 70.9 µg/mL β-elemene was prepared by adding an accurate amount of each standard stock into a volumetric flask and was then dissolved with 10 mL ethanol for chromatographic condition I (HPLC-PDA).
The mixed standard solution B, containing 10.0 µg/mL calycosin-7-glucoside, 7.8 µg/mL ononin, 8.2 µg/mL epimedin B, 10.0 µg/mL icariin, 32.6 µg/mL ginsenoside Rc, 50.0 µg/mL astragaloside, 34.0 µg/mL ginsenoside Rd, and 50.0 µg/mL astragaloside II was prepared by adding an accurate amount of each standard stock into a volumetric flask and was then dissolved with 10 mL methanol for chromatographic condition II (HPLC-PDA-ELSD).
The negative control samples and reference standard samples were prepared and injected into the HPLC system to assign the correlated peaks. The chromatographic conditions used were the same as those described in Section 3.4.2. HPLC analysis.

HPLC-MS Analyses

To identify the structure of the correlated peaks, HPLC-MS analyses were performed on a TRAP Mass Spectrometer (LCQ, Finnigan MAT, San Jose, CA, USA) with a Waters 2695 HPLC system (Waters Corporation). The column and elution conditions used were the same as those described in Section 3.4.2. High purity nitrogen (N2) was used as the collision gas and nebulizer, respectively. The parameters in negative/positive ion modes were as follows: ion spray voltage, −3.5 kV/3.5 kV; capillary temperature, 350 °C; vaporizer temperature, 35 °C. Spectra were recorded in the range of m/z 100–1500 for full scan data. The representative sample was prepared and injected into the HPLC-MS system to identify the structure of the correlated peaks.

4. Conclusions

Multi-dimensional HPLC fingerprints and pharmacological experiments were conducted to determine the bioactive components related to the anti-ovarian cancer activities of LCSSY. The results suggested that the pharmacodynamic basis of the anti-ovarian cancer activities of LCSSY were X5 (unknown component, from Ginseng Radix et Rhizoma), X9 (germacrone, from Curcumae Rhizoma), X11 (furandiene, from Curcumae Rhizoma), X12 (unknown component, from Curcumae Rhizoma), X16 (β-elemene, from Curcumae Rhizoma), X18 (unknown component, from Sparganii Rhizoma), Y5 (calycosin-7-glucoside, from Astragali Radix), Y8 (ononin, from Astragali Radix), Y12 (epimedin B, from Epimedii Folium), Y14 (icariin, from Epimedii Folium), Y20 (unknown component, from Fritillariae Thunbergii Bulbus), Z4 (ginsenoside Rc, from Ginseng Radix et Rhizoma), Z5 (astragaloside, from Astragali Radix), Z6 (ginsenoside Rd, from Ginseng Radix et Rhizoma), and Z8 (astragaloside II, from Astragali Radix), in which, X11 (furandiene, from Curcumae Rhizoma), X12 (unknown component, from Curcumae Rhizoma), X16 (β-elemene, from Curcumae Rhizoma), X18 (unknown component, from Sparganii Rhizoma), Y5 (calycosin-7-glucoside, from Astragali Radix), Y12 (epimedin B, from Epimedii Folium), and Z5 (astragaloside, from Astragali Radix) were the most closely correlated peaks.

Acknowledgments

The authors are grateful for the support of the National Natural Science Foundation of China (NO. 81273788, NO. 81473717).

Author Contributions

Fengjuan Han and Yanhong Wang designed the research; Yang Li, Yan Zhang, Guan Feng, Zhixin Yang, Qingxia Guan, and Rui Wang performed the study and analyzed the data; Yanhong Wang and Yang Li wrote and revised the manuscript; all authors approved the final version.

Conflicts of Interest

The authors declare no conflict of interest.

Abbreviations

The following abbreviations are used in this manuscript.
LCSSYLichong Shengsui Yin
TCMsTraditional Chinese medicines
HPLC-PDAHigh-performance liquid chromatography-photodiode array detector
HPLC-PDA-ELSDHigh-performance liquid chromatography-photodiode array detector -Evaporative Light-scattering Detector
HPLC-MSHigh-performance liquid chromatography-mass spectrometry detector
HPTLCHigh performance thin layer chromatography
GC-MSGas chromatography-mass spectrometry
IRInfrared spectroscopy
HPCEHigh performance capillary electrophoresis
R.S.D.Relative standard deviation
MTT3-(4,5-dimethyl-2-thiazolyl)-2,5-diphenyl-2H-tetrazolium bromide
i.p.Intraperitoneal injection

References

  1. Zhang, L.; Yan, J.B.; Liu, X.M.; Ye, Z.G.; Yang, X.H.; Meyboome, R.; Chan, K.; Shaw, D.; Duez, P. Pharmacovigilance practice and risk control of Traditional Chinese Medicine drugs in China: Current status and future perspective. J. Ethnopharmacol. 2012, 140, 519–525. [Google Scholar] [CrossRef] [PubMed]
  2. Hong, M.; Li, S.; Tan, H.Y.; Wang, N.; Tsao, S.W.; Feng, Y. Current Status of Herbal Medicines in Chronic Liver Disease Therapy: The Biological Effects, Molecular Targets and Future Prospects. Int. J. Mol. Sci. 2015, 16, 28705–28745. [Google Scholar] [CrossRef] [PubMed]
  3. Wang, P.; Yin, Q.W.; Zhang, A.H.; Sun, H.; Wu, X.H.; Wang, X.J. Preliminary identification of the absorbed bioactive compositions and metabolites in rat plasma after oral administration of Shaoyao-Gancao decoction by ultra-performance liquid chromatography with electrospray ionization tandem mass spectrometry. J. Pharmacogn. Mag. 2014, 10, 497–502. [Google Scholar]
  4. Ouyang, E.H.; Zhang, C.G.; Li, X.M. Determination of 5-hydroxymethyl-2-furaldehyde of crude and processed Fructus Corni in freely moving rats using in vivo microdialysis sampling and liquid chromatography. J. Pharmacogn. Mag. 2011, 7, 271–276. [Google Scholar] [CrossRef] [PubMed]
  5. Zhao, H.H.; Li, Z.G.; Tian, G.H.; Gao, K.; Li, Z.Y.; Zhao, B.S.; Wang, J.; Luo, L.T.; Pan, Q.; Zhang, W.T.; et al. Effects of traditional Chinese medicine on rats with Type II diabetes induced by high-fat diet and streptozotocin: A urine metabonomic study. J. Afr. Health Sci. 2013, 13, 673–681. [Google Scholar] [CrossRef] [PubMed]
  6. Xu, G.L.; Xie, M.; Yang, X.Y.; Song, Y.; Yan, C.; Yang, Y.; Zhang, X.; Liu, Z.Z.; Tian, Y.X.; Wang, Y.; et al. Spectrum-Effect Relationships as a Systematic Approach to Traditional Chinese Medicine Research: Current Status and Future Perspectives. Molecules 2014, 19, 17897–17925. [Google Scholar] [CrossRef] [PubMed]
  7. Pei, K.; Cai, H.; Duan, Y.; Qiao, F.X.; Tu, S.C.; Liu, X.; Wang, X.L.; Song, X.Q.; Fan, K.L.; Cai, B.C. Evaluation of the Influence of Sulfur-Fumigated Paeoniae Radix Alba on the Quality of Si Wu Tang by Chromatographic and Chemometric Analysis. J. Anal. Methods Chem. 2016, 2016, 8358609. [Google Scholar] [CrossRef] [PubMed]
  8. Deng, X.M.; Yu, J.Y.; Ding, M.J.; Zhao, M.; Xue, X.Y.; Che, C.T.; Wang, S.M.; Zhao, B.; Meng, J. Liquid Chromatography-diode Array Detector-electrospray Mass Spectrometry and Principal Components Analyses of Raw and Processed Moutan Cortex. J. Pharmacogn. Mag. 2016, 12, 50–56. [Google Scholar] [PubMed]
  9. Karthika, K.; Paulsamy, S. TLC and HPTLC Fingerprints of Various Secondary Metabolites in the Stem of the Traditional Medicinal Climber, Solena amplexicaulis. J. Indian J. Pharm. Sci. 2015, 77, 111–116. [Google Scholar] [PubMed]
  10. Singh, M.; Tamboli, E.T.; Kamal, Y.T.; Ahmad, W.; Ansari, S.H.; Ahmad, S. Quality control and in vitro antioxidant potential of Coriandrum sativum Linn. J. Pharm. Bioallied Sci. 2015, 7, 280–283. [Google Scholar] [PubMed]
  11. Guo, Y.; Lv, B.; Wang, J.; Liu, Y.; Sun, S.; Xiao, Y.; Lu, L.; Xiang, L.; Yang, Y.; Qu, L.; et al. Analysis of Chuanxiong Rhizoma and its active components by Fourier transform infrared spectroscopy combined with two-dimensional correlation infrared spectroscopy. J. Spectrochim. Acta Mol. Biomol. Spectrosc. 2016, 15, 550–559. [Google Scholar] [CrossRef] [PubMed]
  12. Zhang, Q.F.; Cheung, H.Y. Development of capillary electrophoresis fingerprint for quality control of rhizoma Smilacis Glabrae. J. Phytochem. Anal. 2011, 22, 18–25. [Google Scholar] [CrossRef] [PubMed]
  13. Konieczyński, P. Electrochemical fingerprint studies of selected medicinal plants rich in flavonoids. J. Acta Pol. Pharm. 2015, 72, 655–661. [Google Scholar]
  14. Li, A.P.; Li, Z.Y.; Sun, H.F.; Li, K.; Qin, X.M.; Du, G.H. Comparison of Two Different Astragali Radix by a 1H-NMR-Based Metabolomic Approach. J. Proteome Res. 2015, 14, 2005–2016. [Google Scholar] [CrossRef] [PubMed]
  15. Si, W.; Yang, W.; Guo, D.; Wu, J.; Zhang, J.; Qiu, S.; Yao, C.; Cui, Y.; Wu, W. Selective ion monitoring of quinochalcone C-glycoside markers for the simultaneous identification of Carthamus tinctorius L. in eleven Chinese patent medicines by UHPLC/QTOF MS. J. Pharm. Biomed. Anal. 2016, 117, 510–521. [Google Scholar] [CrossRef] [PubMed]
  16. Zhu, C.S.; Lin, Z.J.; Xiao, M.L.; Niu, H.J.; Zhang, B. The spectrum-effect relationship-a rational approach to screening effective compounds, reflecting the internal quality of Chinese herbal medicine. J. Chin. J. Nat. Med. 2016, 14, 177–184. [Google Scholar] [CrossRef]
  17. Han, F.J.; Wang, Y.H.; Wang, X.X.; Sui, L.H. Effect of compound prescription Lichong Shengsui Yin on the morphology of ovarian tumor in rats induced by dimethylbenzanthracine. Acta Chin. Med. Pharm. 2006, 34, 31–33. [Google Scholar]
  18. Han, F.J.; Wang, Y.H.; Sui, L.H.; Wang, X.X.; Liu, J. Effect of compound prescription Lichong Shengsui Yin drug serum on the colony formation and expression of Bcl-2 protein in ovarian cancer. Chin. J. Tradit. Med. Sci. Technol. 2005, 12, 345–346. [Google Scholar]
  19. Han, F.J.; Xu, F.; Wang, Y.H.; Sui, L.H.; Wang, X.X. Effect of compound prescription Lichong Shengsui Yin on the expression of P53 and PCNA in the ovarian tumor tissue of rats. Chin. J. Tradit. Med. Sci. Technol. 2007, 14, 402–403. [Google Scholar]
  20. Gong, L.H.; Han, F.J.; Wang, X.X.; Hou, L.H.; Wu, X.K.; Fan, M.M. Effect of Lichong Shengsui Yin on gene expression of ovarian cancer cell line SKOV3. J. Shandong Univ. Tradit. Chin. Med. 2007, 31, 334–337. [Google Scholar]
  21. Huai, Q.J.; Han, F.J.; Wang, X.X.; Qiu, L.N.; Wu, X.K. Effect of traditional Chinese medicine compound of Lichong Shengsui Yin on expressions of Casp-8 gene and CXCL2 gene in ovarian cancer cellline SKOV3. Matern. Child Health Care China 2010, 25, 1689–1692. [Google Scholar]
  22. Qiu, L.N.; Han, F.J.; Wu, X.K.; Hou, L.H. Anti-tumor effect of Lichong Shengsui Yin on ovarian tum or tissue and the impact on VEGF expression in Fischer 344 Rats. World J. Intergr. Tradit. West. Med. 2010, 5, 939–941. [Google Scholar]
  23. Han, F.J.; Sui, L.H.; Ma, R.; Wang, X.X. Clinical study on the effect of Lichong Shengsui Yin on immune state of the patients with ovarian epithelial ovarian cancer. Inf. Tradit. Chin. Med. 2003, 20, 37–38. [Google Scholar]
  24. Liu, L.; Lu, Y.; Shao, Q.; Cheng, Y.Y.; Qu, H.B. Binary chromatographic fingerprinting for quality evaluation of Radix Ophiopogonis by high-performance liquid chromatography coupled with ultraviolet and evaporative light-scattering detectors. J. Sep. Sci. 2007, 30, 2628–2637. [Google Scholar] [CrossRef] [PubMed]
  25. Wang, Y.; Wang, M.Z. Study on the quality of Rhizoma Curcumae. Acta Pharm. Sin. 2011, 36, 849–853. [Google Scholar]
  26. Ma, E.; Wang, X.; Li, Y.; Sun, X.; Tai, W.; Li, T.; Guo, T. Induction of apoptosis by furanodiene in HL60 leukemia cells through activation of TNFR1 signaling pathway. Cancer Lett. 2008, 18, 158–166. [Google Scholar] [CrossRef] [PubMed]
  27. Xiao, Y.; Yang, F.Q.; Li, S.P.; Lao, S.C.; Conceição, E.L.; Fung, K.P.; Wangl, Y.T.; Lee, S.M. Furanodiene induces G2/M cell cycle arrest and apoptosis through MAPK signaling and mitochondria-caspase pathway in human hepatocellular carcinoma cells. Cancer Biol. Ther. 2007, 6, 1044–1050. [Google Scholar] [CrossRef] [PubMed]
  28. Li, X.; Wang, G.; Zhao, J.; Ding, H.; Cunningham, C.; Chen, F.; Flynn, D.C.; Reed, E.; Li, Q.Q. Antiproliferative effect of beta-elemene in chemoresistant ovarian carcinoma cells is mediated through arrest of the cell cycle at the G2-M phase. Cell. Mol. Life Sci. 2005, 62, 894. [Google Scholar] [CrossRef] [PubMed]
  29. Yao, Y.Q.; Ding, X.; Jia, Y. Anti-tumor effect of beta-elemene in glioblastoma cells depends on p38 MAPK activation. Cancer Lett. 2008, 264, 127–134. [Google Scholar] [CrossRef] [PubMed]
  30. Li, Q.Q.; Wang, G.; Zhang, M.; Cuff, C.F.; Huang, L.; Reed, E. β-Elemene, a novel plant-derived antineoplastic agent, increases cisplatin chemosensitivity of lung tumor cells by triggering apoptosis. Oncol. Rep. 2009, 22, 161–170. [Google Scholar] [CrossRef] [PubMed]
  31. Zhao, J.S.; Li, Q.D.; Zou, B.B. In vitro combination characterization of the new anticancer plant drug β-elemene with taxanes against human lung carcinoma. Int. J. Oncol. 2007, 31, 241–252. [Google Scholar] [CrossRef] [PubMed]
  32. Zhang, A.; Zheng, Y.; Que, Z.; Zhang, L.; Lin, S.; Le, V.; Liu, J.; Tian, J. Astragaloside IV inhibits progression of lung cancer by mediating immune function of Tregs and CTLs by interfering with IDO. J. Cancer Res. Clin. Oncol. 2014, 140, 1883. [Google Scholar] [CrossRef] [PubMed]
  33. Cheng, X.D.; Gu, J.F.; Zhang, M.H.; Yuan, J.R.; Zhao, B.J.; Jiang, J.; Jia, X.B. Astragaloside IV inhibits migration and invasion in human lung cancer A549 cells via regulating PKC-α-ERK1/2-NF-κB pathway. Int. Immunol. 2014, 23, 304–313. [Google Scholar] [CrossRef] [PubMed]
  34. Huang, C.; Xu, D.; Xia, Q.; Wang, P.; Rong, C.; Su, Y. Reversal of p-glycoprotein-mediated multidrug resistance of human hepatic cancer cells by astragaloside II. J. Pharm. Pharmacol. 2012, 64, 1741–1750. [Google Scholar] [CrossRef] [PubMed]
  35. Yang, Z.G.; Sun, H.X.; Ye, Y.P. Ginsenoside Rd from Panax notoginseng is cytotoxic towards HeLa cancer cells and induces apoptosis. Chem. Biodivers. 2006, 3, 187–197. [Google Scholar] [CrossRef] [PubMed]
  36. Kim, B.J. Involvement of melastatin type transient receptor potential 7 channels in ginsenoside Rd-induced apoptosis in gastric and breast cancer cells. J. Ginseng Res. 2013, 37, 201–209. [Google Scholar] [CrossRef] [PubMed]
  37. Lee, Y.J.; Jin, Y.R.; Lim, W.C.; Ji, S.M.; Cho, J.Y.; Ban, J.J.; Lee, S.K. Ginsenoside Rc and Re stimulate c-fos expression in mcf-7 human breast carcinoma cells. Arch. Pharma. Res. 2003, 26, 53. [Google Scholar] [CrossRef]
  38. Guo, Y.; Zhang, X.; Meng, J.; Wang, Z.Y. An anticancer agent icaritin induces sustained activation of the extracellular signal-regulated hinase (ERK) pathway and inhibits growth of breast cancer cells. Eur. J. Pharmacol. 2011, 658, 114–122. [Google Scholar] [CrossRef] [PubMed]
  39. Li, S.; Dong, P.; Wang, J.; Zhang, J.; Gu, J.; Wu, X.; Wu, W.; Fei, X.; Zhang, Z.; Wang, Y.; et al. Icariin, a natural flavonol glycoside, induces apoptosis in human hepatoma SMMC-7721 cells via a ROS/JNK-dependent mitochondrial pathway. Cancer Lett. 2010, 298, 222–230. [Google Scholar] [CrossRef] [PubMed]
  40. Wang, Y.; Dong, H.; Zhu, M.; Oub, Y.W.; Zhang, J.; Luo, H.S.; Luo, R.Y.; Wu, J.Z.; Mao, M.; Liu, X.H.; et al. Icariin exterts negative effects on human gastric cancer cell invasion and migration by vasodilator-stimulated phosphoprotein via Racl pathway. Eur. J. Pharmacol. 2010, 635, 40–48. [Google Scholar] [CrossRef] [PubMed]
  41. Li, X.Y.; Sun, J.; Hu, S.Q.; Liu, J. Icariin Induced B16 Melanoma Tumor Cells Apoptosis, Suppressed Tumor Growth and Metastasis. Iran J. Public Health 2014, 43, 847–848. [Google Scholar] [PubMed]
  42. Li, J.W.; Wang, S.Z.; Zhao, F.J. Icariin inhibits proliferation, migration and invasion of SKOV3 ovarian cancer cells through upregulation of miR-519d. Prog. Anat. Sci. 2015, 21, 471–474. [Google Scholar]
  43. Cui, J.L.; Guo, S.X.; Xiao, P.G. Antitumor and antimicrobial activities of endophytic fungi from medicinal parts of Aquilaria sinensis. J. Zhejiang Univ. Sci. B 2011, 12, 385–392. [Google Scholar] [CrossRef] [PubMed]
  44. Li, Y.; Ma, H.; Lu, Y.; Tan, B.J.; Xu, L.; Lawal, T.O.; Mahady, G.B.; Liu, D. Menoprogen, a TCM Herbal Formula for Menopause, Increases Endogenous E2 in an Aged Rat Model of Menopause by Reducing Ovarian Granulosa Cell Apoptosis. J. Biomed. Res. Int. 2016, 2016, 2574637. [Google Scholar]
  45. Kannan, N.; Sakthivel, K.M.; Guruvayoorappan, C. Anti-tumor and Chemoprotective Effect of Bauhinia tomentosa by Regulating Growth Factors and Inflammatory Mediators. J. Asian Pac. J. Cancer Prev. 2015, 16, 8119–8126. [Google Scholar] [CrossRef] [PubMed]
  46. Xie, R.F.; Zhou, X.; Shi, Z.N.; Li, Y.M.; Li, Z.C. Study on spectrum-effect relationship of rhizoma Rhei, cortex Magnoliae Officinalis, fructus Aurantii Immaturus and their formula. J. Chromatogr. Sci. 2013, 51, 524–532. [Google Scholar] [CrossRef] [PubMed]
  47. Li, J.Y.; Wang, X.B.; Luo, J.G.; Kong, L.Y. Seasonal Variation of Alkaloid Contents and Anti-Inflammatory Activity of Rhizoma coptidis Based on Fingerprints Combined with Chemometrics Methods. J. Chromatogr. Sci. 2015, 53, 1131–1139. [Google Scholar] [CrossRef] [PubMed]
  48. Zhao, Y.; Kao, C.P.; Wu, K.C.; Liao, C.R.; Ho, Y.L.; Chang, Y.S. Chemical compositions, chromatographic fingerprints and antioxidant activities of Andrographis Herba. J. Mol. 2014, 19, 18332–18350. [Google Scholar] [CrossRef] [PubMed]
Sample Availability: Samples of Germacrone, furanodiene, β-elemene, calycosin-7-glucoside, ononin, epimedin B, icariin, astragalosideare available from the authors.
Figure 1. Results of W% (the cell proliferation inhibition rate) in vitro tumor inhibition experiments in each group.
Molecules 22 00979 g001
Figure 2. Results of S% (the survival extension rate) in tumor-bearing nude mice.
Molecules 22 00979 g002
Figure 3. Representative fingerprints of the nine samples designed by the L9(34) orthogonal test: (a) the fingerprint analyzed by chromatographic condition I (HPLC-PDA), in which 19 peaks with large areas and good segregation were obtained as “common peaks”; (b) the fingerprint analyzed by chromatographic condition II (HPLC-PDA), in which 28 peaks with large areas and good segregation were regarded as “common peaks”; (c) the fingerprint analyzed by chromatographic condition II (HPLC-ELSD), in which 23 peaks with large areas and good segregation were regarded as “common peaks”.
Molecules 22 00979 g003
Figure 4. Pearson correlation coefficients between the variables and pharmacologic data W%. **: p < 0.01, *: p < 0.05; W% was the cell proliferation inhibition rate.
Molecules 22 00979 g004
Figure 5. Pearson correlation coefficients between the variables and pharmacologic data S%. **: p < 0.01, *: p < 0.05; S% was the survival extension rate.
Molecules 22 00979 g005
Figure 6. Chromatogram comparing the fingerprints analyzed by chromatographic condition I (HPLC-PDA) with negative control samples and reference standard samples: (a) S1–S8 were respectively the negative sample without Hirudo, without Epimedii Folium, without Cervi Cornu Pantotrichum, without Fritillariae Thunbergii Bulbus, without Ginseng Radix et Rhizoma, without Astragali Radix, without Sparganii Rhizoma, and without Curcumae Rhizoma, in which peak 5 was from Ginseng Radix et Rhizoma; peaks 9, 11, 12, and 16 were from Curcumae Rhizoma; peak 18 was from Sparganii Rhizoma by comparing with the negative control solutions (S1–S8); (b) S2 and S1 were respectively the fingerprints of the sample solution and reference standard solution, in which three peaks were respectively identified by comparing with the reference standard substance: peak 9, germacrone; peak 11(S), furandiene (reference peak); peak 16, β-elemene.
Molecules 22 00979 g006
Figure 7. Chromatogram comparing the fingerprints analyzed by chromatographic condition II (HPLC-PDA) with negative control samples and reference standard samples: (a) S1–S8 were respectively the negative sample without Cervi Cornu Pantotrichum, without Fritillariae Thunbergii Bulbus, without Hirudo, without Ginseng Radix et Rhizoma, without Curcumae Rhizoma, without Sparganii Rhizoma, without Astragali Radix, and without Epimedii Folium, in which peaks 5 and 8 were from Astragali Radix; peaks 12 and 14 were from Epimedii Folium; and peak 20 was from Fritillariae Thunbergii Bulbus by comparing with the negative control solutions (S1–S8); (b) S2 and S1 were respectively the fingerprints of the reference standard solution and sample solution, in which peaks 8, 12, and 14(S) were identified as ononin, epimedin B, and icariin (reference peak) by comparing with the reference standard substance.
Molecules 22 00979 g007
Figure 8. Chromatogram comparing the fingerprints analyzed by chromatographic condition II (HPLC-ELSD) with negative control samples and reference standard samples: (a) S1–S8 were respectively the negative sample without Hirudo, without Curcumae Rhizoma, without Cervi Cornu Pantotrichum, without Fritillariae Thunbergii Bulbus, without Sparganii Rhizoma, without Astragali Radix, without Epimedii Folium, and without Ginseng Radix et Rhizoma, in which peaks 4 and 6 were from Astragali Radix; peaks 5 and 8 were from Ginseng Radix et Rhizoma by comparing with the negative control solutions (S1–S8); (b) S2 and S1 were respectively the fingerprints of the sample solution and reference standard solution, in which four peaks were respectively verified by comparing with the reference standard substance: peak 4, ginsenoside Rc; peak 5, astragaloside; peak 6, ginsenoside Rd; peak 8, astragaloside II.
Molecules 22 00979 g008
Table 1. Assignments of the correlated peaks.
No.Mass DataCompoundFormulaMol. Wt.Assignment
X5 268Unknown--Ginseng Radix et Rhizoma
X9[M + H]+219germacroneC15H22O218Curcumae Rhizome
X11[M + H]+217furanodieneC15H20O216Curcumae Rhizome
X12 285Unknown--Curcumae Rhizome
X16[M + H]+205β-elemeneC15H24204Curcumae Rhizome
X18 180Unknown--Sparganii Rhizoma
Y5[M + H]+447calycosin-7-glucosideC22H22O10446Astragali Radix
[M + H − glc]+285
Y8[M + H]+431ononinC16H13O4430Astragali Radix
[M + H − glc]+269
Y12[M + H]+809epimedin BC38H48O19808Epimedii Folium
[M + H − xyl]+677
[M + H – xyl − rha]+531
Y14[M + H]+677icariinC33H40O15676Epimedii Folium
[M + H − rha]+531
Y20 442Unknown--Fritillariae Thunbergii Bulbus
Z4[M − H]1077Ginsenoside RcC53H90O221078Ginseng Radix et Rhizoma
Z5[M – H + HCOOH]829Astragaloside C41H68O14784Astragali Radix
Z6[M – H + HCOOH]991Ginsenoside RdC48H82O18946Ginseng Radix et Rhizoma
Z8[M – H + HCOOH]871Astragaloside IIC43H70O15826Astragali Radix
Table 2. Factors and levels selected.
Factor LevelComposition I(g) AComposition II(g) BComposition III(g) CComposition IV(g) D
11(6.60)1(22.46)1(2.70)1(8.33)
20000
32(13.20)2(44.92)2(5.40)2(16.66)
Table 3. Array of orthogonal compatibility experiments.
TestA(g)B(g)C(g)D(g)
11(6.60)1(22.46)1(2.70)1(8.33)
21(6.60)000
31(6.60)2(44.92)2(5.40)2(16.66)
401(22.46)02(16.66)
5002(5.40)1(8.33)
602(44.92)1(2.70)0
72(13.20)1(22.46)2(5.40)0
82(13.20)01(2.70)2(16.66)
92(13.20)2(44.92)01(8.33)

