
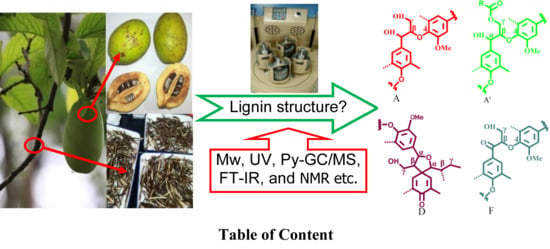
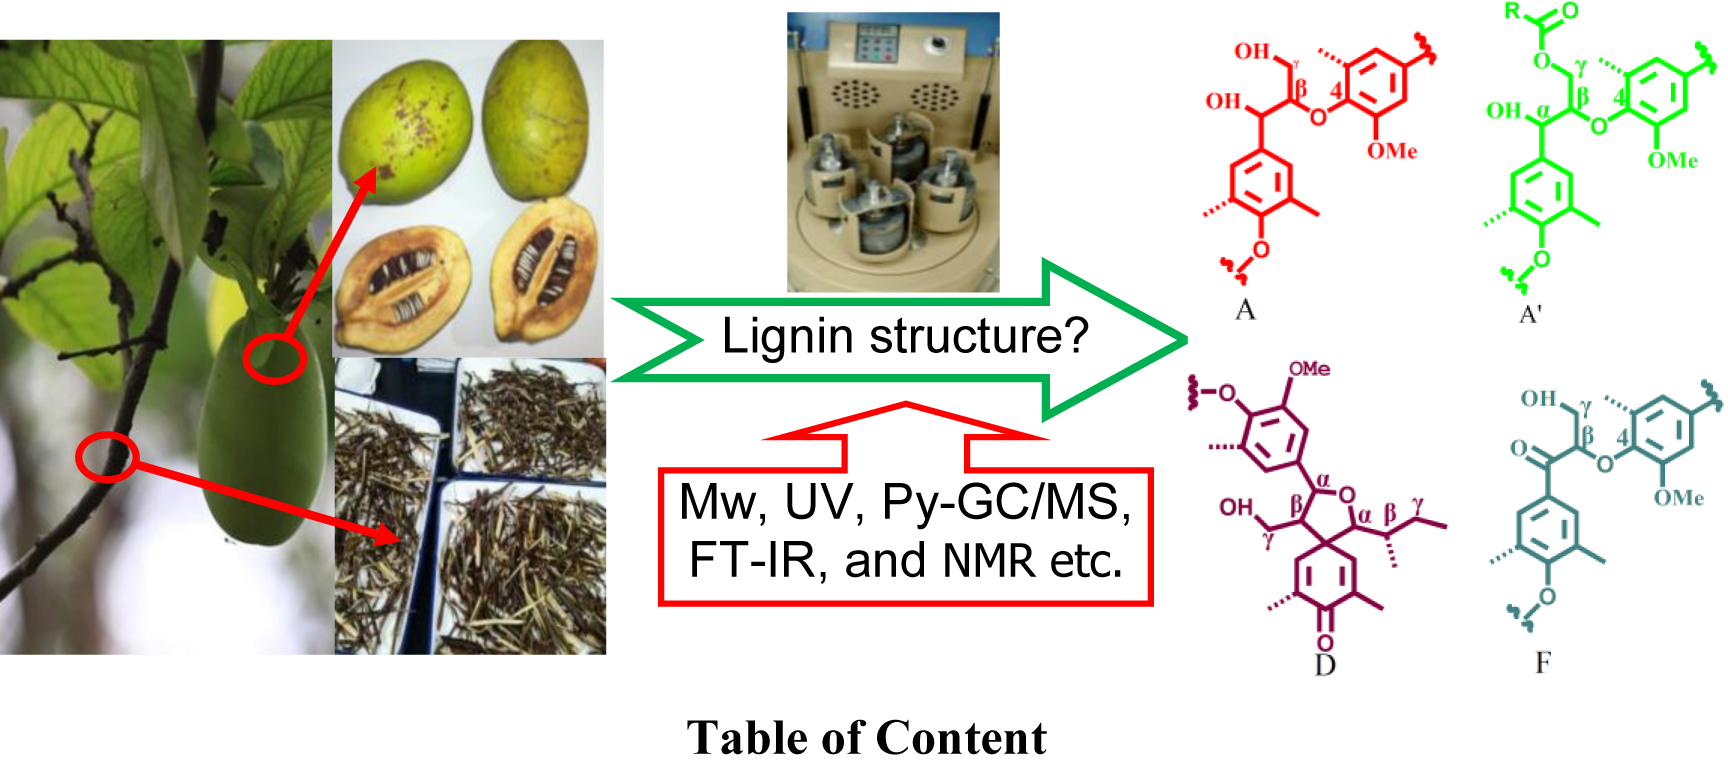
Structural Characterization of Lignin in Fruits and Stalks of Chinese Quince

Abstract
:
1. Introduction
2. Results and Discussion
2.1. Chemical Composition of Isolated MWL Fractions
2.2. FT-IR Characterization
2.3. UV Spectra Analysis
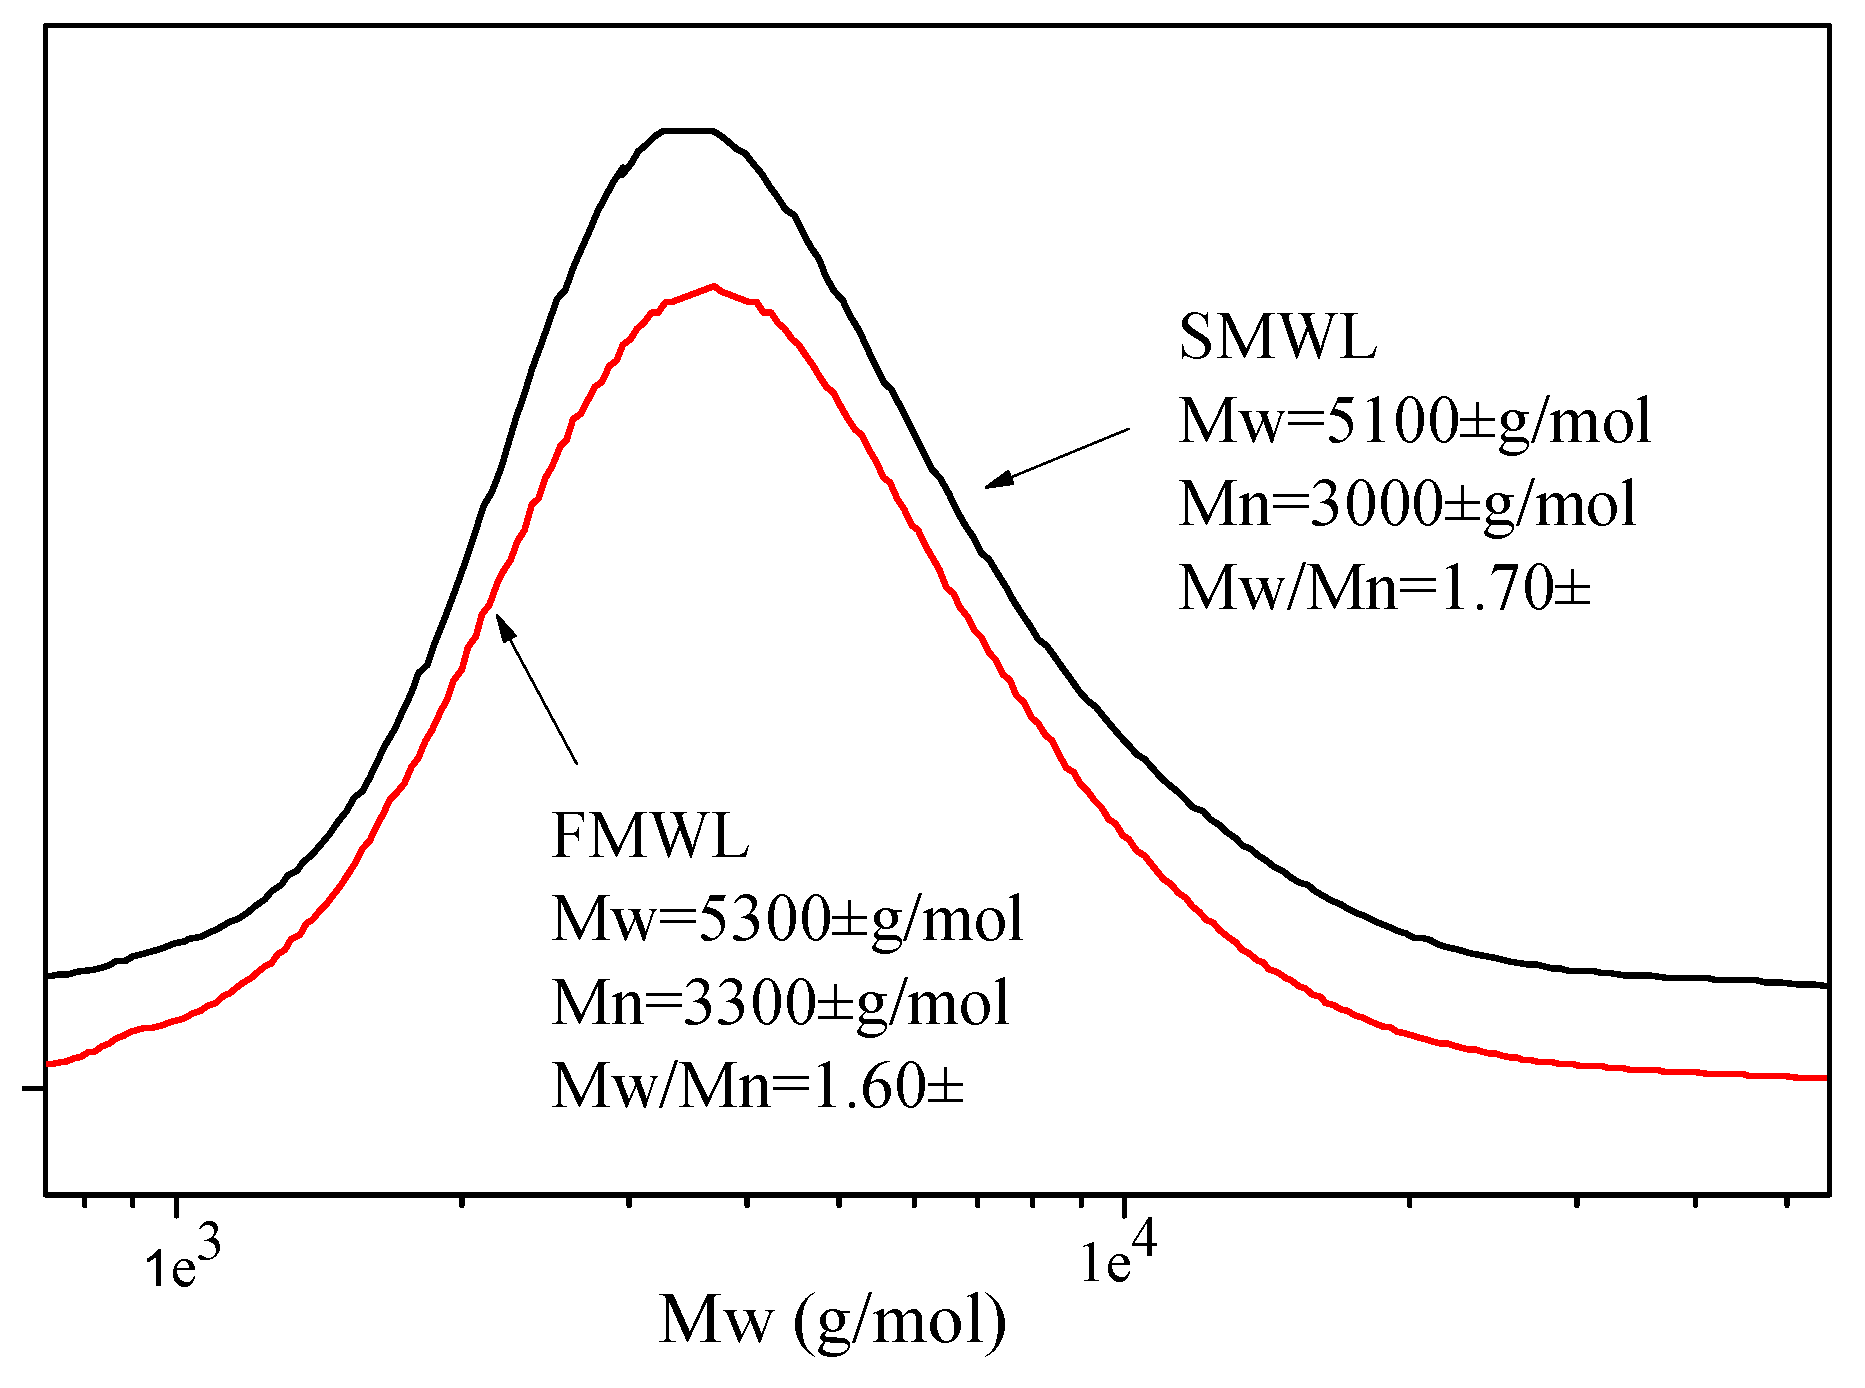
2.4. Molecular Weight Analysis
2.5. Thermal Analysis
2.6. Pyrolysis-GC/MS Analysis
2.7. NMR Spectra Analysis
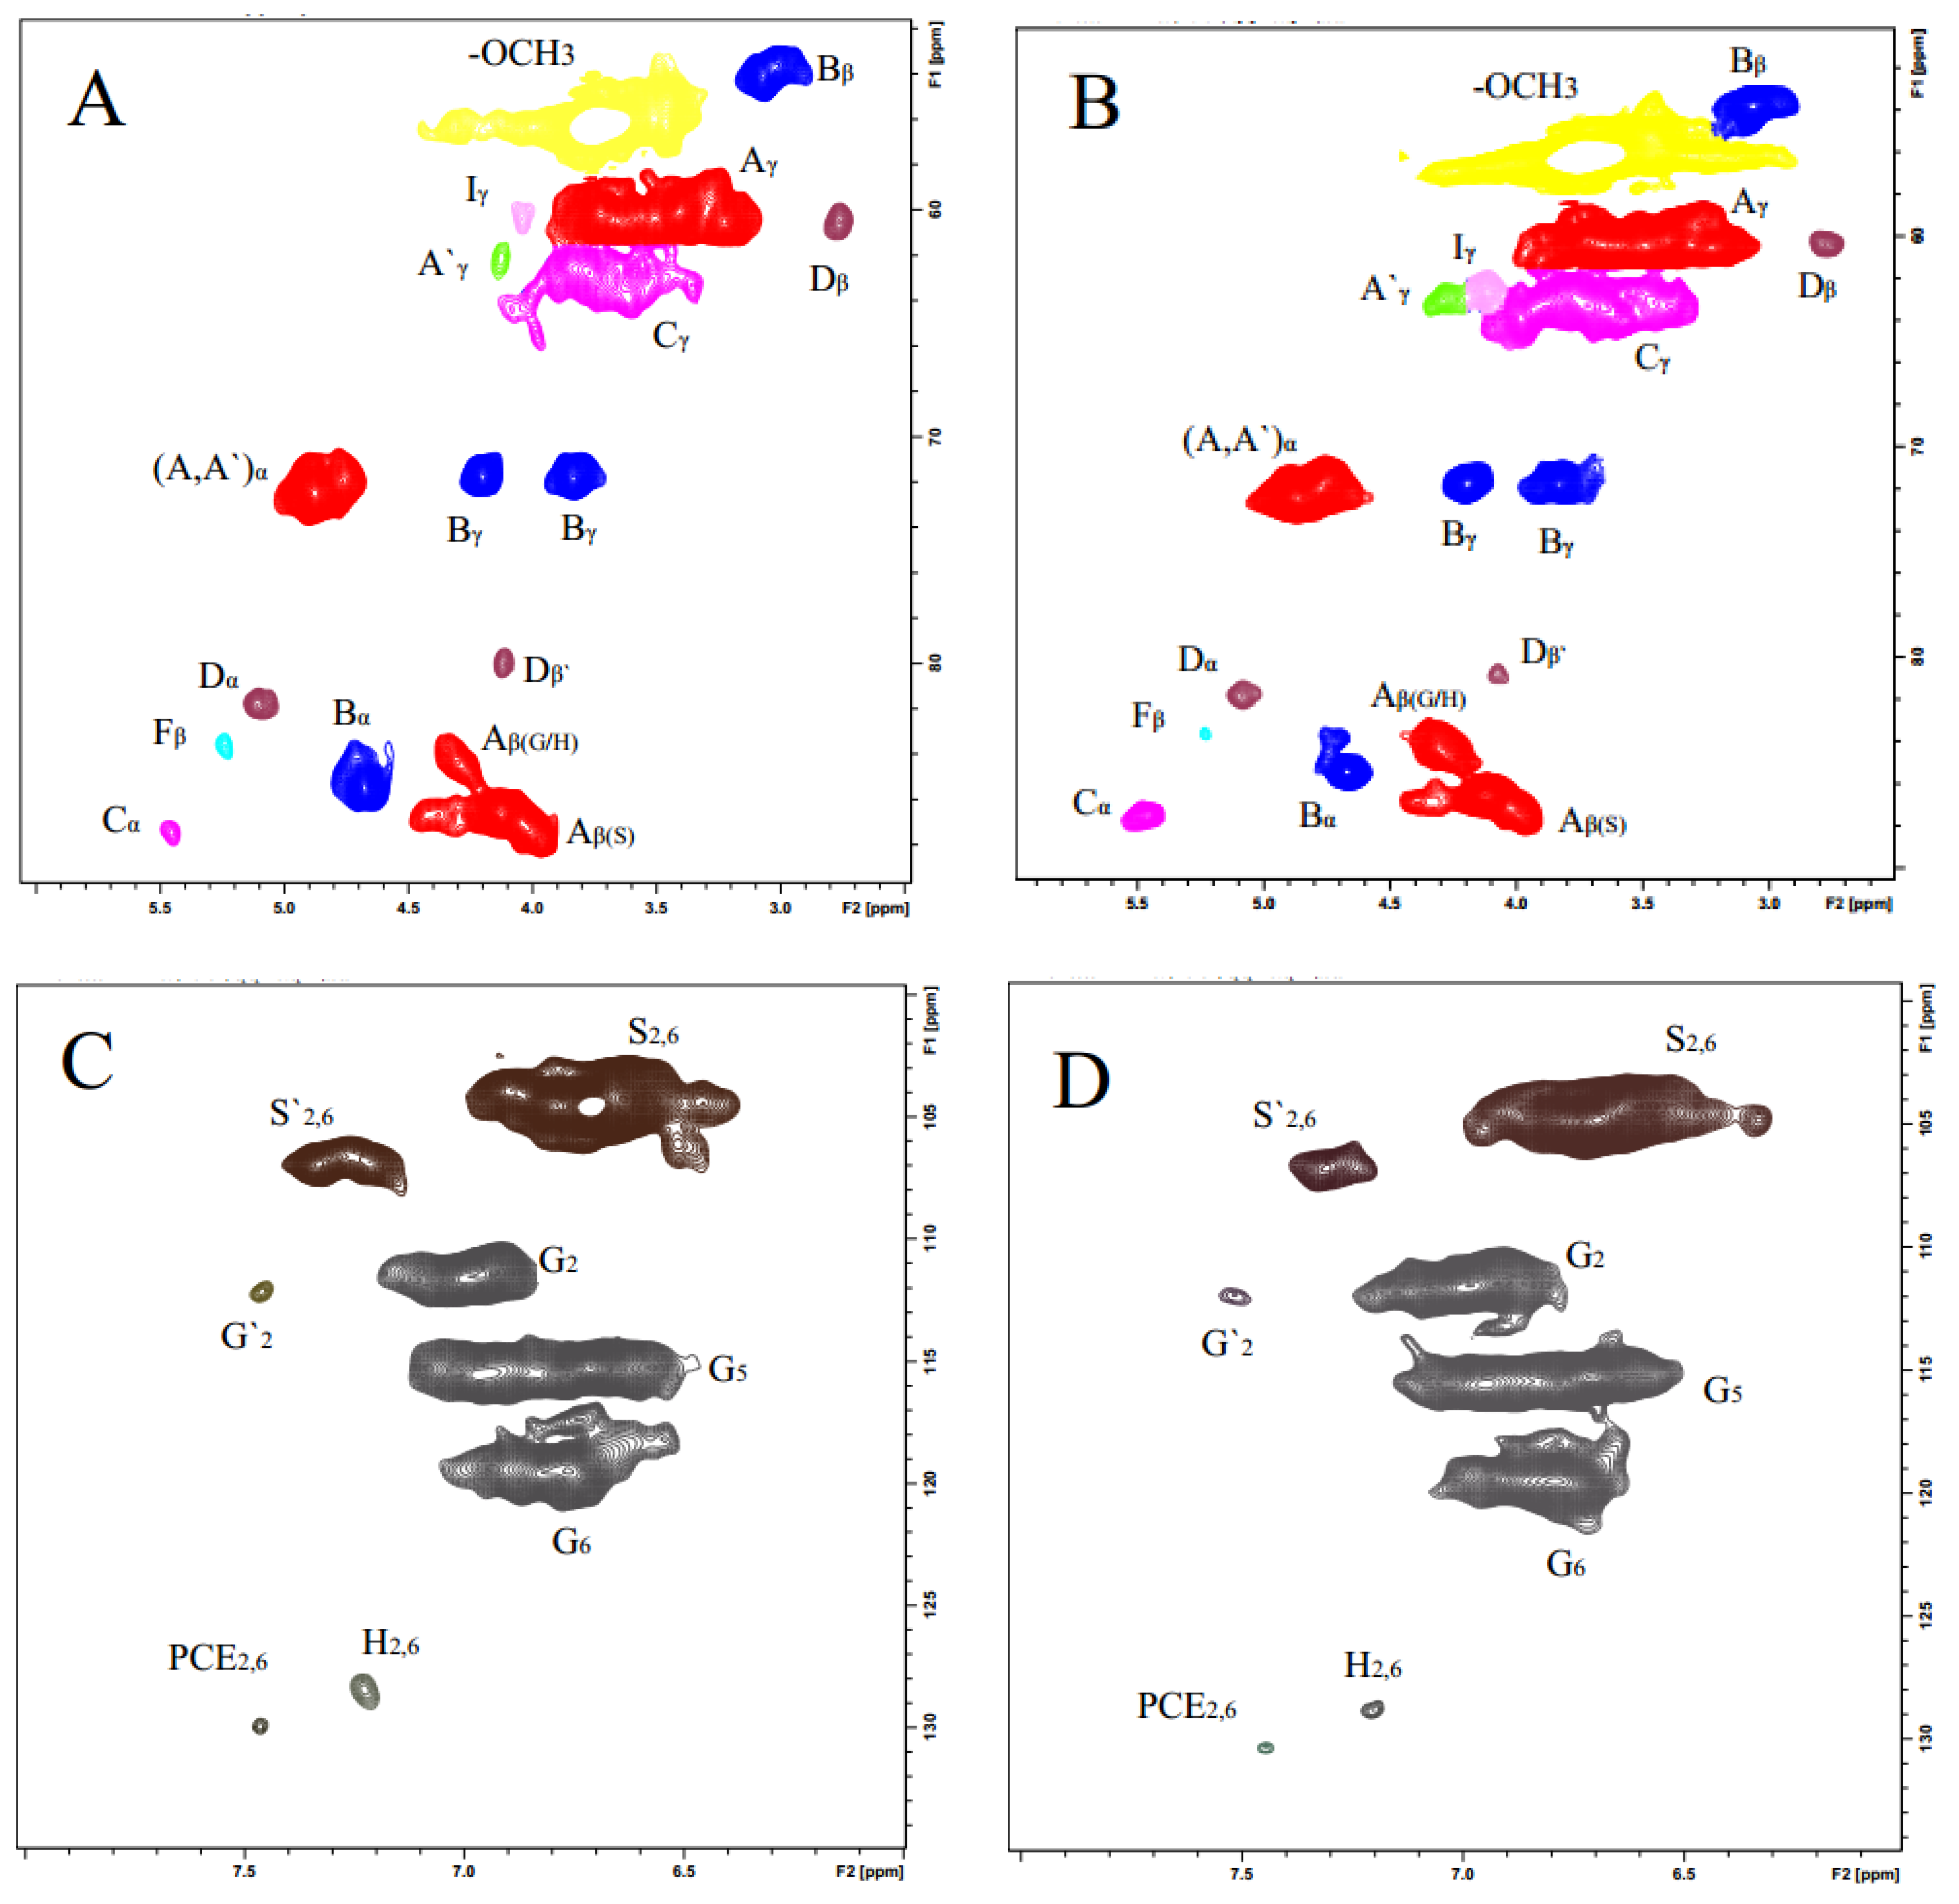
2.7.1. 2D NMR Spectra Analysis
2.7.2. Quantitative 2D NMR Spectra Analysis
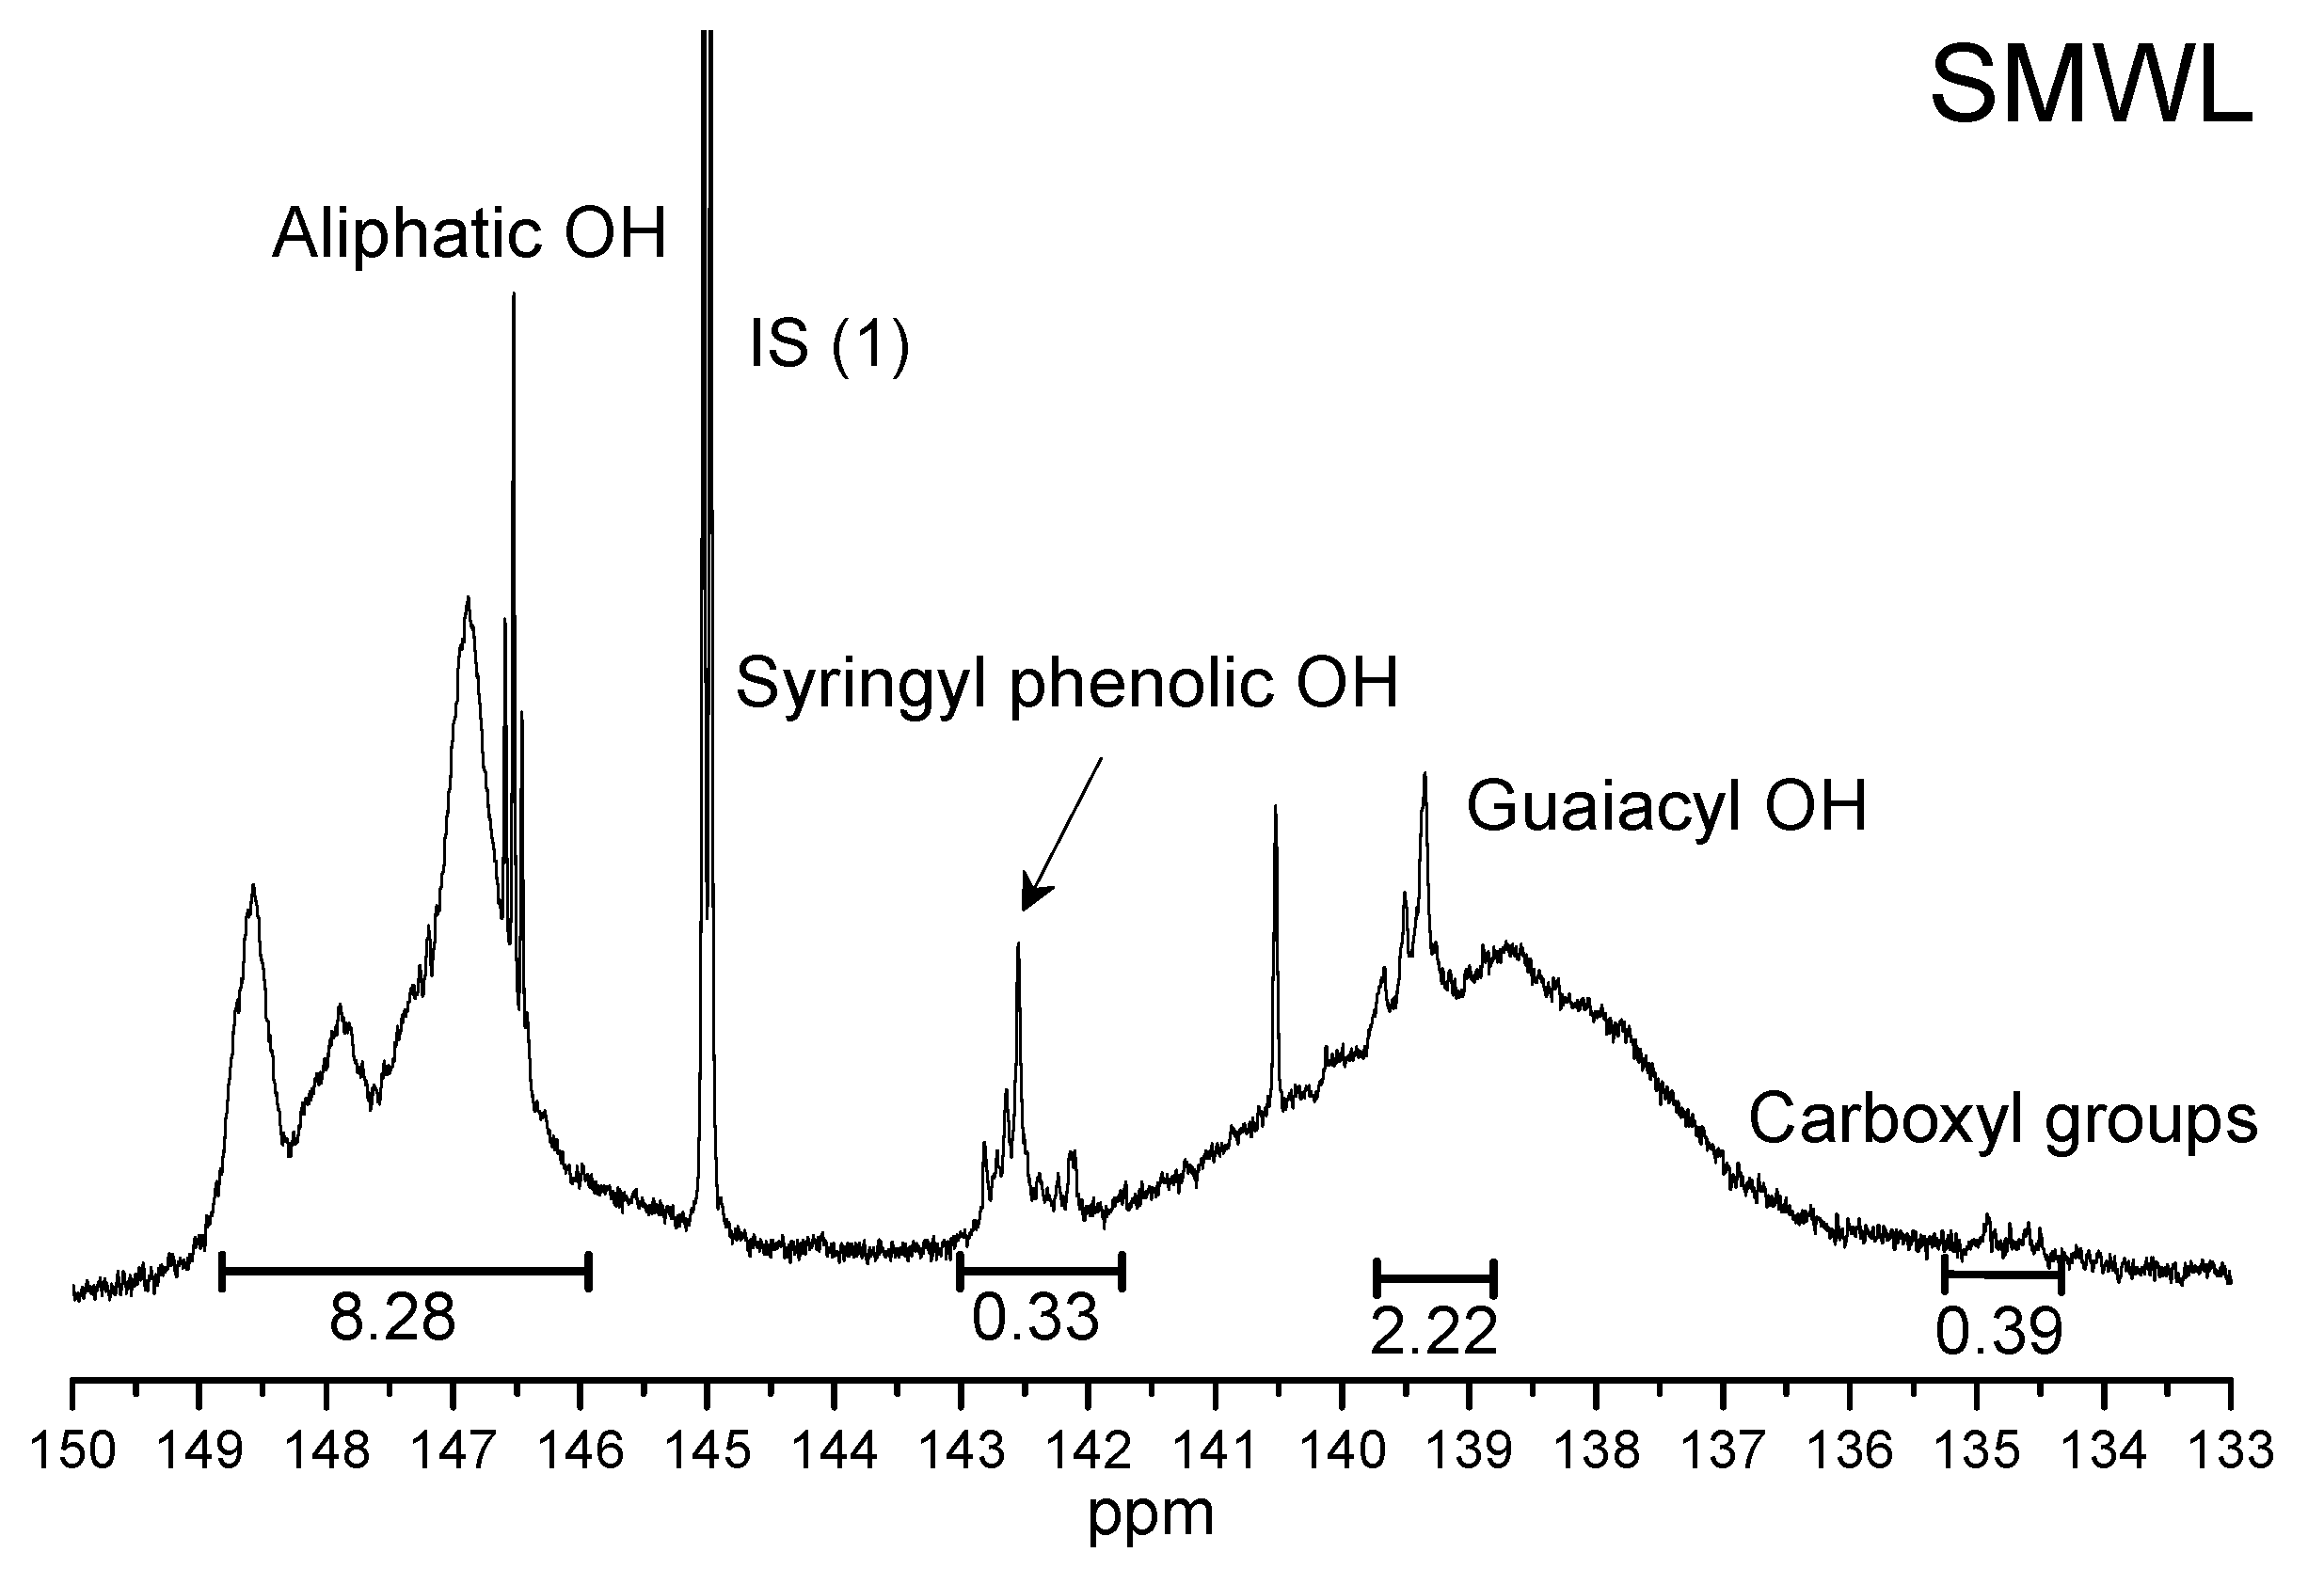
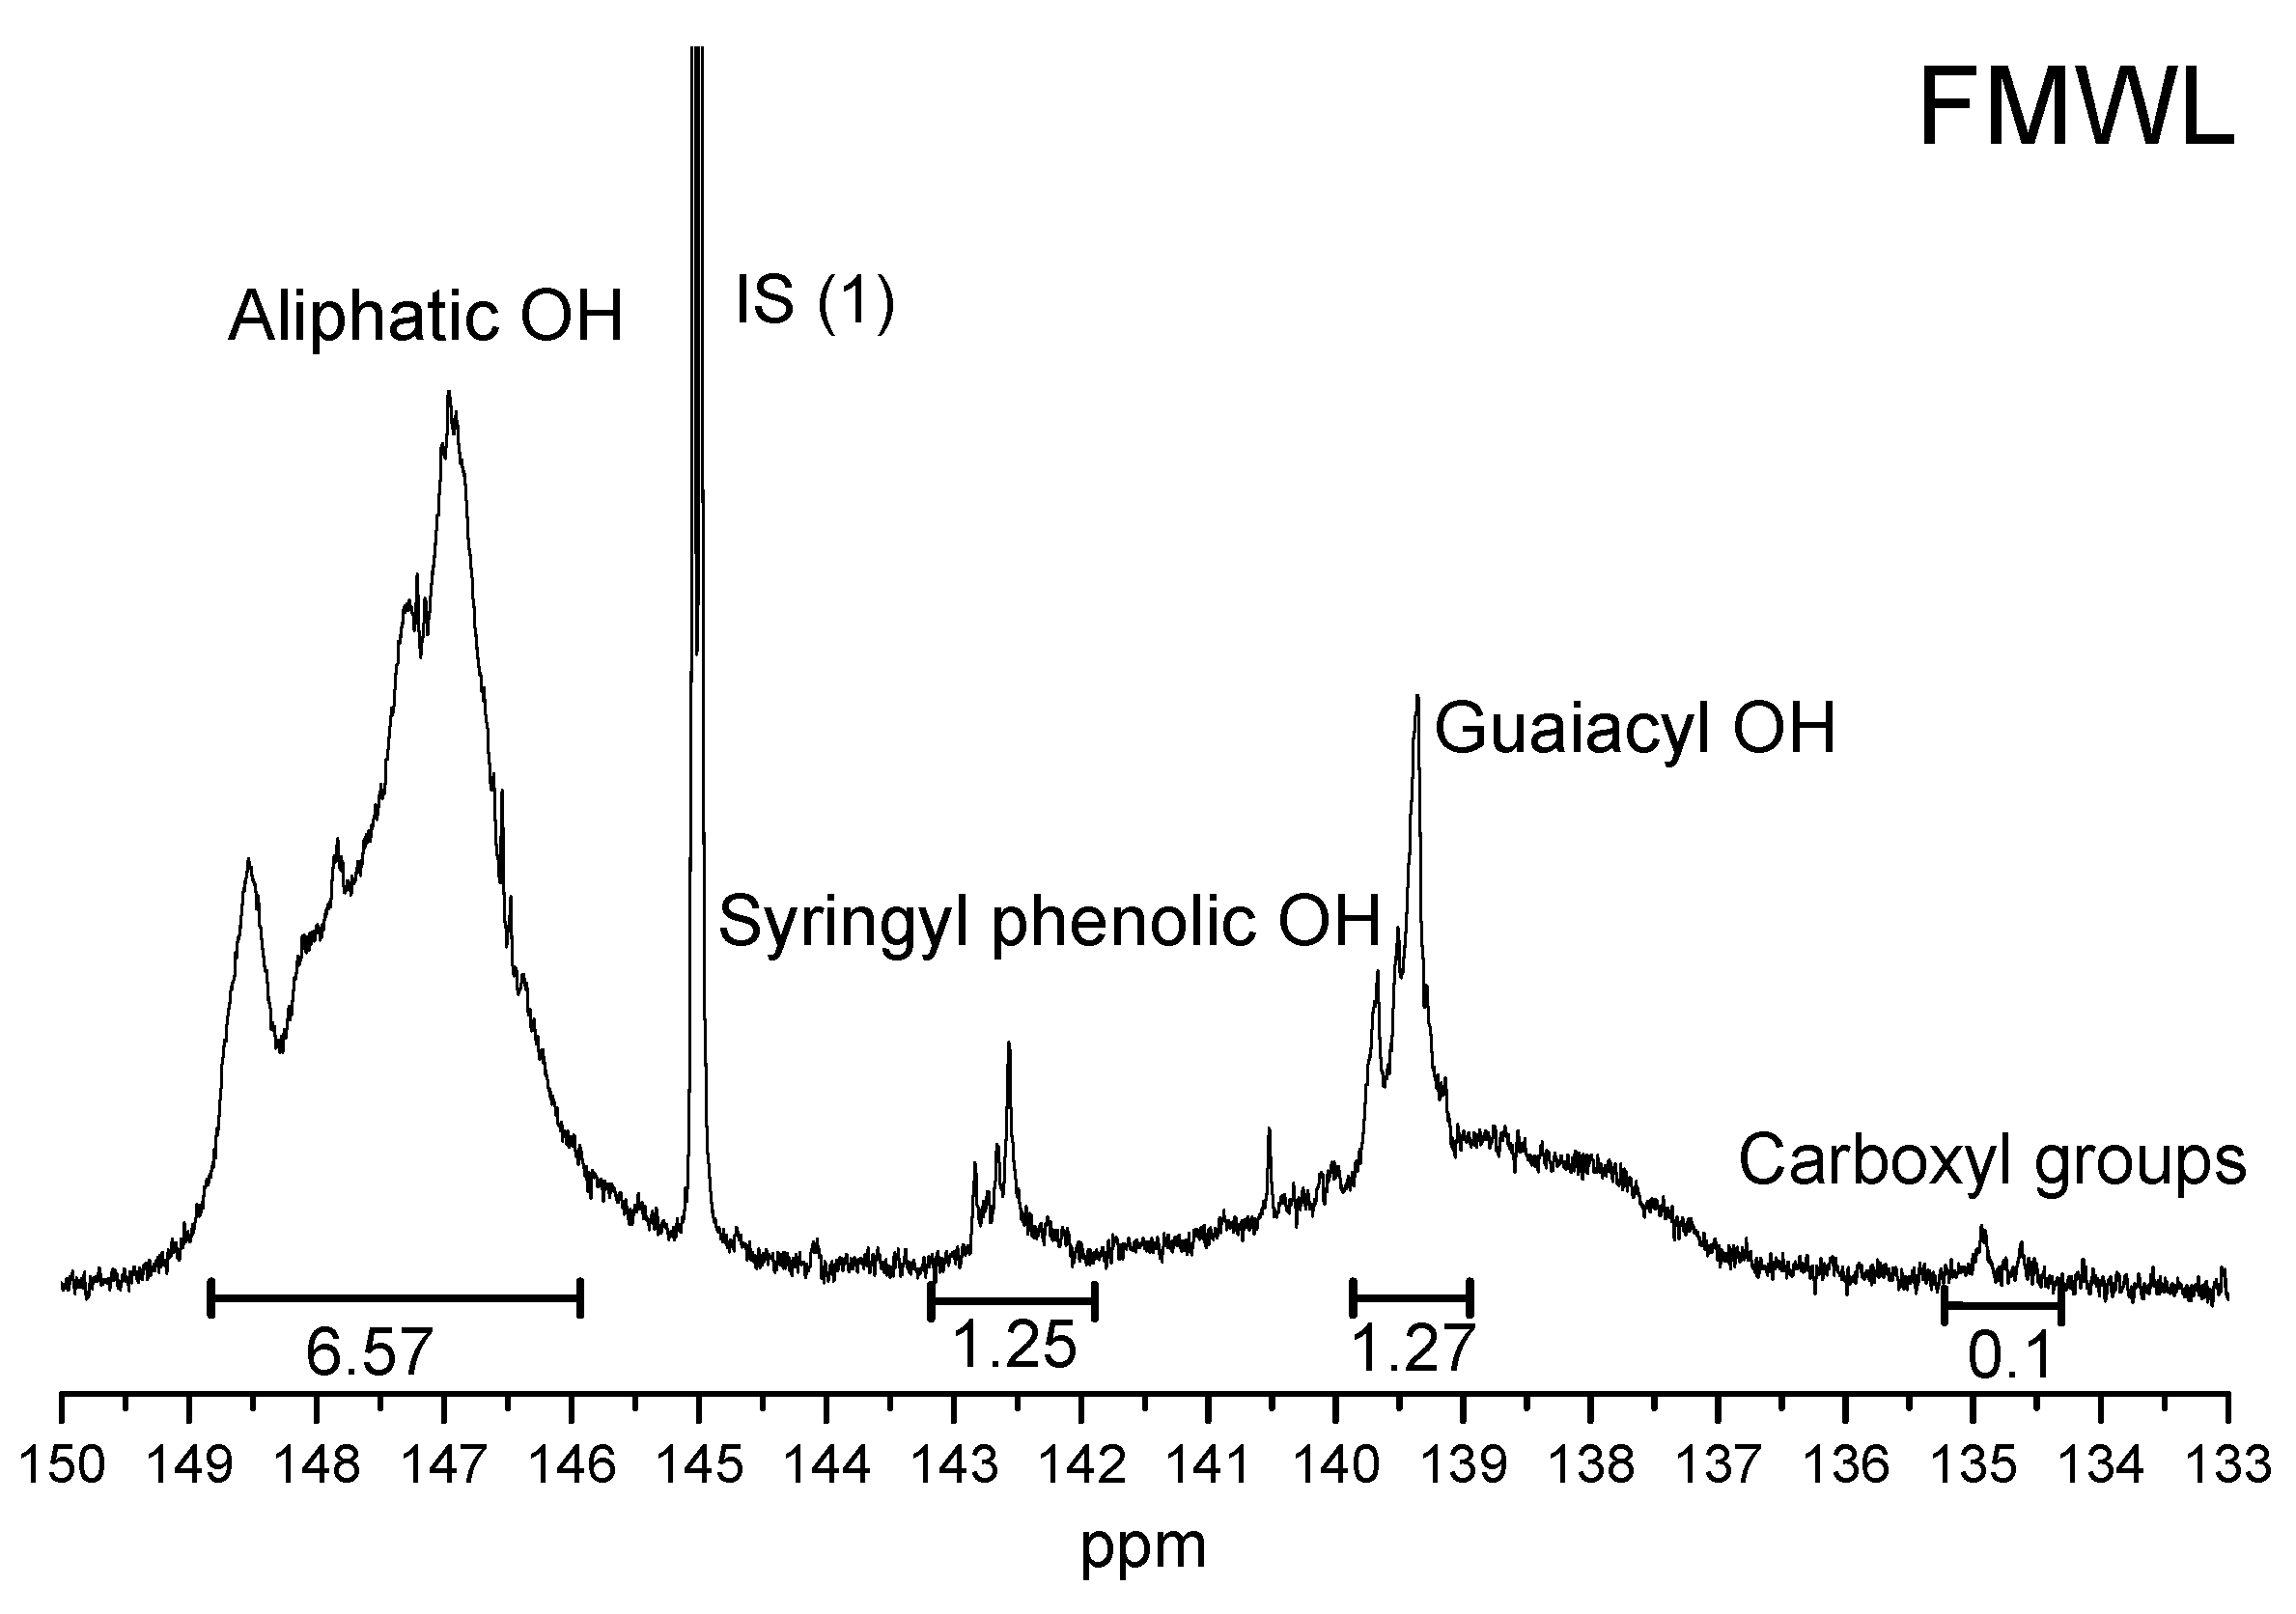
2.7.3. 31P-NMR Spectra Analysis
3. Materials and Methods
3.1. Materials
3.2. Preparation of Milled Wood Lignin
3.3. Characterization
4. Conclusions
Supplementary Materials
Acknowledgments
Author Contributions
Conflicts of Interest
References
- Kim, D.H.; Lee, J.S.; Yun, C.Y.; Kim, D.H.; Kim, I.S. Chinese quince (Chaenomeles sinensis) extract inhibits cell migration and cytokine release in HMC-1 cells. Food Sci. Biotechnol. 2013, 22, 501–506. [Google Scholar] [CrossRef]
- Myung, S.J.; Jung, E.P.; Hae, Y.P. Formulation optimization of salad dressing added with Chinese quince (Chaenomelis sinensis) juice by mixture design. Food Sci. Biotechnol. 2011, 20, 409–417. [Google Scholar]
- Reiko, S.K.; Sanae, K.; Yohko, K.S.; Yutaka, S.; Kazumichi, K.; Torahiko, T.; Tatsuo, Y.; Kouji, S.; Kazufumi, S. A polyphenol-rich extract from Chaenomeles sinensis (Chinese quince) inhibits influenza A virus infection by preventing primary transcription in vitro. J. Ethnopharmacol. 2013, 146, 866–872. [Google Scholar]
- Yasunori, H.; Irie, M.; Kondo, M.; Fujita, T. Antiulcerative properties of crude polyphenols and juice of apple, and Chinese quince extracts. Food Chem. 2008, 108, 488–495. [Google Scholar]
- Yasunori, H.; Takanori, I.; Chihiro, K.; Miho, I.; Kohzy, H. Antioxidant and antiulcerative properties of phenolics from Chinese quince, quince, and apple fruits. J. Agric. Food Chem. 2006, 54, 765–772. [Google Scholar]
- Walton, N.J.; Mayer, M.J.; Narbad, A. Vanillin. Phytochemistry 2003, 63, 505–515. [Google Scholar] [CrossRef]
- Balasundram, N.; Sundram, K.; Samman, S. Phenolic compounds in plants and agri-industrial by-products: Antioxidant activity, occurrence, and potential uses. Food Chem. 2006, 99, 191–203. [Google Scholar] [CrossRef]
- Xiao, L.P.; Xu, F.; Sun, R.C. Chemical and structural characterization of lignins isolated from Caragana sinica. Fibers Polym. 2011, 12, 316–323. [Google Scholar] [CrossRef]
- Mansouri, N.-E.E.; Salvado, J. Structural characterization of technical lignins for the production of adhesives: Application to lignosulfonate, kraft, soda-anthraquinone, organosolv and ethanol process lignins. Ind. Crops Prod. 2006, 24, 8–16. [Google Scholar] [CrossRef]
- Ralph, J.; Lundquist, K.; Brunow, G.; Lu, F.C.; Kim, H.; Schatz, P.F.; Marita, J.M.; Hatfield, R.D.; Ralph, S.A.; Christensen, J.H.; et al. Lignins: Natural polymers from oxidative coupling of 4-hydroxyphenylpropanoids. Phytochem. Rev. 2004, 3, 29–60. [Google Scholar] [CrossRef]
- Zhang, J.; Cui, J.H.; Yin, T.; Sun, L.; Li, G. Activated effect of lignin on α-amylase. Food Chem. 2013, 141, 2229–2237. [Google Scholar] [CrossRef] [PubMed]
- Ross, K.; Mazza, G. Characteristics of lignin from flax shives as affected by extraction conditions. Int. J. Mol. Sci. 2010, 11, 4035–4050. [Google Scholar] [CrossRef] [PubMed]
- Serrano, L.; Egües, I.; Alriols, M.G.; Llano-Ponte, R.; Labidi, J. Miscanthus sinensis fractionation by different reagents. Chem. Eng. J. 2010, 156, 49–55. [Google Scholar] [CrossRef]
- Faix, O. Classification of lignins from different botanical origins by FT-IR spectroscopy. Holzforschung 1991, 45, 21–27. [Google Scholar] [CrossRef]
- El-Zawawy, W.K. Preparation of hydrogel from green polymer. Polym. Adv. Technol. 2005, 16, 48–54. [Google Scholar] [CrossRef]
- Bu, L.; Tang, Y.; Gao, Y.; Jian, H.; Jiang, J. Comparative characterization of milled wood lignin from furfural residues and corncob. Chem. Eng. J. 2011, 175, 176–184. [Google Scholar] [CrossRef]
- Guerra, A.; Filpponen, I.; Lucia, L.; Saquing, C.; Baumberger, S.; Argyropoulos, D.S. Toward a better understanding of the lignin isolation process from wood. J. Agric. Food Chem. 2006, 54, 5939–5947. [Google Scholar] [CrossRef] [PubMed]
- Jääskeläinen, A.S.; Sun, Y.; Argyropoulos, D.S.; Tamminen, T.; Hortling, B. The effect of isolation method on the chemical structure of residual lignin. Wood Sci. Technol. 2003, 37, 91–102. [Google Scholar] [CrossRef]
- Li, M.F.; Sun, S.N.; Xu, F.; Sun, R.C. Formic acid based organosolv pulping of bamboo (Phyllostachys acuta): Comparative characterization of the dissolved lignins with milled wood lignin. Chem. Eng. J. 2012, 179, 80–89. [Google Scholar] [CrossRef]
- Liu, Q.; Wang, S.R.; Zheng, Y.; Luo, Z.Y.; Cen, K.F. Mechanism study of wood lignin pyrolysis by using TG-FTIR analysis. J. Anal. Appl. Pyrolysis 2008, 82, 170–177. [Google Scholar] [CrossRef]
- Sahoo, S.; Seydibeyoglu, M.Ö.; Mohanty, A.K.; Misra, M. Characterization of industrial lignins for their utilization in future value added applications. Biomass Bioenergy 2011, 35, 4230–4237. [Google Scholar] [CrossRef]
- Singh, R.; Singh, S.; Trimukhe, K.D.; Pandare, K.V.; Bastawade, K.B.; Gokhale, D.V.; Varma, A.J. Lignin–carbohydrate complexes from sugarcane bagasse: Preparation, purification, and characterization. Carbohydr. Polym. 2005, 62, 57–66. [Google Scholar] [CrossRef]
- Li, M.F.; Sun, S.N.; Xu, F.; Sun, R.C. Ultrasound-enhanced extraction of lignin from bamboo (Neosinocalamus affinis): Characterization of the ethanol-soluble fractions. Ultrason. Sonochem. 2012, 19, 243–249. [Google Scholar] [CrossRef]
- Azadfar, M.; Gao, A.H.; Bule, M.V.; Chen, S.L. Structural characterization of lignin: A potential source of antioxidants guaiacol and 4-vinylguaiacol. Int. J. Biol. Macromol. 2015, 75, 58–66. [Google Scholar] [CrossRef] [PubMed]
- Parthasarathi, R.; Romero, R.A.; Redondo, A.; Gnanakaran, S. Theoretical study of the remarkably diverse linkages in lignin. J. Phys. Chem. Lett. 2011, 2, 2660–2666. [Google Scholar] [CrossRef]
- Wang, S.R.; Ru, B.; Lin, H.Z.; Sun, W.X.; Luo, Z.Y. Pyrolysis behaviors of four lignin polymers isolated from the same pine wood. Bioresour. Technol. 2015, 182, 120–127. [Google Scholar] [CrossRef] [PubMed]
- Alén, R.; Kuoppala, E.; Oesch, P. Formation of the main degradation compound groups from wood and its components during pyrolysis. J. Anal. Appl. Pyrolysis 1996, 36, 137–148. [Google Scholar] [CrossRef]
- Kim, H.; Ralph, J.; Akiyama, T. Solution-state 2D NMR of Ball-milled Plant Cell Wall Gels in DMSO-d6. BioEnergy Res. 2008, 1, 55–56. [Google Scholar] [CrossRef]
- Balakshin, M.Y.; Capanema, E.A.; Chang, H.M. MWL fraction with a high concentration of lignin-carbohydrate linkages: Isolation and 2D NMR spectroscopic analysis. Holzforschung 2007, 61, 1–7. [Google Scholar] [CrossRef]
- Balakshin, M.Y.; Capanema, E.A.; Gracz, H.; Chang, H.M.; Jameel, H. Quantification of lignin-carbohydrate linkages with high resolution NMR spectroscopy. Planta 2011, 233, 1097–1110. [Google Scholar] [CrossRef] [PubMed]
- Lu, F.C.; Ralph, J. Non-degradative dissolution and acetylation of ball-milled plant cell walls: High-resolution solution-state NMR. Plant J. 2003, 35, 535–544. [Google Scholar] [CrossRef] [PubMed]
- Lu, F.C.; Ralph, J.; Morreel, K.; Messens, E.; Boerjan, W. Preparation and relevance of a cross-coupling product between sinapyl alcohol and sinapyl p-hydroxybenzoate. Org. Biomol. Chem. 2004, 2, 2888–2890. [Google Scholar] [CrossRef] [PubMed]
- Villaverde, J.J.; Li, J.B.; Ek, M.; Ligero, P.; De Vega, A. Native lignin structure of Miscanthus×giganteus and its changes during acetic and formic acid fractionation. J. Agric. Food Chem. 2009, 57, 6262–6270. [Google Scholar] [CrossRef] [PubMed]
- Yuan, T.Q.; Sun, S.N.; Xu, F.; Sun, R.C. Characterization of lignin structures and lignin-carbohydrate complex (LCC) linkages by Quantitative 13C and 2D HSQC NMR Spectroscopy. J. Agric. Food Chem. 2011, 59, 10604–10614. [Google Scholar] [CrossRef] [PubMed]
- Rencoret, J.; Marques, G.; Gutierrez, A.; Ibarra, D.; Li, J.; Gellerstedt, G.; Santos, J.I.; Jiménez-Barbero, J.; Martinez, A.T.; Del Río, J.C. Structural characterization of milled wood lignins from different eucalypt species. Holzforschung 2008, 62, 514–526. [Google Scholar] [CrossRef]
- Wen, J.L.; Sun, S.L.; Xue, B.L.; Sun, R.C. Recent advances in characterization of lignin polymer by solution-state nuclear magnetic resonance (NMR) methodology. Materials 2013, 6, 359–391. [Google Scholar] [CrossRef]
- Björkman, A. Isolation of lignin from finely divided wood with neutral solvents. Nature 1954, 174, 1057–1058. [Google Scholar] [CrossRef]
- Yuan, T.Q.; Sun, S.N.; Feng, X.; Sun, R.C. Isolation and Physico-Chemical characterization of lignins from ultrasound irradiated fast-growing Poplar wood. BioResources 2011, 6, 414–433. [Google Scholar]
- Peng, F.; Ren, J.L.; Xu, F.; Bian, J.; Peng, P.; Sun, R.C. Fractionation of alkali-solubilized hemicelluloses from delignified Populus gansuensis: Structure and properties. J. Agric. Food Chem. 2010, 58, 5743–5750. [Google Scholar] [CrossRef] [PubMed]
- Zhao, J.; Wang, X.W.; Hu, J.; Liu, Q.; Shen, D.; Xiao, R. Thermal degradation of softwood lignin and hardwood lignin by TG–FTIR and Py–GC/MS. Polym. Degrad. Stab. 2014, 108, 133–138. [Google Scholar] [CrossRef]
- Chen, L.; Wang, X.; Yang, H.; Lu, Q.; Li, D.; Yang, Q. Study on pyrolysis behaviors of non-woody lignins with TG–FTIR and Py–GC/MS. J. Anal. Appl. Pyrolysis 2015, 133, 499–507. [Google Scholar] [CrossRef]
- Brebu, M.; Tamminen, T.; Spiridon, I. Thermal degradation of various lignins by TG–MS/FTIR and Py–GC–MS. J. Anal. Appl. Pyrolysis 2013, 104, 531–539. [Google Scholar] [CrossRef]
- Cheng, K.; Sorek, H.; Zimmermann, H.; Wemmer, D.H.; Pauly, M. Solution-State 2D NMR Spectroscopy of plant cell walls enabled by a dimethylsulfoxide-d6/1-ethyl-3-methylimidazolium acetate solvent. Anal. Chem. 2013, 85, 3213–3221. [Google Scholar] [CrossRef] [PubMed]
Sample Availability: Not available. |


| Sample | Yield of MWL (%) | Total Sugar Content (%) | Carbohydrate Composition Content (Based on Total Sugar, %) | |||||
|---|---|---|---|---|---|---|---|---|
| Gal a | Glu a | Man a | Ara a | Xyl a | Glua a | |||
| SMWL | 7.3 | 0.67 | 13.4 | 20.9 | - | 14.9 | 38.8 | 11.9 |
| FMWL | 0.8 | 1.39 | 18.7 | 58.3 | 15.8 | 7.2 | - | - |
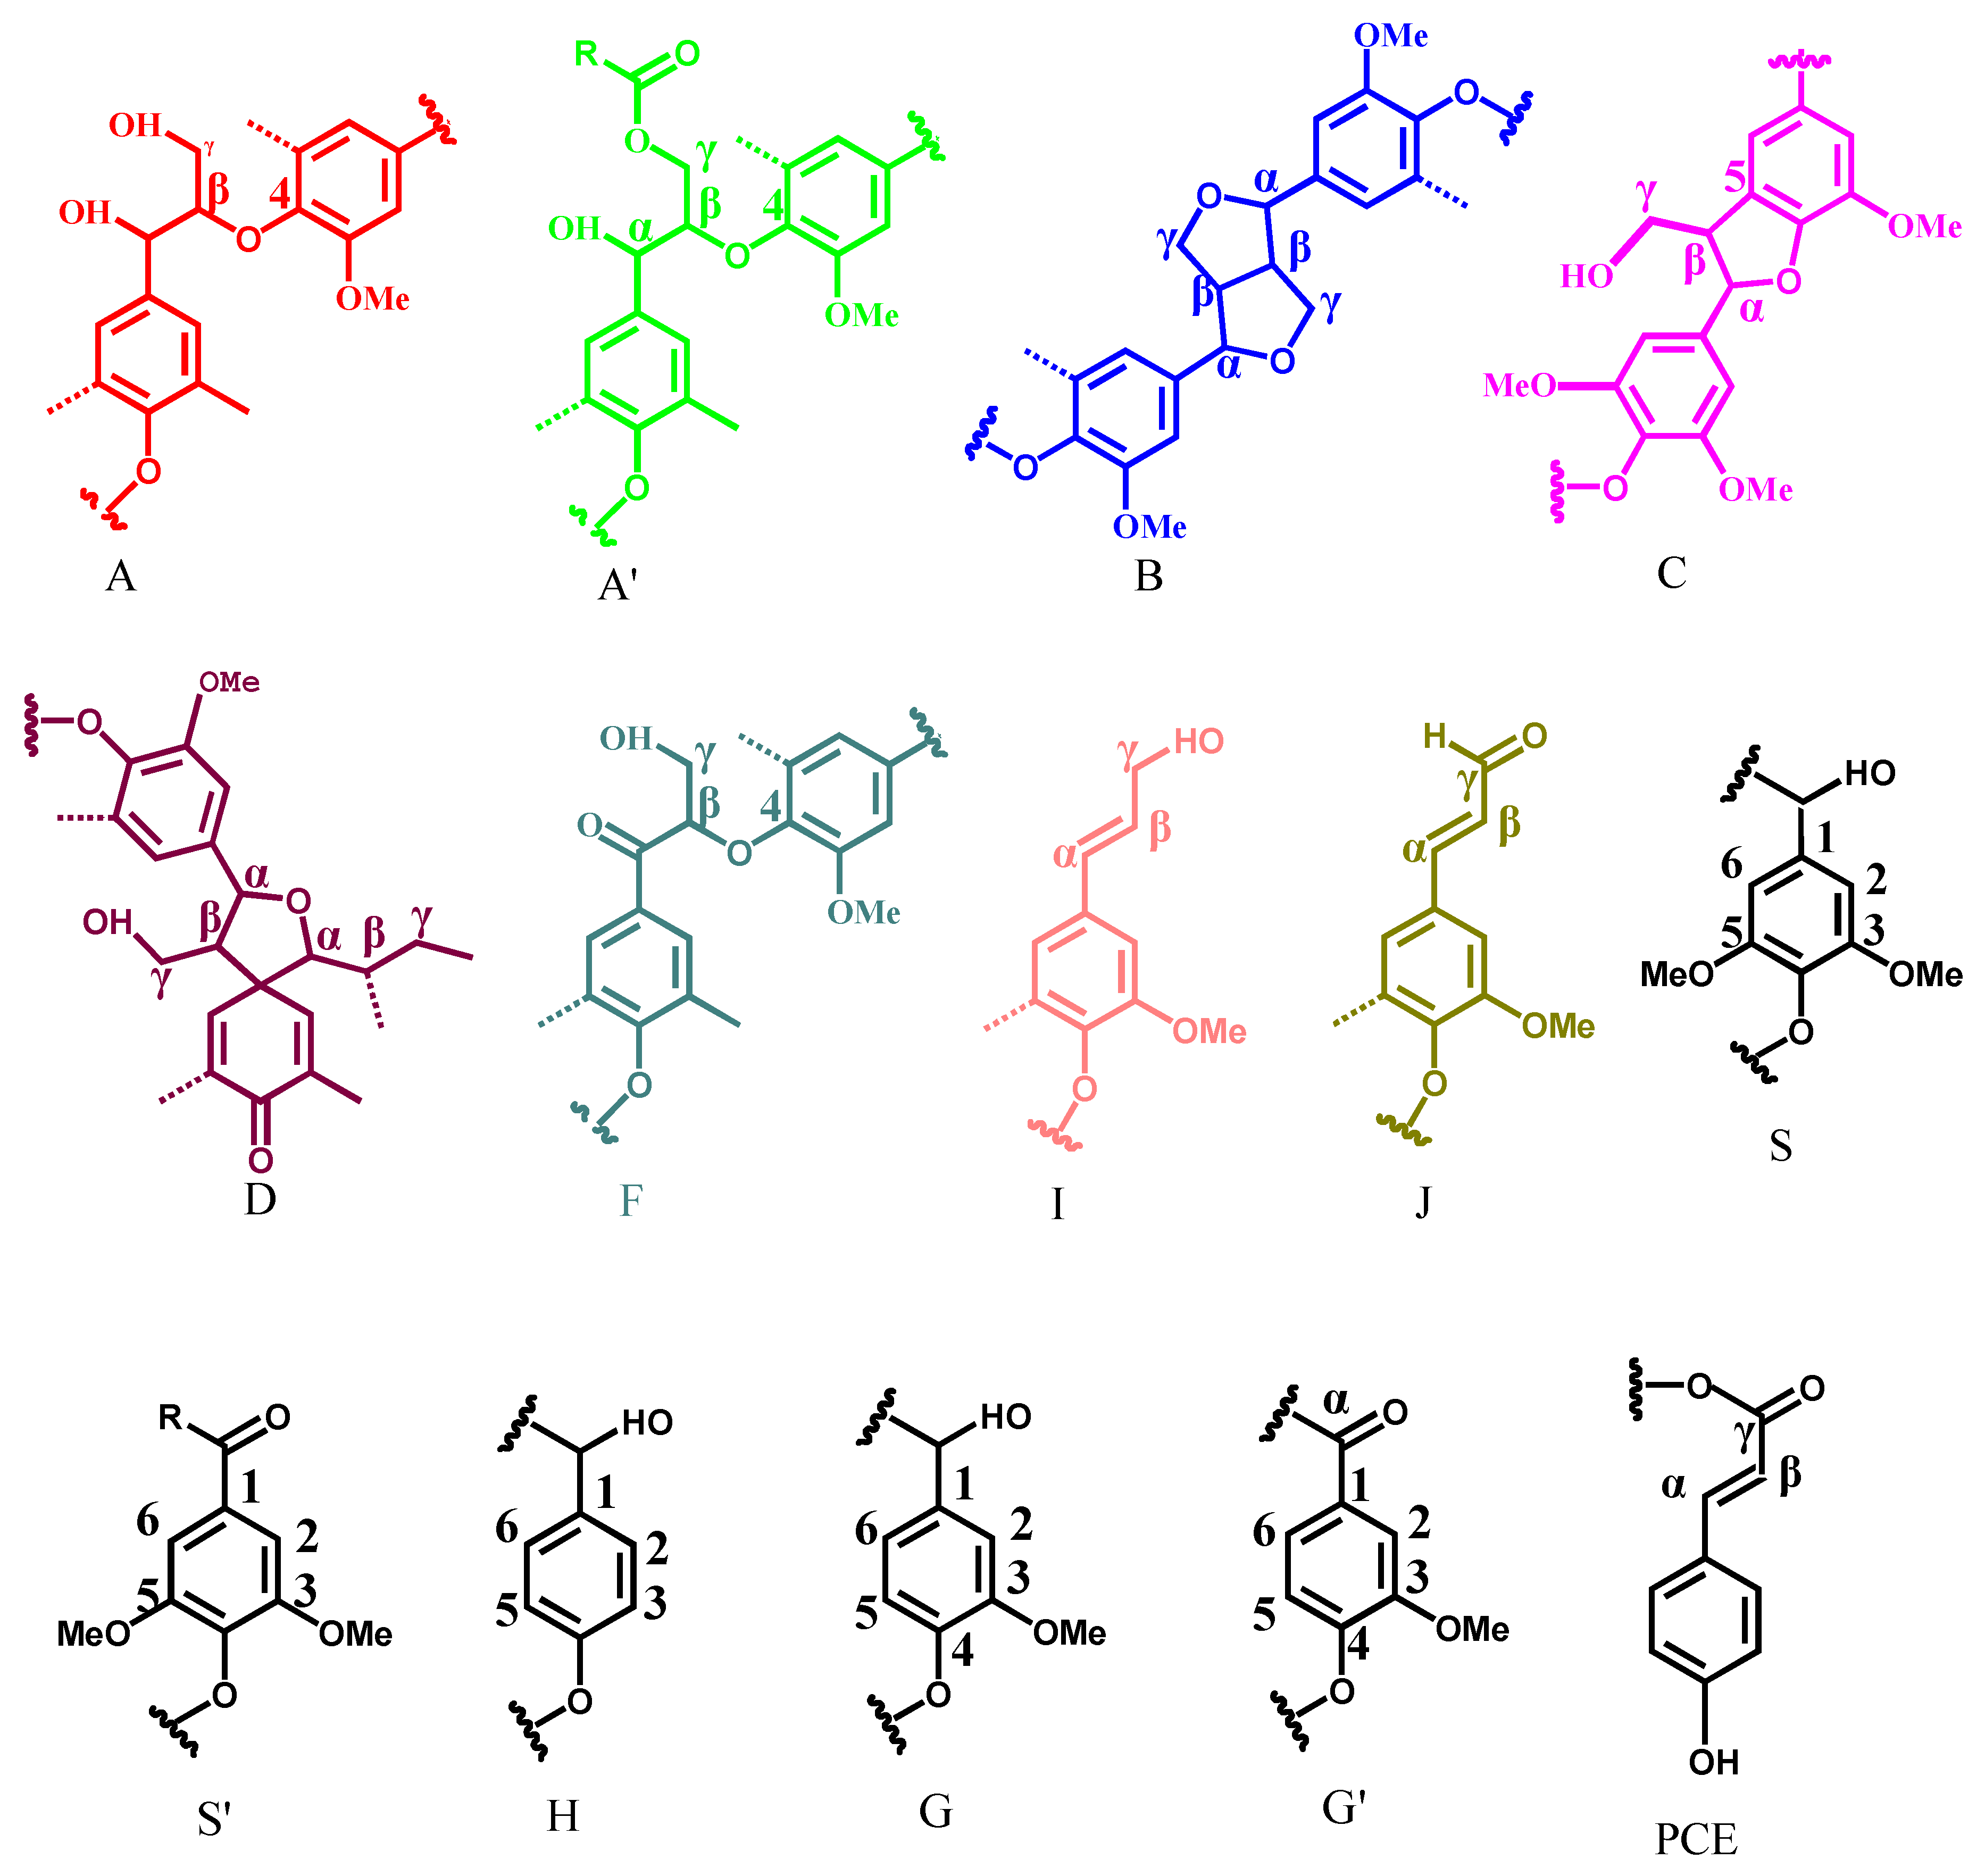
| Label | δC/δH | Assignment |
|---|---|---|
| OCH3 | 56.2/3.75 | C-H in methoxyls |
| (A, A′)α | 72.4/4.88 | Cα-Hα in β-O-4′ substructures (A) and γ-acylated β-O-4′ substructures (A′) |
| Aβ (G/H) | 84.5/4.31 | Cβ-Hβ in β-O-4′ substructures linked to G and H units (A) |
| Aβ (S) | 86.5/4.13 | Cβ-Hβ in γ-acylated β-O-4′ substructures linked to S units (A′) |
| Aγ | 60.3/3.40–3.70 | Cγ-Hγ in β-O-4′ substructures units (A) |
| A′γ | 63.5/4.34–4.46 | Cγ-Hγ in γ-acylated β-O-4′ substructures units (A′) |
| Bα | 85.3/4.68 | Cα-Hα in resinol substructures (B) |
| Bβ | 54.0/3.07 | Cβ-Hβ in resinol substructures (B) |
| Bγ | 71.9/3.84 and 4.19 | Cγ-Hγ in resinol substructures (B) |
| Cα | 87.2/5.50 | Cα-Hα in phenylcoumaran substructures (C) |
| Cβ | 53.8/3.33 | Cβ-Hβ in phenylcoumaran substructures (C) |
| Cγ | 62.9/3.76 | Cγ-Hγ in phenylcoumaran substructures (C) |
| Dα | 81.7/5.08 | Cα-Hα in spirodienone substructures (D) |
| Dβ | 60.1/2.79 | Cβ-Hβ in spirodienone substructures (D) |
| Fβ | 83.5/5.21 | Cβ-Hβ in oxidized (Cα=O) β-O-4′ substructures (F) |
| Iγ | 61.3/4.27 | Cγ-Hγ in p-hydroxycinnamyl alcohol end groups (I) |
| FAβ | 113.9/6.29 | Cβ-Hβ in cinnamate unit |
| G2 | 111.7/6.95 | C2-H2 in guaiacyl units (G) |
| G6 | 119.8/6.79 | C6-H6 in guaiacyl units (G) |
| G5 | 115.4/6.71 | C5-H5 in guaiacyl units (G) |
| G′2 | 112.0/7.51 | C2-H2 in oxidized (Cα=O) guaiacyl units (G′) |
| G′6 | 124.4/7.60 | C6-H6 in oxidized (Cα=O) guaiacyl units (G′) |
| S2,6 | 104.7/6.71 | C2,6-H2,6 in etherified syringyl units (S) |
| S′2,6 | 106.9/7.31 | C2,6-H2,6 in oxidized (Cα=O) syringyl units (S′) |
| H2,6 | 128.7/7.21 | C2,6-H2,6 in p-hydroxyphenyl units (H) |
| Jα | 154.0/7.59 | Cα-Hα in cinnamaldehyde end groups (J) |
| Jβ | 126.5/6.80 | Cβ-Hβ in cinnamaldehyde end groups (J) |
| Iα | 129.8/6.22 | Cα-Hα in p-hydroxycinnamyl alcohol end groups (I) |
| Iβ | 129.5/6.41 | Cβ-Hβ in p-hydroxycinnamyl alcohol end groups (I) |
| PCE2,6 | 130.2/7.48 | C2,6-H2,6 in p-coumarate (PCE) |
| Lignin Interunit Linkages | Percentage (%) | |
|---|---|---|
| SMWL | FMWL | |
| β-O-4-Aryl ethers (A/A′) | 88.10 | 89.70 |
| β-β (Resinols) (B) | 9.80 | 8.30 |
| β-5 (Phenylcoumarans) (C) | 0.70 | 1.50 |
| Spirodienones (D) | 1.40 | 0.50 |
| Syringyl Units (S2,6) | 53.68 | 74.07 |
| Guaiacyl Units (G2) | 46.00 | 25.19 |
| p-Hydroxyphenyl units (H2,6) | 0.32 | 0.74 |
| S/G ratio | 1.17 | 2.94 |
© 2017 by the authors. Licensee MDPI, Basel, Switzerland. This article is an open access article distributed under the terms and conditions of the Creative Commons Attribution (CC BY) license (http://creativecommons.org/licenses/by/4.0/).
Share and Cite
Yin, H.-S.; Liu, H.-M.; Liu, Y.-L. Structural Characterization of Lignin in Fruits and Stalks of Chinese Quince. Molecules 2017, 22, 890. https://doi.org/10.3390/molecules22060890
Yin H-S, Liu H-M, Liu Y-L. Structural Characterization of Lignin in Fruits and Stalks of Chinese Quince. Molecules. 2017; 22(6):890. https://doi.org/10.3390/molecules22060890
Chicago/Turabian StyleYin, Hui-Shuang, Hua-Min Liu, and Yu-Lan Liu. 2017. "Structural Characterization of Lignin in Fruits and Stalks of Chinese Quince" Molecules 22, no. 6: 890. https://doi.org/10.3390/molecules22060890
APA StyleYin, H.-S., Liu, H.-M., & Liu, Y.-L. (2017). Structural Characterization of Lignin in Fruits and Stalks of Chinese Quince. Molecules, 22(6), 890. https://doi.org/10.3390/molecules22060890