2. Results and Discussion
Extraction of the air dried roots of
T. aequilata with CH
2Cl
2/CH
3OH (1:1) at room temperature, followed by chromatographic separation, afforded 11 compounds. Of these, obovatin methyl ether (
5) [
6,
7], obovatachalcone (
6) [
7], praecansone B (
7) [
8],
Z-praecansone A (
8) [
9], candidone (
9) [
2], isopongaflavone (
10) [
10,
11], and β
-sitostrol-3-
O-glucoside (
11) [
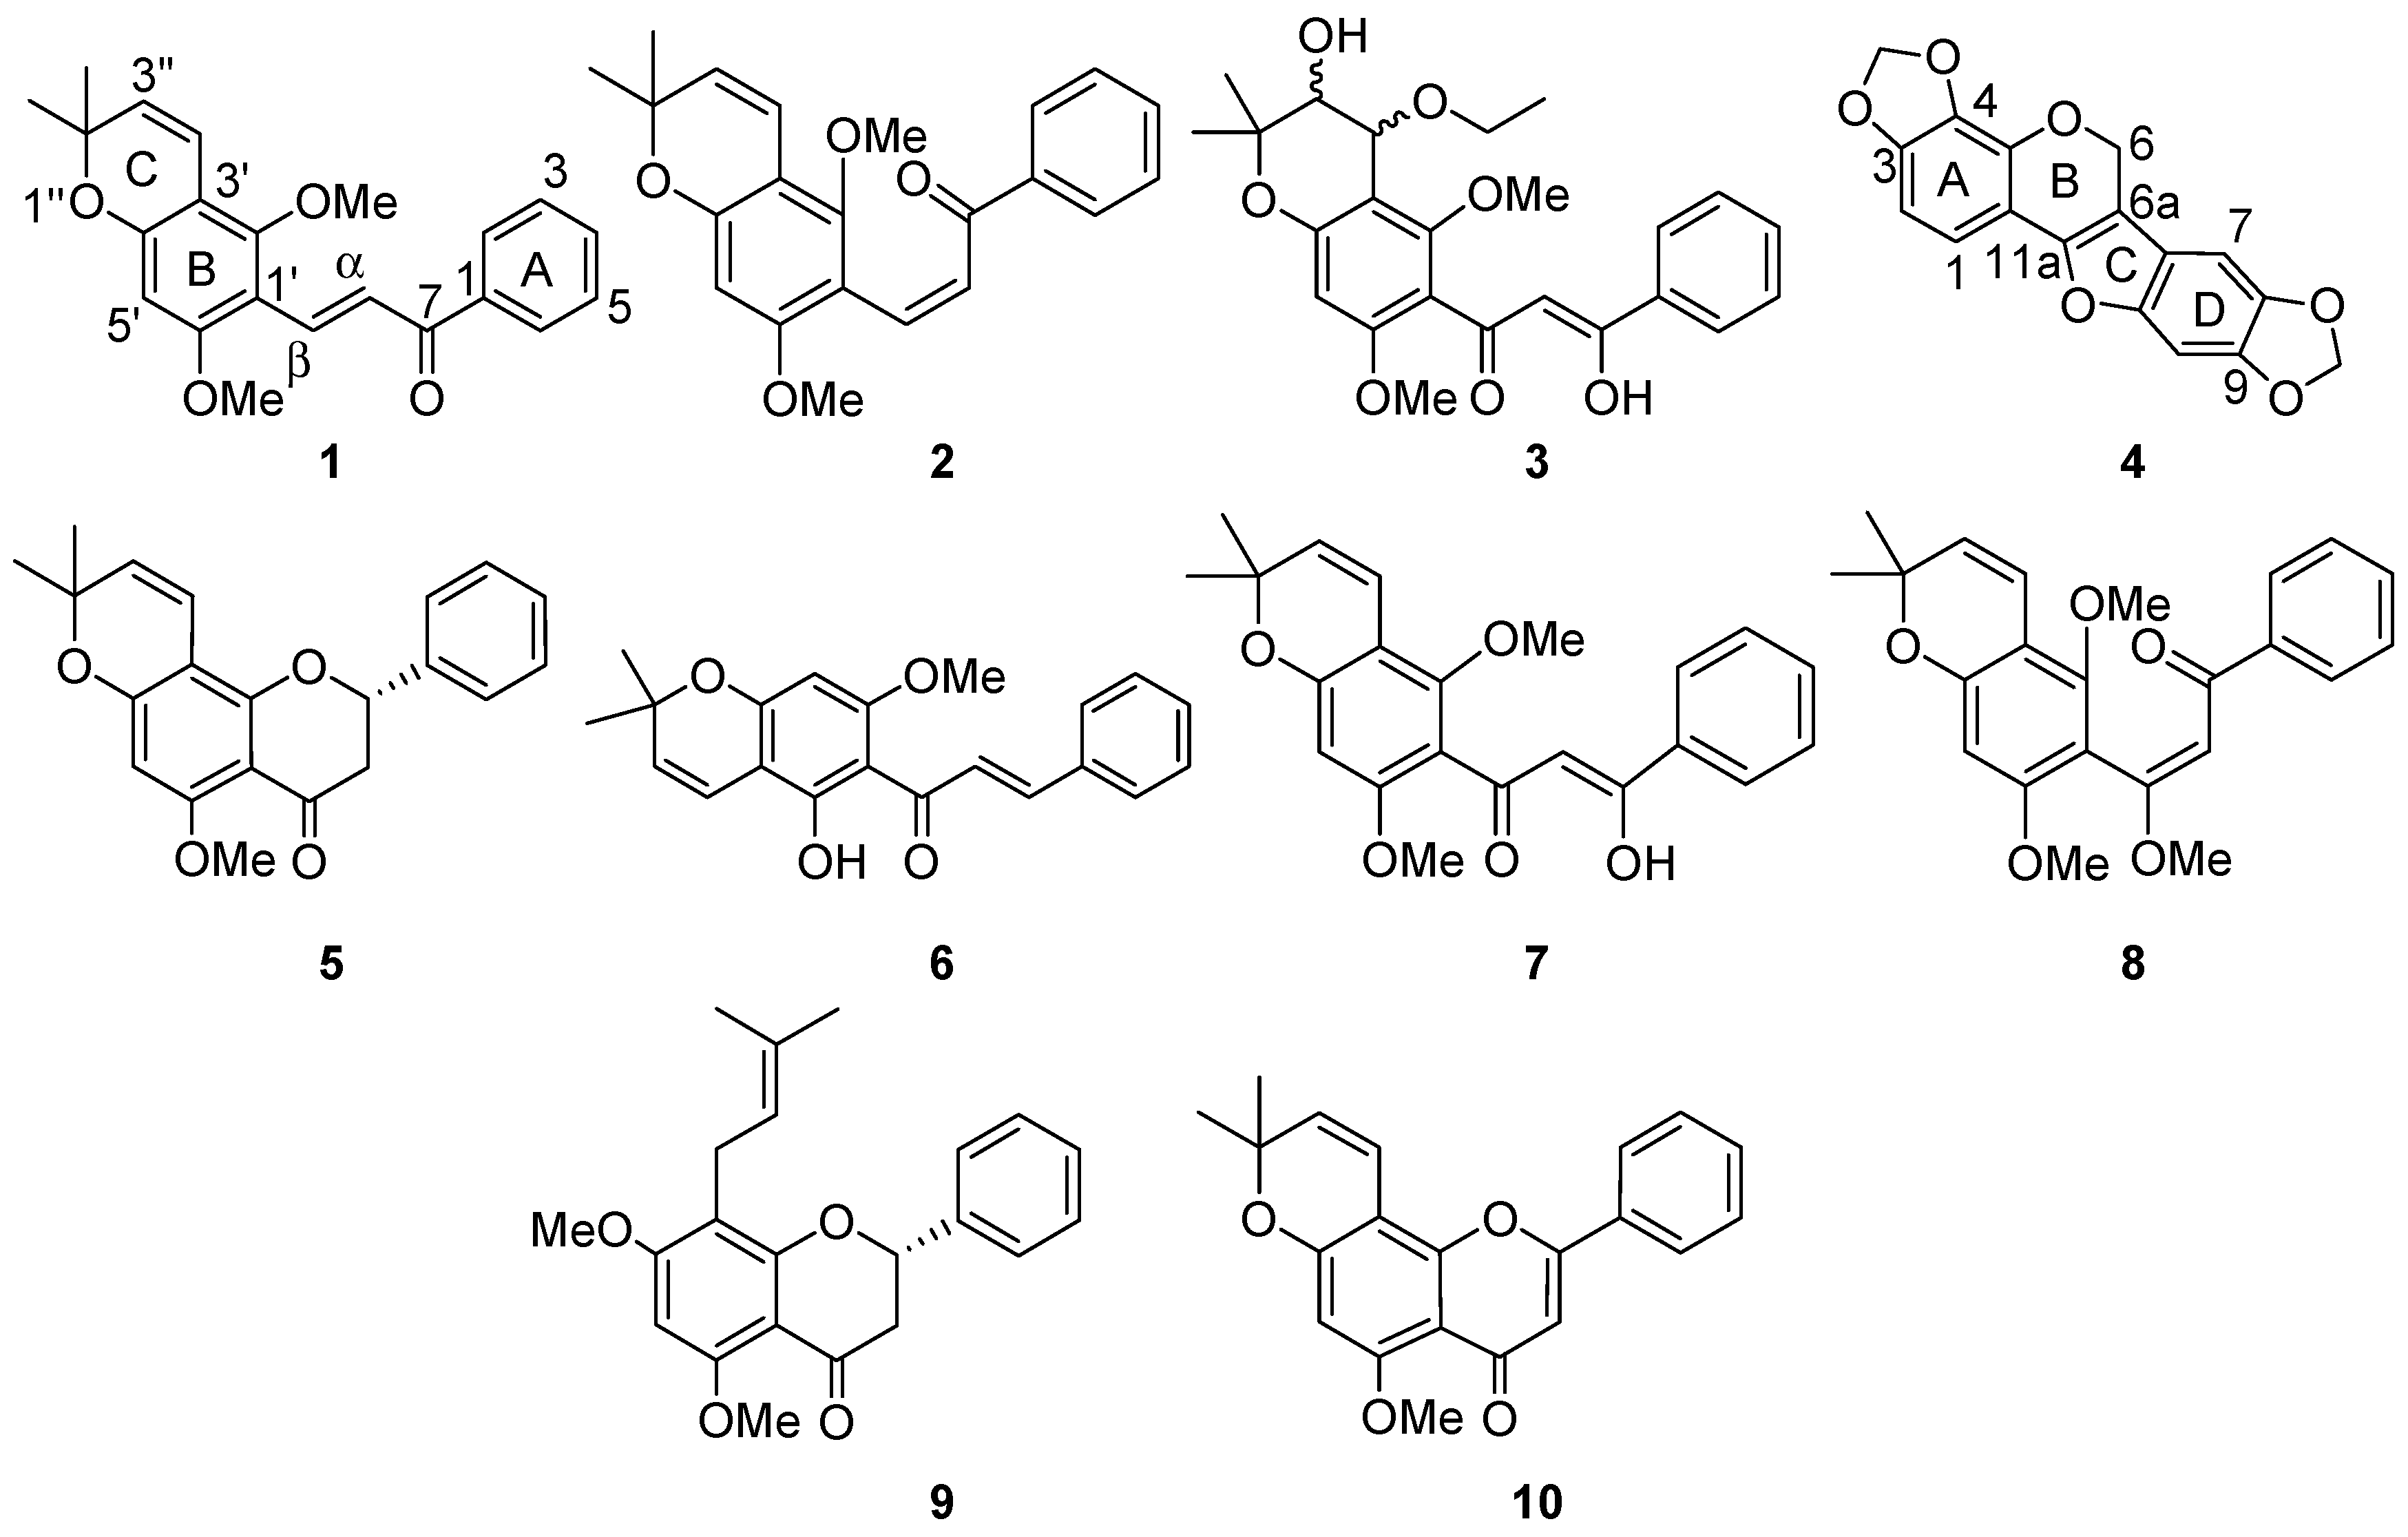
12] are known, and were identified by comparison of their observed and reported spectroscopic and physical data. Compounds
1–
4 (
Figure 1) are new and were identified by NMR spectroscopic and mass spectrometric analyses.
Compound
1 was isolated as a yellow paste showing UV absorption maxima at 240, 290 and 370 nm, typical of a chalconoid chromophore [
13]. Based on HRESIMS analysis ([M + H]
+ obs
m/
z 351.1585, calcd 351.1591), and
1H- and
13C-NMR spectral data (
Table 1), the molecular formula C
22H
22O
4 was assigned. The
1H-NMR signals observed at δ
H 7.96 (d,
J = 16.0 Hz) and δ
H 8.15 (d,
J = 16.0 Hz) correspond to the H-α and H-β, respectively, of a chalconoid skeleton possessing
E-geometry. The corresponding C-α (δ
C 122.8) and C-β (136.1) were identified from the HSQC spectrum (
Figure S5,
Supplementary Materials). The presence of two methoxy and a 2,2-dimethylpyrano substituents were evident from the NMR spectra (
Table 1). Of the two methoxy functionalities observed, the
13C-NMR signal of one was deshielded (δ
C 62.9) suggesting
diortho-substitution. This methoxy group (δ
H 3.77) showed a NOE correlation to H-β (δ
H 8.15) and H-4′′ (δ
H 6.55), and was accordingly placed at C-2′ (
Figure S3,
Supplementary Materials). The second methoxy group (δ
H 3.88, δ
C 55.9) showed a NOE correlation with the aromatic singlet δ
H 6.25 (H-5′), and hence was placed at C-6′, supported by the HMBC correlations (
Figure S6,
Supplementary Materials) of H-5′ (δ
H 6.25) with C-1′ (δ
C 110.5), C-2′ (δ
C 161.2), C-3′ (δ
C 108.2), and C-4′ (δ
C 157.0). The HMBC correlations of H-α (δ
H 7.96) with C-1′ (δ
C 110.5), C=O (δ
C 192.0) and those of H-β (δ
H 8.15) with C-6′ (δ
C 157.7), C-2′ (δ
C 161.2), C-α (δ
C 122.8) and C=O (δ
C 192.0) suggested that compound
1 is a retrochalcone [
14,
15,
16]. The high chemical shift of H-2/6 of ring A (δ
H 8.01), which showed a HMBC correlation with the carbonyl carbon (δ
C 192.0), and the lack of NOE between H-2/6 (δ
H 8.01) and H-β (δ
H 8.15) suggested that the carbonyl is adjacent to ring A [
17]. This ring is unsubstituted, as indicated by the COSY correlations connecting the H-2/6 (δ
H 8.01), H-3/5 (δ
H 7.47) and H-6 (δ
H 7.53) spin system. The connection of the 2,2-dimethylpyrano group (C ring) to the B ring via the bridging C-3′ and C-4′ atoms was revealed by the HMBC correlations of H-4′′ (δ
H 6.55) with C-3′ (δ
C 108.2) and C-4′ (δ
C 157.0), and by that of H-3′′ (δ
H 5.55) with C-3′ (δ
C 108.2). It was further confirmed by the NOE of H-4′′ (δ
H 6.55) and MeO-2′ (δ
H 3.77). The HMBC correlations of H-3′′ (δ
H 5.55) with Me-2′′ (δ
C 28.1) and C-2′′ (δ
C 77.0) along with the NOE of H-3′′ (δ
H 5.55) with Me-2′′ (δ
H 1.44) defined the constitution of the C ring. Thus, on the basis of its spectroscopic data, compound
1 was characterized as
E-2′,6′-dimethoxy-3′,4′-(2′′,2′′-dimethyl)pyranoretrochalcone, and was assigned the trivial name aequichalcone A.
Compound
2 was isolated as a colorless paste, and was assigned the molecular formula C
22H
22O
4 based on HRESIMS ([M + H]
+ m/
z obs 351.1585, calcd 350.1590) and NMR (
Table 1) analyses. Similar to compound
1, the NMR signals δ
H 6.94 (d,
J = 12.6 Hz) and δ
H 6.57 (d,
J = 12.6 Hz), corresponding to H-α and H-β, respectively, suggested a chalconoid skeleton, in this case, however, with a
Z-double bond configuration. Ring B of
2 was observed to be comparable to that of
1, with two methoxy groups at C-2′ (δ
H 3.47, δ
C 54.9) and C-6′ (δ
H 3.67, δ
C 61.8), and a 2,2-dimethylchromene ring C connected to ring B via the bridging C-3′ (δ
C 107.7) and C-4′ (δ
C 155.2) atoms. The substitution pattern of ring C was confirmed by HMBC and NOESY correlations (
Figures S14–S12,
Supplementary Materials), as described above for
1. Ring A of
2 was unsubstituted, and thus the only difference between
1 and
2 was the geometry of their α,β-double bond, reflected by the
3JHαHβ = 16.0 Hz vs. 12.6 Hz, and the strong NOE of H-α and H-β observed for
2 (
Figure S12,
Supplementary Materials) but not for
1 (
Figure S3,
Supplementary Materials). Therefore, compound
2 was characterized as
Z-2′,6′-dimethoxy-3′,4′-(2′′,2′′-dimethyl)pyranoretrochalcone, and was given the trivial name aequichalcone B.
Despite being geometrical isomers at one double bond, the chemical shifts of
1 and
2 were substantially different. Particularly, H-α (δ
H 7.96) and H-β (δ
H 8.15) of the
E-isomer
1 were deshielded compared to those of the
Z-isomer (H-α δ
H 6.94; H-β δ
H 6.57). Moreover, the carbonyl of
2 was deshielded (δ
C 194.4) compared to that of compound
1 (δ
C 192.0). These data suggested that due to steric crowding, the α,β-unsaturated carbonyl system of
2 was distorted and did not possess coplanar aromatic rings, decreasing the extent of the conjugation. The shielding of OMe-2′ (δ
H 3.47) and OMe-6′ (δ
H 3.67) of
2 further indicates that ring B was most likely perpendicular to the α,β-unsaturated system, and accordingly the methoxy groups experience the anisotropy effect of the α,β-unsaturated carbonyl system. Compound
2 was colorless and showed only a benzenoid absorption band at λ
max 245 nm, while compound
1 was yellow and possessed the characteristic UV spectrum of chalconoids with λ
max at 240, 290 and 370 nm, further corroborating the above hypothesis. Such distortion was reported earlier for
Z-preacansone A [
9] and for methyltepanone [
18].
Upon standing at room temperature in acetone-
d6 solution for days, compound
1 was observed by
1H-NMR to slowly convert to compound
2 (1:2.5 mixture of
1 and
2, following 48 h). Diabatic photoisomerization processes are known to yield a photostationary state containing a mixture of
Z and
E isomers [
19,
20]. Although rarely discussed, for numerous olefins the
Z isomer has been reported to be stabilized by hydrophobic forces over the corresponding
E isomer [
21,
22]. Photoisomerization of
E-enonones, yielding a mixture of
Z and
E isomers, similar to our observation, has been previously reported [
23]. Consequently, we cannot rule out that
2 may have been enriched, or formed, due to a light-induced isomerization during the extraction and separation process. A similar phenomenon has been observed for the retrochalconoids preacansone A and methyltepanone isolated from
Tephrosia pumila [
9] and
Ellipeia cuneijblia [
18], respectively.
Compound
3 was isolated as a yellow paste, and assigned the molecular formula C
24H
28O
7 based on HRESIMS ([M + H]
+ obs
m/
z 429.1905, calcd 429.1908) and NMR analyses (
Table 2). It showed UV absorption at λ
max 225 and 334 nm, which along with its NMR data suggested it to be a chalconoid derivative as well. The high similarity of its NMR spectra with those of praecansone B (
7) [
8] suggested
3 to be a β-hydroxychalcone. Its H-α, olefinic proton (δ
H 6.57) showed a HMBC correlation with C-1 (δ
C 135.0), C-1′ (δ
C 114.6), C-9 (δ
C 188.1). Based on the arguments described for
1 above, ring A of
3 was assumed to be unsubstituted. Its ring B was substituted with two methoxy groups at C-2′ (δ
H 3.87, δ
C 62.6) and C-6′ (δ
H 3.82, δ
C 55.9), as revealed by the HMBC correlations of H-5′ (δ
H 6.27) of this ring with C-1′ (114.6), C-3′ (107.2), C-4′ (155.8), C-6′ (158.7) and the NOE observed between H-5′ (δ
H 6.27) and MeO-6′ (δ
H 3.82) (
Figure S20,
Supplementary Materials). In contrast to the structurally closely related compound
7 which possesses a 2,2-dimethylchromene ring C, that of
3 is saturated and substituted. Thus, protons H-3′′ and H-4′′ of
3 are not olefinic, but showed
1H-NMR signals at δ
H 3.86 and δ
H 4.40, respectively. The chemical shift of these along with that of the corresponding carbon signals at δ
C 70.3 (C-3′′) and δ
C 72.8 (C-4′′) suggested that both are oxygenated. Whereas C-3′′ (δ
C 70.3) was substituted with a hydroxy group, C-4′′ (δ
C 72.8) bears an ethoxy functionality (δ
H 3.75, 2H, q; δ
C 64.9; δ
H 1.24, 3H, t; δ
C 15.3). The placement of the ethoxy group at C-4′′ was based on the HMBC correlation of its oxymethylene protons (δ
H 3.75) with C-4′′ (δ
C 155.8) and that of H-4′′ (δ
H 4.40) with C-2′ (δ
C 160.2). The
gauche coupling (
J = 2.8 Hz) of H-3′′ (δ
H 3.86) and H-4′′ (δ
H 4.40) revealed their
cis configuration. Ethoxy substitution is unusual among natural products, yet
3 is not the first to possess a 4′′-ethoxy-3′′-hydroxydihydropyran ring [
24]. On the basis of the above spectroscopic data, and by comparison with that of praecansone B (
7), compound
3 was characterized as 3′′,4′′-
cis-4′′-ethoxy-3′′-hydroxypraecansone B and given the trivial name aequichalcone C.
Compound
4 was isolated as an amorphous solid, and assigned the molecular formula C
17H
10O
6 based on HRESIMS ([M + H]
+ m/
z obs 310.0512, calcd 310.0472) and NMR (
Table 3) analyses.
It showed characteristic UV (λ
max 225, 337 and 353 nm),
1H-NMR (δ
H 5.54, s, CH
2-6) and
13C-NMR (δ
C 65.8, CH
2-6; δ
C 119.0, C-6a; δ
C 147.0, C-11a) features for a pterocarpene skeleton [
25,
26]. The NMR spectra indicated the presence of two methylenedioxide groups (δ
H 5.97, δ
C 101.8 and δ
H 6.00, δ
C 101.7), connected at the bridging C-3 and C-4, and C-8 and C-9 of the pterocarpene skeleton, as revealed by the HMBC correlations of 3,4-OCH
2O- (δ
H 6.00) to C-3 (δ
C 149.5) and C-4 (δ
C 134.5) and 8,9-OCH
2O- (δ
H 5.97) to C-8 (δ
C 144.1) and C-9 (δ
C 146.1). Moreover, the two
ortho-coupled (
J = 8.0 Hz) aromatic protons at δ
H 6.98 and δ
H 6.50, and the two
para-oriented aromatic protons at δ
H 7.02 and δ
H 6.76 indicated that rings A and D were disubstituted. The substitution pattern of ring A was determined based on the HMBC correlation of H-1 (δ
H 6.98) with C-11a (δ
C 147.0) and the oxygenated C-3 (δ
C 149.5) along with the
ortho-coupling of H-1 (δ
H 6.98) and H-2 (δ
H 6.50), which is consistent with the HMBC-based placement (
vide supra) of the methylenedioxide group at C-3 (δ
C 149.5) and C-4 (δ
C 134.5). The
para-orientation of the aromatic protons H-7 (δ
H 7.02) and H-10 (δ
H 6.76) of ring D is consistent with the second methylenedioxide group being placed at C-8 (δ
C 144.9) and C-9 (δ
C 146.1). Assignation of the carbons of rings B and C was based on the HMBC correlations of H-1 (δ
H 6.98), H-6 (δ
H 5.54), H-7 (δ
H 7.02) and H-10 (δ
H 6.76) (
Table 3). On the basis of the above spectroscopic evidence, this new compound (
4) was characterized as 3,4:8,9-dimethyl-enedioxypterocarpene.
The crude CH
2Cl
2/CH
3OH (1:1) extract of the roots of
Tephrosia aequilata resulted in 100% growth inhibition of the chloroquine-sensitive (3D7) strain of
Plasmodium falciparum at 10 µg/mL. The compounds isolated from this extract were also tested for antiplasmodial activity using a previously established protocol [
27,
28]. Compound
3 showed good (IC
50 < 5 µM), while all other compounds showed moderate (IC
50 6–9 µM) [
29] antiplasmodial activities (
Table 4). These activities are in the same range of those reported for licochalcone A (IC
50 4.17 µM [
29] against the 3D7 strain), a retrochalcone which is also known for its in vivo antimalarial activity and for enhancing the activity of artemisinin in vitro [
29]. It is therefore of value to investigate the chalconoids of this plant for similar activities. None of the compounds showed cytotoxicity against the HEK-293 human embryonic kidney cell line, up to a concentration of 40 µM, showing that the observed antiplasmodial activities are not due to general toxicity.
3. Materials and Methods
3.1. General Experimental Procedures
UV spectra were recorded on a Specord S600 (Analytik Jena AG, Jena, Germany) spectrophotometer, optical rotations were measured on PerkinElmer 341-LC (PerkinElmer, Wellesley, MA, USA) whereas CD experiments were run on a Jasco J-715 spectropolarimeter (Jasco, Corp., Tokyo, Japan). NMR spectra were acquired on Bruker Advance 600 or a Bruker Advance III HD 800 spectrometer (Bruker BioSpin AG, Fällanden, Switzerland), using the residual solvent signal as reference. EI-MS spectra were obtained on a Micromass GC-TOF mass spectrometer (Micromass, Wythenshawe, Waters Inc., Manchester, UK), using direct inlet, and 70 eV ionization voltage. TLC was carried out on Merck pre-coated Silica gel 60 F254 plates (Merck, Darmstadt, Germany). Column chromatography was run on silica gel 60 (70–230 mesh). Gel filtration was done on Sephadex LH-20 (Fluka, Buchs, Switzerland). Preparative HPLC was carried out on a Waters 600E instrument (Waters Corp, Milford, MA, USA) using the Chromulan (Pikron Ltd., Praha, Czech Republic) software and an RP C8 Kromasil® (250 mm × 55 mm, Kromasil, Bohus, Sweden) column with a CH3OH/H2O solvent system. HRESIMS were obtained with a Q-TOF-LC/MS spectrometer (Stenhagen Analyslab AB, Gothenburg, Sweden) using a 2.1 mm × 30 mm, 1.7 μm RPC18 column and a H2O:CH3CN gradient system (5:95−95:5 gradient and 0.2% formic acid).
3.2. Plant Material
The roots of Tephrosia aequilata were collected in May, 2013 from the Kilungu hills in Makueni County, Kenya. The plant specimen was identified by Mr. Patrick C. Mutiso of the University Herbarium, School Biological Sciences, University of Nairobi where voucher specimen (Mutiso-841/May 2013) has been deposited.
3.3. Extraction and Isolation
The air dried and ground roots of
Tephrosia aequilata (2 kg) were extracted with CH
2Cl
2/MeOH, 1:1 (5 × 1.5 L) by percolation. The extract was filtered and the solvent removed under vacuum using a rotary evaporator at 50 °C to yield 120 g dark brown paste. The extract was diluted with methanol and extracted with
n-hexane to remove the fat. The methanol layer (80 g) was subjected to column chromatography on Silica gel (600 g) eluting with
n-hexane containing increasing percentages of EtOAc. The fraction eluted with 1% EtOAc in
n-hexane was washed with acetone to yield 3,4:8,9-dimethylenedioxypterocarpene (
4, 100 mg) as colorless solid. The acetone soluble portion was subjected to column chromatography on Sephadex LH-20 (CH
2Cl
2/CH
3OH, 1:1) to yield obovatin methyl ether (
5, 5 mg) [
7]. The fraction eluted with 3% EtOAc in
n-hexane was further subjected to column chromatography on a silica gel (120 g) to yield obovatachalcone (
6, 20 mg), praecansone B (
7, 900 mg) and
Z-praecansone A (
8, 100 mg) [
1,
7,
30,
31]. The fractions eluted with 5%–7% EtOAc in
n-hexane were combined and purified on preparative HPLC (CH
3OH/H
2O, gradient elution) to give aequichalcone B (
2, 20 mg) and aequichalcone A (
1, 25 mg). The fraction eluted with 7% EtOAc was purified over Sephadex LH-20 (CH
2Cl
2/CH
3OH, 1:1) and was further purified by PTLC (5% EtOAc in
n-hexane) to give aequichalcone C (
3, 15 mg). The fraction eluted with 10% EtOAc was purified by PTLC (7% EtOAc in
n-hexane) to give candidone (
9, 10 mg) [
2]. The fractions eluted with 15%–20% EtOAc in
n-hexane were combined and subjected to column chromatography over Sephadex LH-20 (CH
2Cl
2/CH
3OH, 1:1) to give isopongaflavone (
10, 1.2 g) [
10,
11]. The fraction eluted with EtOAc:MeOH (1:1) was crystallized from MeOH to yield β-sitosterol-3-
O-glucoside (
11, 50 mg) [
29].
The negative optical rotation of compounds
5 and
8, [α]
D −16.35 (c 0.001, CH
2Cl
2) and −21.5 (c 0.001, CH
2Cl
2), respectively, is in good agreement with that previously published for the
S-configuration of these compounds [
6].
E-2′,6′-Dimethoxy-3′,4′-(2′′
,2′′
-dimethyl)pyranoretrochalcone (
1): Yellow paste. UV (CH
2Cl
2) λ
max: 240, 290 and 370 nm.
1H- and
13C-NMR (
Table 1). ESIMS
m/
z 351.7 [M + H]
+. HRMS [M]
+ m/
z 350.1506 C
22H
22O
4 (Calculated: 350.1518).
Z-2′,6′-Dimethoxy-3′,4′-(2′′
,2′′
-dimethyl)pyranoretrochalcone (
2): Colorless paste. UV (CH
2Cl
2) λ
max: 245 nm.
1H- and
13C-NMR (
Table 1). EIMS
m/
z (rel. int.) 397 [M]
+ (100), 325 (23), 383 (20), 297 (15). HRMS [M]
+ m/
z 351.1586 C
22H
22O
4 (Calculated: 351.1596).
3′′
,4′′
-cis-4′′
-Ethoxy-3′′
-hydroxypraecansone B (
3): Yellowish oil. UV (CH
2Cl
2) λ
max: 225, 334 nm. CD (CH
2Cl
2) λ nm (Δε; M
−1 cm
−1): (−3.7)
403; (0.9)
297; (2.4)
209. [α]
D −18.87° (
c 0.001, CH
2Cl
2).
1H- and
13C-NMR (
Table 2) EIMS
m/
z (rel. int.) 397 [M]
+ (100), 325 (23), 383 (20), 297 (15). HRMS [M]
+ m/
z 429.1905 C
24H
28O
7 (Calculated: 429.1913).
3,4:8,9-Dimethylenedioxypterocarpene (
4): Colorless crystal. M.p. 198–200 °C; UV (CH
2Cl
2) λ
max: 225, 337, 353 nm.
1H- and
13C-NMR (
Table 3) EIMS
m/
z (rel. int.) 397 [M]
+ (100), 325 (23), 383 (20), 297 (15). HRMS [M]
+ m/
z 310.0512 C
17H
10O
6 (calculated: 310.0477).
3.4. Plasmodium Falciparum Culture
In vitro parasite culture of the P. falciparum (strain 3D7) was maintained in RPMI with 10 mM Hepes (Life Technologies, Nærum, Denmark), 50 μg/mL hypoxanthine (Sigma, Saint Louis, MO, USA) and 5% human serum from male AB plasma and 2.5 mg/mL AlbuMAX II® (Life Technologies, Paisley, UK). Human 0+ erythrocytes were provided bythe Australian Red Cross Blood Bank (Agreement No: 13-04QLD-09). The parasites were maintained at 2%–8% parasitaemia (% P) at 5% haematocrit (% H), and incubated at 37 °C, 5% CO2, 5% O2, 90% N2 and 95% humidity.
3.5. Plasmodium falciparum Growth Inhibition Assay
A well-established asexual
P. falciparum imaging assay was used to determine parasite growth inhibition according to the procedure described by Duffy and Avery [
28]. Briefly, 2% or 3% parasite (3D7) and 0.3% hematocrit in a total assay volume of 50 μL were incubated in the presence of compounds for 72 h at 37 °C and 5% CO
2, in poly-
d-lysine-coated Cell Carrier Imaging plates. After incubation, plates were stained with DAPI (6,4′-diamidino-2-phenylindole) in the presence of saponin and Triton X-100, and incubated in the dark for a further 5 h at room temperature before imaging on the OPERA HTS confocal imaging system (PerkinElmer, Waltham, MA, USA). The digital images obtained were analyzed using the PerkinElmer Acapella spot detection software (version 2.0, PerkinElmer). We counted the spots in fulfilling the criteria established for a stained parasite. The % inhibition of parasite replication was calculated, using DMSO and artemisinin as control data.
Human red blood cells for plasmodium culture were provided by the Australian Red Cross Blood Bank in accordance with their routine MTA for nonclinical blood product supply. All work undertaken is covered by the approval from the Griffith University Biosafety and Human Ethics Committee, GU ref no. ESK/03/12/HREC.
3.6. Cytotoxicity Assays
The cytotoxicity of compounds against HEK-293 cells was assessed in dose response using a resazurin-based viability assay. HEK-293 cells were grown in DMEM medium (Life Technologies), containing 10% fetal calf serum (FCS; Gibco), trypsinised, counted and seeded at 2000 cells per well in 45 μL media into TC-treated 384-well plates (Greiner) and left to adhere overnight at 37 °C, 5% CO2 and 95% humidity. Test compounds were prepared by diluting 1 in 25 in sterile water and then another 1 in 10 dilution, to give a top final test concentration of 40 μM, 0.4% DMSO. Plates were incubated for 72 h at 37 °C, 5% CO2 and 95% humidity, the media was removed and replaced by 35 μL of 44 μM resazurin in DMEM without FCS. The plates were incubated for another 4–6 h at 37 °C, 5% CO2 and 95% humidity, before reading on an EnVision® Plate Reader (PerkinElmer) using fluorescence excitation/emission settings of 530 nm/595 nm. The % growth was standardized to controls (40 μM puromycin as positive and 0.4% DMSO as negative control) using the software Microsoft® Excel 2013. Statistical analysis, including IC50 determination and graphical output, was done in GraphPad Prism® 6 (GraphPad Software, San Diego, CA, USA) using nonlinear regression variable slope curve fitting. The experiments were carried out in two independent biological replicates, each consisting of two technical replicates.


 ,
, 

