1. Introduction
Near-infrared (NIR) spectroscopy (12,500–4000 cm
−1) has been used in combination with chemometric methods in the pharmaceutical industry to rapidly identify specific active pharmaceutical ingredients (APIs) [
1,
2,
3,
4] with minimal sample preparation, fast analysis time and environmentally friendliness. For example, Feng and Hu [
1] used NIR reflectance spectroscopy to develop a new method for determining the API contents of roxithromycin and erythromycin ethyl succinate tablets from different manufacturers in China. The quantitative partial least squares (PLS) models described in these studies were highly robust and exhibited good specificity, linearity, accuracy and precision properties, demonstrating the feasibility of these models for the rapid analysis of pharmaceutical products from different manufacturers. Ito et al. [
2] used NIR transmittance spectroscopy to analyze acetaminophen and caffeine anhydrate in intact bilayer tablets with an appropriate fluctuation range for the thickness of the tablets. Furthermore, the calibration models produced in this particular study exhibited good linearity and accuracy characteristics with a fluctuation range of 4.30 ± 0.06 mm. Farrell et al. [
3] employed NIR to detect the API contents of different types of escitalopram tablets using model updating. Notably, the predicted results of the primary models correlated well with the results of a full calibration model formed under secondary conditions after they had been updated using a Tikhonov regularization. Wu et al. [
4] used on-line NIR spectroscopy to monitor the extraction of
Lonicera japonica and demonstrated that NIR technology may be used to detect trace amounts of chlorogenic acid in
Lonicera japonica.
Gas chromatography (GC) has been used as a reference method to determine the volatile components of oils [
5,
6,
7]. Volatile oils are the main active pharmaceutical ingredients in several Chinese medicines, including
Blumea balsamifera (
Ai-na-xiang),
Mentha haplocalyx (
Bo-he), and
Rhizoma Chuanxiong (
Chuan-xiong). Although GC is a highly sensitive analytical method, it generally requires additional steps for the processing of the samples, making it a time-consuming method. NIR spectroscopy has also been used for the qualitative analysis of different samples, including distinguishing their geographical origin [
8,
9,
10,
11]. Li et al. [
8] reported that NIR spectroscopy may not only be used to quantitatively determine the active components of a specific material but that it may also be used to determine the geographical origin of Flos
Lonicerae japonicae with prediction accuracies of 100% and 86.8% for two provinces in China. Bevilacqua et al. [
9] used NIR spectroscopy coupled to chemometric classification methods as a tool for traceability of olive oil samples with designated origin. The result showed that after processing the spectroscopic data by partial least squares discriminant analysis (PLS-DA) evidenced a rather high classification accuracy than modeling (SIMCA) approach.
B. balsamifera (
Ai-na-xiang) has been used in Chinese medicine for centuries to treat a variety of different ailments, including pain and diaphoresis, as well as being used to expel wind and remove dampness [
12].
B. balsamifera is also used as an important medicinal plant source of natural borneol (
l-borneol content above 85%). The process used to purify borneol flakes also results in the formation of Blumea oil, which is widely used in the pharmaceutical, cosmetic and fine chemical industries [
13,
14].
The APIs of
B. balsamifera are volatile oils and flavonoids, such as
l-borneol, quercetin and blumeatin [
15], all of which have traditionally been determined by GC and ultraviolet-visible (UV-VIS) spectrophotometry [
16]. However, there are currently no quality control methods available for the rapid analysis of
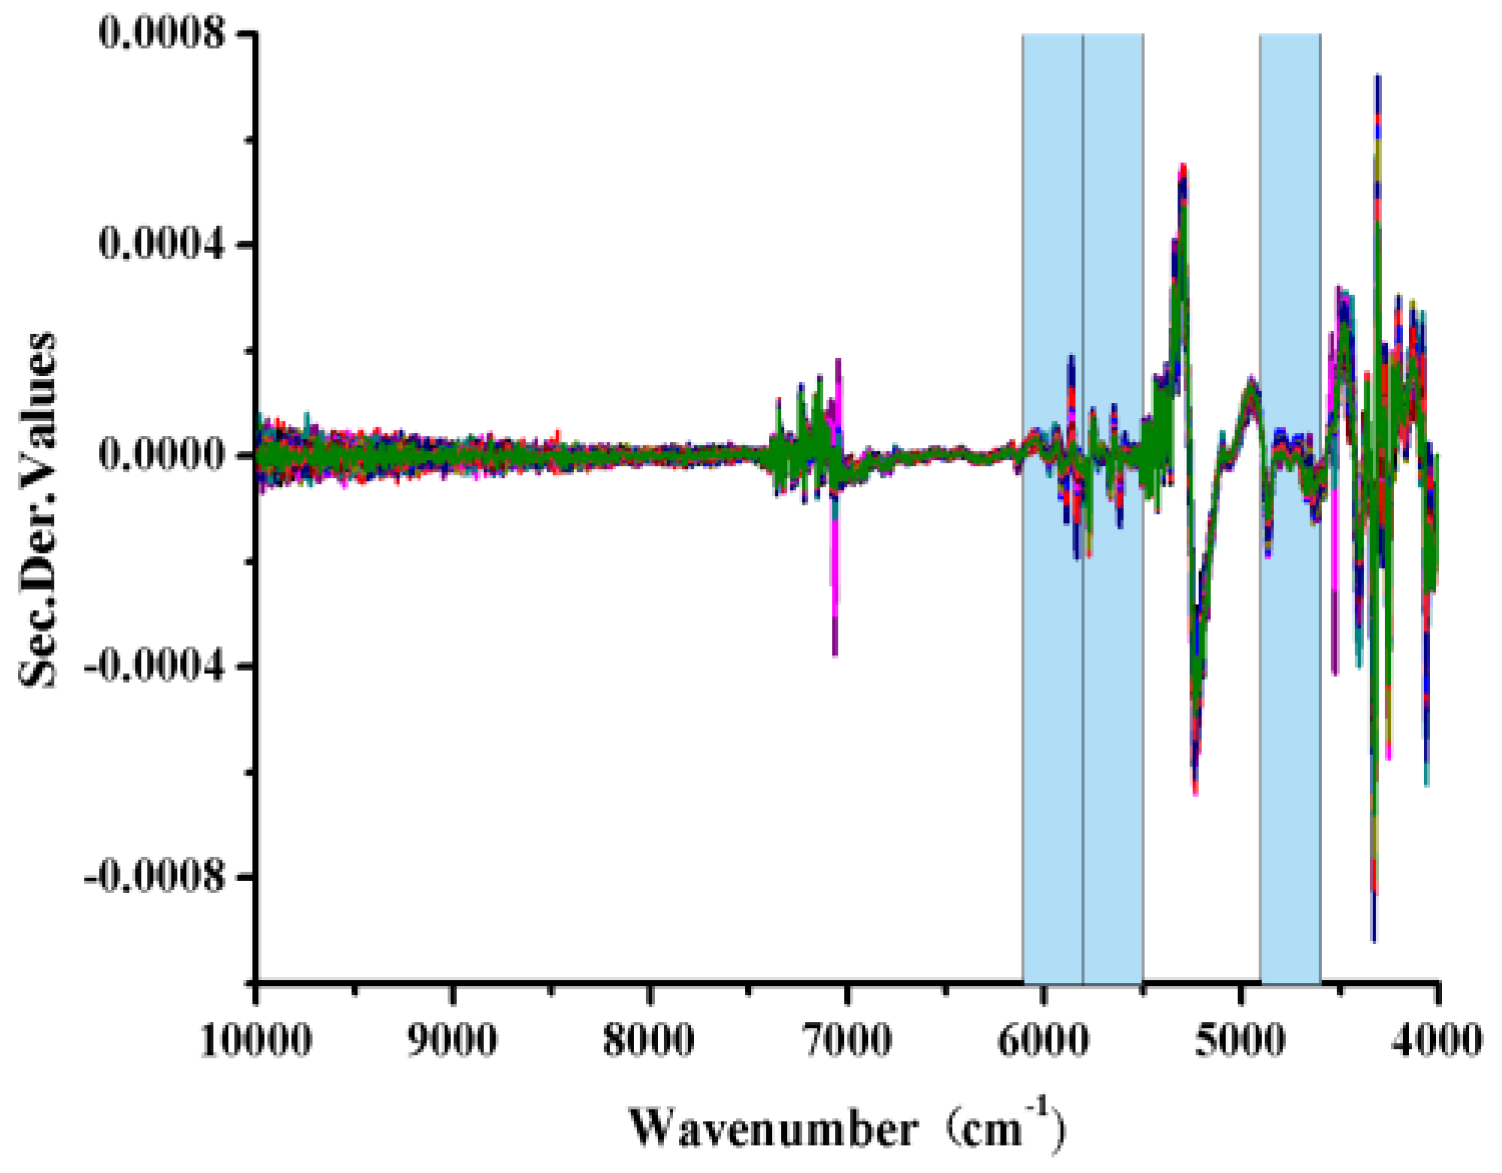
B. balsamifera. A synergy interval partial least-squares (SiPLS) algorithm has been used to select specific wavelength regions to improve the robustness of different calibration models. For example, Wu et al. [
17] reported the use of a SiPLS method to select variables for monitoring the amino acid concentration profile obtained during the hydrolysis of
Cornu bubali. The results of this study demonstrated that SiPLS is effective for selecting specific variables and that SiPLS models can provide high levels of accuracy.
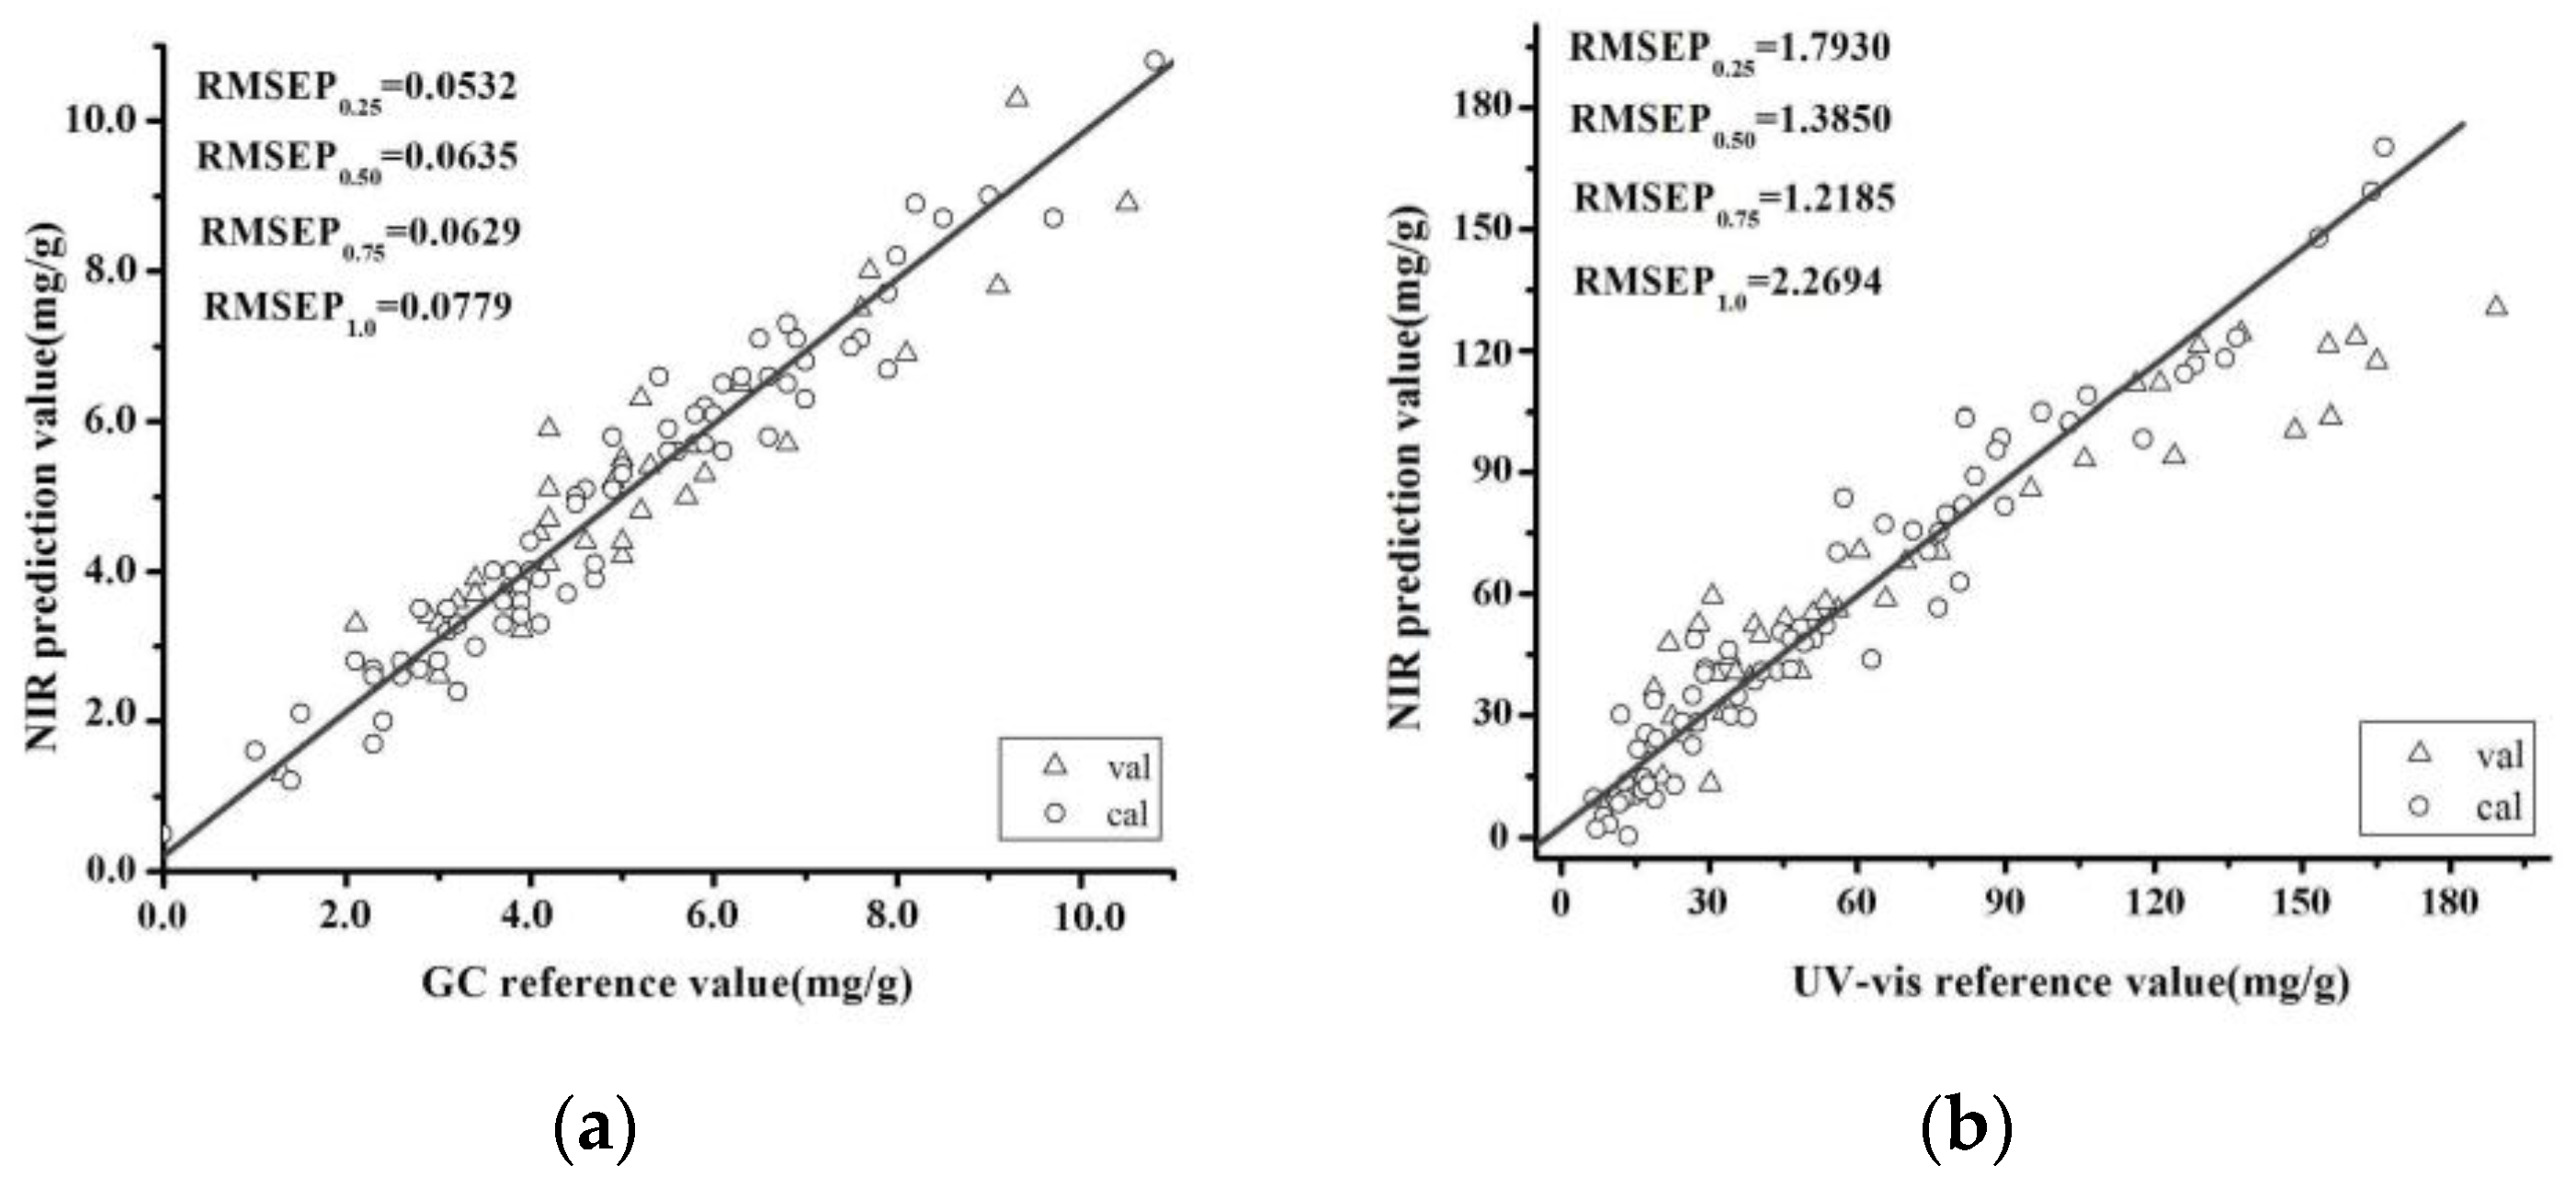
The aim of the study was to establish qualitative and quantitative methods based on NIR spectroscopy to identify the geographical origin of B. balsamifera samples and quantitatively determine the APIs of these materials. In this paper, we collected 109 samples from three of the main producing areas of China, including 31 samples from the Guizhou Province, 77 samples from the Hainan province and one sample from Guangxi Province. We then used a partial least squares (PLS) model together with wavelength regions selected by SiPLS to determine the critical quality parameters of B. balsamifera, l-borneol and the total flavones. The reference values of the critical quality parameters were measured by GC and UV-VIS spectrophotometry. The performance characteristics of this new model were assessed by chemometrics indicators to prove the reliable analysis of NIR technique B. balsamifera powder. PLS-DA was used to differentiate the different B. balsamifera samples based on their geographical origin. The prediction accuracy rate was used to assess the feasibility of the method.
3. Materials and Methods
3.1. Plant Samples
The
B. balsamifera samples used in this study (
Table 6) were provided by the Tropical Crops Genetic Resources Institute, Chinese Academy of Tropical Agricultural Sciences (Danzhou, China). These materials were collected from different geographical regions of China, and were identified by Prof. Yu-xin Pang, according to their morphological characteristics and related documents [
19,
20]. Voucher specimens of these plants were also deposited at the Hainan Provincial Engineering Research Center for
Blumea balsamifera, Danzhou, China.
3.2. Chemical Reagents
Standard samples of l-borneol and rutin were purchased from the National Institute for the Control of Pharmaceutical and Biological Products (Beijing, China). Methyl salicylate was supplied by the Tianjin Guangfu Fine Chemical Engineering Institute (Tianjin, China). Ethyl acetate, ethanol, sodium nitrite (NaNO2), aluminum nitrate (Al(NO3)3·9H2O) and sodium hydroxide (NaOH) were purchased from Xilong Chemical Corporation (Shantou, Guangdong, China). All of these reagents were purchased as the analytical grade. Deionized water was purified using a Milli-Q water purification system (Millipore Corp., Bedford, MA, USA).
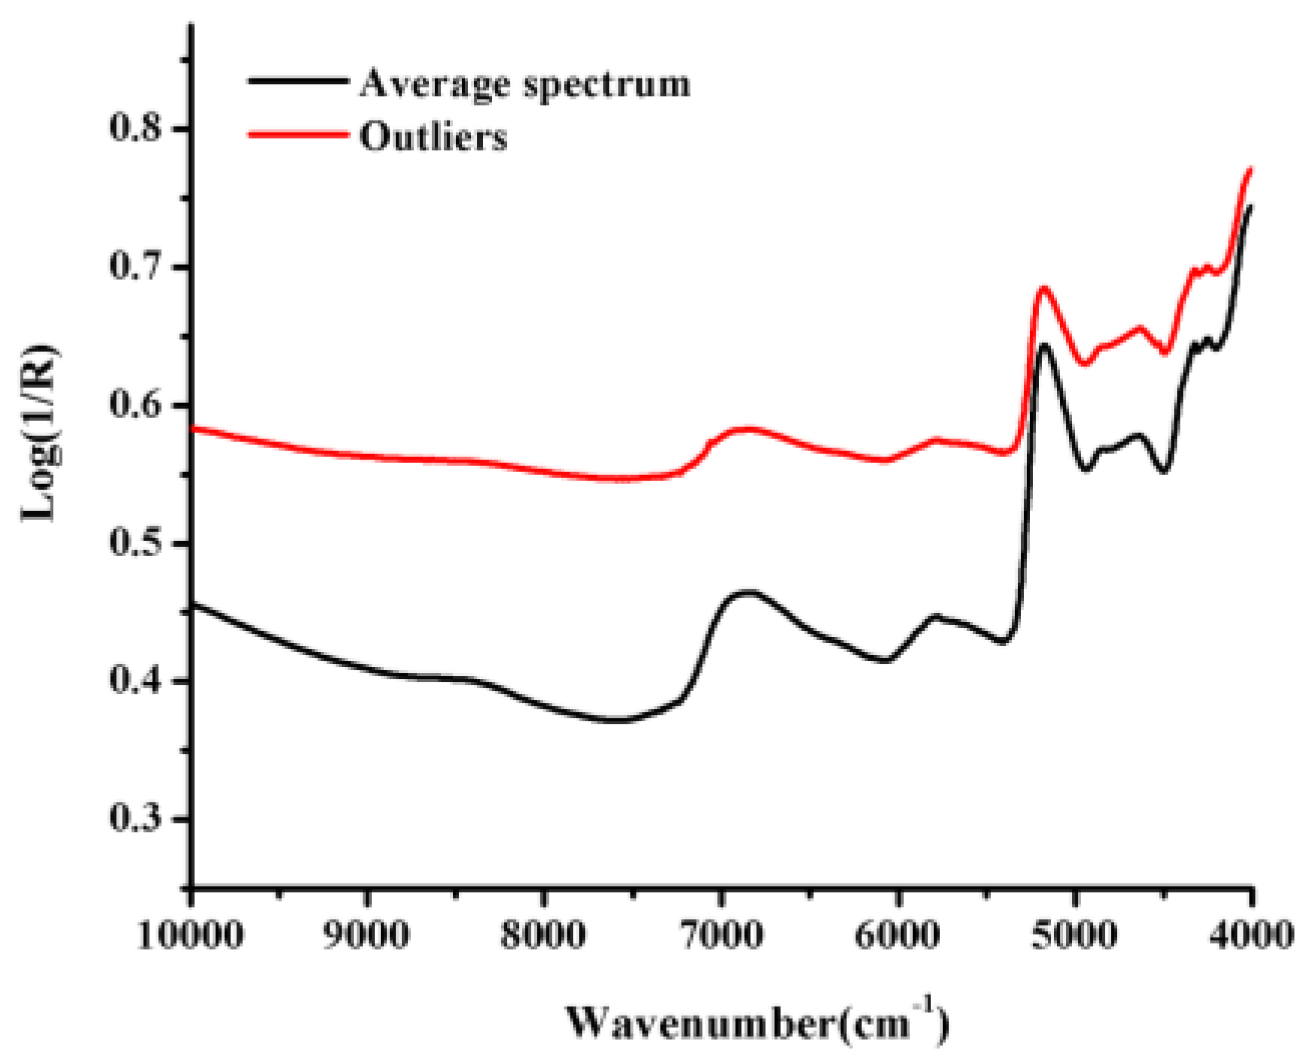
3.3. NIR Measurement and Software
NIR spectra of the powdered plant materials were collected in the integrating sphere diffuse mode using an Antaris Nicolet FT-NIR system (Thermo Fisher Scientific Inc., Waltham, MA, USA). Each spectrum was collected over 64 scans in the range of 10,000 to 4000 cm
−1 at ambient temperature with a resolution of 8 cm
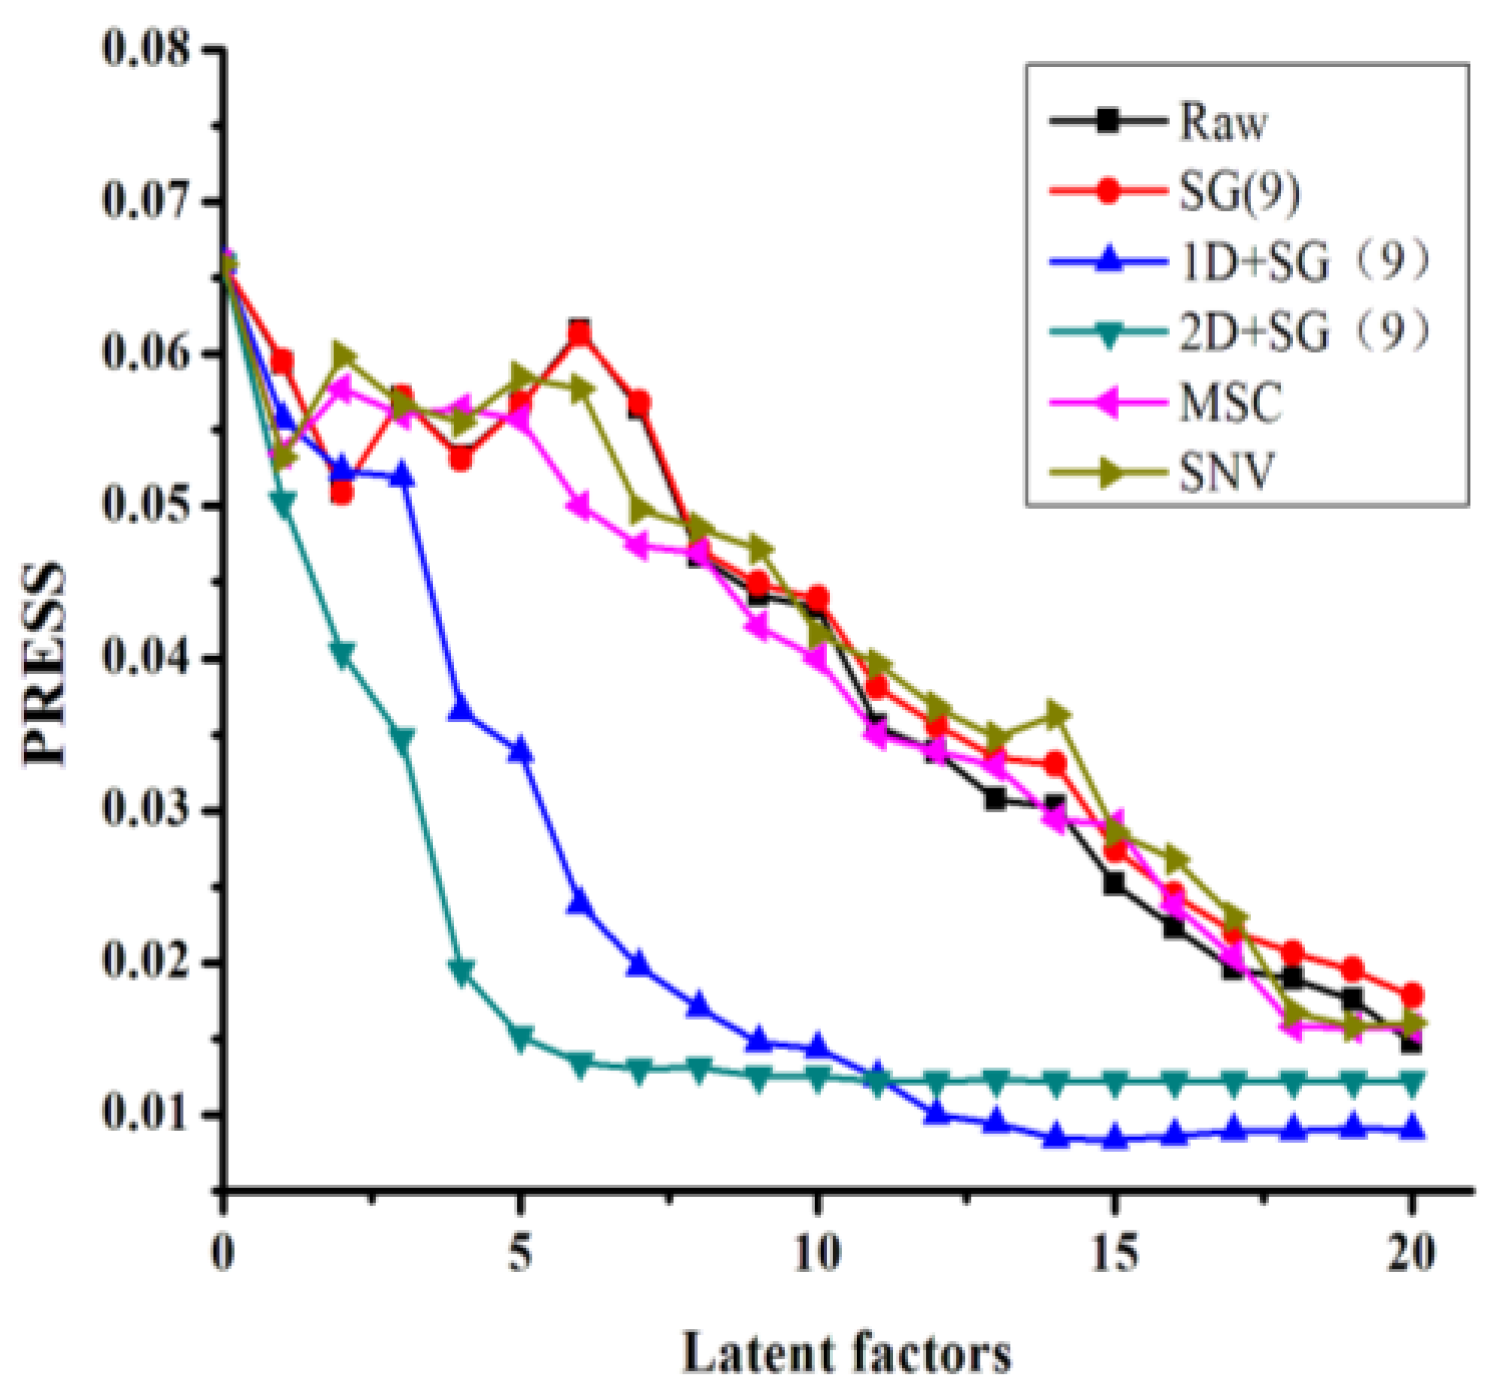
−1. Furthermore, each spectrum was recorded as Log(1/R) using air as a reference. Every sample was scanned once. All of the NIR spectra were collected and archived using the Thermo Scientific Result software. The Kennard–Stone (KS) algorithm was used to split the data sets into calibration and validation sets (2:1). The spectral preprocessing and model calculation steps were performed using the Unscrambler 9.7 software package (CAMO software AS, Oslo, Norway). The SiPLS algorithm toolbox was provided by Munck et al. [
21].
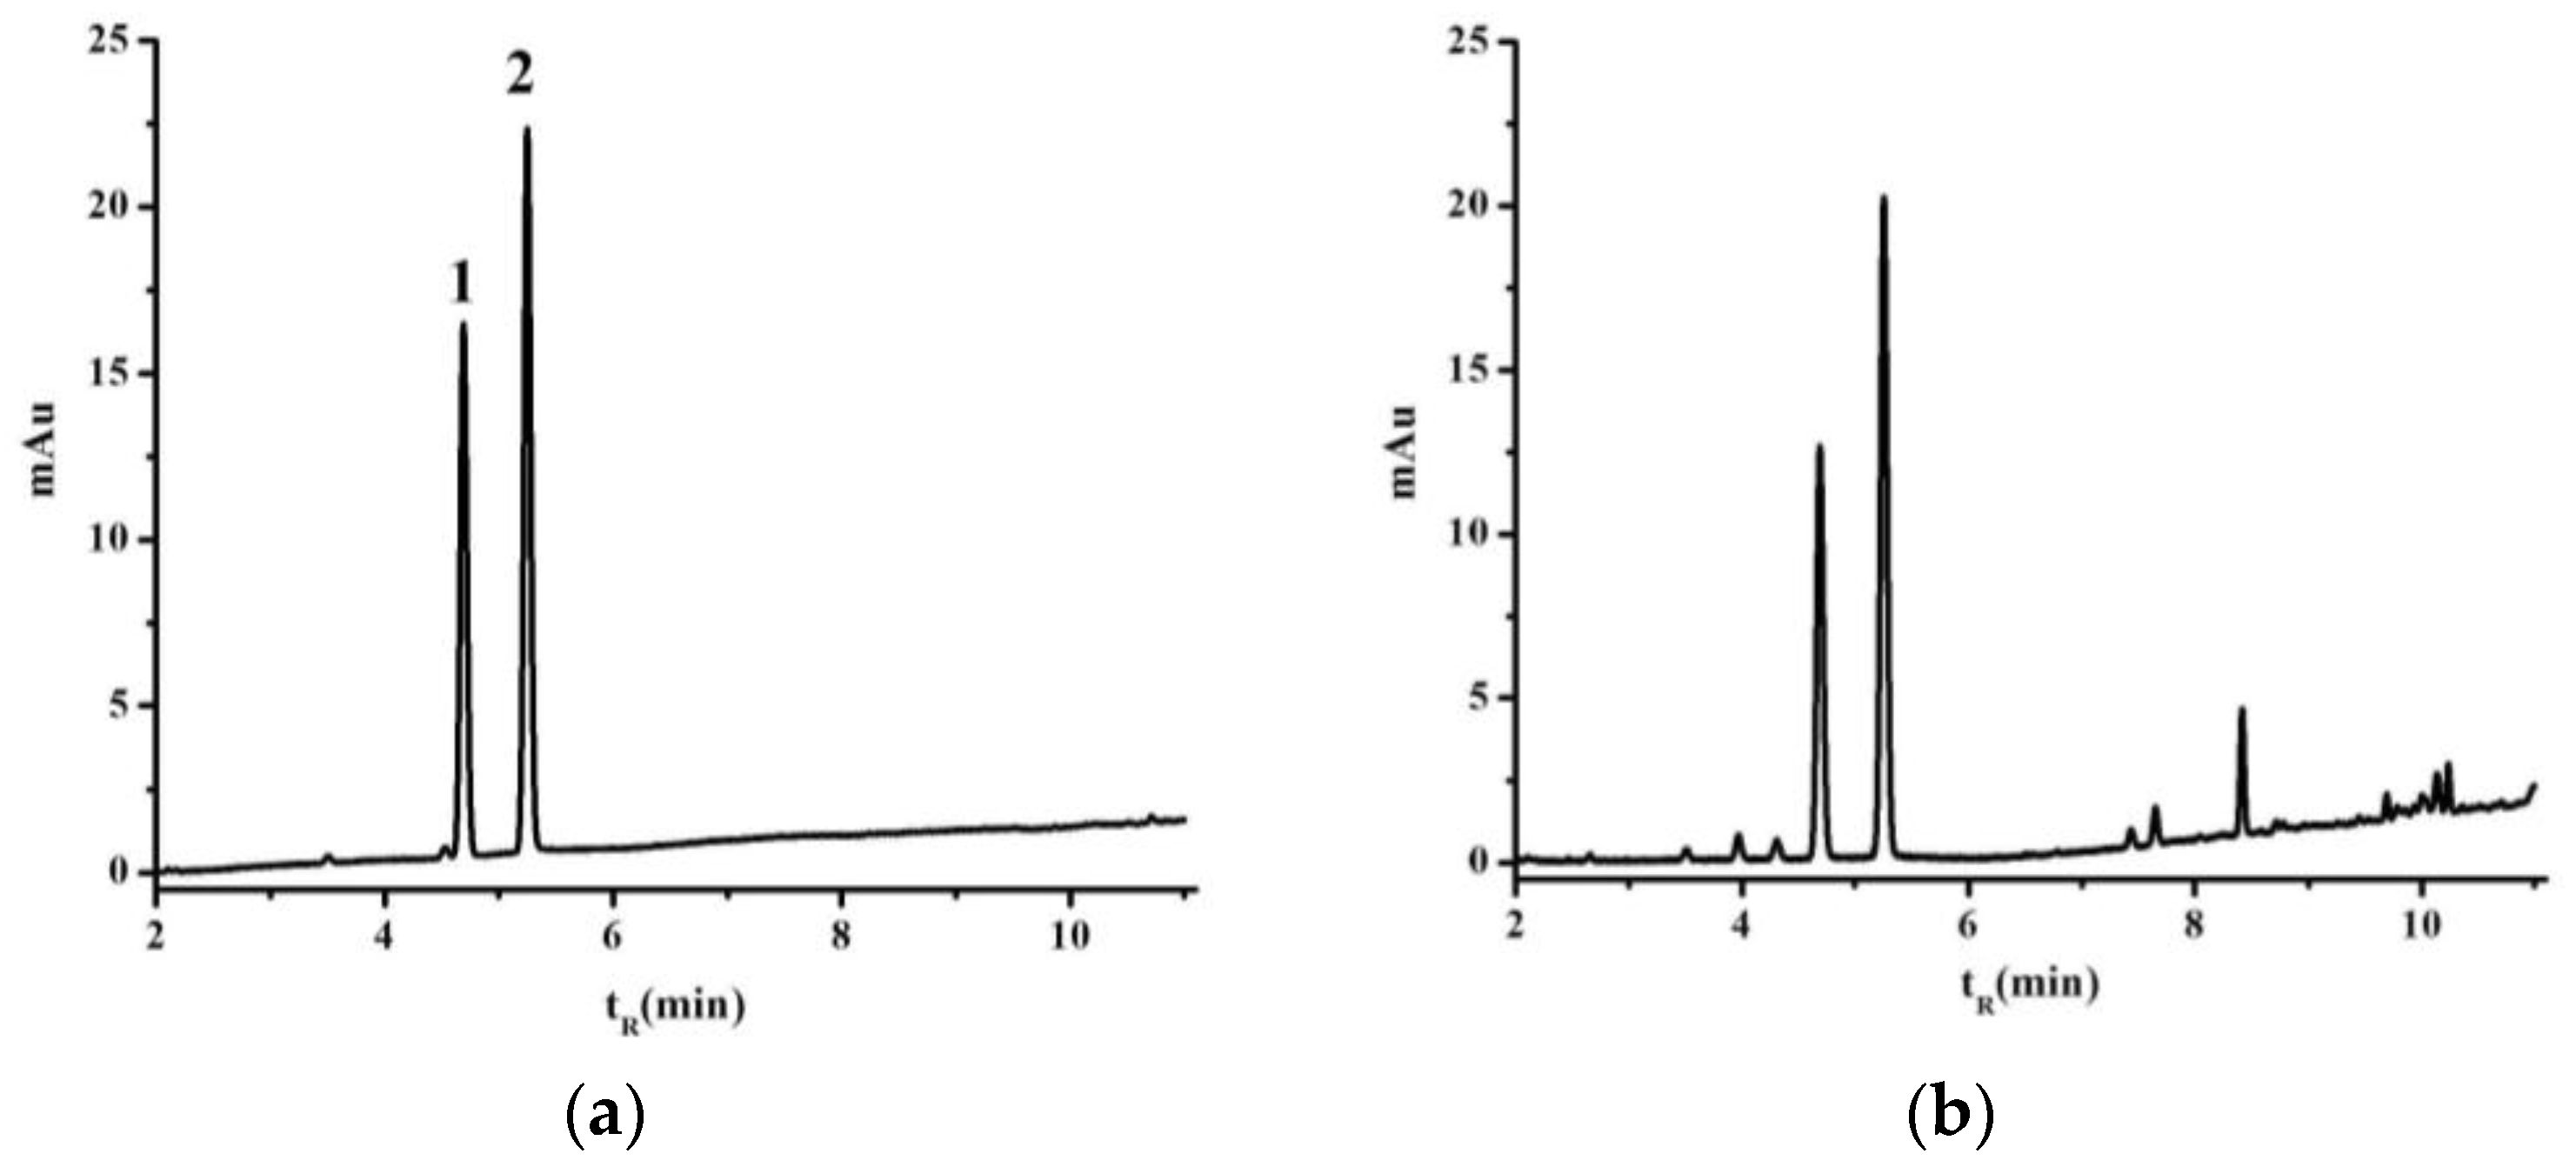
3.4. Determination of the l-borneol Content by GC Analysis
GC analysis was performed after the collection of the NIR spectra. According to the previous method [
16], a small sample (2 g) of the material was extracted with ethyl acetate (25 mL) under ultrasonic irradiation (40 KHz, 400 W, KQ-500DE, Kunshan Ultrasonic Equipment Co., Kunshan, Jiangsu, China) at 30 °C for 30 min. The ethyl acetate extract was then passed through a Millipore filter (0.22 µm, Tianjin Jinteng Laboratory Equipment Co., Tianjin, China) prior to being analyzed by GCs.
The filtered extracts were analyzed on an Agilent 7890A gas chromatograph equipped with a flame ionization detector (FID) and an Agilent G4513A automatic sampler (Agilent Technologies, Santa Clara, CA, USA). A HP-5 quartz capillary column (30 m × 0.32 mm) coated with a 0.25 µm film (5% phenyl methyl siloxane, Agilent) was used to analyze the samples. The column temperature was maintained at 80 °C for 2 min after injection, and then programmed to increase to 100 °C at a rate of 5 °C/min. The column temperature was subsequently increased to 200 °C at a rate of 20 °C/min. The injector and detector temperatures were set at 220 and 240 °C, respectively. The system was operated in the split injector mode with a split ratio of 9:1. Nitrogen was used as a carrier gas with a flow rate of 25 mL/min, and the injection volume was set at 0.6 µL.
The calibration curve was established based on 12 consecutive injections at six different concentrations (i.e., 0.01, 0.02, 0.05, 0.1, 0.15 and 0.20 mg/mL) of l-borneol, and the internal standard methyl salicylate (0.1 mL/mL) is added, respectively. The ratios of peak areas of l-borneol and to that of methyl salicylate are used as dependent variable of regression equation, and with the l-borneol in different concentrations as independent variable. The l-borneol content of samples are expressed as mg of l-borneol/g of leaf powder. The relative standard deviations (RSD) were calculated for the relative peak areas of l-borneol and methyl salicylate to estimate the precision, repeatability and stability characteristics of this newly developed method. The precision of this new method was also evaluated using intraday variation tests based on six replicate injections of the same sample. The repeatability of this new method was analyzed using six replicate samples. The stability characteristics of the sample solutions were evaluated at different time points during a single 24 h period (0, 2, 4, 8, 12, and 24 h). The recovery efficiency was determined by adding measured amounts of an l-borneol standard (5 mg) to an extract of B. balsamifera leaves (1 g) with six replicates.
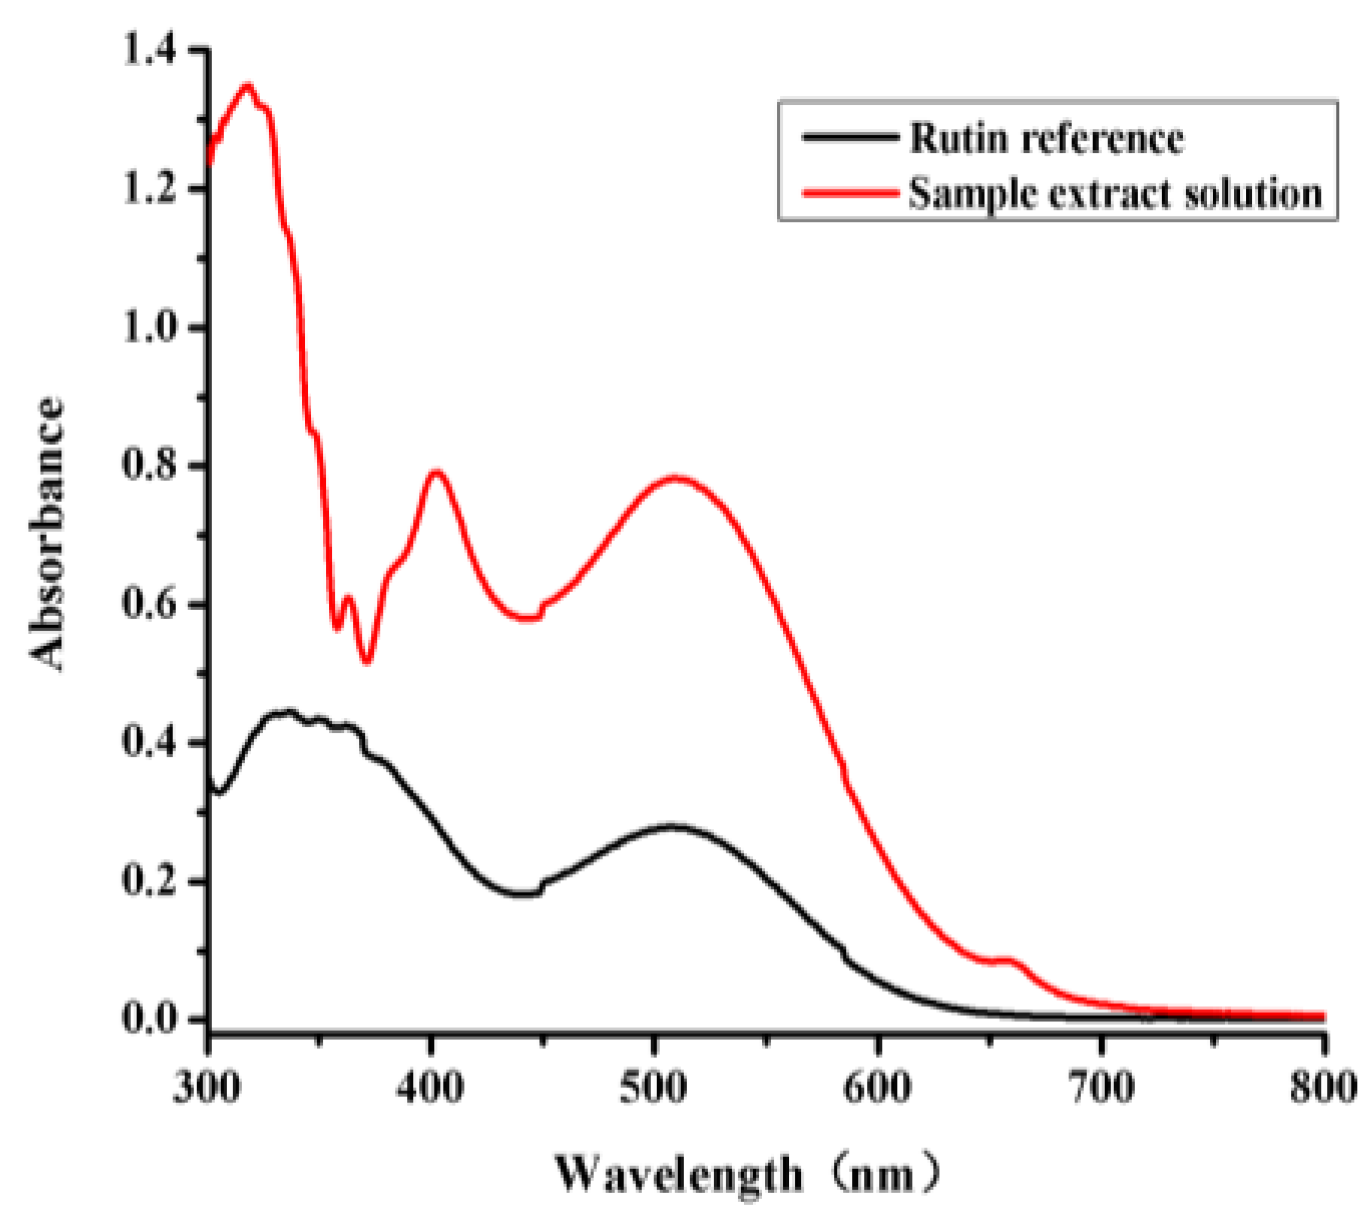
3.5. Determination of Total Flavone Content by UV-VIS Spectrophotometry
According to the previous method [
16], a small sample (0.5 g) of
B. balsamifera was extracted under ultrasonic irradiation (40 KHz, 400 W) into a 75% (
v/
v) solution of ethanol (25 mL) for 40 min. The resulting extract was filtered through a Millipore filter (0.22 µm, Tianjin Jinteng Laboratory Equipment Co.) before being analyzed by UV-VIS spectrophotometry to determine its total flavone content.
Quantification of total flavone was performed by means of UV-VIS spectrophotometry with chromogenic system of NaNO
2–Al(NO3)
3–NaOH [
16,
18]. Briefly, a small sample (0.5 mL) of filtered extract was transferred to a volumetric flask and the material was diluted to a total volume of 10 mL with 75% (
v/
v) ethanol. The solution was then treated with 1 mL of a 5% (
w/
w) aqueous NaNO
2 solution and 1 mL of a 10% (
w/
w) aqueous Al(NO
3)
3 solution, and the resulting mixture was agitated for 5 min. The mixture was then treated with 10 mL of a 4% (
w/
w) aqueous NaOH solution, before being fixed by the addition of 25 mL of 75% (
v/
v) ethanol. The mixture was then held for 15 min, before being analyzed on a UV-VIS spectrophotometer (UNICO2012-PCS, Unico Instruments Co., Ltd., Shanghai, China) at 509 nm. Rutin was used as a standard to prepare a calibration curve. The flavone content was then calculated using a linear equation according to the calibration curve.
The calibration curve of the total flavones was established using six different concentrations rutin (0.01, 0.02, 0.04, 0.06, 0.08, and 0.1 mg/mL) as the standard. The absorbance values of total flavones are used as dependent variable of regression equation, with six different concentrations as independent variable. Total flavonoid content is expressed as mg of rutin equivalents/g of leaf powder. The RSD of the absorbance values for the total flavones were calculated to estimate the precision and repeatability of this method, as well as the stability of the samples. The precision of the UV-VIS method was evaluated based on the results of intraday variation tests using six replicate determinations of the same sample. The repeatability of the UV-VIS method was also analyzed using six replicate samples. The stability of the sample solution was evaluated at different time points within an hour period (0, 10, 20, 30, 40 and 50 min). The recovery efficiency was determined by adding a known amount of a rutin standard (30 mg) to an extract of B. balsamifera leaves (0.25 g) with six replicates.

 ,
, 
