
Polyamine Metabolites Profiling for Characterization of Lung and Liver Cancer Using an LC-Tandem MS Method with Multiple Statistical Data Mining Strategies: Discovering Potential Cancer Biomarkers in Human Plasma and Urine

Abstract
:
1. Introduction
2. Results and Discussion
2.1. Levels of Plasma and Urine Polyamines in Lung and Liver Cancer Patients
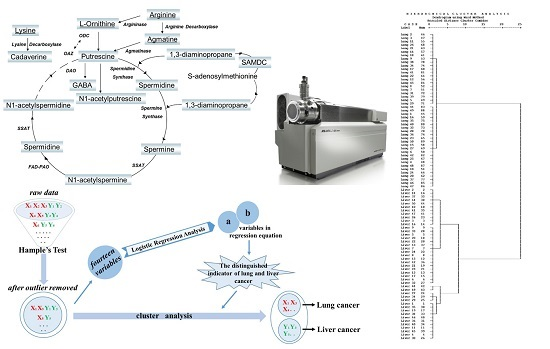
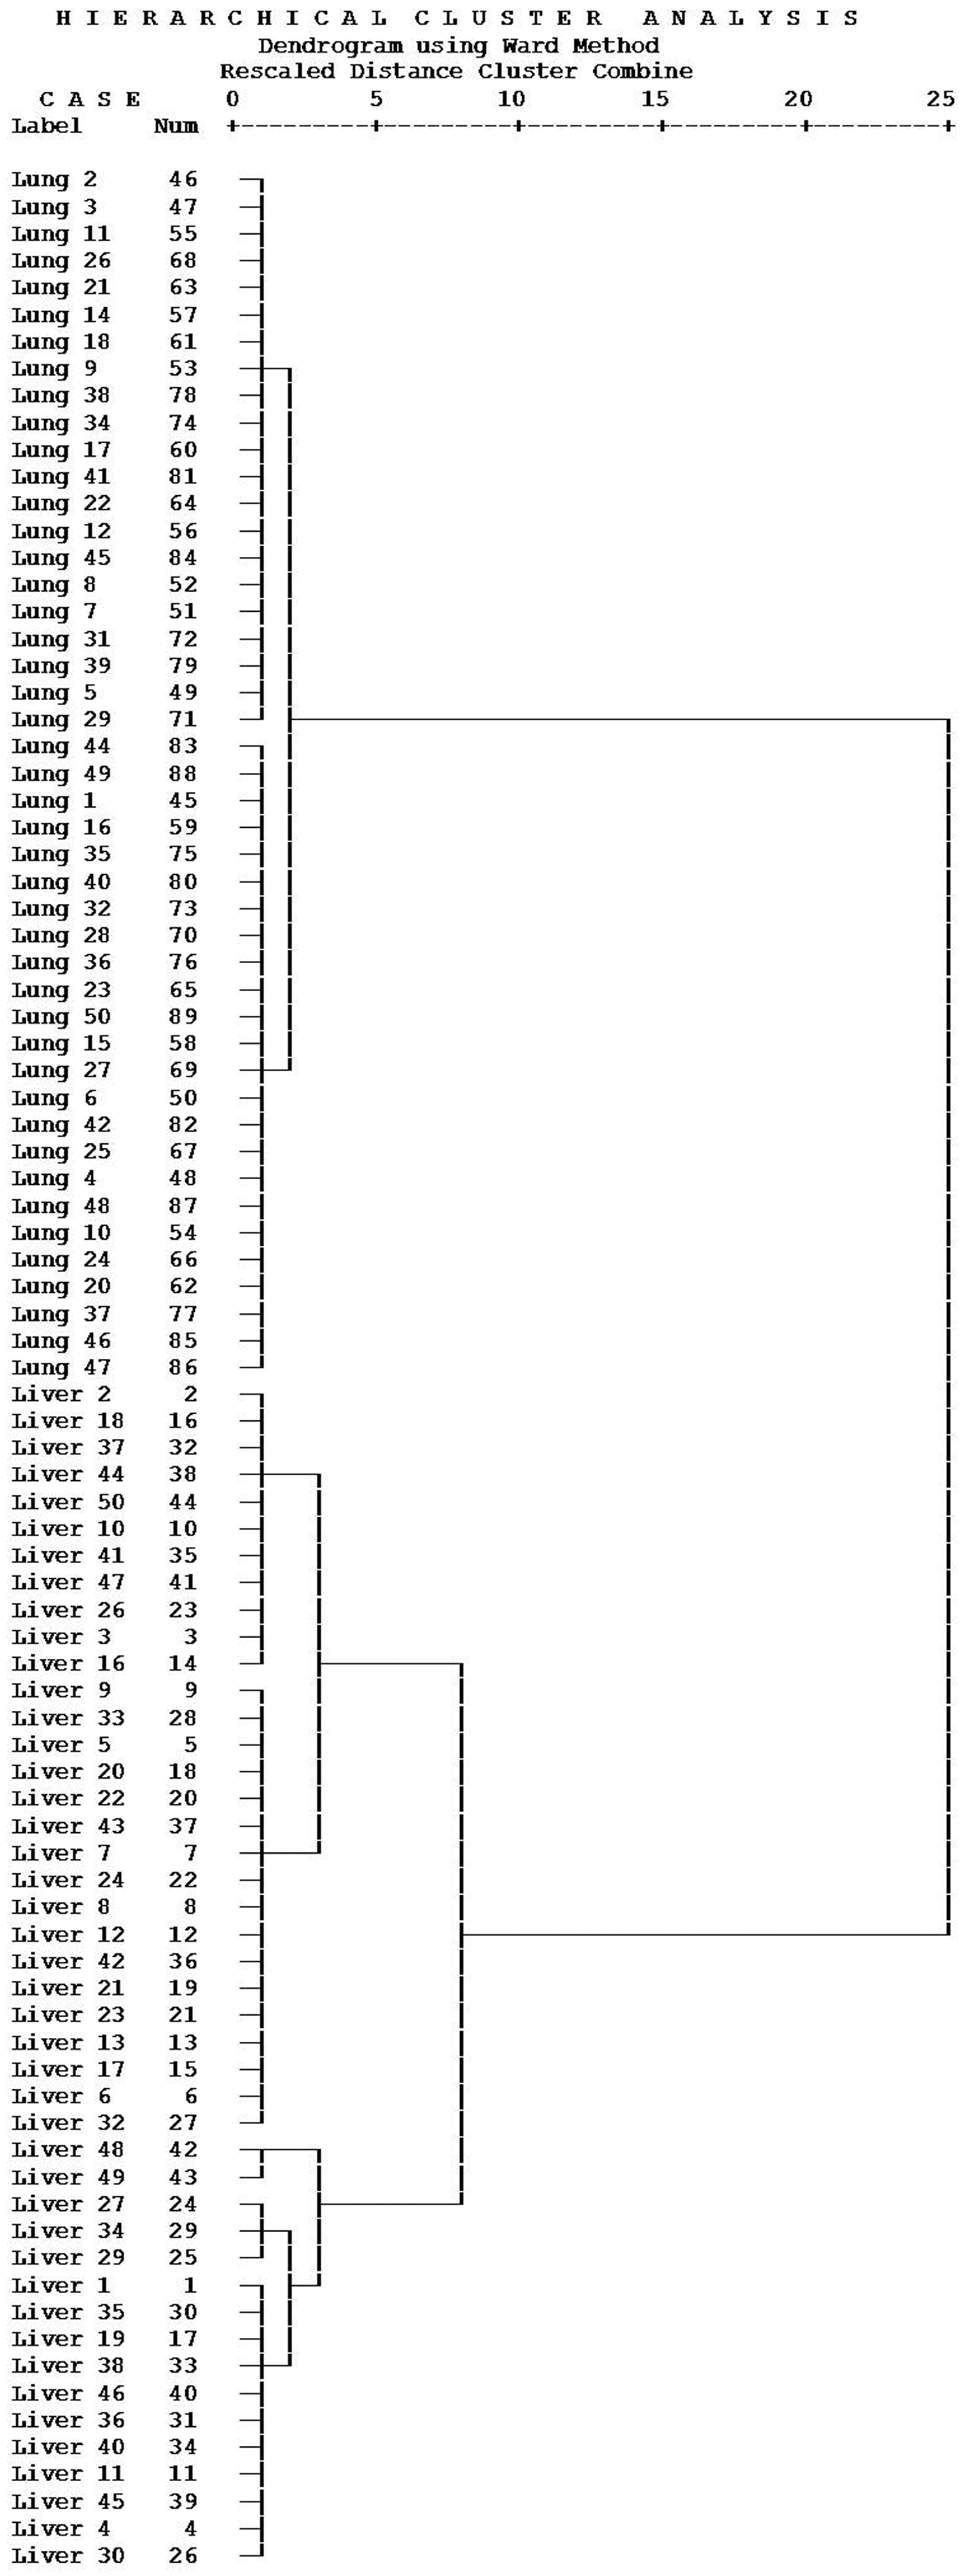
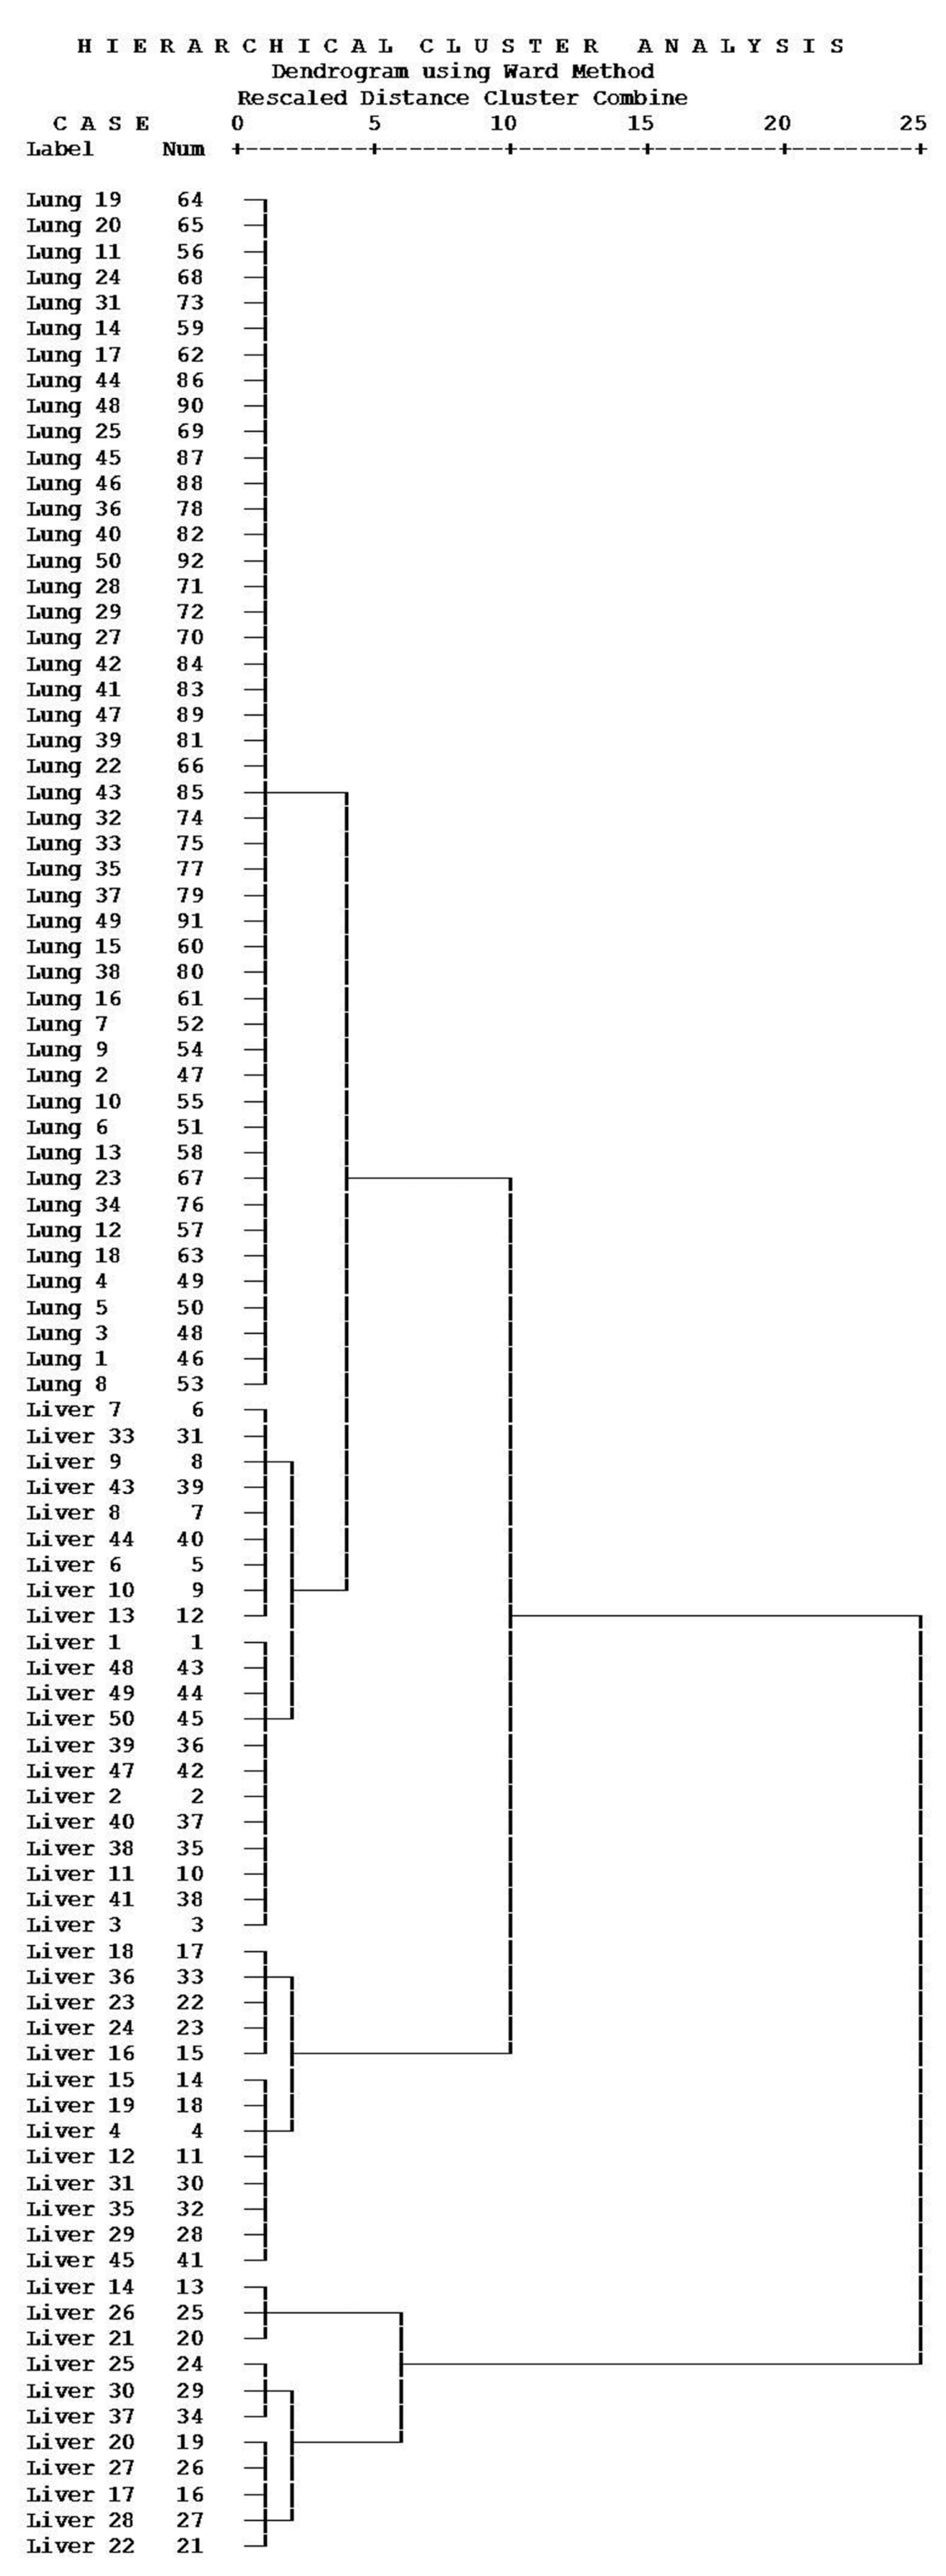
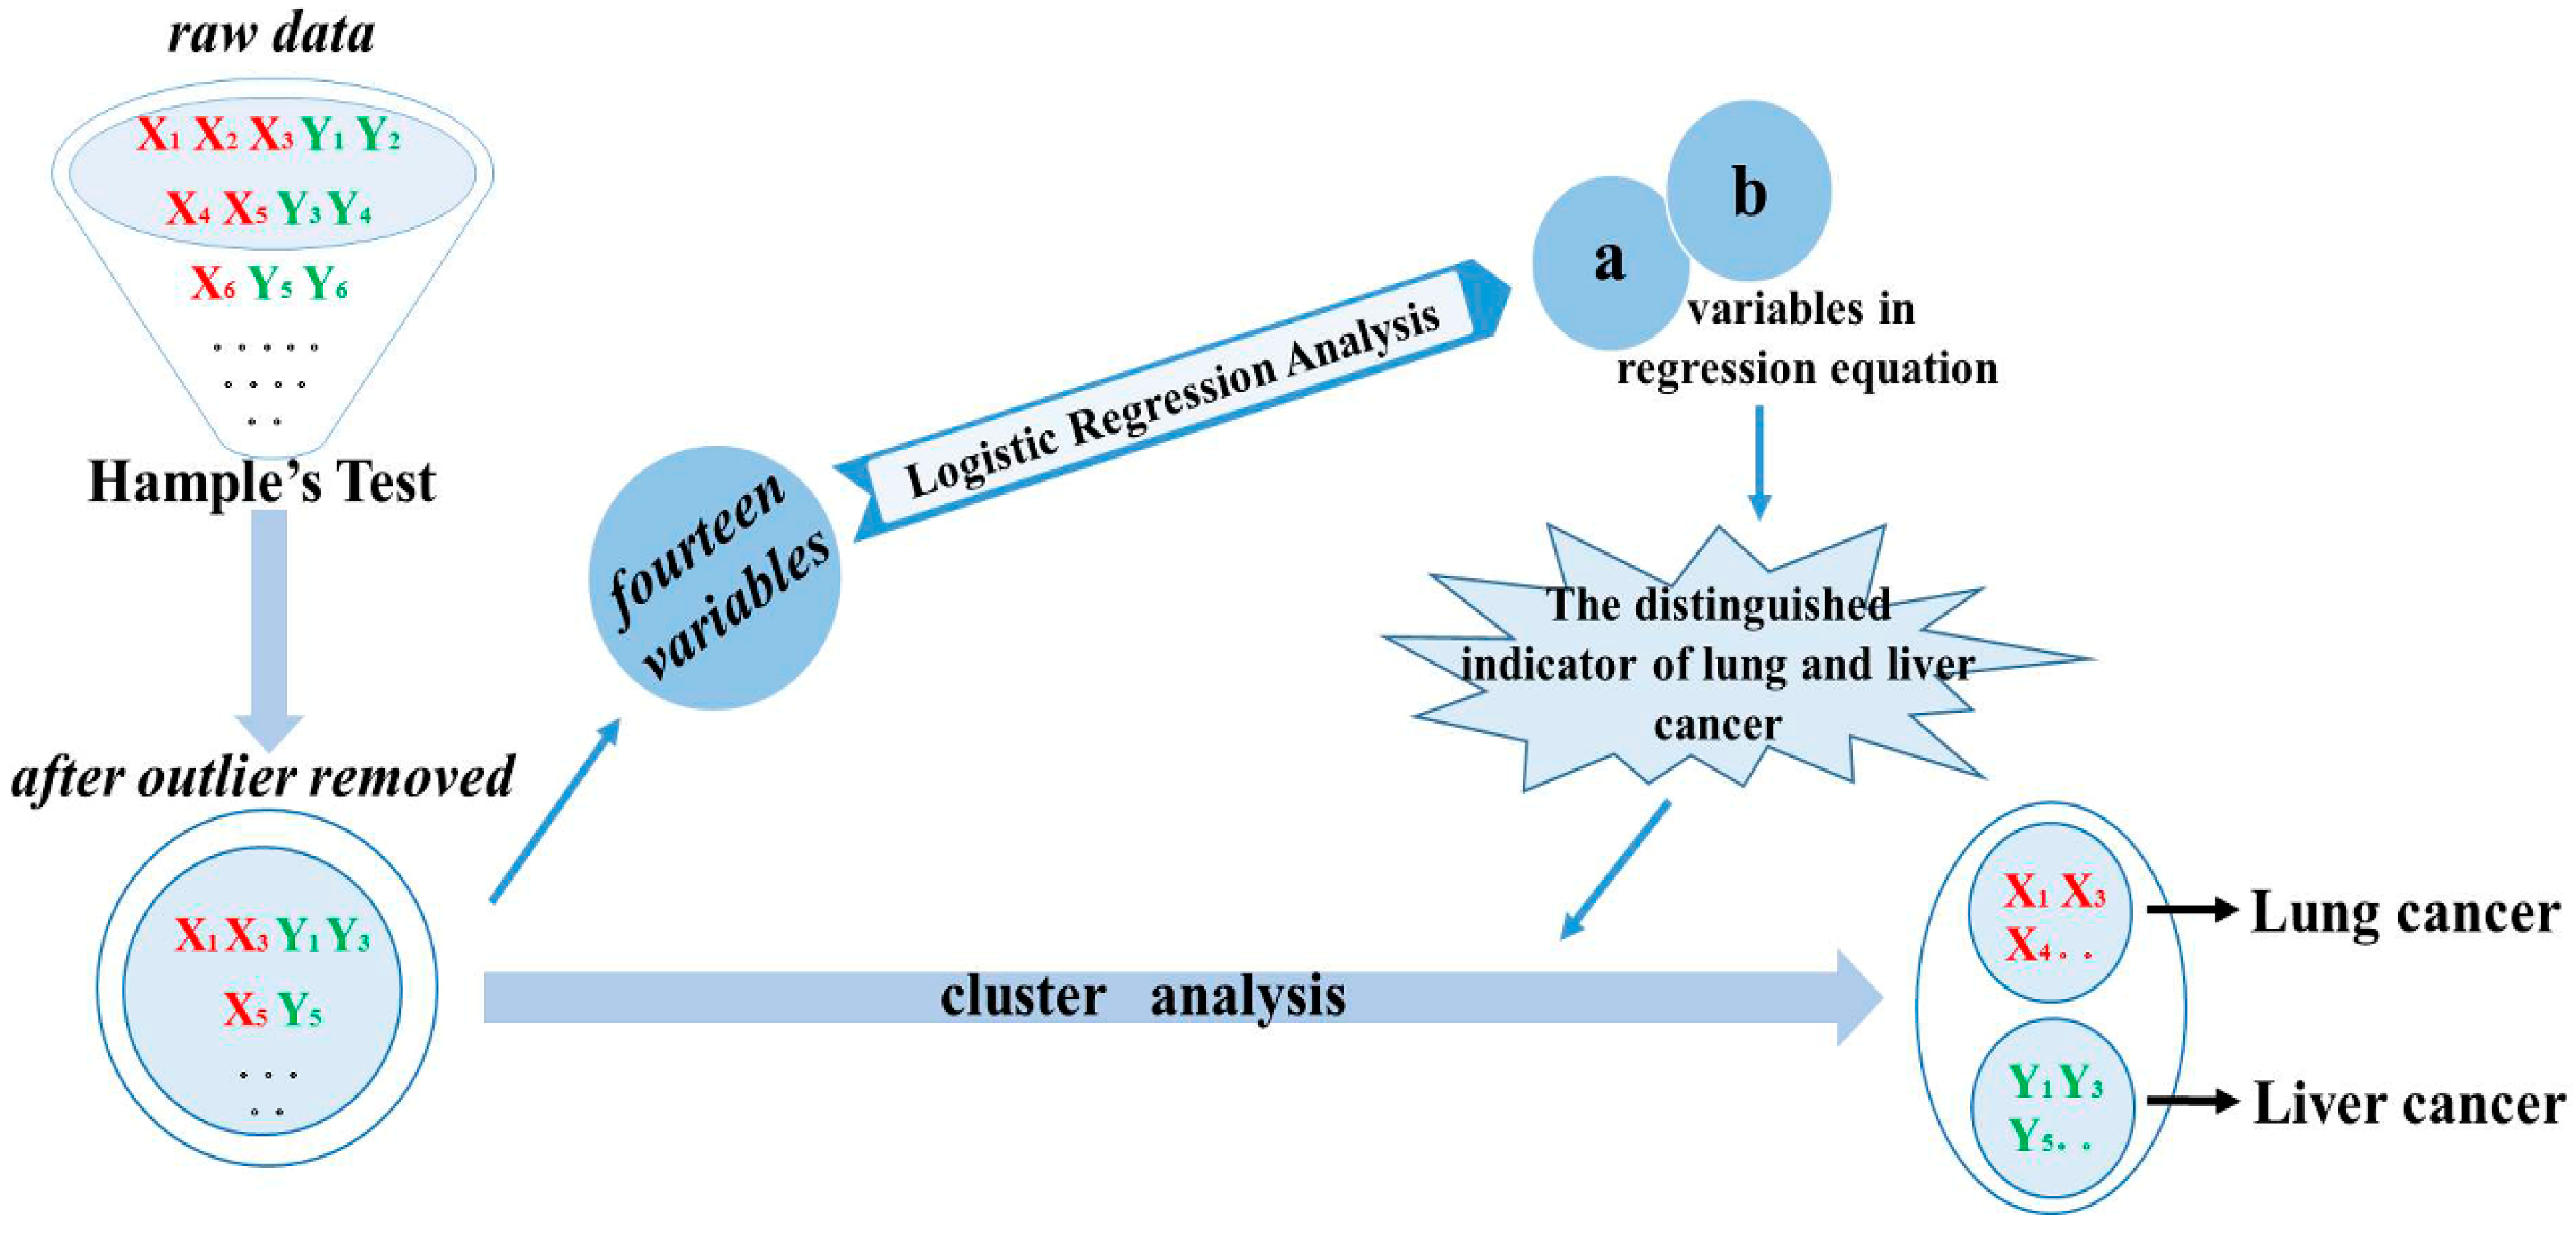
2.2. Classify the Lung and Liver Cancer Using Plasma and Urine Polyamine
3. Materials and Methods
3.1. Materials
3.2. Sample Collection
3.3. UHPLC-MS/MS Analysis
3.4. Sample Preparation
3.5. Method Validation
3.6. Data Analysis
- Calculate the median xm of all results xi, xi ranging from x1 to xn.
- Calculate the absolute residuals ri of single data from the median. ri = ∣xi–xm∣
- Calculate the median rm of absolute residuals.
4. Conclusions
Supplementary Materials
Acknowledgments
Author Contributions
Conflicts of Interest
Abbreviations
| UHPLC | ultra-high performance liquid chromatography |
| MS | mass spectrometry |
| MRM | multiple reaction monitoring |
| DP | declustering potential |
| EP | entrance potential |
| CE | collision energy |
| CXP | cell exit potential |
| ESI | electrospray positive ionization |
| HFBA | heptafluorobutyric acid |
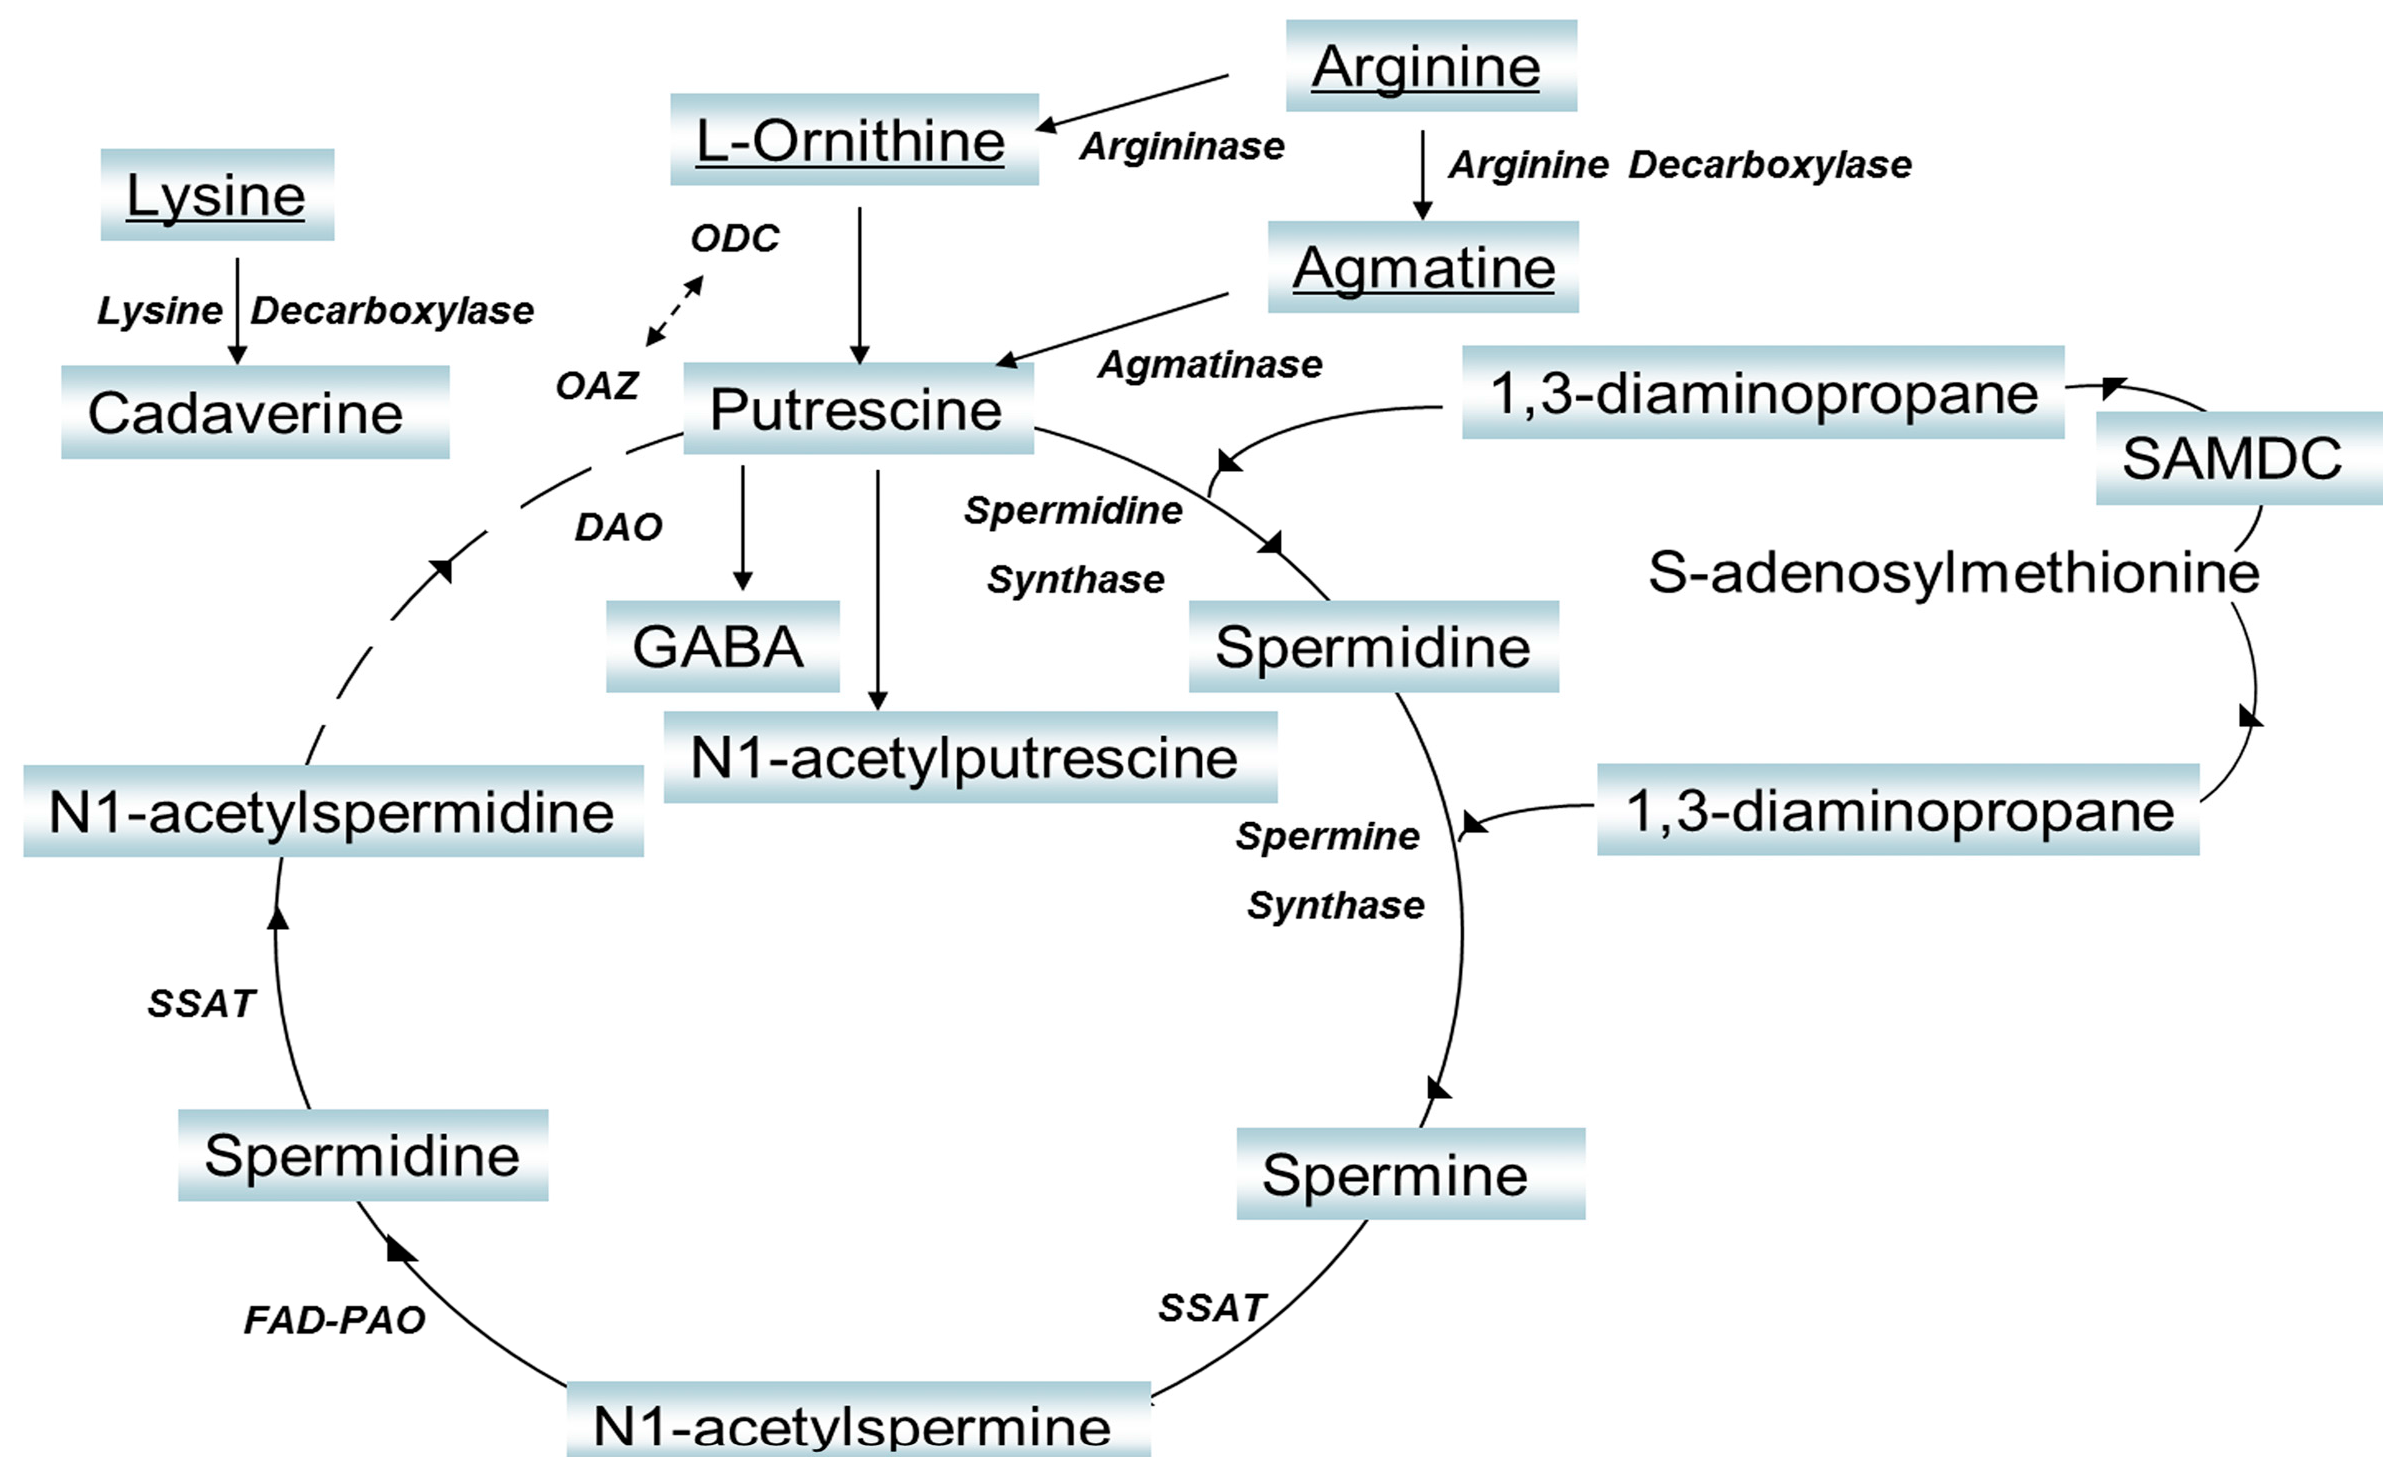
| ODC | ornithine decarboxylase |
| DAO | diamine oxidase |
| SAMDC | S-adenosylmethionine decarboxylase |
| SSAT | spermidine and spermine acetyl transferase |
| FAD-PAO | flavin adenine dinucleotide-polyamine oxidase |
| DAP | 1,3-diaminopropane |
| PUT | putrescine |
| CAD | cadaverine |
| SPD | spermidine |
| SPM | spermine |
| AGM | agmatine |
| N-PUT | N-acetylputrescine |
| N-SPM | N-acetylspermine |
| N-SPD | N-acetylspermidine |
| L-ORN | l-ornithine |
| LYS | lysine |
| L-ARG | l-arginine |
| SAM | S-adenosyl-l-methionine |
| GABA | γ-aminobutyric acid |
References
- American Cancer Society. Cancer Facts & Figures 2013; American Cancer Society: Atlanta, GA, USA, 2013. [Google Scholar]
- Russell, D.H.; Levy, C.C.; Schimpff, S.C.; Hawk, I.A. Urinary polyamines in cancer patients. Cancer Res. 1971, 31, 1555–1558. [Google Scholar] [PubMed]
- Russell, D.H. Clinical relevance of polyamines as biochemical markers of tumor kinetics. Clin. Chem. 1977, 23, 22–27. [Google Scholar] [PubMed]
- Russell, D.H. Increased polyamine concentrations in the urine of human cancer patients. Nature 1971, 233, 144–145. [Google Scholar] [CrossRef]
- Moinard, C.; Cynober, L.; de Bandt, J.-P. Polyamines: Metabolism and implications in human diseases. Clin. Nutr. 2005, 24, 184–197. [Google Scholar] [CrossRef] [PubMed]
- Horn, Y.; Beal, S.L.; Walach, N.; Lubich, W.P.; Spigel, L.; Marton, L.J. Further evidence for the use of polyamines as biochemical markers for malignant tumors. Cancer Res. 1982, 42, 3248–3251. [Google Scholar] [PubMed]
- Liu, R.; Jia, Y.; Cheng, W.; Ling, J.; Liu, L.; Bi, K.; Li, Q. Determination of polyamines in human urine by precolumn derivatization with benzoyl chloride and high-performance liquid chromatography coupled with q-time-of-flight mass spectrometry. Talanta 2011, 83, 751–756. [Google Scholar] [CrossRef] [PubMed]
- Liu, R.; Bi, K.; Jia, Y.; Wang, Q.; Yin, R.; Li, Q. Determination of polyamines in human plasma by high-performance liquid chromatography coupled with Q-TOF mass spectrometry. J. Mass Spectrom. 2012, 47, 1341–1346. [Google Scholar] [CrossRef] [PubMed]
- Wang, Q.; Wang, Y.; Liu, R.; Yan, X.; Li, Y.; Fu, H.; Bi, K.; Li, Q. Comparison of the effects of mylabris and acanthopanax senticosus on promising cancer marker polyamines in plasma of a hepatoma-22 mouse model using HPLC-ESI-MS. Biomed. Chromatogr. 2013, 27, 208–215. [Google Scholar] [CrossRef] [PubMed]
- Lee, S.H.; Suh, J.W.; Chung, B.C.; Kim, S.O. Polyamine profiles in the urine of patients with leukemia. Cancer Lett. 1998, 122, 1–8. [Google Scholar] [CrossRef]
- Liu, R.; Li, Q.; Ma, R.; Lin, X.; Xu, H.; Bi, K. Determination of polyamine metabolome in plasma and urine by ultrahigh performance liquid chromatography–tandem mass spectrometry method: Application to identify potential markers for human hepatic cancer. Anal. Chim. Acta 2013, 791, 36–45. [Google Scholar] [CrossRef] [PubMed]
- Kandler, W. Aufbau Und Betrieb Eines Kontrollprobensystems Zur Qualitätssicherung in Der Wasseranalytik. Ph.D. Thesis, Vienna University of Technology, Wien, Austria, 1998. [Google Scholar]
- Linsinger, T.P.J.; Kandler, W.; Krska, R.; Grasserbauer, M. The influence of different evaluation techniques on the results of interlaboratory comparisons. Accredit. Q. Assur. 1998, 3, 322–327. [Google Scholar] [CrossRef]
- FDA. Guidance for Industry Bioanalytical Method Validation. Available online: http://www.fda.gov/downloads/drugs/guidancecomplianceregulatoryinformation/guidances/ucm070107.pdf (accessed on 3 August 2016).
- European Medicines Agency Guideline on Bioanalytical Method Validation. Available online: http://www.ema.europa.eu/docs/en_gb/document_library/scientific_guideline/2011/08/wc500109686.pdf (accessed on 3 August 2016).
- Sample Availability: Not available.


| Polyamine Metabolome | Plasma (ng/mL) | Urine (ng/mg Creatinine) | ||
|---|---|---|---|---|
| Lung Cancer Patients | Liver Cancer Patients | Lung Cancer Patients | Liver Cancer Patients | |
| DAP a | 3.74 ± 2.26 | 5.79 ± 4.54 | 0.98 ± 0.88 | 1.42 ± 2.09 |
| PUT a | 35.65 ± 16.41 | 77.11 ± 37.14 ** | 19.77 ± 9.13 | 35.12 ± 44.46 ** |
| CAD a | 2.58 ± 2.03 | 3.09 ± 2.43 | 14.38 ± 16.25 | 26.33 ± 28.77 |
| SPD a | 5.55 ± 6.79 | 46.24 ± 30.84 ** | 8.88 ± 7.87 | 6.85 ± 8.04 |
| SPM a | 6.78 ± 3.87 | 14.24 ± 10.73 ** | 90.56 ± 97.67 | 212.46 ± 264.63 |
| AGM a | 71.79 ± 21.97 | 67.08 ± 46.67 | 5544 ± 466 | 5396 ± 4099 |
| l-ORN a | 6374 ± 2429 | 9.85 × 10³ ± 5.69 × 10³ | 202.1 ± 170.8 | 256.81 ± 305.2 |
| LYS a | 1.440 × 10⁵ ± 0.613 × 10⁵ | 1.411 × 10⁵ ± 0.789 × 10⁵ | 2.844 × 10⁴ ± 2.537 × 10⁴ | 2.878 × 10⁴ ± 2.303 × 10⁴ |
| l-ARG a | 1.042 × 10⁵ ± 0.468 × 10⁵ | 1.005 × 10⁵ ± 0.636 × 10⁵ | 257.7 ± 281.2 | 699.2 ± 549.6 ** |
| SAM a | 159.7 ± 90.1 | 131.7 ± 129.0 | 2283 ± 2074 | 6880 ± 5074 * |
| N-PUT a | 0.36 ± 0.24 | 0.52 ± 0.49 | 1.00 ± 1.09 | 0.58 ± 0.80 |
| N-SPM a | 3.12 ± 1.32 | 7.40 ± 3.39 ** | 4.44 ± 4.12 | 1.82 ± 1.74 * |
| N-SPD a | 3.15 ± 0.87 | 6.21 ± 3.78 ** | 300.1 ± 38.32 | 111.6 ± 128.3 |
| GABA a | 74.13 ± 32.86 | 91.12 ± 70.48 | 16.07 ± 12.00 | 22.03 ± 16.57 |
| B | S.E. | Wald | df | Sig. | Exp (B) | ||
|---|---|---|---|---|---|---|---|
| Step 1 a | putrescine | −0.099 | 0.020 | 24.383 | 1 | 0.000 | 0.906 |
| Constant | 3.622 | 0.702 | 26.647 | 1 | 0.000 | 37.414 | |
| Step 2 b | putrescine | −0.112 | 0.036 | 9.478 | 1 | 0.002 | 0.894 |
| spermidine | −0.304 | 0.107 | 8.105 | 1 | 0.004 | 0.738 | |
| Constant | 9.424 | 3.017 | 9.759 | 1 | 0.002 | 1.238 × 10⁴ | |
| Step 3 c | putrescine | −2.045 | 69.121 | 0.001 | 1 | 0.976 | 0.129 |
| spermidine | −4.072 | 139.676 | 0.001 | 1 | 0.977 | 0.017 | |
| N-acetylspermine | −32.047 | 1.120 × 10³ | 0.001 | 1 | 0.977 | 0.000 | |
| Constant | 287.785 | 9.759 × 10³ | 0.001 | 1 | 0.976 | 9.627× 10124 | |
| Step 4 d | putrescine | −1.517 | 85.993 | 0.000 | 1 | 0.986 | 0.219 |
| spermidine | −2.507 | 132.834 | 0.000 | 1 | 0.985 | 0.082 | |
| N-acetylspermine | −19.801 | 1.127× 10³ | 0.000 | 1 | 0.986 | 0.000 | |
| γ-aminobutyric acid | 0.415 | 86.991 | 0.000 | 1 | 0.996 | 1.514 | |
| Constant | 158.206 | 9.759 × 10³ | 0.000 | 1 | 0.987 | 5.104 × 1068 |
| Constant | Putrescine | Spermidine | N-Acetylspermine | γ-Aminobutyric Acid | ||
|---|---|---|---|---|---|---|
| Step 1 | Constant | 1.000 | −0.852 | |||
| putrescine | −0.852 | 1.000 | ||||
| Step 2 | Constant | 1.000 | −0.878 | −0.907 | ||
| putrescine | −0.878 | 1.000 | 0.859 | |||
| spermidine | −0.907 | 0.859 | 1.000 | |||
| Step 3 | Constant | 1.000 | −0.987 | −0.962 | −0.987 | |
| putrescine | −0.987 | 1.000 | 0.953 | 0.960 | ||
| spermidine | −0.962 | 0.953 | 1.000 | 0.921 | ||
| N-acetylspermine | −0.987 | 0.960 | 0.921 | 1.000 | ||
| Step 4 | Constant | 1.000 | −0.308 | −0.658 | −0.830 | −0.440 |
| putrescine | −0.308 | 1.000 | 0.700 | 0.567 | −0.711 | |
| spermidine | −0.658 | 0.700 | 1.000 | 0.559 | −0.177 | |
| N-acetylspermine | −0.830 | 0.567 | 0.559 | 1.000 | 0.042 | |
| γ-aminobutyric acid | −0.440 | −0.711 | −0.177 | 0.042 | 1.000 |
| B | S.E. | Wald | df | Sig. | Exp(B) | ||
|---|---|---|---|---|---|---|---|
| Step 1 a | S-adenosyl-l-methionine | 0.000 | 0.000 | 15.985 | 1 | 0.000 | 1.000 |
| Constant | −1.784 | 0.449 | 15.763 | 1 | 0.000 | 0.168 | |
| Step 2 b | N-acetylspermidine | −0.030 | 0.007 | 16.358 | 1 | 0.000 | 0.970 |
| S-adenosyl-l-methionine | 0.001 | 0.000 | 15.063 | 1 | 0.000 | 1.001 | |
| Constant | −0.395 | 0.628 | 0.396 | 1 | 0.529 | 0.674 | |
| Step 3 c | l-arginine | 0.003 | 0.001 | 7.878 | 1 | 0.065 | 1.003 |
| N-acetylspermidine | −0.041 | 0.012 | 11.197 | 1 | 0.001 | 0.960 | |
| S-adenosyl-l-methionine | 0.002 | 0.001 | 10.233 | 1 | 0.001 | 1.002 | |
| Constant | −2.288 | 1.142 | 4.014 | 1 | 0.045 | 0.101 |
| Constant | S-Adenosyl-l-Methionine | N-Acetylspermidine | l-Arginine | 1,3-Diaminopropane | ||
|---|---|---|---|---|---|---|
| Step 1 | Constant | 1.000 | −0.823 | |||
| s-adenosyl-l-methionine | −0.823 | 1.000 | ||||
| Step 2 | Constant | 1.000 | −0.341 | 0.103 | ||
| N-acetylspermidine | 0.103 | −0.905 | 1.000 | |||
| s-adenosyl-l-methionine | −0.341 | 1.000 | −0.905 | |||
| Step 3 | Constant | 1.000 | −0.683 | 0.566 | −0.686 | |
| l-arginine | −0.686 | 0.666 | −.678 | 1.000 | ||
| N-acetylspermidine | 0.566 | −0.968 | 1.000 | −0.678 | ||
| s-adenosyl-l-methionine | −0.683 | 1.000 | −0.968 | 0.666 | ||
| Step 4 | Constant | 1.000 | −0.729 | 0.378 | −0.521 | −0.026 |
| 1,3-diaminopropane | −0.026 | 0.542 | −0.903 | 0.686 | 1.000 | |
| l-arginine | −0.521 | 0.698 | −0.790 | 1.000 | 0.686 | |
| N-acetylspermidine | 0.378 | −0.849 | 1.000 | −0.790 | −0.903 | |
| s-adenosyl-l-methionine | −0.729 | 1.000 | −0.849 | 0.698 | 0.542 |
© 2016 by the authors. Licensee MDPI, Basel, Switzerland. This article is an open access article distributed under the terms and conditions of the Creative Commons Attribution (CC-BY) license ( http://creativecommons.org/licenses/by/4.0/).
Share and Cite
Xu, H.; Liu, R.; He, B.; Bi, C.W.; Bi, K.; Li, Q. Polyamine Metabolites Profiling for Characterization of Lung and Liver Cancer Using an LC-Tandem MS Method with Multiple Statistical Data Mining Strategies: Discovering Potential Cancer Biomarkers in Human Plasma and Urine. Molecules 2016, 21, 1040. https://doi.org/10.3390/molecules21081040
Xu H, Liu R, He B, Bi CW, Bi K, Li Q. Polyamine Metabolites Profiling for Characterization of Lung and Liver Cancer Using an LC-Tandem MS Method with Multiple Statistical Data Mining Strategies: Discovering Potential Cancer Biomarkers in Human Plasma and Urine. Molecules. 2016; 21(8):1040. https://doi.org/10.3390/molecules21081040
Chicago/Turabian StyleXu, Huarong, Ran Liu, Bosai He, Cathy Wenchuan Bi, Kaishun Bi, and Qing Li. 2016. "Polyamine Metabolites Profiling for Characterization of Lung and Liver Cancer Using an LC-Tandem MS Method with Multiple Statistical Data Mining Strategies: Discovering Potential Cancer Biomarkers in Human Plasma and Urine" Molecules 21, no. 8: 1040. https://doi.org/10.3390/molecules21081040
APA StyleXu, H., Liu, R., He, B., Bi, C. W., Bi, K., & Li, Q. (2016). Polyamine Metabolites Profiling for Characterization of Lung and Liver Cancer Using an LC-Tandem MS Method with Multiple Statistical Data Mining Strategies: Discovering Potential Cancer Biomarkers in Human Plasma and Urine. Molecules, 21(8), 1040. https://doi.org/10.3390/molecules21081040