Biological Activity of Vegetal Extracts Containing Phenols on Plant Metabolism


Abstract
:1. Introduction
2. Results
2.1. Chemical and Spectroscopic Characterization of Vegetal Extracts

| Variable | HN | RGS | BB |
|---|---|---|---|
| pH | 2.9 | 2.9 | 2.9 |
| Total sugars (g/L) | 8.4 b* | 5.7 c | 12.4 |
| Gallic acid (mg/L) | 4.5 a | 2.63 b | n.d. |
| Chlorogenic acid (mg/L) | 20.1b | n.d. | 46.0 a |
| Vanillic acid (mg/L) | 3.6 b | 8.84 a | n.d. |
| Caffeic acid (mg/L) | 21.8 a | n.d. | 4.85 b |
| p-Coumaric acid (mg/L) | 2.2 | n.d. | n.d. |
| p-Hydroxybenzoic acid (mg/L) | 150.8 b | 152.3 b | 303.5 a |
| Total phenolic acids (mg/L) | 1140 b | 970 c | 4830 a |
| IAA-like † | 1.50·10−2 | n.d. | n.d. |
| GA-like † | 1.09·10−7 b | 1.34·10−6 a | n.d. |
| IAA (nMol) | 14.6 a | 11.6 b | 14.9 a |
| IPA (nMol) | 4.1 a | 4.91 a | 2.9 b |
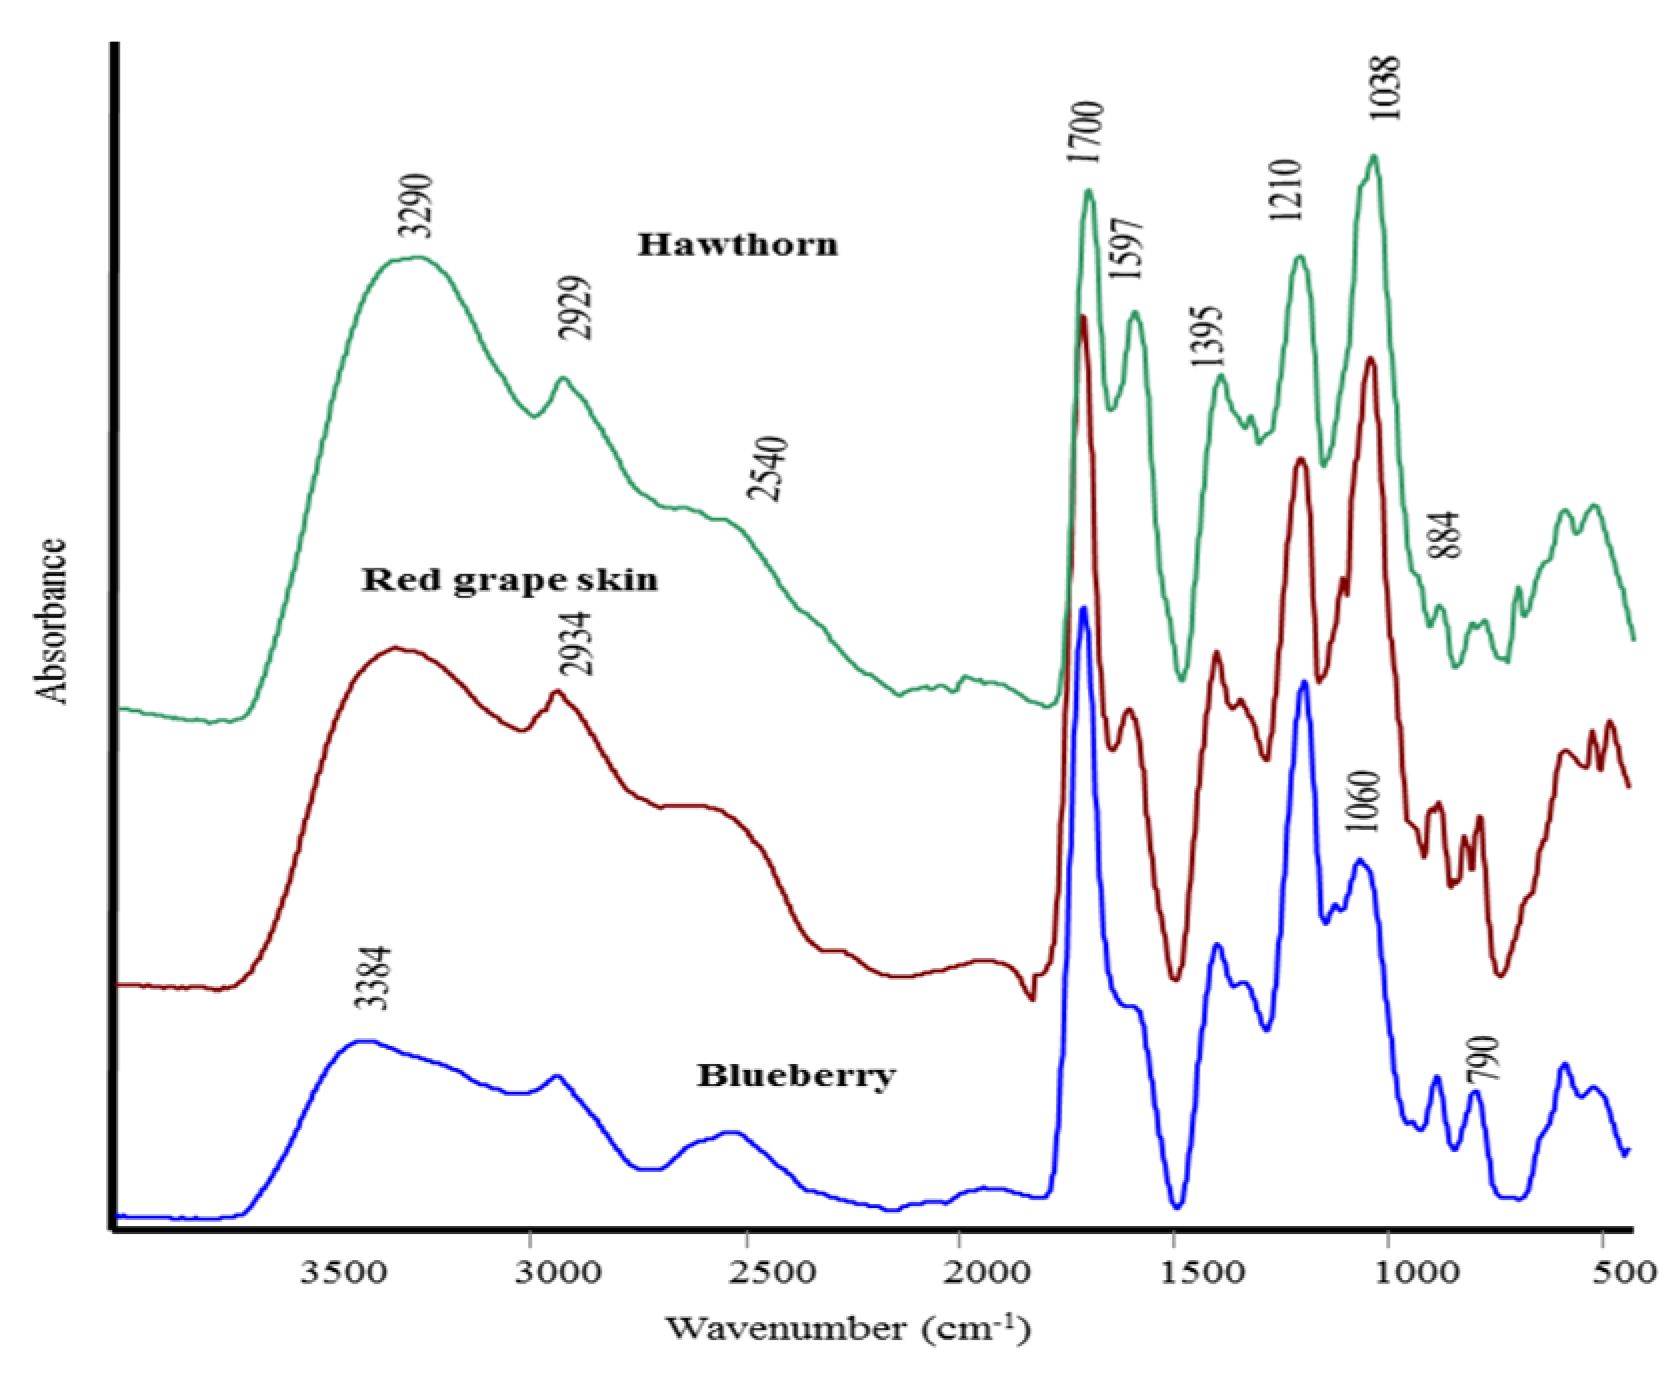
| Attribution | HN | RGS | BB |
|---|---|---|---|
| p-substituted benzene | 3060 m | 3060 m | 3060 m |
| aliphatic esters (νC=O) | 1730 w | 1728 m | |
| fumaric acid, aliphatic ketones (νC=O) | 1694 w | - | 1711 m |
| ν(C=C) allyl derivatives | - | 1642 vs | 1639 vs |
| ν(C=C) aromatic | 1628 vs | 1627 vs | 1628 vs |
| δNH2 + ν(C=C) aromatic | 1604 vs | 1604 sh | 1604 s |
| ν (C=C) aromatic | 1577 sh | ||
| δCH3/CH2 | 1446 m | 1448 m | 1446 m |
| νs COO− δCH3 | 1406 m, sh 1378 m | 1385 m | 1406 m 1387 m |
| νC-O (phenolic) | 1290 m-s 1266 m, sh | 1267 m | 1290 m 1266 m |
| δCH (aromatic) (p-disubstituted benzene)/polyenes | 1180 1154 m | 1154 vs | 1154 m |
| δCH (aromatic) + ν(C-C) aliphatic | 1084 m | 1089 w | 1076 w |
| δCH (aromatic) | 1002 m | 1008 m-s | 1002 m-s |
| δCH (aromatic) + ν(C-C) aliphatic | 947 vw | 926 w | 939 m, l |
| skeletal vibrations | 896 w 873 w | 871 w | 888 w 873 w |
| skeletal vibrations (p-disubstituted benzene) | 795 m-w | 795 m-w | 795 m |
| skeletal vibrations | 681 w | 681 m-w | - |
| skeletal vibrations (benzene p-disubstituted) | 617 w | 618 w | 617 w |
| n-alkanes | 420 w | ||
| δ(CCO) polyphenols and/or resveratrol | 370 m-w | 370 m-w |
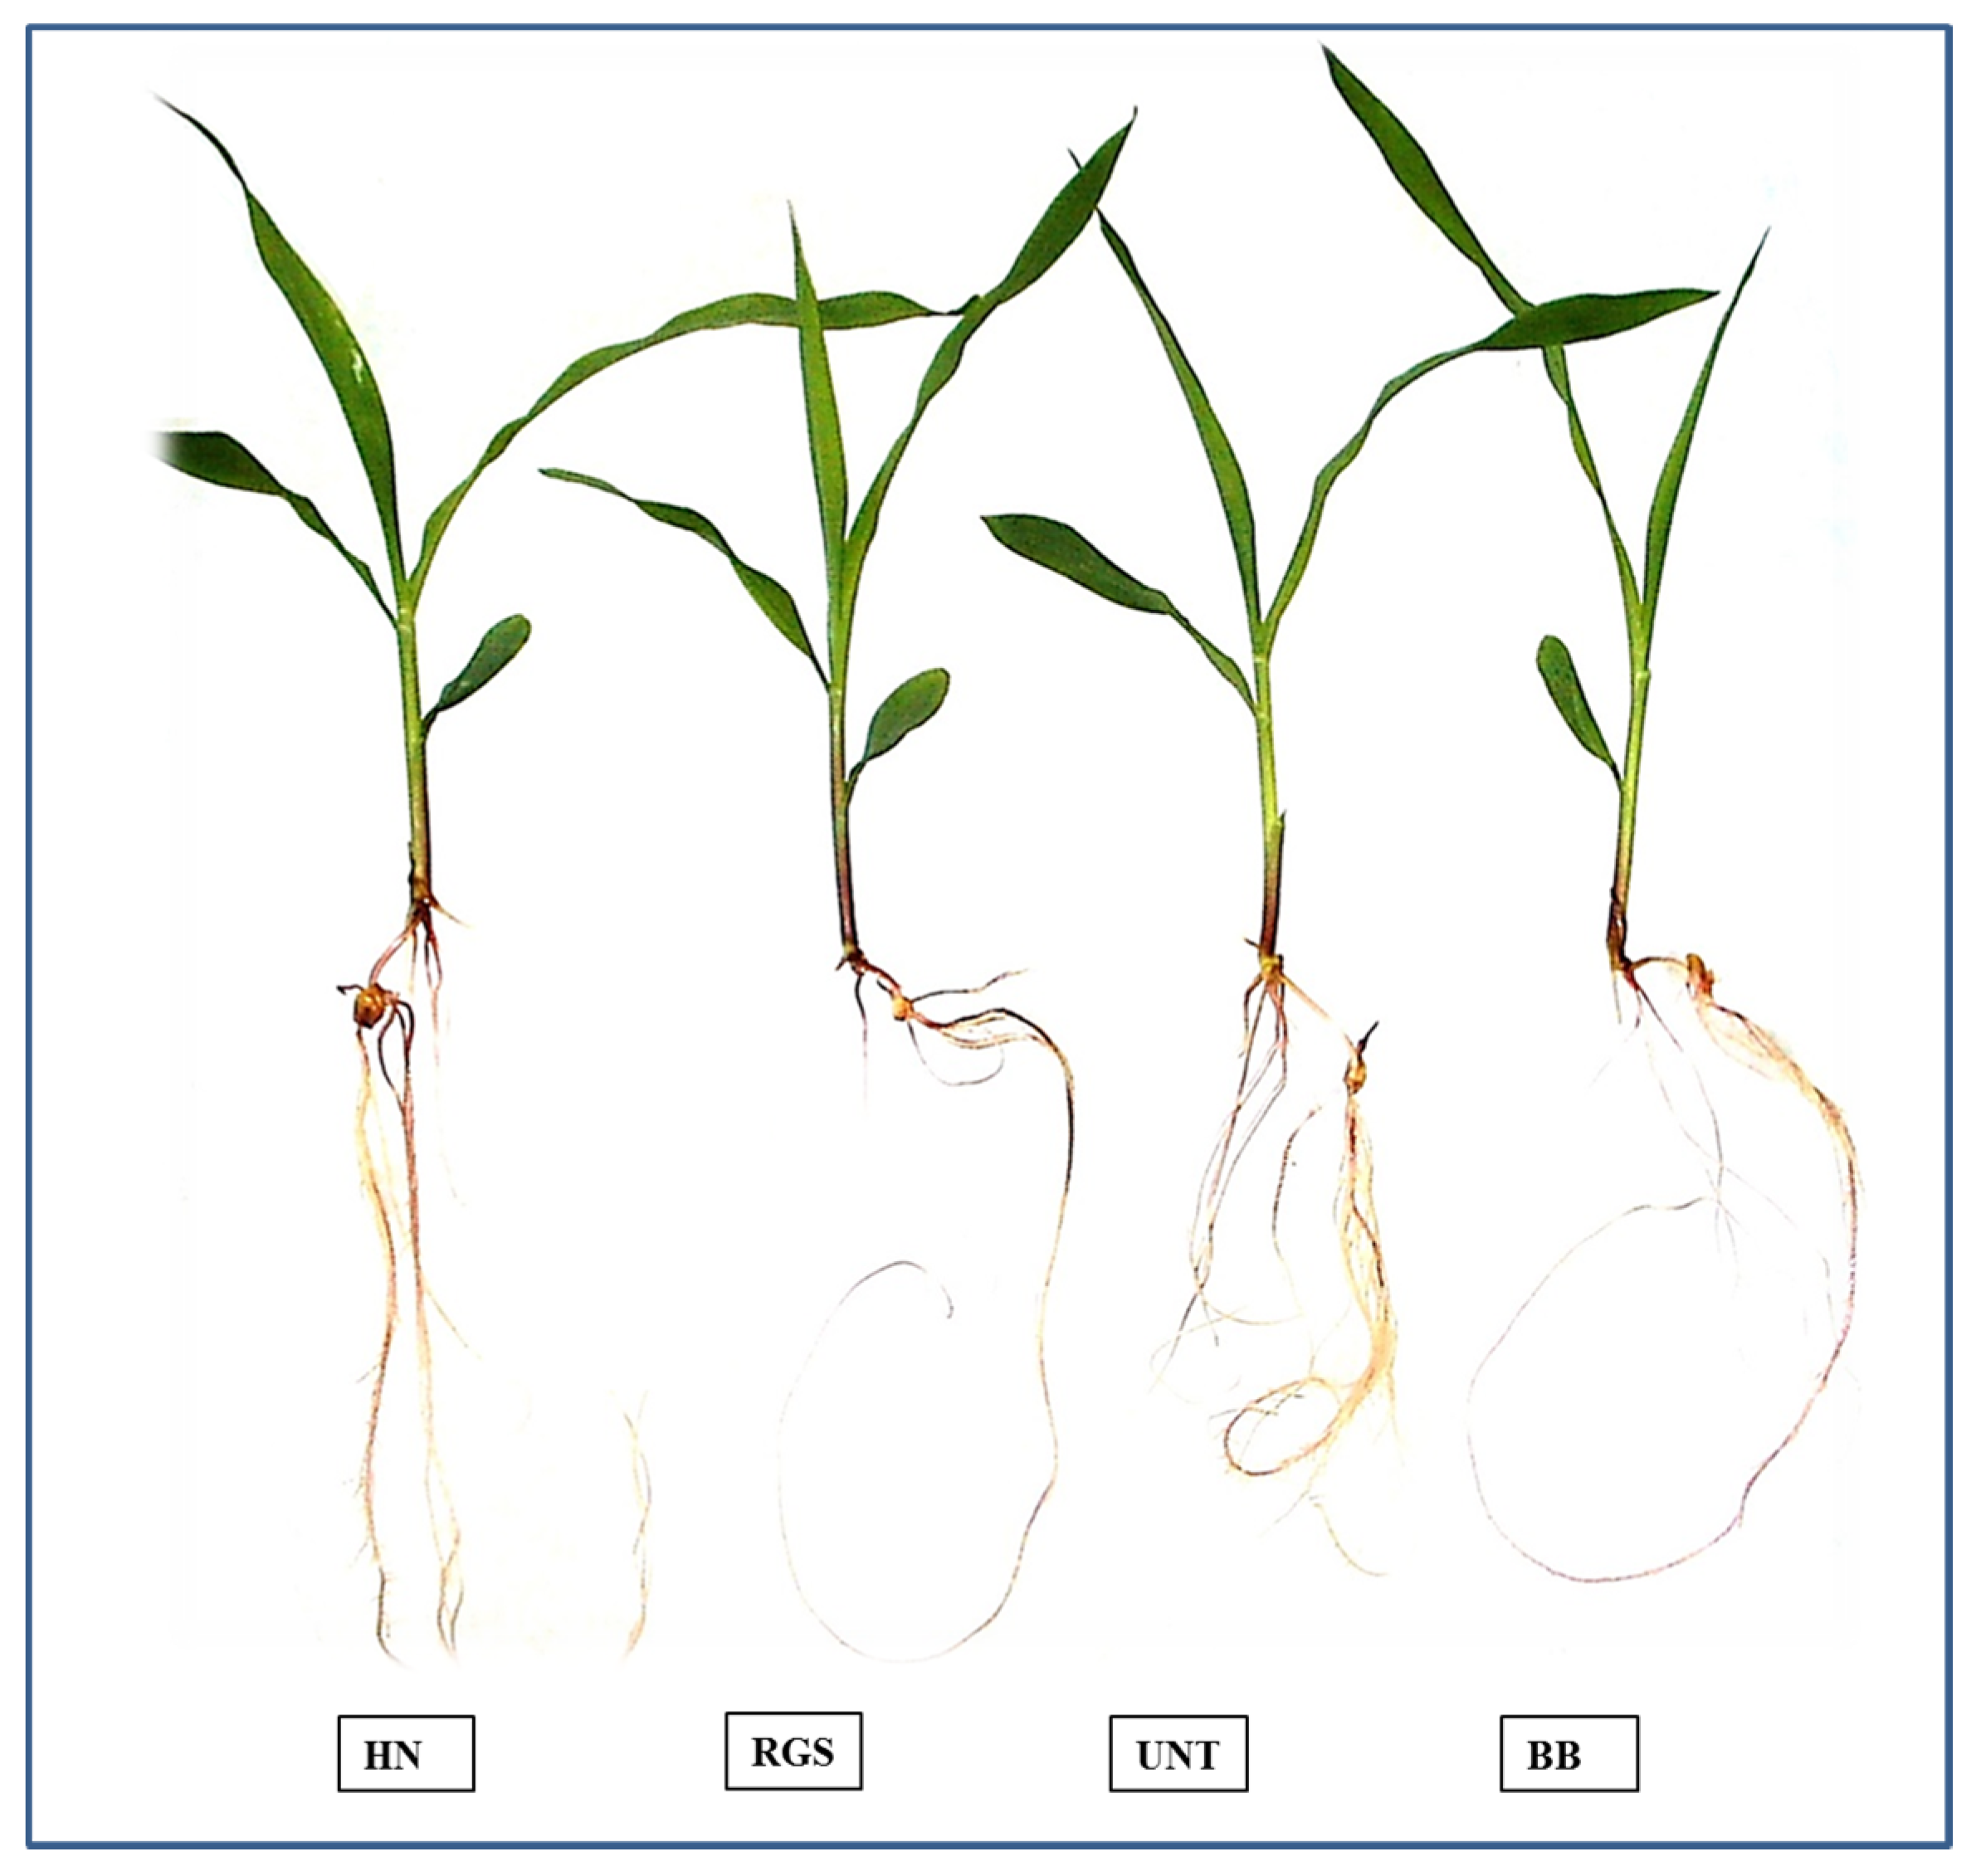
2.2. Effect of Vegetal Extracts on Plant Growth
| Treatment | mL/L | Dry Weight | Protein | Glucose | Fructose |
|---|---|---|---|---|---|
| g | mg/g f.w. | mg/g d.w. | |||
| UNT | - | 0.92 ± 0.01 Aaa* | 1.30 ± 0.01 Cdc | 3.25 ± 0.01 Aba | 0.67 ± 0.02 Ceb |
| HN | 0.1 | 0.85 ± 0.01 b | 1.54 ± 0.04 b | 3.90 ± 0.01 a | 1.09 ± 0.02 c |
| 1.0 | 0.91 ± 0.01 ab | 1.54 ± 0.07 b | 3.17 ± 0.01 b | 1.65 ± 0.01 a | |
| 0.88 ± 0.01 B | 1.54 ± 0.04 A | 3.54 ± 0.39 A | 1.37 ± 0.31 A | ||
| RGS | 0.1 | 0.89 ± 0.01 b | 1.65 ± 0.04 a | 2.74 ± 0.01 c | 1.23 ± 0.02 b |
| 1.0 | 0.94 ± 0.01 a | 1.33 ± 0.03 d | 1.64 ± 0.01 d | 0.48 ± 0.01 e | |
| 0.91 ± 0.03 A | 1.49 ± 0.17 A | 2.19 ± 0.60 B | 0.85 ± 0.41 B | ||
| BB | 0.1 | 0.92 ± 0.01 a | 1.42 ± 0.01 c | 3.87 ± 0.01 a | 0.73 ± 0.02 de |
| 1.0 | 0.88 ± 0.01 b | 1.31 ± 0.09 d | 2.96 ± 0.01 bc | 1.07 ± 0.01 c | |
| 0.90 ± 0.03 A | 1.37 ± 0.05 B | 3.42 ± 0.13 A | 0.90 ± 0.04 B | ||
| 0.1 | 0.89 ± 0.03 b | 1.54 ± 0.12 a | 3.50 ± 0.53 a | 1.02 ± 010 a | |
| 1.0 | 0.91 ± 0.04 ab | 1.39 ± 012 b | 2.59 ± 076 b | 1.07 ± 0.51 a | |
| Treatment | mL/L | Dry weight | Protein | Glucose | Fructose |
|---|---|---|---|---|---|
| g | mg/g f.w. | mg/g d.w. | |||
| UNT | - | 0.76 ± 0.01 Bcb* | 1.83 ± 0.03 Bcb | 0.67 ± 0.01 Bcb | 0.64 ± 0.01 Bcc |
| HN | 0.1 | 0.86 ± 0.01 a | 2.23 ± 0.09 ab | 0.91 ± 0.01 b | 0.98 ± 0.01 b |
| 1.0 | 0.83 ± 0.01 b | 2.03 ± 0.15 b | 0.78 ± 0.01 c | 1.06 ± 0.01 b | |
| 0.85 ± 0.02 B | 2.13 ± 041 A | 0.85 ± 0.07 A | 1.02 ± 0.04 A | ||
| RGS | 0.1 | 0.88 ± 0.01 a | 2.41 ± 0.02 a | 1.41 ± 0.01 a | 1.45 ± 0.01 a |
| 1.0 | 0.86 ± 0.01 a | 2.41 ± 0.02 a | 0.39 ± 0.01 e | 0.40 ± 0.01 d | |
| 0.87 ± 0.01 A | 2.41 ± 0.02 A | 0.90 ± 0.56 A | 0.92 ± 0.55 A | ||
| BB | 0.1 | 0.86 ± 0.01 a | 2.22 ± 0.12 ab | 0.55 ± 0.01 d | 0.61 ± 0.01 c |
| 1.0 | 0.85 ± 0.01 a | 2.25 ± 0.06 ab | 0.52 ± 0.01 d | 0.66 ± 0.01 c | |
| 0.86 ± 0.03 A | 2.23 ± 0.09 A | 0.54 ± 003 C | 0.63 ± 0.05 B | ||
| 0.1 | 0.87 ± 0.01 a | 2.29 ± 0.11 a | 0.96 ± 0.32 a | 1.00 ± 0.23 a | |
| 1.0 | 0.85 ± 0.01 ab | 2.23 ± 0.35 a | 0.56 ± 0.18 b | 0.71 ± 0.30 b | |
| Treatment | Chlorophylls mg/g f.w. | Phenolic Acids mg/g f.w. | PAL | ||||||
|---|---|---|---|---|---|---|---|---|---|
| mL/L | a | b | Gallic | Vanillic | Caffeic | p-Coumaric | p-Hydroxybenzoic | nmol Cinnamic Acid /mg protein/min | |
| UNT | - | 2.17 ± 0.01 Bcc* | 4.23 ± 0.01 Bcc | 2.23 ± 0.13 Cdc | n.d. | 0.60 ± 0.10 Dec | 6.20 ± 1.06 Cec | 2.50 ± 0.50 Ccc | 8.4 ± 2.0 Dgc |
| HN | 0.1 | 2.63 ± 0.01 a | 4.23 ± 0.01 c | 12.21 ± 1.00 c | 42.27 ± 1.63 a | 12.43 ± 1.00 a | 34.63 ± 0.80 d | 6.87 ± 0.23 a | 54.3 ± 7.3 d |
| 1.0 | 2.48 ± 0.01 b | 5.32 ± 0.02 b | 23.85 ± 2.33 a | 20.43 ± 0.85 c | 2.50 ± 0.17 d | 168.03 ± 2.40 a | 7.17 ± 0.40 a | 93.8 ± 6.2 a | |
| 2.56 ± 0.08 A | 4.78 ± 0.55 B | 18.03 ± 6.60 A | 31.35 ± 12.01 A | 7.47 ± 5.48 A | 101.33 ± 73.08 A | 7.02 ± 0.34 A | 74.1 ± 22.4 A | ||
| RGS | 0.1 | 2.58 ± 0.01 ab | 4.62 ± 0.04 c | 13.54 ± 0.97 c | n.d. | 6.68 ± 0.49 b | 15.37 ± 0.97 e | 5.90 ± 0.10 b | 17.9 ± 5.3 f |
| 1.0 | 2.35 ± 0.04 bc | 6.07 ± 0.03 a | 22.70 ± 0.95 b | n.d. | 6.86 ± 0.14 b | 148.67 ± 7.77 b | 2.50 ± 0.30 c | 78.2 ± 3.2 c | |
| 2.47 ± 0.04 AB | 5.34 ± 0.01 A | 18.12 ± 4.97 A | n.d. | 6.77 ± 0.31 B | 82.02 ± 70.30 B | 4.20 ± 1.79 B | 48.1 ± 7.0 C | ||
| BB | 0.1 | 2.71 ± 0.02 a | 5.58 ± 0.01 b | 10.50 ± 0.55 c | 23.10 ± 1.30 b | 5.10 ± 0.40 c | 44.50 ± 3.12 d | 3.40 ± 0.66 c | 35.2 ± 2.2 e |
| 1.0 | 2.42 ± 0.02 b | 4.94 ± 0.32 c | 18.03 ± 1.21 a | 26.40 ± 2.01 b | 3.00 ± 0.56 d | 170.03 ± 10.40 a | 2.30 ± 0.22 d | 90.0 ± 3.5 b | |
| 2.56 ± 0.02 A | 5.26 ± 0.34 A | 14.25 ± 0.76 B | 24.75 ± 3.40 B | 4.05 ± 1.40 C | 107.25 ± 8.32 A | 2.70 ± 0.36 C | 62.5 ± 2.4 B | ||
| 0.1 | 2.69 ± 0.03 a | 4.45 ± 0.24 b | 12.08 ± 1.42 b | 21.79 ± 2.66 a | 8.07 ± 2.65 a | 31.50 ± 5.21 b | 5.39 ± 1.60 a | 35.8 ± 7.3 b | |
| 1.0 | 2.47 ± 0.13 b | 5.12 ± 0.81 a | 21.52 ± 1.90 a | 15.61 ± 3.65 b | 4.12 ± 1.11 b | 162.23 ± 10.50 a | 3.90 ± 0.50 b | 87.3 ± 7.9 a | |
3. Discussion
4. Materials and Methods
4.1. Chemical and Spectroscopic Characterization of Vegetal Extracts
4.2. Hormone Content and Activity
4.3. Plant Material and Growth Conditions
4.4. Protein Extraction
4.5. Determination of Soluble Phenols and Sugars
4.6. Determination of Chlorophyll Content
4.7. Phenylalanine Ammonia-lyase Assay
4.8. Statistical Analyses
5. Conclusions
Supplementary Materials
Acknowledgments
Author Contributions
Ethical Statements
Conflicts of Interest
References
- Colla, G.; Nardi, S.; Cardarelli, M.; Ertani, A.; Lucini, L.; Canaguier, R.; Rouphael, Y. Protein hydrolysates as biostimulants in horticulture. Sci. Hortic. 2015. [Google Scholar] [CrossRef]
- Calvo, P.; Nelson, L.; Kloepper, J.W. Agricultural uses of plant biostimulants. Plant Soil 2014, 383, 3–41. [Google Scholar] [CrossRef]
- Sharma, H.S.S.; Fleming, C.; Selby, C.; Rao, J.R.; Martin, T. Plant biostimulants: A review on the processing of macroalgae and use of extracts for crop management to reduce abiotic and biotic stresses. J. Appl. Phycol. 2014, 26, 465–490. [Google Scholar] [CrossRef]
- Du Jardin, P. Plant biostimulants: Definition, concept, main categories and regulation. Sci. Hort. 2015, 196, 3–14. [Google Scholar] [CrossRef]
- Ertani, A.; Schiavon, M.; Altissimo, A.; Franceschi, C.; Nardi, S. Phenol-containing organic substances stimulate phenylpropanoid metabolism in Zea mays. J. Plant Nutr. Soil Sci. 2011, 174, 496–503. [Google Scholar] [CrossRef]
- Szopa, A.; Ekiert, H. Production of biologically active phenolic acids in Aronia melanocarpa (Michx.) Elliott in vitro cultures cultivated on different variants of the Murashige and Skoog medium. Plant Growth Regul. 2014, 72, 51–58. [Google Scholar] [CrossRef]
- Aremu, A.O.; Plačková, L.; Gruz, J.; Bíba, O.; Novák, O.; Stirk, W.A.; Doležal, K.; van Staden, J. Seaweed-derived biostimulant (Kelpak®) influences endogenous cytokinins and bioactive compounds in hydroponically grown Eucomis autumnalis. J. Plant Growth Regul. 2015. [Google Scholar] [CrossRef]
- Aremu, A.O.; Stirk, W.A.; Kulkarni, M.G.; Tarkowská, D.; Turečková, V.; Gruz, J.; Šubrtová, M.; Pěnčík, A.; Novák, O.; Doležal, K.; et al. Evidence of phytohormones and phenolic acids variability in garden-waste-derived vermicompost leachate, a well-known plant growth stimulant. Plant. Growth. Regul. 2015, 75, 483–492. [Google Scholar] [CrossRef]
- Rice, E.L. Allelopathy, 2nd ed.; Academic Press: New York, NY, USA, 1984. [Google Scholar]
- Northup, R.R.; Yu, Z.; Dahlgren, R.A.; Vogt, K.A. Polyphenol control of nitrogen release from pine litter. Nature 1995, 77, 227–229. [Google Scholar] [CrossRef]
- Inderjit. Plant phenolics in allelopathy. Bot. Rev. 1996, 62, 182–202. [Google Scholar] [CrossRef]
- Einhellig, F.A. Mode of allelochemical action of phenolic compounds. In Allelopathy Chemistry and Mode of Action of Allelochemicals; Macı`as, F.A., Galindo, J.C.G., Molinillo, J.M.G., Cutler, H.G., Eds.; CRC Press: London, UK, 2004; pp. 219–238. [Google Scholar]
- Aremu, A.O.; Gruz, J.; Šubrtová, M.; Szüčová, L.; Doležal, K.; Bairu, M.W.; Finnie, J.F.; Van Staden, J. Antioxidant and phenolic acid profiles of tissue cultured and acclimatized Merwilla plumbea plantlets in relation to the applied cytokinins. J. Plant Physiol. 2013, 170, 1303–1308. [Google Scholar] [CrossRef] [PubMed]
- Olthof, M.R.; Hollman, P.C.; Katan, M.B. Chlorogenic acid and caffeic acid are absorbed in humans. J. Nutr. 2001, 131, 66–71. [Google Scholar] [PubMed]
- Chong, K.P.; Rossall, S.; Atong, M. In vitro antimicrobial activity and fungitoxicity of syringic acid, caffeic acid and 4-hydroxybenzoic acid against Ganoderma boninense. J. Agr. Sci. 2009, 1, 15–20. [Google Scholar] [CrossRef]
- Itoh, A.; Isoda, K.; Kondoh, M.; Kawase, M.; Watari, A.; Kobayashi, M.; Tamesada, M.; Yagi, K. Hepatoprotective effect of syringic acid and vanillic acid on CCl4-induced liver injury. Biol. Pharm. Bull. 2010, 33, 983–987. [Google Scholar] [CrossRef] [PubMed]
- Shulz, H.; Baranska, M. Identification and quantification of valuable plant substances. Vib. Spectrosc. 2007, 43, 13–25. [Google Scholar] [CrossRef]
- Socrates, G. Infrared Characteristic Group Frequencies. Tables and Charts, 2nd ed.; J. Wiley and Sons: Chichester, UK, 1994. [Google Scholar]
- Ribeiro da Luz, B. Attenuated total reflectance spectroscopy of plant leaves: A tool for ecological and botanical studies. New Phytol. 2006, 172, 305–318. [Google Scholar] [CrossRef] [PubMed]
- Sanchez-Cortes, S.; Garcia-Ramos, J.V. Adsorption and chemical modification of phenols on a silver surface. J. Colloid Interf. Sci. 2000, 231, 98–106. [Google Scholar] [CrossRef] [PubMed]
- Billes, F.; Ziegler, I.M.; Mikosch, H.; Tyihak, E. Vibrational spectroscopy of resveratrol. Spectrochim. Acta A 2007, 68, 669–679. [Google Scholar] [CrossRef] [PubMed]
- Pizzeghello, D.; Cocco, S.; Francioso, O.; Ferrari, E.; Cardinali, A.; Nardi, S.; Agnelli, A.; Corti, G. Snow vole (Chionomys nivalis Martins) affects the redistribution of soil organic matter and hormone-like activity in the alpine ecosystem: Ecological implications. Ecol. Evol. 2015. [Google Scholar] [CrossRef] [PubMed]
- Nardi, S.; Carletti, P.; Pizzeghello, D.; Muscolo, A. Biological activities of humic substances. In Biophysico-Chemical Processes Involving Natural Nonliving Organic Matter in Environmental Systems. PART I. Fundamentals and impact of mineral-organic-biota interactions on the formation, transformation, turnover, and storage of natural nonliving organic matter (NOM); Senesi, N., Xing, B., Huang, P.M., Eds.; John Wiley & Sons: Hoboken, NJ, USA, 2009; Volume 2, pp. 305–340. [Google Scholar]
- Ertani, A.; Pizzeghello, D.; Altissimo, A.; Nardi, S. Use of meat hydrolyzate derived from tanning residues as plant biostimulant for hydroponically grown maize. J. Plant Nutr. Soil Sci. 2013, 176, 287–295. [Google Scholar] [CrossRef]
- Ertani, A.; Pizzeghello, D.; Baglieri, A.; Cadili, V.; Tambone, F.; Gennari, M.; Nardi, S. Humic-like substances from agro-industrial residues affect growth and nitrogen assimilation in maize (Zea mays L.) plantlets. J. Geochem. Explor. 2013, 129, 103–111. [Google Scholar] [CrossRef]
- Ertani, A.; Pizzeghello, D.; Francioso, O.; Sambo, P.; Sanchez-Cortes, S.; Nardi, S. Capsicum chinensis L. growth and nutraceutical properties are enhanced by biostimulants in a long-term period: Chemical and metabolomic approaches. Front. Plant Sci. 2014, 5, 375. [Google Scholar] [CrossRef] [PubMed]
- Canellas, L.P.; Olivares, F.L. Physiological responses to humic substances as plant growth promoter. Chem. Biol. Technol. Agricult. 2014, 3, 1–3. [Google Scholar] [CrossRef]
- Nardi, S.; Pizzeghello, D.; Remiero, F.; Rascio, N. Chemical and biochemical properties of humic substances isolated from forest soils and plant growth. Soil Sci. Soc. Am. J. 2000, 64, 639–645. [Google Scholar] [CrossRef]
- Muscolo, A.; Panuccio, M.R.; Sidari, M.; Nardi, S. The effects of humic substances on Pinus callus are reversed by 2,4-dichlorophenoxyacetic acid. J. Chem. Ecol. 2005, 31, 577–590. [Google Scholar] [CrossRef] [PubMed]
- Pizzeghello, D.; Francioso, O.; Ertani, A.; Muscolo, A.; Nardi, S. Isopentenyladenosine and cytokinin-like activity of different humic substances. J. Geochem. Explor. 2013, 129, 70–75. [Google Scholar] [CrossRef]
- Maruyama-Nakashita, A.; Nakamura, Y.; Yamaya, T.; Takahashi, H. A novel regulatory pathway of sulphate uptake in Arabidopsis roots: implication of CRE1/WOL/AHK4-mediated cytokinin-dependent regulation. Plant J. 2004, 38, 779–789. [Google Scholar] [CrossRef] [PubMed]
- Hirai, M.Y.; Fujiwara, T.; Awazuhara, M.; Kimura, Y.; Noji, M.; Saito, K. Global expression profiling of sulfur-starved Arabidopsis by DNA macroarray reveals the role of O-acetyl-l-serine as a general regulator of gene expression in response to sulfur nutrition. Plant J. 2003, 33, 651–663. [Google Scholar] [CrossRef] [PubMed]
- Eyheraguibel, B.; Silvestre, J.; Morard, P. Effects of humic substances derived from organic waste enhancement on the growth and mineral nutrition of maize. Bioresour. Technol. 2008, 99, 4206–4212. [Google Scholar] [CrossRef] [PubMed]
- Jannin, L.; Arkoun, M.; Ourry, A.; Laîné, P.; Goux, D.; Garnica, M.; Fuentes, M.; Francisco, S.S.; Baigorri, R.; Cruz, F.; et al. Microarray analysis of humic acid effects on Brassica napus growth: Involvement of N, C and S metabolisms. Plant Soil 2012, 359, 297–319. [Google Scholar] [CrossRef]
- Schiavon, M.; Pizzeghello, D.; Muscolo, A.; Vaccaro, S.; Francioso, O.; Nardi, S. High molecular size humic substances enhance phenylpropanoid metabolism in maize (Zea mays L.). J. Chem. Ecol. 2010, 36, 662–669. [Google Scholar] [CrossRef] [PubMed]
- Di Marco, G.; Gismondi, A.; Canuti, L.; Scimeca, M.; Volpe, A.; Canini, A. Tetracycline accumulates in Iberis sempervirens L. through apoplastic transport inducing oxidative stress and growth inhibition. Plant Biol. 2014, 16, 792–800. [Google Scholar] [CrossRef] [PubMed]
- Impei, S.; Gismondi, A.; Canuti, L.; Canini, A. Document Metabolic and biological profile of autochthonous Vitis vinifera L. ecotypes. Food Funct. 2015, 6, 1526–1538. [Google Scholar] [CrossRef] [PubMed]
- Raina, K.; Rajamanickam, S.; Deep, G.; Singh, M.; Agarwal, R.; Agarwal, C. Chemopreventive effects of oral gallic acid feeding on tumor growth and progression in TRAMP mice. Mol. Cancer Ther. 2008, 7, 1258–1267. [Google Scholar] [CrossRef] [PubMed]
- Machado, S. Allelopathic potential of various plant species on downy brome: Implications for weed control in wheat production. Agron. J. 2007, 99, 127–132. [Google Scholar] [CrossRef]
- Trinchera, A.; Natalini, M.; Sequi, P. Regolamento CE n. 2003/2003 03.001 del Parlamento Europeo e del Consiglio del 13 Ottobre 2003 Relativo ai Concimi; Istituto Sperimentale per la Nutrizione delle Piante: Roma, IT, 2003. [Google Scholar]
- Arnaldos, T.L.; Ferrer, M.A.; Garcia, A.A.C.; Muñoz, R. Changes in peroxidase activity and isoperoxidase pattern during strawberry (Fragaria × ananassa) callus development. J. Plant Physiol. 2001, 159, 429–435. [Google Scholar] [CrossRef]
- Audus, L.J. Plant Growth Substances. Chemistry and Physiology; Leonard Hill Books: London, UK, 1972; Volume 1, p. 533. [Google Scholar]
- Pizzeghello, D.; Nicolini, G.; Nardi, S. Hormone-like activities of humic substances in different forest ecosystems. New Phytol. 2002, 155, 393–402. [Google Scholar] [CrossRef]
- Nardi, S.; Muscolo, A.; Vaccaro, S.; Baiano, S.; Spaccini, R.; Piccolo, A. Relationships between molecular characteristics of soil humic fractions and glycolytic pathway and krebs cycle in maize seedlings. Soil Biol. Biochem. 2007, 39, 3138–3146. [Google Scholar] [CrossRef]
- Bradford, M.M. A rapid and sensitive method for the quantification of microgram quantities of protein utilizing the principle of protein-dye binding. Anal. Biochem. 1976, 72, 248–254. [Google Scholar] [CrossRef]
- Pizzeghello, D.; Zanella, A.; Carletti, P.; Nardi, S. Chemical and biological characterization of dissolved organic matter from silver fir and beech forest soils. Chemosphere 2006, 65, 190–200. [Google Scholar] [CrossRef] [PubMed]
- Wellburn, A.R.; Lichtenthaler, H. Formulae and program determine carotenoids and chlorophyll a and b of leaf extracts inferent solvents. In Advances in Photosynthesis Research; Nijhorff, M.E., Junk, W., Eds.; The Hague: Boston, MA, USA, 1984; pp. 272–284. [Google Scholar]
- Mori, T.; Sakurai, M.; Sakuta, M. Effects of conditioned medium on activities of PAL, CHS, DAHP synthase (DS-Co and DS-Mn) and anthocyanin production in suspension cultures of Fragaria ananassa. Plant Sci. 2001, 160, 355–360. [Google Scholar] [CrossRef]
- Sokal, R.R.; Rohlf, F.J. Biometry; Freeman and Company: San Francisco, CA, USA, 1969. [Google Scholar]
- Sample Availability: Samples of the compounds are not available from the authors.
© 2016 by the authors. Licensee MDPI, Basel, Switzerland. This article is an open access article distributed under the terms and conditions of the Creative Commons by Attribution (CC-BY) license ( http://creativecommons.org/licenses/by/4.0/).
Share and Cite
Ertani, A.; Pizzeghello, D.; Francioso, O.; Tinti, A.; Nardi, S. Biological Activity of Vegetal Extracts Containing Phenols on Plant Metabolism. Molecules 2016, 21, 205. https://doi.org/10.3390/molecules21020205
Ertani A, Pizzeghello D, Francioso O, Tinti A, Nardi S. Biological Activity of Vegetal Extracts Containing Phenols on Plant Metabolism. Molecules. 2016; 21(2):205. https://doi.org/10.3390/molecules21020205
Chicago/Turabian StyleErtani, Andrea, Diego Pizzeghello, Ornella Francioso, Anna Tinti, and Serenella Nardi. 2016. "Biological Activity of Vegetal Extracts Containing Phenols on Plant Metabolism" Molecules 21, no. 2: 205. https://doi.org/10.3390/molecules21020205
APA StyleErtani, A., Pizzeghello, D., Francioso, O., Tinti, A., & Nardi, S. (2016). Biological Activity of Vegetal Extracts Containing Phenols on Plant Metabolism. Molecules, 21(2), 205. https://doi.org/10.3390/molecules21020205