
Urinary Metabolomic Profiling in Zucker Diabetic Fatty Rats with Type 2 Diabetes Mellitus Treated with Glimepiride, Metformin, and Their Combination

Abstract
:1. Introduction
2. Discussion
3. Results
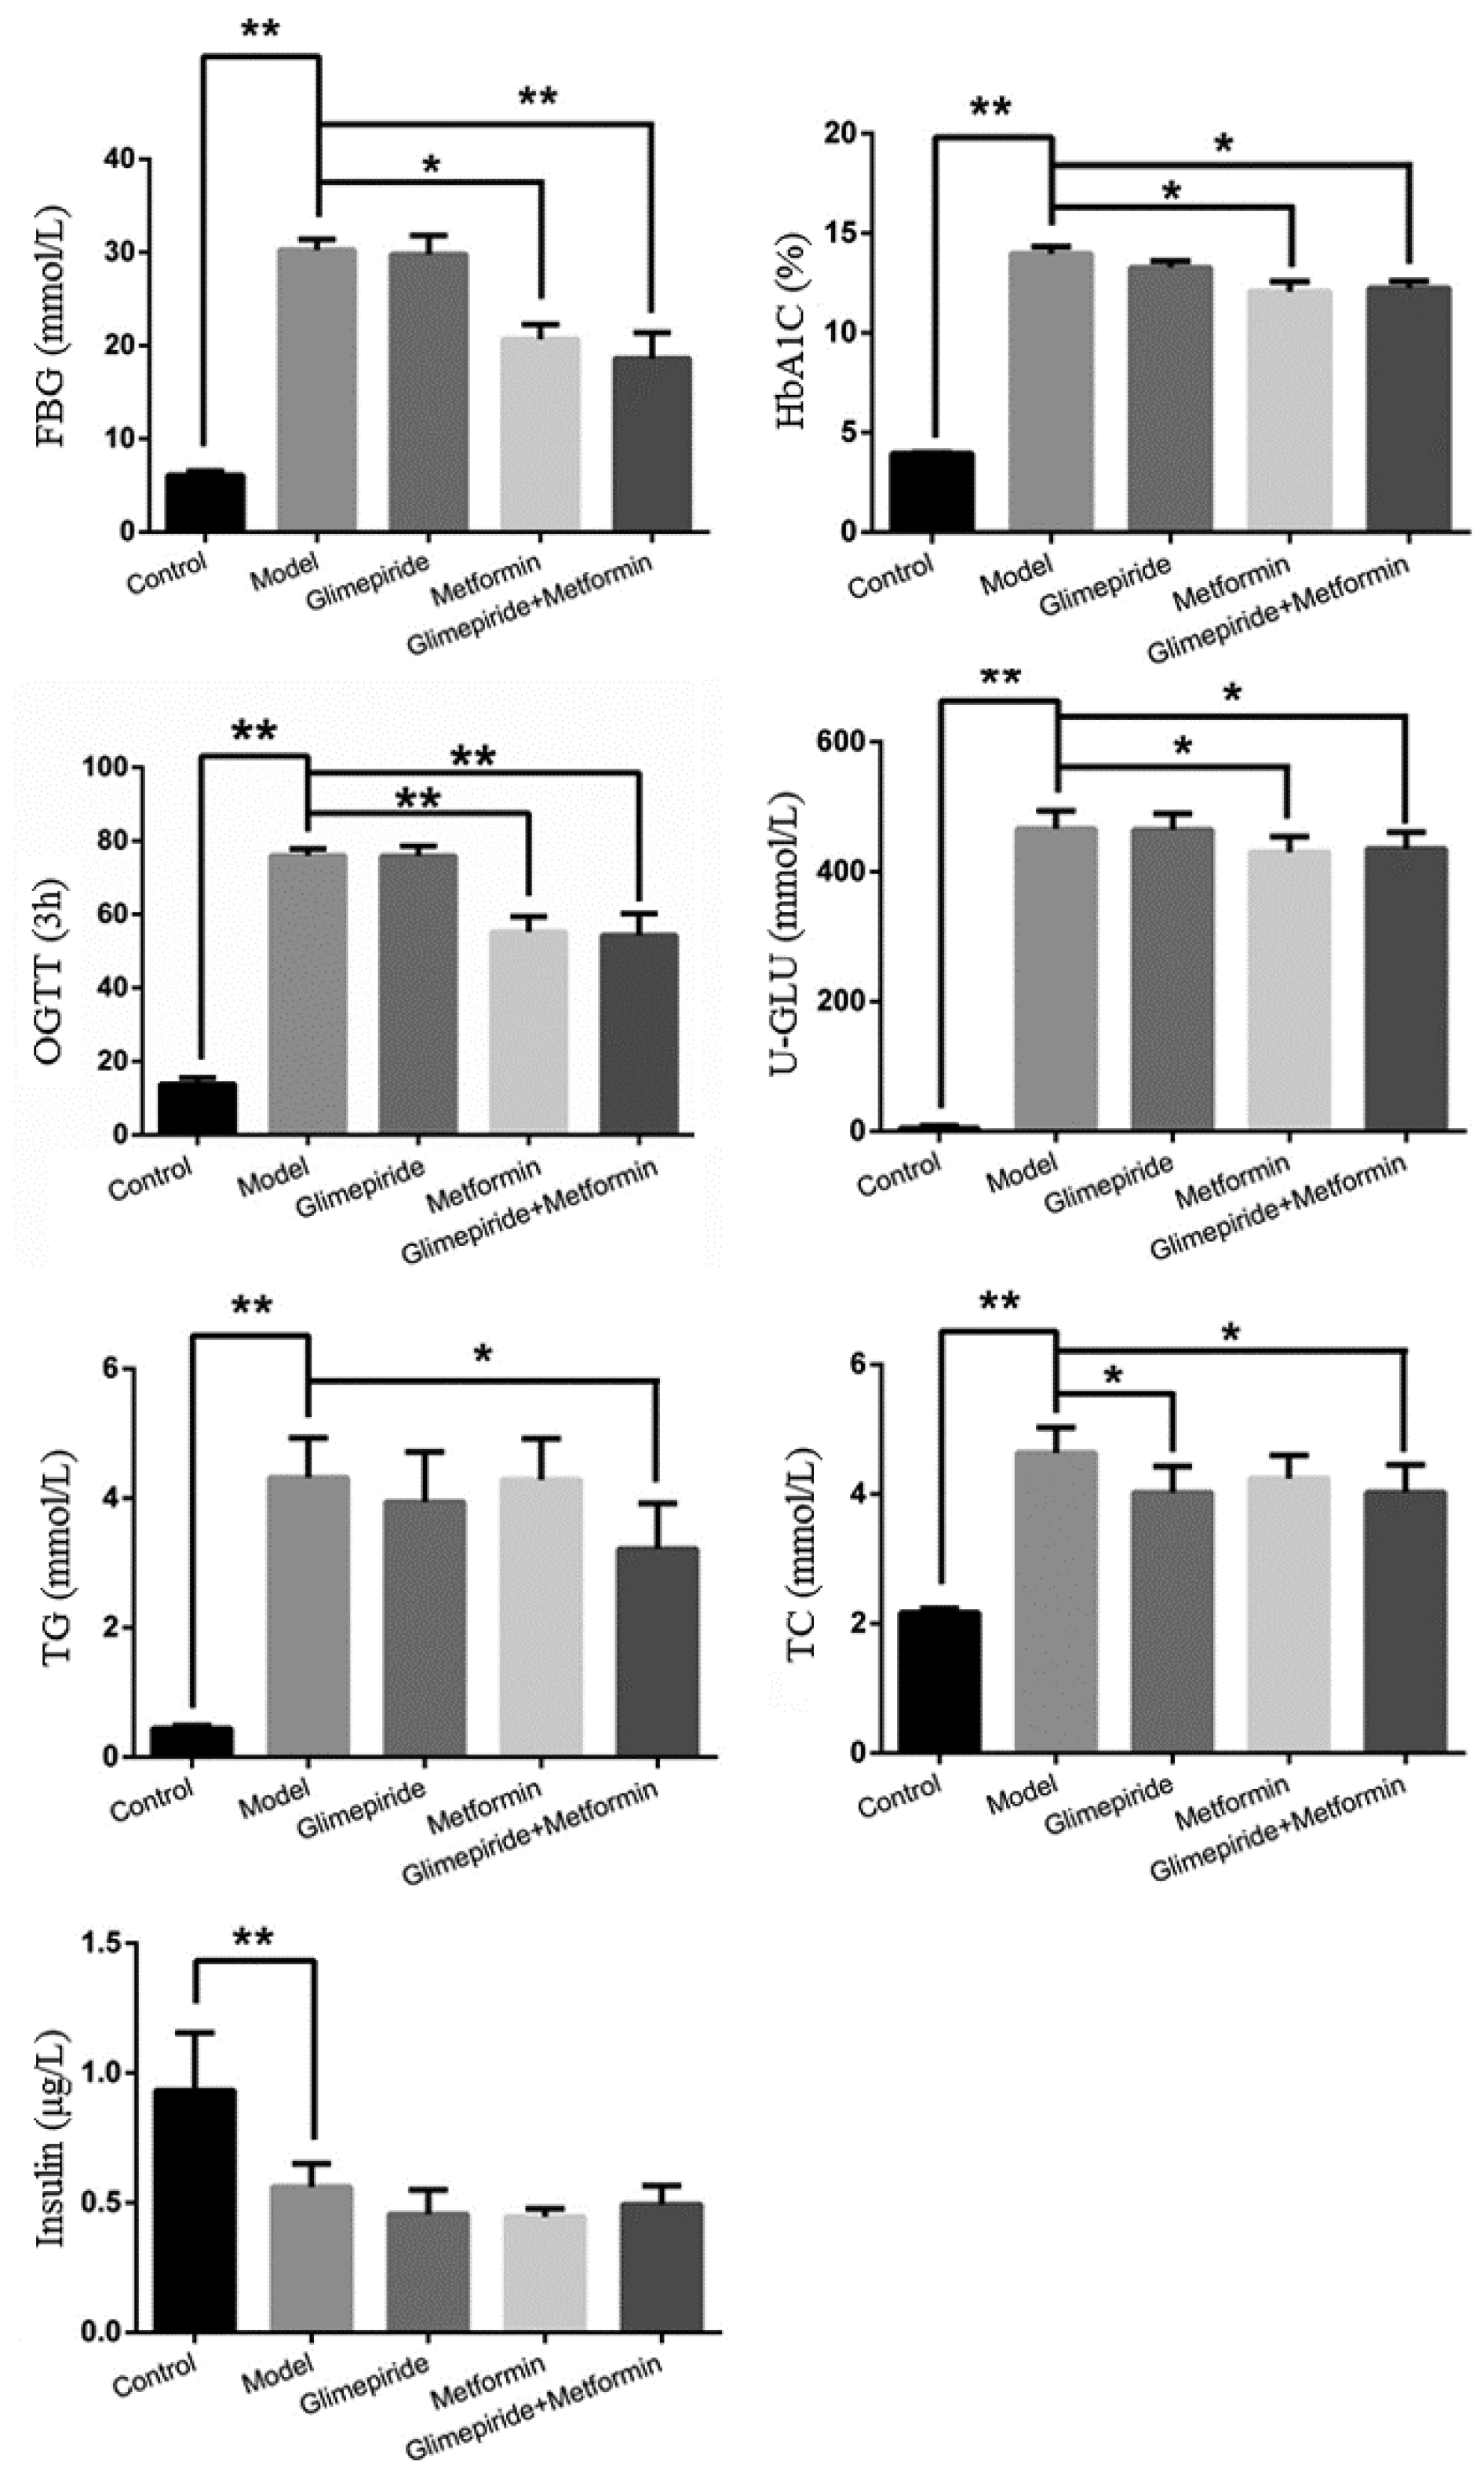
3.1. The Therapeutic Effects of Glimepiride, Metformin, and Their Combination
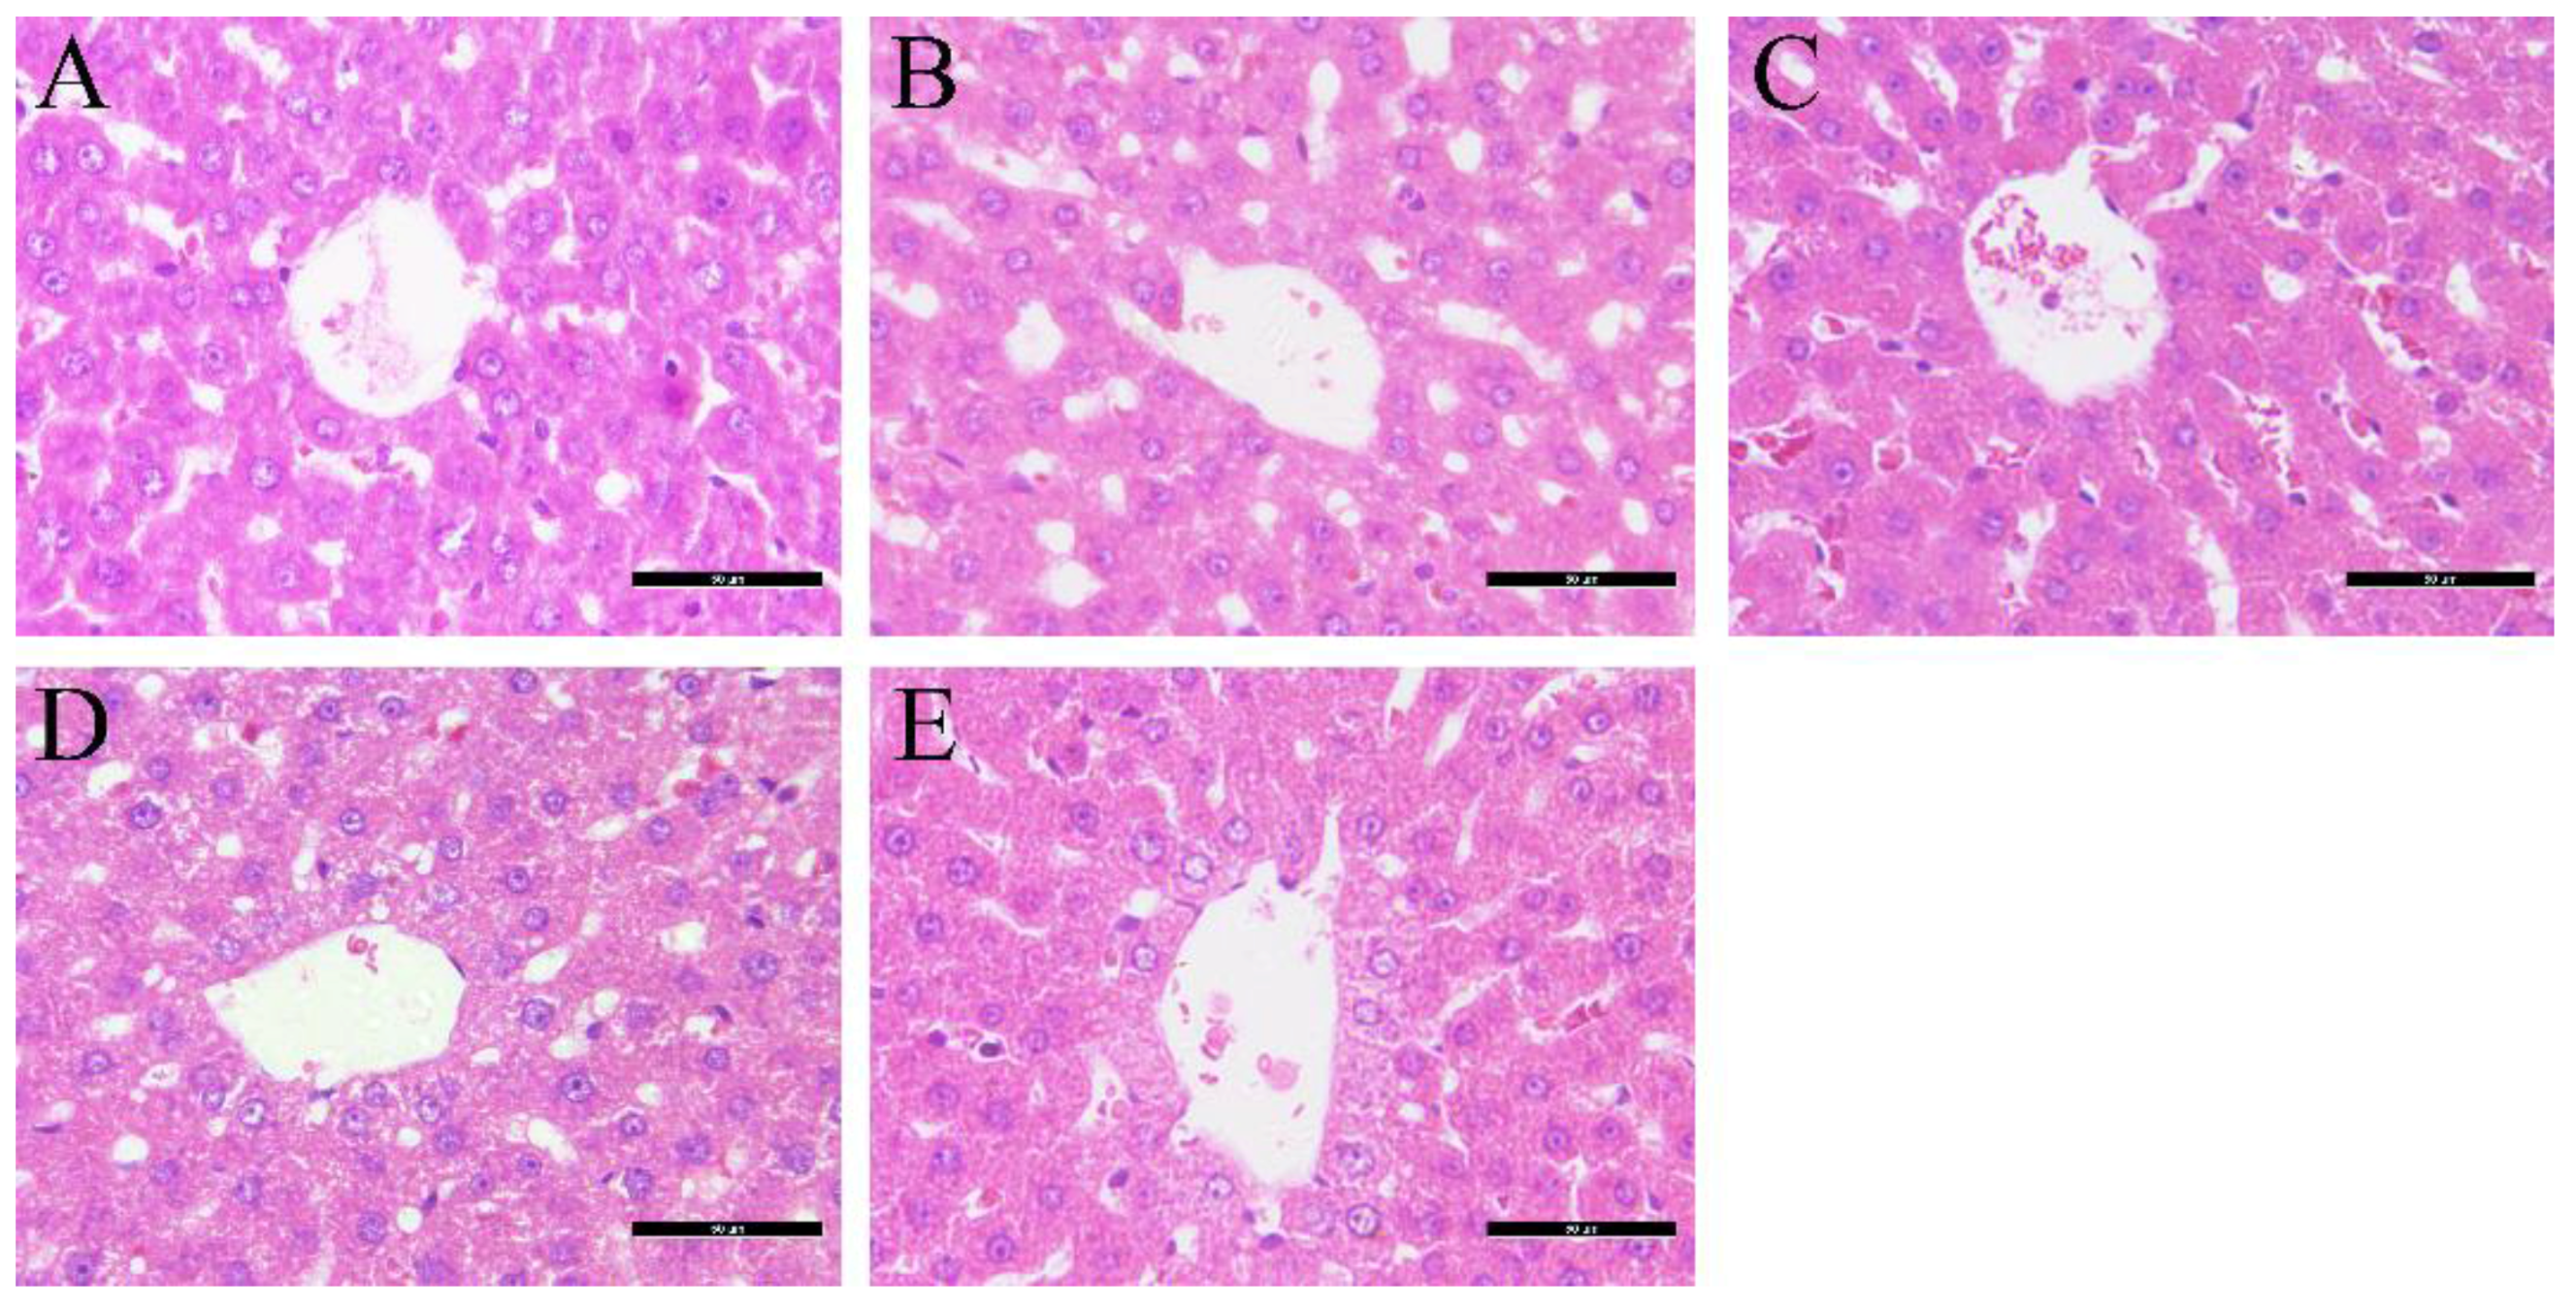
3.2. Effects of Glimepiride, Metformin, and Their Combination Therapies on Histopathological Changes in the Liver
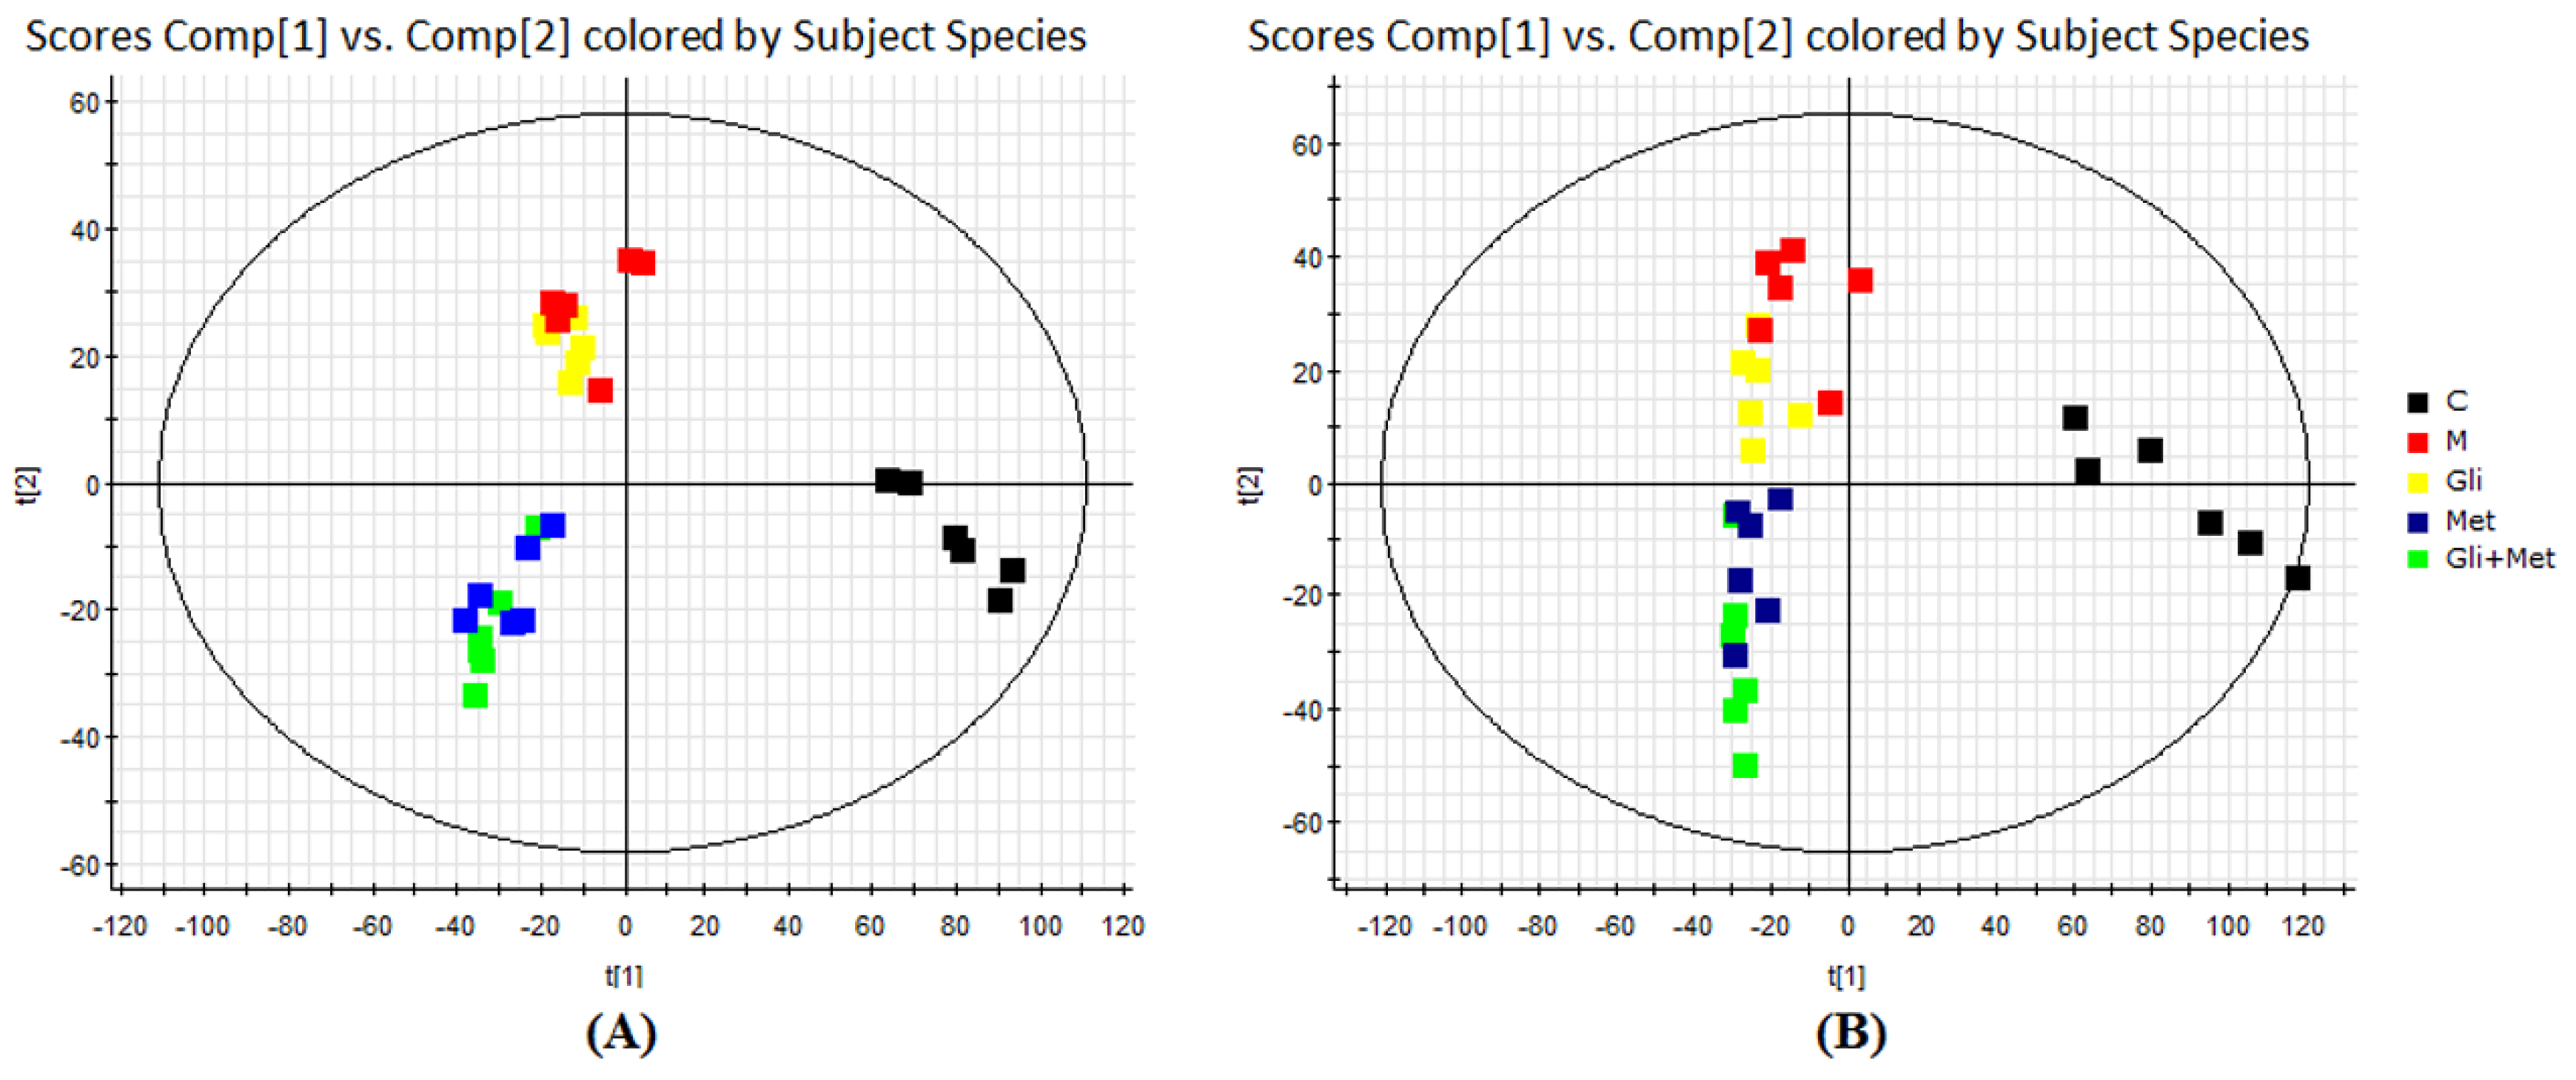
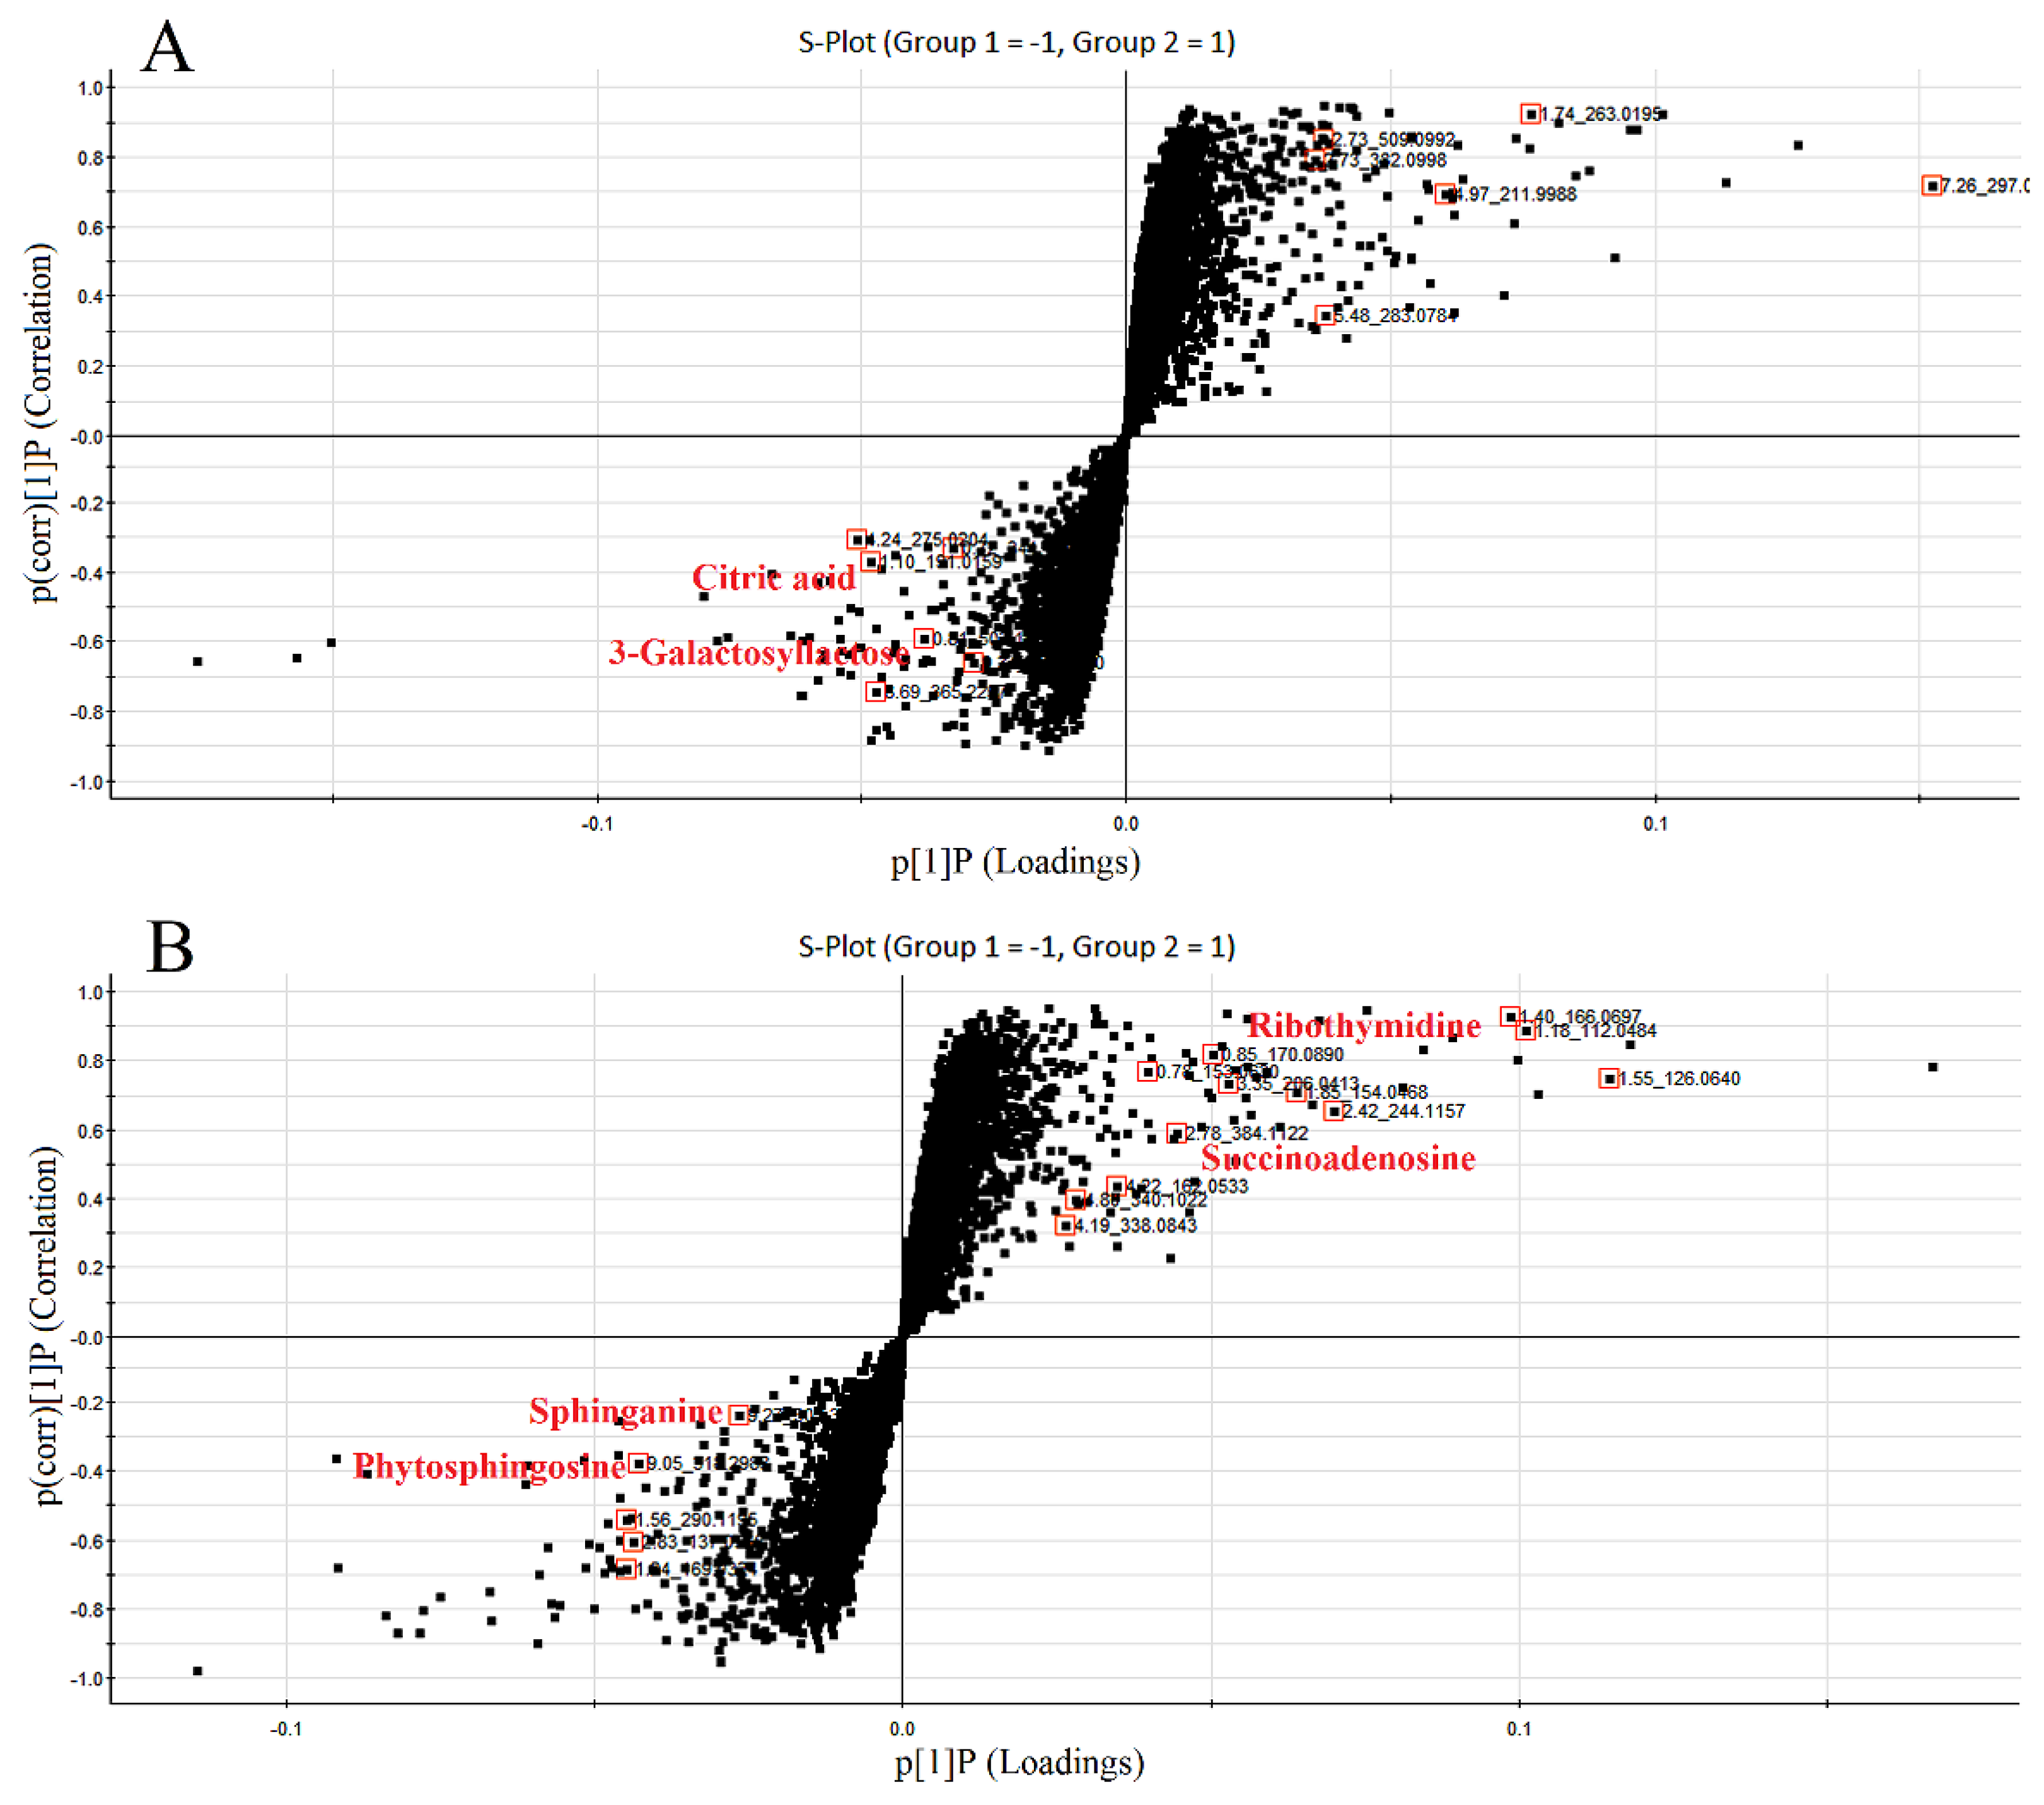
3.3. UHPLC/ESI-QTOF-MS Analysis of Urine Metabolic Profiles
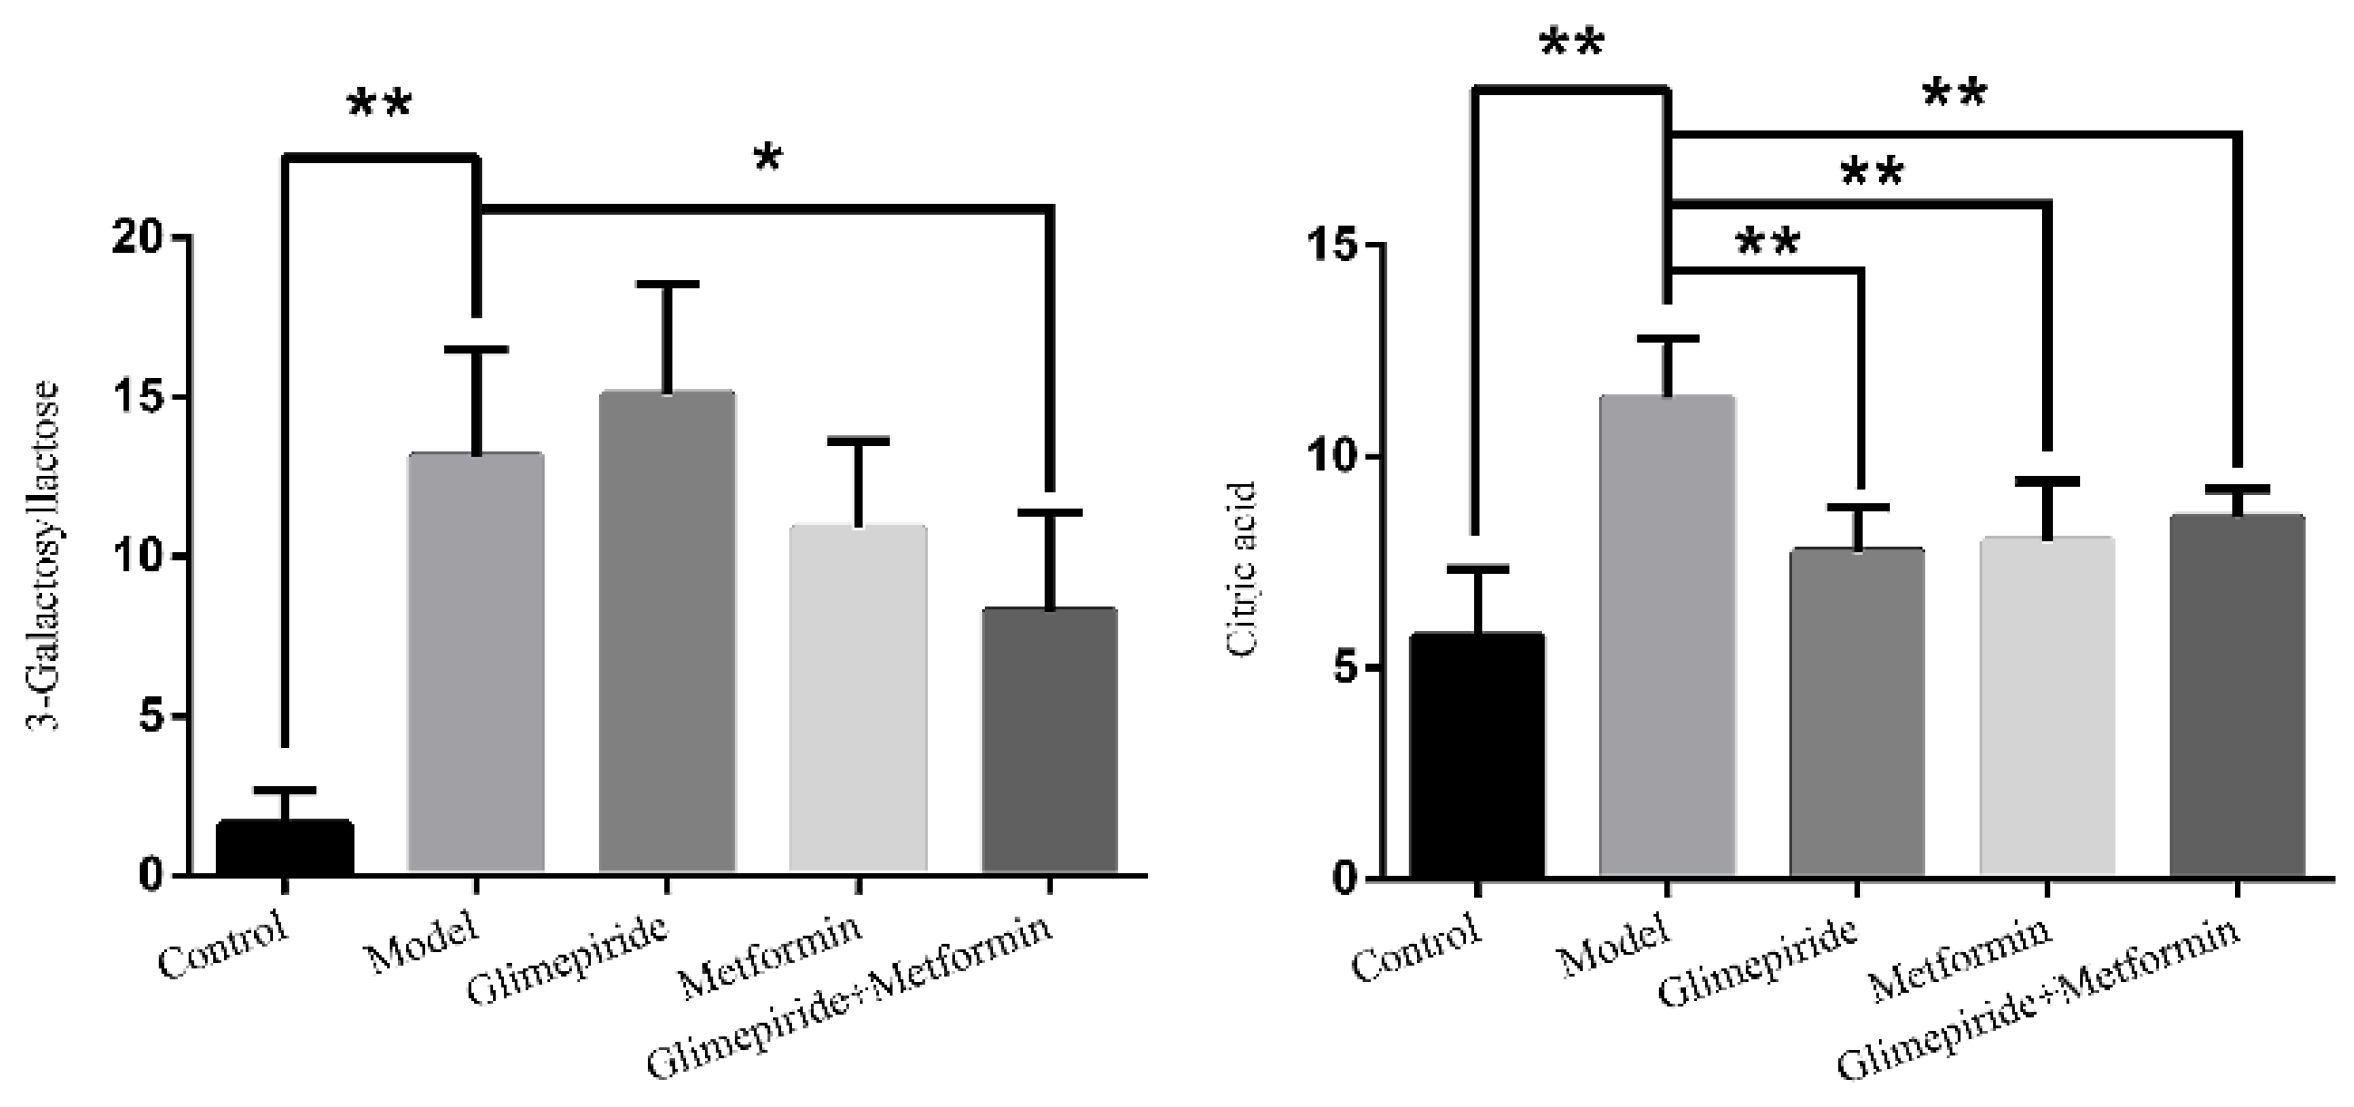
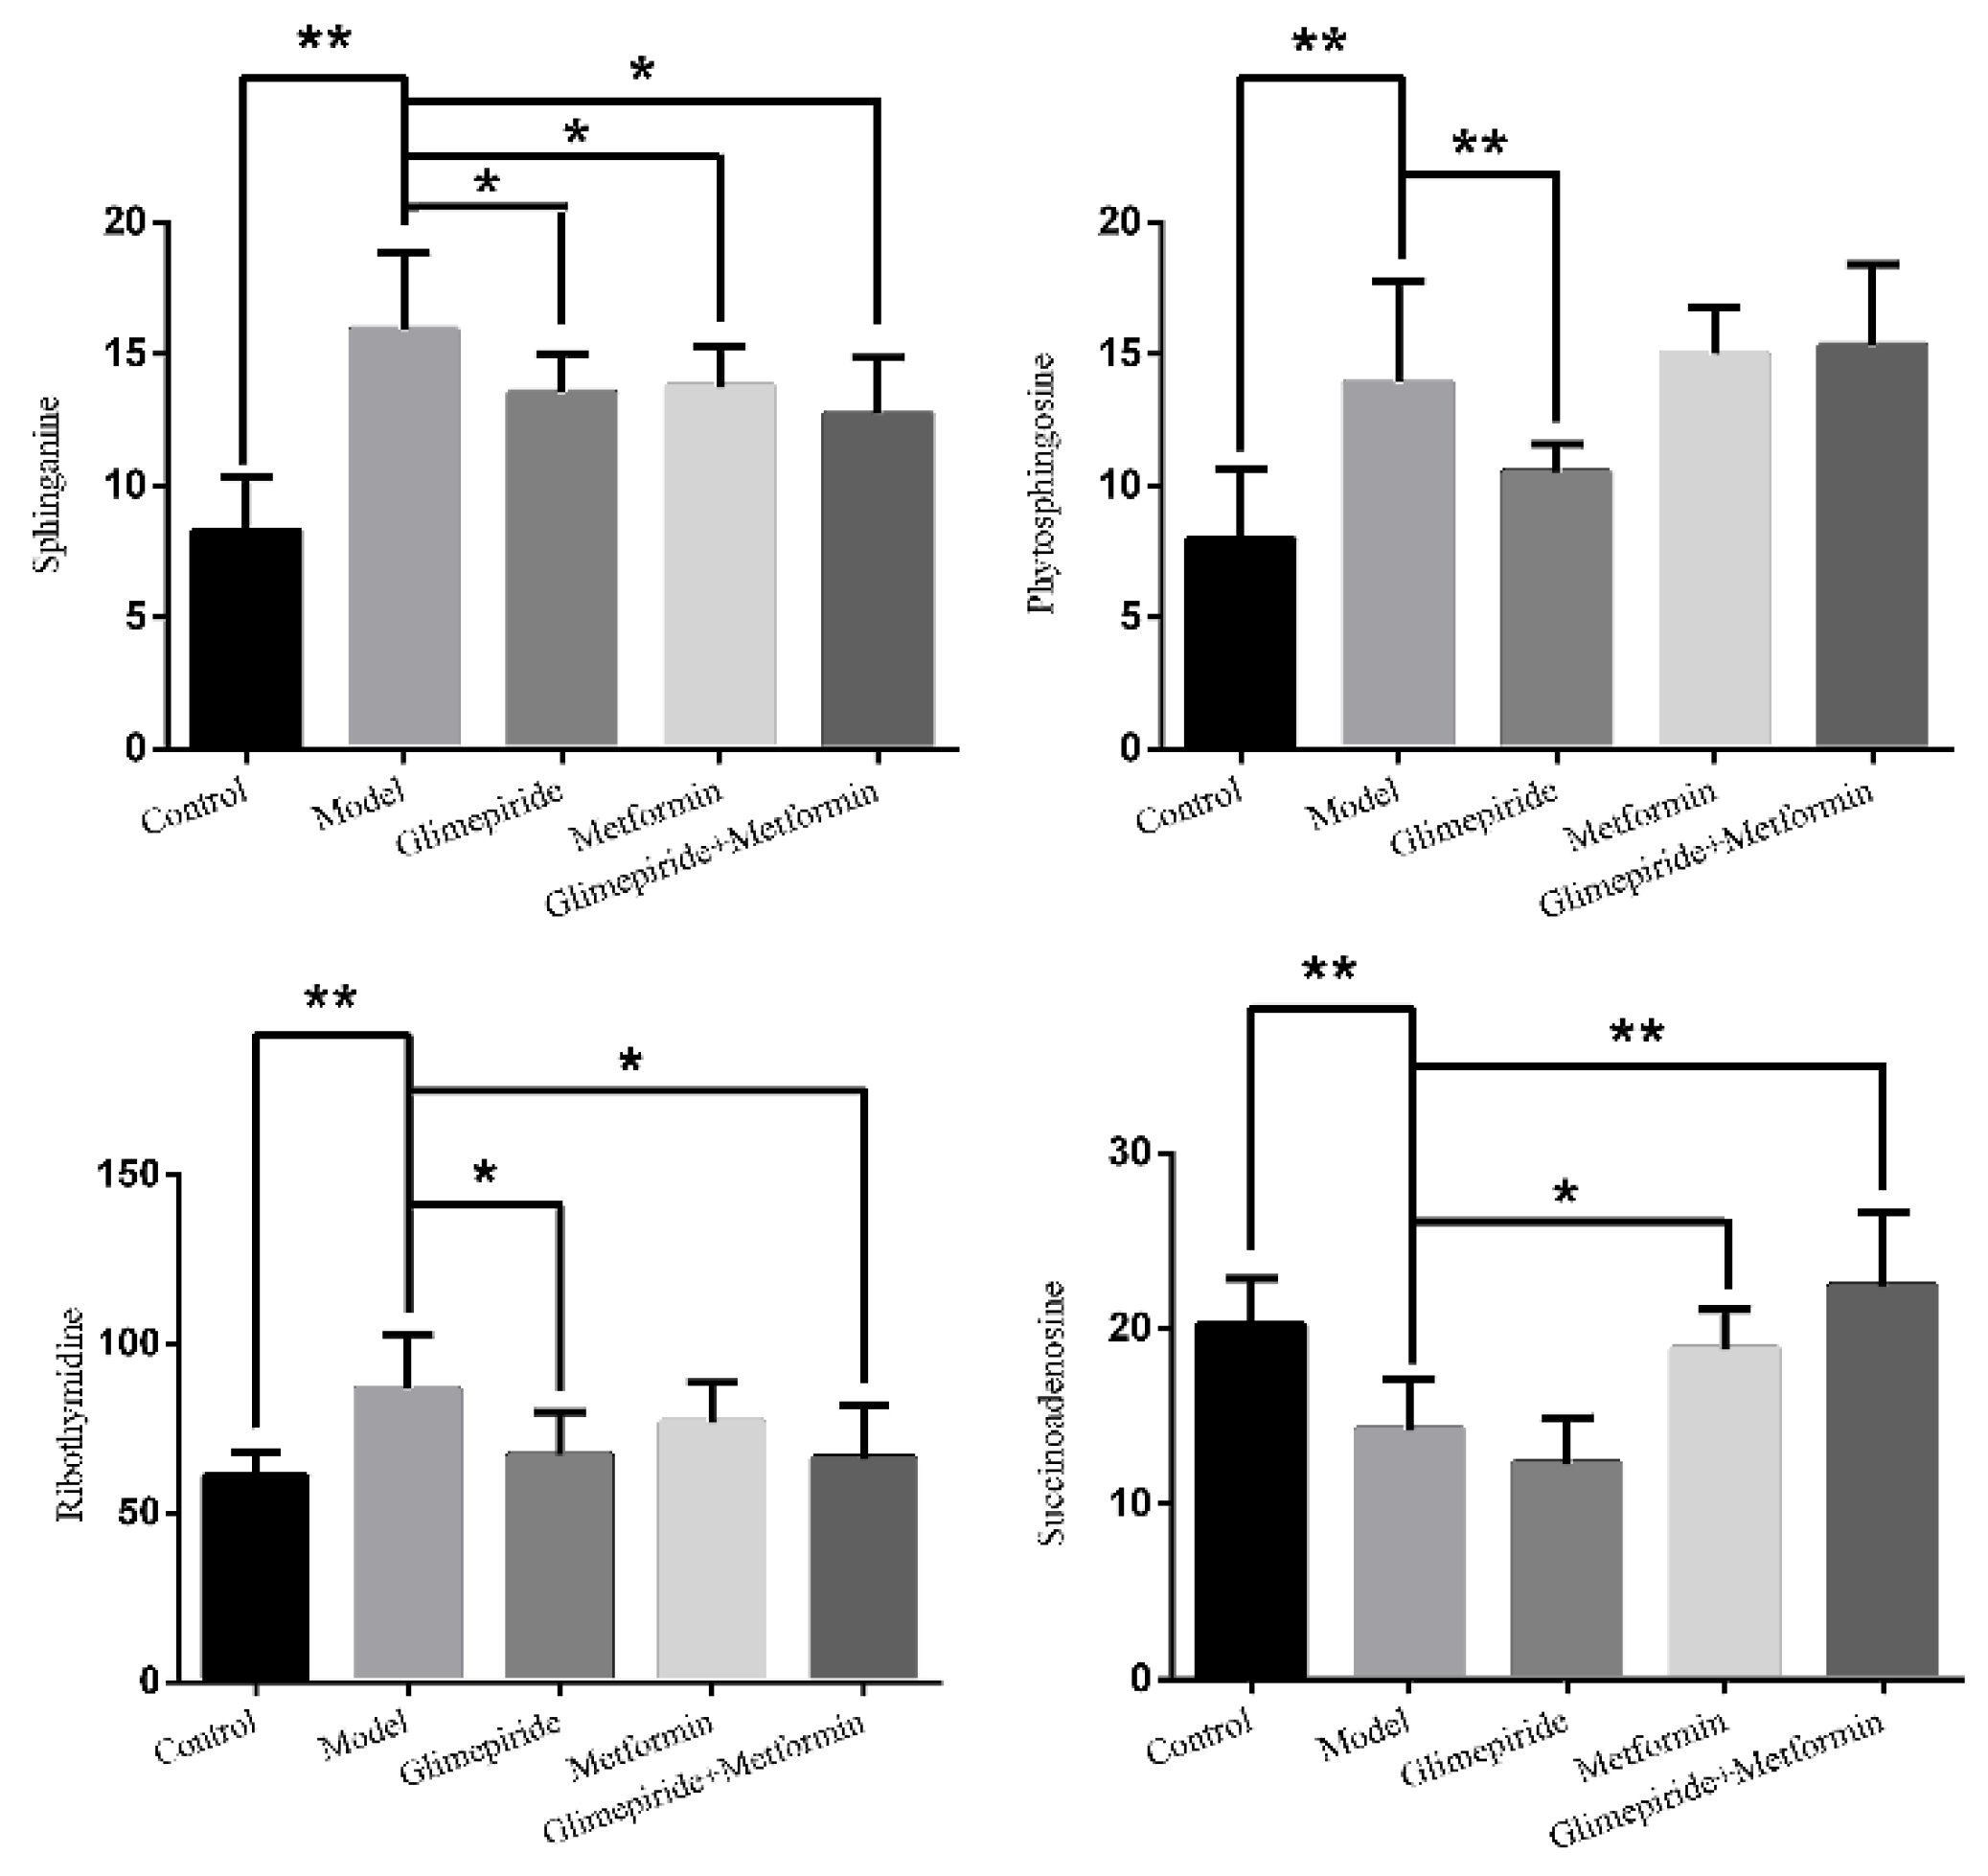
3.4. Identification of Biomarkers Related to These Therapies in ZDF Rats
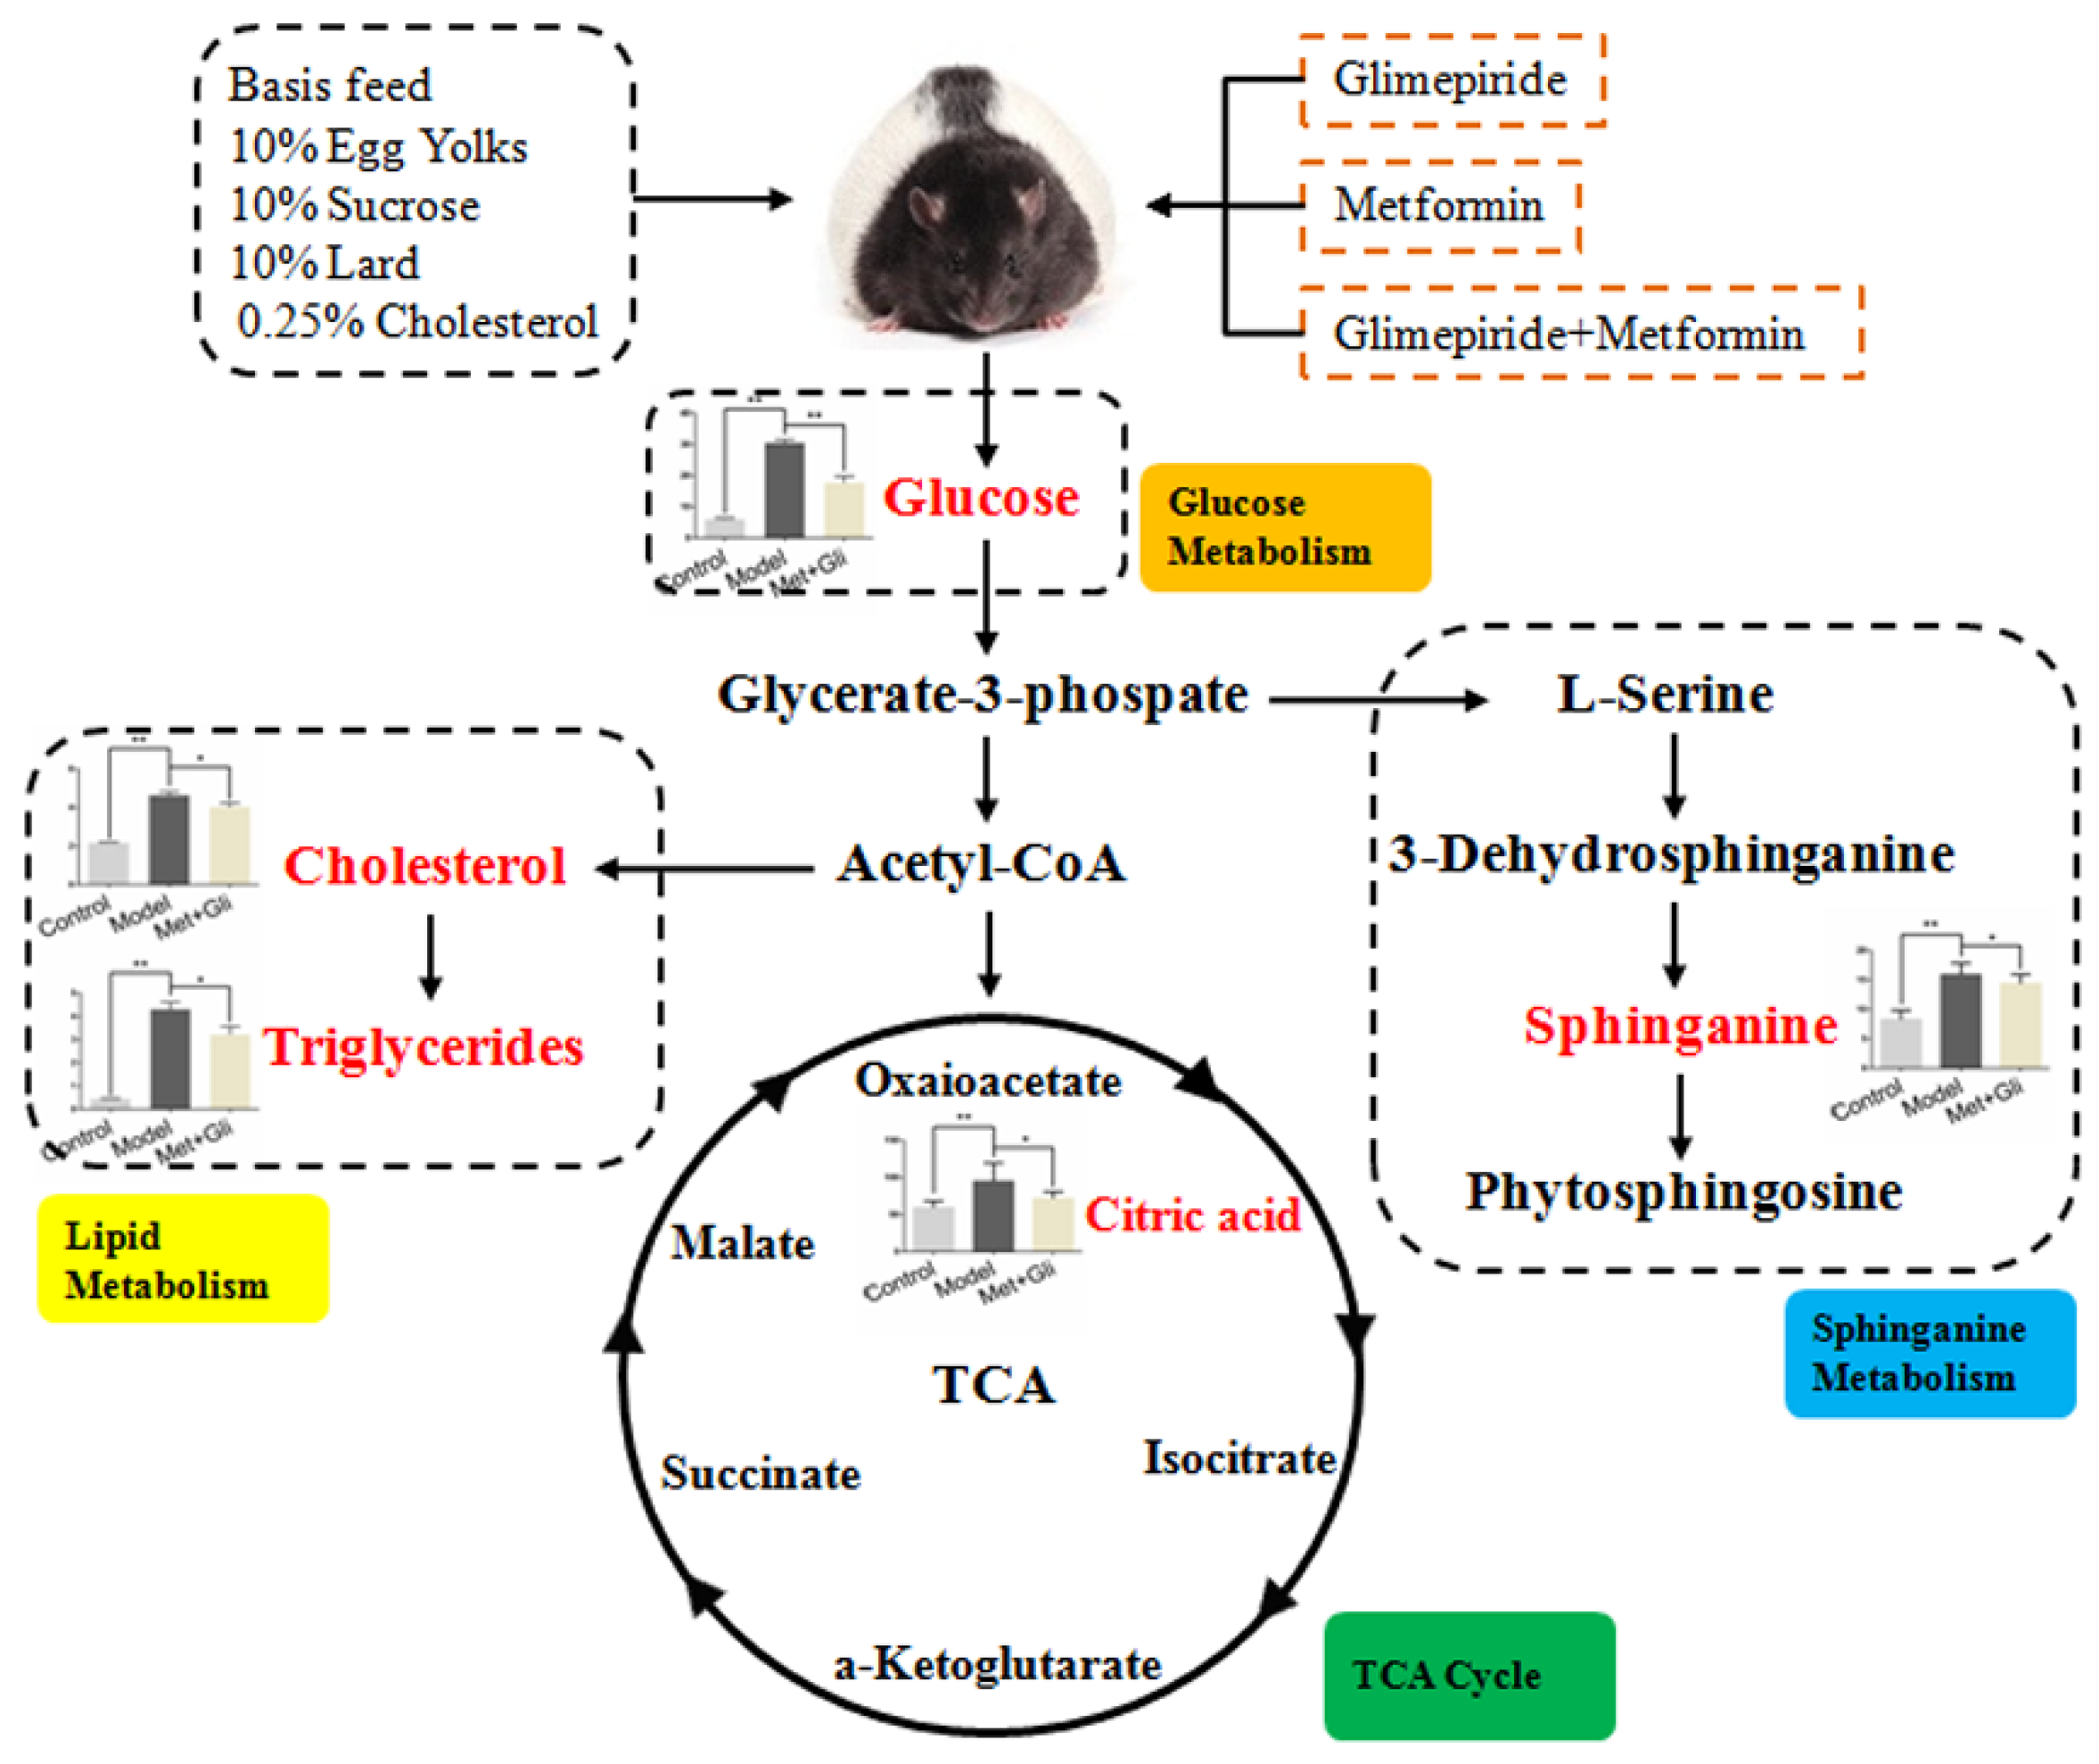
3.5. Analysis of Biomarker Networks and Reconstruction of Metabolic Pathways
4. Materials and Methods
4.1. Chemicals and Materials
4.2. Ethics Statement
4.3. Animal Handling
4.4. Measurement of Standard Biochemical Parameters
4.5. Observation of Liver Histopathology
4.6. Urinary Sample Collection and Preparation
4.7. Metabolic Profiling
4.8. Statistical Analysis
5. Conclusions
Acknowledgments
Author Contributions
Conflicts of Interest
References
- Guariguata, L.; Whiting, D.R.; Hambleton, I.; Beagley, J.; Linnenkamp, U.; Shaw, J.E. Global estimates of diabetes prevalence for 2013 and projections for 2035. Diabetes Res. Clin. Pract. 2014, 3, 137–149. [Google Scholar] [CrossRef] [PubMed]
- Dall, T.M.; Zhang, Y.; Chen, Y.J.; Quick, W.W.; Yang, W.G.; Fogli, J. The economic burden of diabetes. Health Aff. 2010, 29, 297–303. [Google Scholar] [CrossRef] [PubMed]
- American Diabetes Association. Diagnosis and classification of diabetes mellitus. Diabetes Care 2014, 37, S81–S90. [Google Scholar]
- Esser, N.; Legrand-Poels, S.; Piette, J.; Scheen, A.J.; Paquot, N. Inflammation as a link between obesity, metabolic syndrome and type 2 diabetes. Diabetes Res. Clin. Pract. 2014, 105, 141–150. [Google Scholar] [CrossRef] [PubMed]
- Kream, R.M.; Mantione, K.J.; Casares, F.M.; Stefano, G.B. Impaired expression of ATP-binding cassette transporter genes in diabetic ZDF rat blood. Int. J. Diabetes Res. 2014, 3, 49–55. [Google Scholar]
- Dong, Y.; Chen, Y.T.; Yang, Y.X.; Zhou, X.J.; Dai, S.J.; Tong, J.F.; Shou, D.; Li, C.Y. Metabolomics study of type 2 diabetes mellitus and the antiDiabetic effect of berberine in zucker diabetic fatty rats using Uplc-ESI-Hdms. Phytother. Res. 2016, 30, 823–828. [Google Scholar] [CrossRef] [PubMed]
- Kabadi, U.M. Sulfonylurea Glimepiride: A Proven Cost Effective, Safe and Reliable War Horse in Combating Hyperglycemia in Type 2 Diabetes. J. Diabetes Mellit. 2015, 5, 211–226. [Google Scholar] [CrossRef]
- Briscoe, V.J.; Griffith, M.L.; Davis, S.N. The role of glimepiride in the treatment of type 2 diabetes mellitus. Expert Opin. Drug Metab. Toxicol. 2010, 6, 225–235. [Google Scholar] [CrossRef] [PubMed]
- Pernicova, I.; Korbonits, M. Metformin—Mode of action and clinical implications for diabetes and cancer. Nat. Rev. Endocrinol. 2014, 10, 143–156. [Google Scholar] [CrossRef] [PubMed]
- Madiraju, A.K.; Erion, D.M.; Rahimi, Y.; Zhang, X.M.; Braddock, D.; Albright, R.A.; Prigaro, B.J.; Wood, J.L.; Bhanot, S.; Macdonald, M.J.; et al. Metformin suppresses gluconeogenesis by inhibiting mitochondrial glycerophosphate dehydrogenase. Nature 2014, 510, 542–546. [Google Scholar] [CrossRef] [PubMed]
- Meng, S.; Cao, J.; He, Q.; Xiong, L.; Chang, E.; Radovick, S.; Wondisford, F.E.; He, L. Metformin activates AMP-activated protein kinase by promoting formation of the αβγ heterotrimeric complex. J. Biol. Chem. 2015, 290, 3793–3802. [Google Scholar] [CrossRef] [PubMed]
- Cao, J.; Meng, S.; Chang, E.; Beckwith-Fickas, K.; Xiong, L.; Cole, R.N.; Radovica, S.; Wondisford, F.E.; He, L. Low concentrations of metformin suppress glucose production in hepatocytes through AMP-activated protein kinase (AMPK). J. Biol. Chem. 2014, 289, 20435–20446. [Google Scholar] [CrossRef] [PubMed]
- Park, C.Y.; Kang, J.G.; Chon, S.; Noh, J.; Oh, S.J.; Lee, C.B.; Park, S.W. Comparison between the therapeutic effect of metformin, glimepiride, and their combination as an add-on treatment to insulin glargine in uncontrolled patients with type 2 diabetes. PLoS ONE 2014, 9, e87799. [Google Scholar] [CrossRef] [PubMed]
- Evert, A.B.; Boucher, J.L.; Cypress, M.; Dunbar, S.A.; Franz, M.J.; Mayer-Davis, E.J.; Neumiller, J.J.; Nwankwo, R.; Verdi, C.L.; Urbanski, P.; et al. Nutrition therapy recommendations for the management of adults with diabetes. Diabetes Care 2014, 37 (Suppl. 1), S120–S143. [Google Scholar] [CrossRef] [PubMed]
- Gregg, E.W.; Li, Y.; Wang, J.; Rios Burrows, N.; Ali, M.K.; Rolka, D.; Williams, D.E.; Geiss, L. Changes in diabetes-related complications in the United States, 1990–2010. N. Engl. J. Med. 2014, 370, 1514–1523. [Google Scholar] [CrossRef] [PubMed]
- Gæde, P.; Vedel, P.; Larsen, N.; Jensen, G.V.; Parving, H.H.; Pedersen, O. Multifactorial intervention and cardiovascular disease in patients with type 2 diabetes. N. Engl. J. Med. 2003, 348, 383–393. [Google Scholar] [CrossRef] [PubMed]
- Yokoi, N.; Hoshino, M.; Hidaka, S.; Yoshida, E.; Beppu, M.; Hoshikawa, R.; Sudo, K.; Kawada, A.; Takagi, S.; Hoshikawa, R. A Novel Rat Model of Type 2 Diabetes: The Zucker Fatty Diabetes Mellitus ZFDM Rat. J. Diabetes Res. 2013, 2013, 310–319. [Google Scholar] [CrossRef] [PubMed]
- Schernthaner, G.; Rosas-Guzmán, J.; Dotta, F.; Guerci, B.; Simó, R.; Festa, A.; Kiljański, J.; Zhou, M.; Gallwitz, B. Treatment escalation options for patients with type 2 diabetes after failure of exenatide twice daily or glimepiride added to metformin: Results from the prospective European Exenatide (EUREXA) study. Diabetes Obes. Metab. 2015, 17, 689–698. [Google Scholar] [CrossRef] [PubMed]
- Buse, J.B.; DeFronzo, R.A.; Rosenstock, J.; Kim, T.; Burns, C.; Skare, S.; Baron, A.; Fineman, M. The primary glucose-lowering effect of metformin resides in the gut, not the circulation: results from short-term pharmacokinetic and 12-week dose-ranging studies. Diabetes Care 2016, 39, 198–205. [Google Scholar] [CrossRef] [PubMed]
- Ferrannini, E. The target of metformin in type 2 diabetes. N. Engl. J. Med. 2014, 371, 1547–1548. [Google Scholar] [PubMed]
- Yun, H.Y.; Park, H.C.; Kang, W.; Kwon, K.I. Pharmacokinetic and pharmacodynamic modelling of the effects of glimepiride on insulin secretion and glucose lowering in healthy humans. J. Clin. Pharm. Ther. 2006, 31, 469–476. [Google Scholar] [CrossRef] [PubMed]
- Lakey, J.R.; Suarez-Pinzon, W.L.; Strynadka, K.; Korbutt, G.S.; Rajotte, R.V.; Mabley, J.G.; Szabó, C.; Rabinovitch, A. Peroxynitrite is a mediator of cytokine-induced destruction of human pancreatic islet beta cells. Lab. Investig. 2001, 81, 1683–1692. [Google Scholar] [CrossRef] [PubMed]
- Karbalaei, N.; Noorafshan, A.; Hoshmandi, E. Impaired glucose-stimulated insulin secretion and reduced beta cell mass in pancreatic islets of hyperthyroid rats. Exp. Physiol. 2016, 101, 1114–1127. [Google Scholar] [CrossRef] [PubMed]
- Akram, M. Citric acid cycle and role of its intermediates in metabolism. Cell Biochem. Biophys. 2014, 68, 475–478. [Google Scholar] [CrossRef] [PubMed]
- Song, D.K.; Ashcroft, F.M. Glimepiride block of cloned beta-cell, cardiac and smooth muscle K(ATP) channels. Br. J. Pharmacol. 2001, 133, 193–199. [Google Scholar] [CrossRef] [PubMed]
- Merrill, A.H.; Lingrell, S.; Wang, E.; Nikolova-Karakashian, M.; Vales, T.R.; Vance, D.E. Sphingolipid biosynthesis de novo by rat hepatocytes in culture. Ceramide and sphingomyelin are associated with, but not required for, very low density lipoprotein secretion. J. Biol. Chem. 1995, 270, 13834–13841. [Google Scholar] [CrossRef] [PubMed]
- Jung, S.; Kim, M.; Ryu, H.J.; Chae, J.S.; Lee, S.H.; Lee, J.H. Age-related increase in LDL-cholesterol is associated with enhanced oxidative stress and disturbed sphingolipid metabolism. Metabolomics 2015, 11, 40–49. [Google Scholar] [CrossRef]
- Sample Availability: Samples of the rat urine are available from the authors.


| Index | Group | 0 W | 4 W | 8 W | 12 W |
|---|---|---|---|---|---|
| Body weight | Con | 290.8 ± 14.04 * | 332.6 ± 11.76 * | 358.8 ± 12.95 | 373.6 ± 15.16 |
| Body weight | Mod | 365.0 ± 2.738 | 360.0 ± 9.407 * | 354.8 ± 11.69 | 361.2 ± 12.52 |
| Body weight | Gli | 361.2 ± 4.086 | 337.4 ± 5.413 | 341.2 ± 7.190 | 335.0 ± 11.47 * |
| Body weight | Met | 369.2 ± 8.288 | 351.4 ± 8.933 | 348.8 ± 9.200 | 329.4 ± 7.540 * |
| Body weight | Gli + Met | 354.2 ± 21.02 | 345.4 ± 18.36 | 331.4 ± 20.12 | 306.0 ± 21.34 ** |
| Urine volume | Con | 11.68 ± 1.940 ** | 10.70 ± 3.940 ** | 13.56 ± 3.930 ** | 9.06 ± 3.380 ** |
| Urine volume | Mod | 84.68 ± 15.67 | 103.6 ± 15.78 | 108.3 ± 10.13 | 96.68 ± 12.19 |
| Urine volume | Gli | 79.12 ± 10.29 | 69.68 ± 18.20 ** | 97.38 ± 15.95 | 80.44 ± 23.04 |
| Urine volume | Met | 72.68 ± 19.39 | 77.58 ± 16.94 * | 71.60 ± 14.63 * | 82.96 ± 1.100 |
| Urine volume | Gli + Met | 83.54 ± 7.450 | 79.06 ± 16.84 * | 72.10 ± 11.97 ** | 65.94 ± 10.81 * |
| Time | Mass | ppm | Formula | Mass Fragments | Structure | Compound |
|---|---|---|---|---|---|---|
| 0.81 | 503.1589 | −4.6 | C18H32O16 | 509 [M − H]−, 383 [M − H − C4H8O4]−, 323 [M − H − C6H12O6]−, 221 [M − H − C10H18O9]−, 110 [M − H − C12H24O14]−, 89 M − H − C15H26O13]− |  | 3-Galactosyl lactose |
| 1.10 | 191.02 | 4.2 | C6H8O7 | 191 [M − H]−, 173 [M − H − OH]−, 129 [M − H − CH2O3]−, 111 [M − H − CH4O4]−, 85 [M − H − CH6O4]−, 67 [M − H − C2H4O6]− | 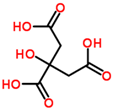 | Citric acid |
| 2.75 | 382.0994 | −1.3 | C14H17N5O8 | 382 [M − H]−, 364 [M − H − H2O]−, 302 [M − H − CH4O4]−, 266 [M − H − C4H4O4]−, 206 [M − H − C6H8O6]−, 133 [M − H − C9H7N5O4]− |  | Succinoadenosine |
| 0.81 | 259.092 | −3.9 | C10H14N2O6 | 259 [M + H]+, 242 [M + H − NH3]+, 215 [M + H − CH2NO]+, 127 [M + H − C5H10NO3]+, 81 [M + H − C5H10N2O5]+ | 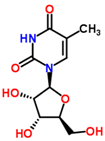 | Ribothymidine |
| 9.05 | 318.3012 | 1.3 | C18H39NO3 | 318 [M + H]+, 300 [M + H − H2O]+, 261 [M + H − C4H9]+, 256 [M + H − C2H8NO]+, 228 [M + H − C5H14O]+, 102 [M + H − C13H30NO]+ |  | Phytosphingosine |
| 9.27 | 302.3071 | 4.0 | C18H39NO2 | 302 [M + H]+, 284 [M + H − H2O]+, 258 [M + H − C2H4O3]+, 240 [M + H − C2H6O4]+ | 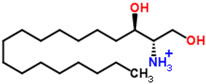 | Sphinganine |
© 2016 by the authors. Licensee MDPI, Basel, Switzerland. This article is an open access article distributed under the terms and conditions of the Creative Commons Attribution (CC-BY) license ( http://creativecommons.org/licenses/by/4.0/).
Share and Cite
Dong, Y.; Chen, Y.-T.; Yang, Y.-X.; Shou, D.; Li, C.-Y. Urinary Metabolomic Profiling in Zucker Diabetic Fatty Rats with Type 2 Diabetes Mellitus Treated with Glimepiride, Metformin, and Their Combination. Molecules 2016, 21, 1446. https://doi.org/10.3390/molecules21111446
Dong Y, Chen Y-T, Yang Y-X, Shou D, Li C-Y. Urinary Metabolomic Profiling in Zucker Diabetic Fatty Rats with Type 2 Diabetes Mellitus Treated with Glimepiride, Metformin, and Their Combination. Molecules. 2016; 21(11):1446. https://doi.org/10.3390/molecules21111446
Chicago/Turabian StyleDong, Yu, Yi-Tao Chen, Yuan-Xiao Yang, Dan Shou, and Chang-Yu Li. 2016. "Urinary Metabolomic Profiling in Zucker Diabetic Fatty Rats with Type 2 Diabetes Mellitus Treated with Glimepiride, Metformin, and Their Combination" Molecules 21, no. 11: 1446. https://doi.org/10.3390/molecules21111446