1. Introduction
Many epidemiological studies have suggested that diets rich in fruits and vegetables are positively associated with human health in many ways, including reduced risk of cancers, type II diabetes, and cardiovascular diseases [
1,
2,
3].
Brassicaceae vegetables, as a group, possess a large number of health-promoting compounds such as vitamins, carotenoids, flavonoids, polyphenols, minerals, and glucosinolates (GSLs) in considerable amounts [
4,
5,
6,
7,
8,
9,
10]. Among these health-promoting phytochemicals, GSLs (β-thioglucoside-
N-hydroxysulfates) are an important chemical group naturally occurring in almost all
Brassica species. GSLs are a group of sulfur-containing glucosides that are hydrolyzed by the endogenous enzyme myrosinase into isothiocynates (ITCs), thiocynates, and nitriles [
11]. More than 200 GSLs have been identified in
Brassica crops, and they are characterized mainly by the variable R group, which can be aromatic, indolic, or aliphatic derivatives of the amino acid precursors methionine, tryptophan, and phenylalanine, respectively [
12,
13,
14,
15].
GSLs and their products have different biological functions, including anticancer, anti-bacterial, anti-fungal, anti-oxidative, and allelopathic properties [
16,
17,
18]. For example, ITCs such as sulforaphane, iberin, phenylethyl, and prop-2-enyl, derived from glucoraphanin, glucoiberin, gluconasturtiin, and sinigrin, respectively, have been found to induce phase 2 enzymes promoting anti-proliferative activity [
14,
19]. GSLs can also be used as an alternative to synthetic pesticides for pest and disease control [
20]. Some GSLs such as sinigrin and progoitrin are also responsible for the bitter flavor of these crucifers and influence consumer acceptance [
14,
21]; therefore, the determination of GSL concentrations in
Brassica vegetables is important in the study of such activities in
Brassica vegetables.
The content and profile of GSLs in
Brassica vegetables significantly varies depending on various plant-specific factors such as the cultivar genotype, growth stage, or structure where GSL accumulates, as well as environmental conditions of temperature, light, water and nutrient availability, growing season, agricultural practices, and post-harvest conditions [
4,
5,
7,
22,
23,
24,
25,
26]. For example, variance in GSL concentrations was observed in the same broccoli genotype grown in different seasons and under different agricultural practices [
25,
27]. Thus far, most research work has focused on seed and fully mature plants [
5,
9,
25,
26]. Studies of GSL concentrations in sprouts are limited to a few members of
Brassicaceae. Moreover, a paucity of research addresses GSL patterns and concentrations in the young shoots and roots of different
Brassica species, in addition to the seeds and sprouts.
Brassica crops such as cauliflower, broccoli, cabbage, radish, baemuchae, kale, pakchoi, Chinese cabbage, and leaf mustard are commonly used for various side dishes in many countries. Thus, investigation of GSL profiles and concentrations in crop commodities will be useful for consumers and agribusiness, in general. In addition, GSL profiling in roots, combined with seeds and other plant tissues, will improve our understanding of the distribution pattern of GSLs in whole plant tissues. Thus, in this study, we investigated GSL profiles of seeds, sprouts, roots, and shoots across nine widely consumed
Brassica vegetables for the comparative analysis of GSL profiles.
3. Experimental Section
3.1. Plant Materials, Cultivation, and Sampling
Nine commercial Brassica vegetables were used in this study: baemuchae (cv. BB no.1), broccoli (cv. greendom), cabbage (cv. rudia), cauliflower (cv. snowdream), Chinese cabbage (cv. Seoul), kale (cv. matjjankale), leaf mustard (cv. akiobatacana), pakchoi (cv. chingen sai), and radish (cv. chunglyongmu). Seeds of cauliflower, broccoli, cabbage, and leaf mustard were obtained from Takii Co. (Kyoto, Japan); seeds of baemuchae, kale, and pakchoi were obtained from Asia Seed Co. (Seoul, Korea); and seeds of radish and Chinese cabbage were obtained from Koregon Co. (Seoul, Korea) and Syngenta Co. (Auckland, New Zealand), respectively. All vegetables were grown in a greenhouse at Chonbuk National University, Jeonju, Korea (50 m altitude, 35°49ʹN and 127°09ʹE). Seeds were sown on 5 September 2013 and tissue samples were harvested at two stages. The first harvests was performed 9 days after sowing, while the second harvest was performed either at 55 or 81 days after sowing, depending upon the optimal growth for harvest of the edible plant parts. Baemuchae, kale, leaf mustard, and radish were harvested at 55 days after sowing, whereas the other vegetables were harvested at 81 days after sowing. After harvest, whole plant parts from the first harvests were used for the study, and second-harvest samples were divided into shoots and roots. All the tissue samples were freeze-dried, ground into fine powder, and stored at −20 °C until GSL analysis.
Table 6.
Overall correlation coefficients among glucosinolates identified in nine Brassica vegetables.
Table 6.
Overall correlation coefficients among glucosinolates identified in nine Brassica vegetables.
| Glucosinolates | PRO | EPI | GRA | SIN | GRE | NAP | BCN | ERU | BRA | NAS | Total GSLs |
|---|
| IBE | −0.043 | −0.057 | 0.063 | 0.290 | −0.102 | −0.105 | −0.125 | −0.069 | 0.234 | −0.159 | 0.052 |
| PRO | | 0.944 *** | 0.709 *** | −0.070 | −0.123 | −0.016 | 0.030 | 0.649 *** | −0.257 | −0.221 | 0.595 *** |
| EPI | | | 0.831 *** | −0.101 | −0.147 | −0.067 | −0.082 | 0.626 *** | −0.103 | −0.172 | 0.546 *** |
| GRA | | | | −0.075 | −0.104 | −0.082 | −0.180 | 0.442 ** | −0.019 | −0.126 | 0.397 * |
| SIN | | | | | −0.170 | −0.084 | −0.246 | −0.145 | −0.165 | −0.188 | 0.301 |
| GRE | | | | | | −0.095 | 0.050 | −0.105 | −0.080 | −0.143 | −0.295 |
| NAP | | | | | | | 0.356* | −0.074 | −0.282 | −0.148 | 0.289 |
| BCN | | | | | | | | −0.174 | −0.286 | −0.158 | −0.120 |
| ERU | | | | | | | | | −0.039 | −0.051 | 0.701 *** |
| BRA | | | | | | | | | | 0.063 | −0.270 |
| NAS | | | | | | | | | | | 0.163 |
3.2. GSL Analyses
Sample preparation and GSL analyses were performed according to a modified version of the method described by Lee
et al. [
49]. Briefly, freeze-dried powder samples (0.1 g) were extracted with 2 mL of boiling methanol (70%) for 20 min and centrifuged at 12,000 rpm for 10 min at 4 °C. Thereafter, the pellet was re-extracted once more and the supernatants were pooled. The crude GSL extract was loaded onto a Mini Bio-Spin chromatography column (Bio-Rad Laboratories, Hercules, CA, USA) containing 0.5 mL of DEAE-Sephadex A 25 anion exchange resin, which was pre-activated with 0.1 M sodium acetate (pH 4.0). Next, desulfation was carried out by the addition of 200 µL of purified aryl sulfatase (EC 3.1.6.1, type H-1 from
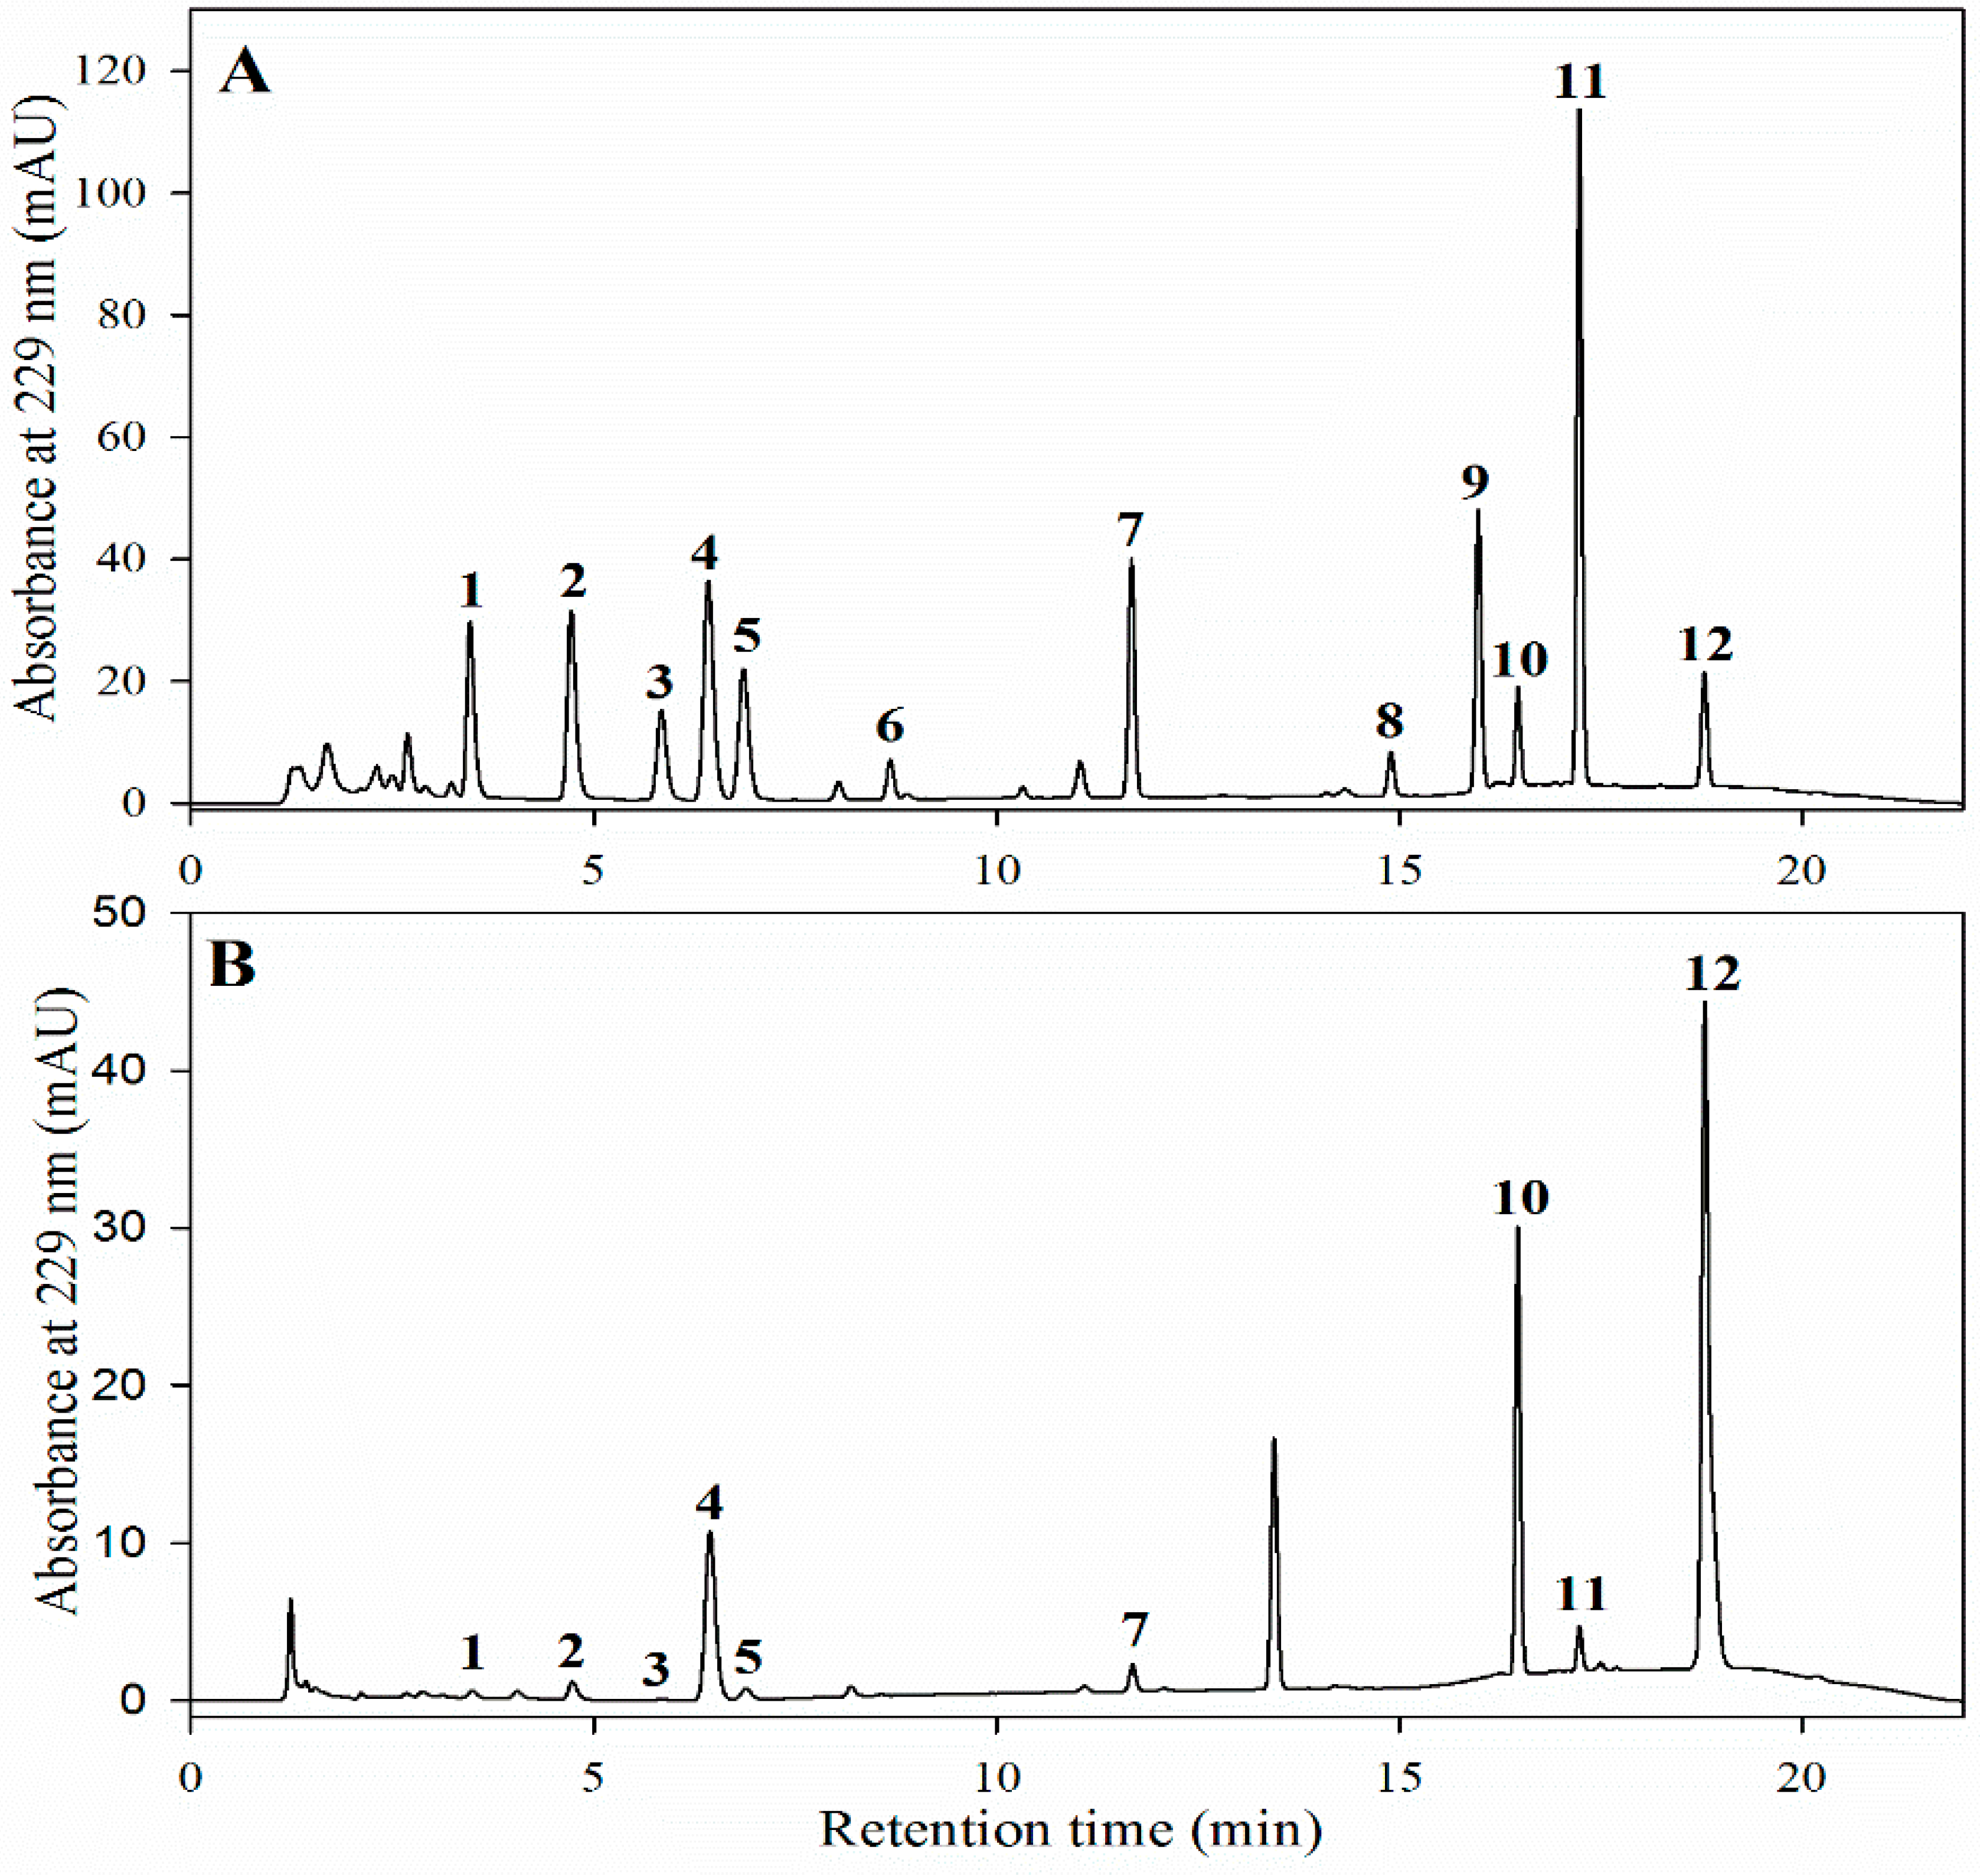
Helix pomatia). The column was capped and allowed to stand at room temperature for 24 h, and the desulfo-GSLs were eluted with 1.5 mL distilled water, filtered through a 0.2-µm syringe filter, injected into H-Class UPLC system (H-Class, Waters Co., Milford, MA, USA) using an Acquity UPLC
® BEH- C18 column (1.7 µm, 2.1 × 100 mm; Waters Co.), and its absorbance spectrum was measured at 229 nm with a photodiode array (PDA) detector. Solvent A (100% distilled water) and solvent B (20% acetonitrile in water) were used for the elution of compounds at the flow rate of 0.2 mL·min
−1. The gradient programs were as follows: a linear step from 1% to 99% of solvent B within 6 min, followed by constant conditions for up to 10 min, and then a quick dropdown to 1% of solvent B at 12 min, and isocratic conditions of 1% of solvent B up to 18 min.
Authentic standards of GSLs were desulfated and used for the identification and quantification of the peaks. Concentrations of individual desulfo-GSLs were determined from the experimental peak area by analytical interpolation in a standard calibration curve of each desulfo-GSL across different ranges depending upon the GSLs and were expressed as micromoles per gram (µmol·g−1) of dry weight.
3.3. Authentic Standards and Chemicals
Twelve GSL standards, including glucoiberin (IBR), progoitrin (PRO), epiprogoitrin (EPI), glucoraphanin (GRA), glucoraphenin (GRE), sinigrin (SIN), gluconapin (NAP), glucobrassicanapin (BCN), glucoerucin (ERU), glucobrassicin (BRA), glucobarbarin (BAR), and gluconasturtiin (NAS), were purchased from Cfm Oskar Co. (Marktredwitz, Germany). Diethyl aminoethyl (DEAE), Sephadex-A25, and aryl sulfatase (EC 3.1.6.1, type H-1) from H. pomatia were purchased from Sigma-Aldrich (St. Louis, MO, USA). Other chemicals, including acetonitrile (HPLC grade), and formic acid (ACS reagent), were purchased from J.T. Baker (Phillipsburg, NJ, USA).
3.4. Statistical Analysis
Independent measurements in triplicate were used for each sample in all statistical analyses. To determine concentration differences among vegetables and their respective tissues, a one way analysis of variance (ANOVA), followed by Duncan’s multiple-range test (DMRT), were performed at a significance level of α = 0.05, using SAS® 9.2 software (SAS Institute Inc., Cary, NC, USA, 2013).
4. Conclusions
The present study describes the accumulation patterns of individual GSLs in different tissues of nine Brassica crops. Our results indicate that the content and composition of GSLs in Brassica vegetables depend on the tissue type as well as the plant’s genotype. The total GSL concentration was the highest in seeds followed by that in sprouts, roots, and shoots. Collectively, our results highlight the distribution of different GSLs within the different tissues of a plant and among the different Brassica crops. The relatively high contents of aliphatic GSLs (IBE, PRO, EPI, GRA, SIN, GRE, NAP, BCN, and ERU) in seeds and sprouts, and that of aromatic GSL (NAS) in root parts suggest the higher nutritive value of these tissues. In addition, the relatively high content of NAS in the roots of all the crops examined suggests that the roots of these Brassica vegetables could be used for the extraction of GSLs in nutraceutical industry.


