2.1. Epoxidized Palm Oil Acrylate (EPOLA)
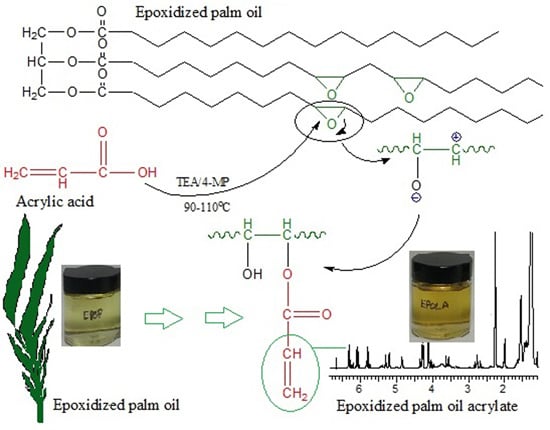
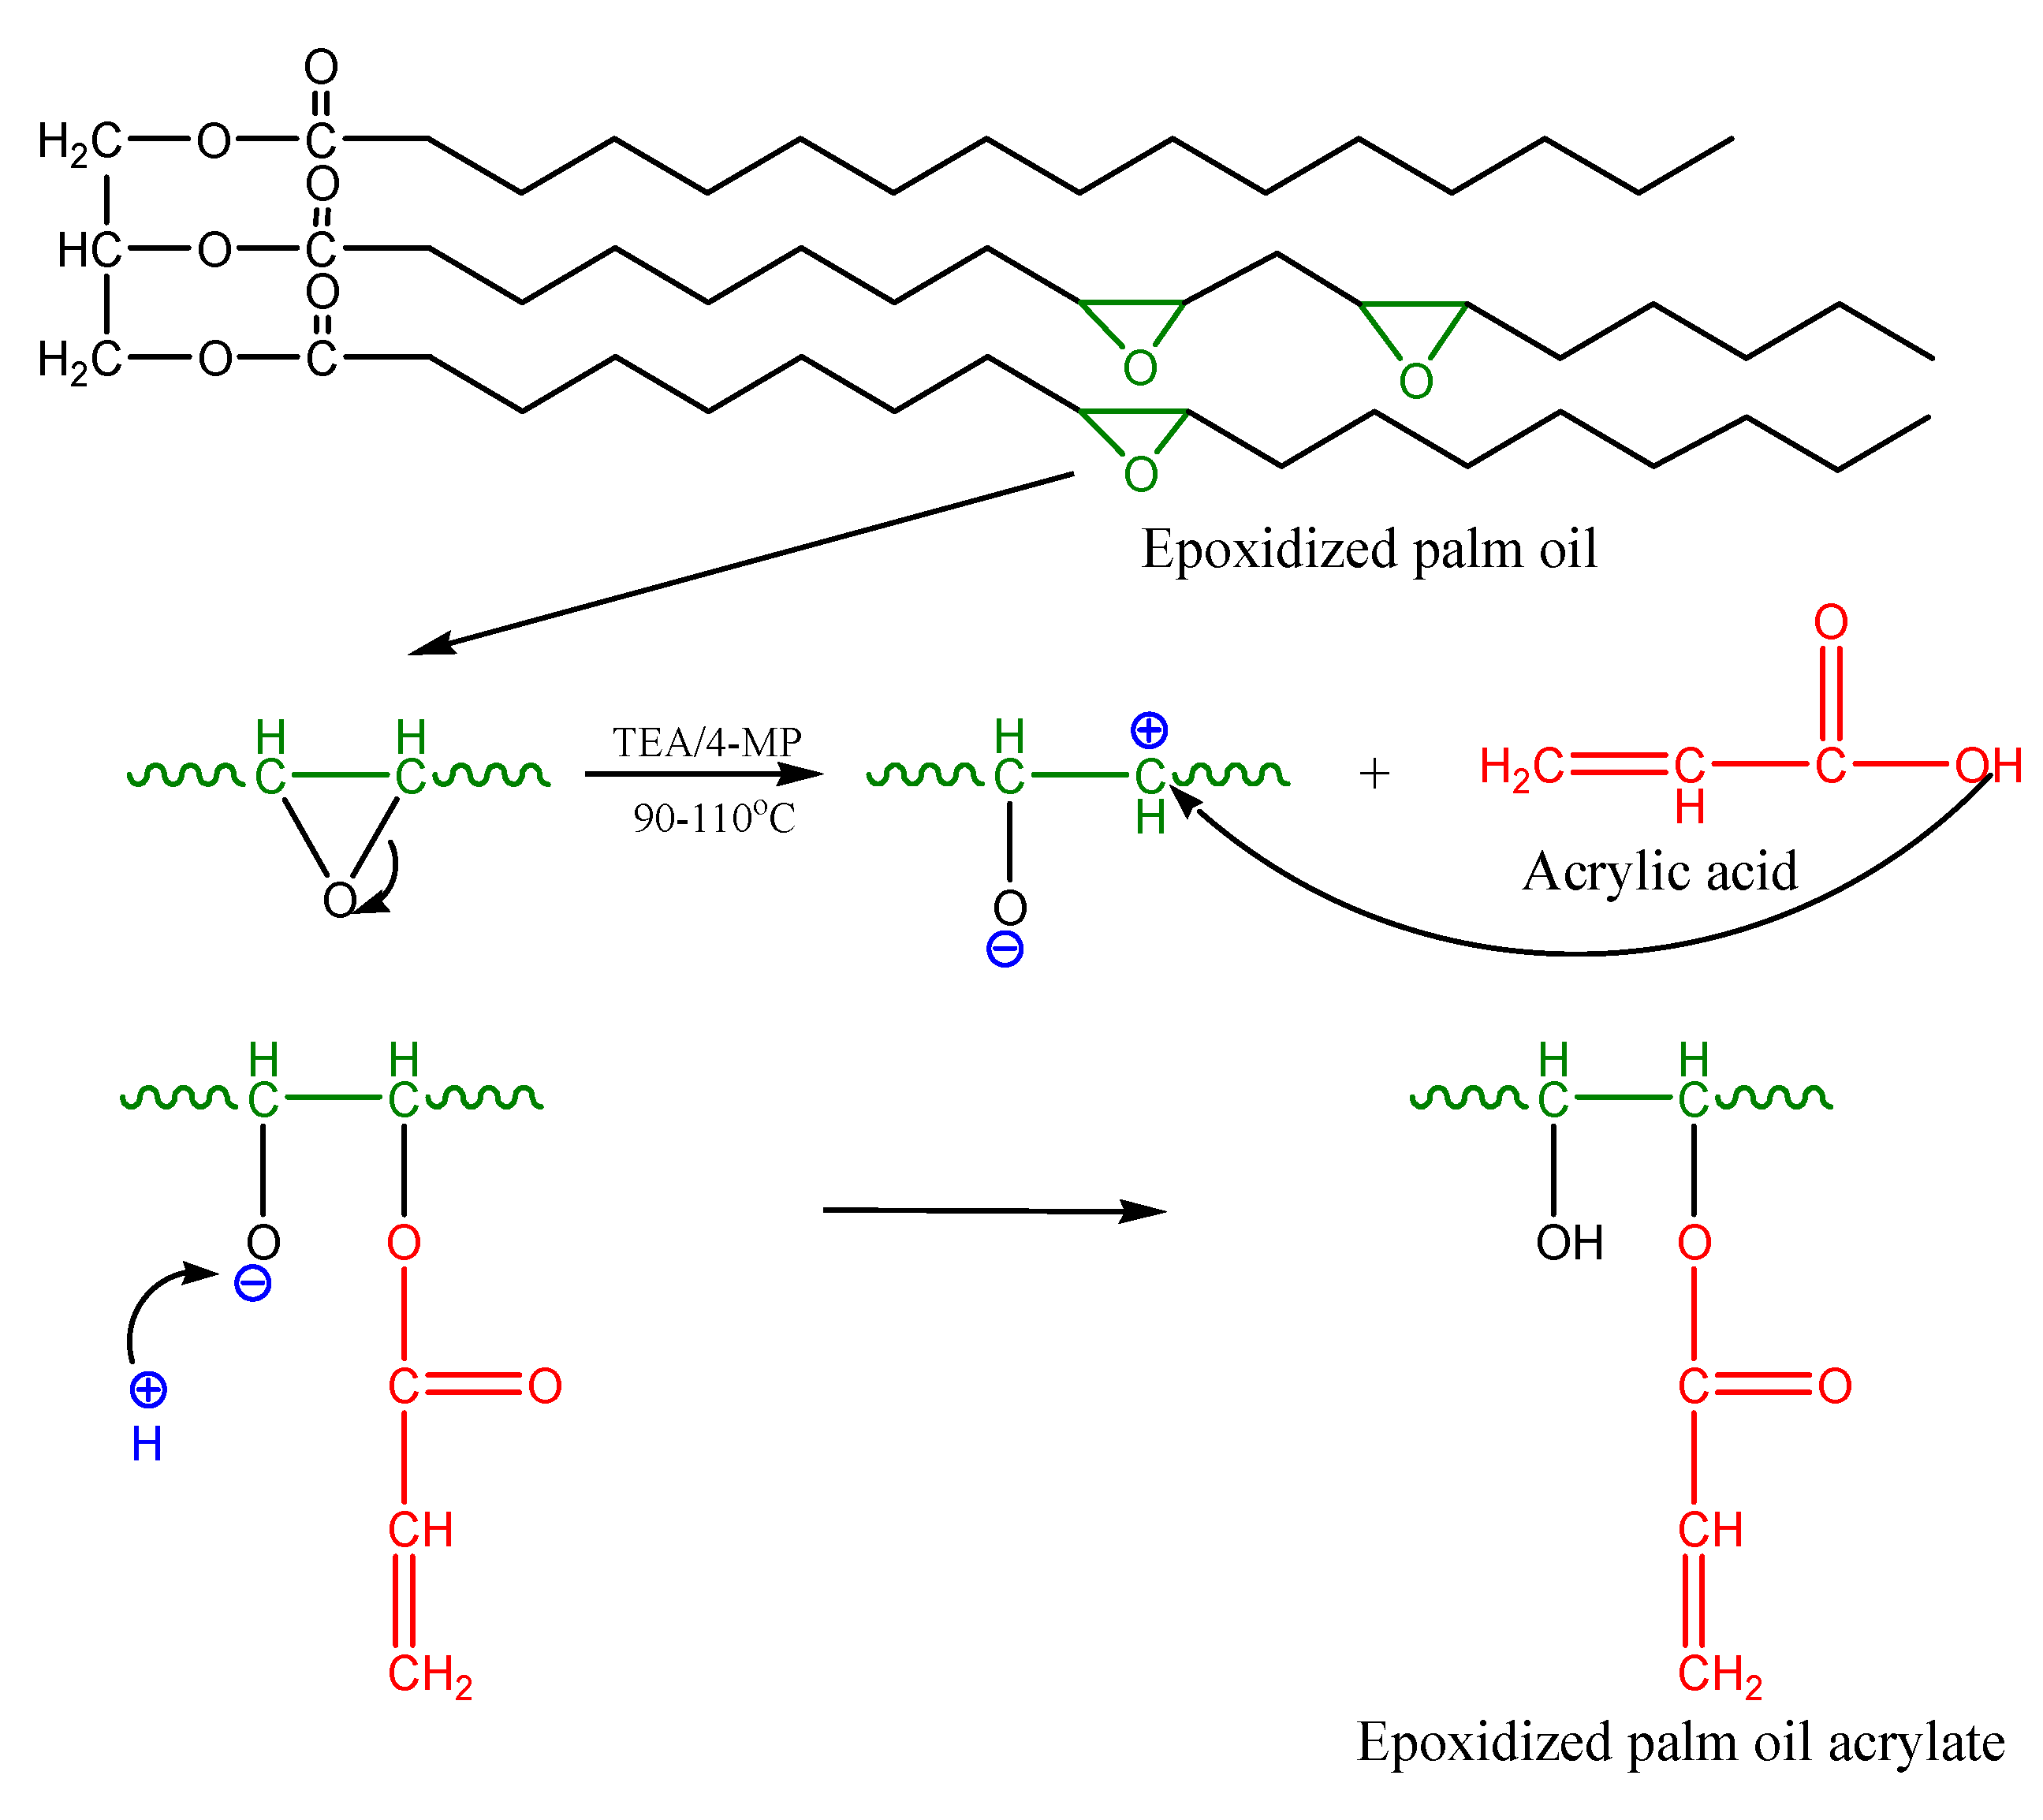
EPOLA was successfully synthesized by an esterification reaction between epoxidized palm oil product (EPOP) and acrylic acid in the presence of triethylamine (TEA) as a catalyst. The epoxy groups (oxirane rings) reacted with the carboxylic acid groups in the acrylic acid to form a hydroxy acrylate resin.
Scheme 1 shows a diagram of the proposed reaction mechanism.
Scheme 1.
Mechanism of the acrylation reaction of epoxidized palm oil by acrylic acid.
Scheme 1.
Mechanism of the acrylation reaction of epoxidized palm oil by acrylic acid.
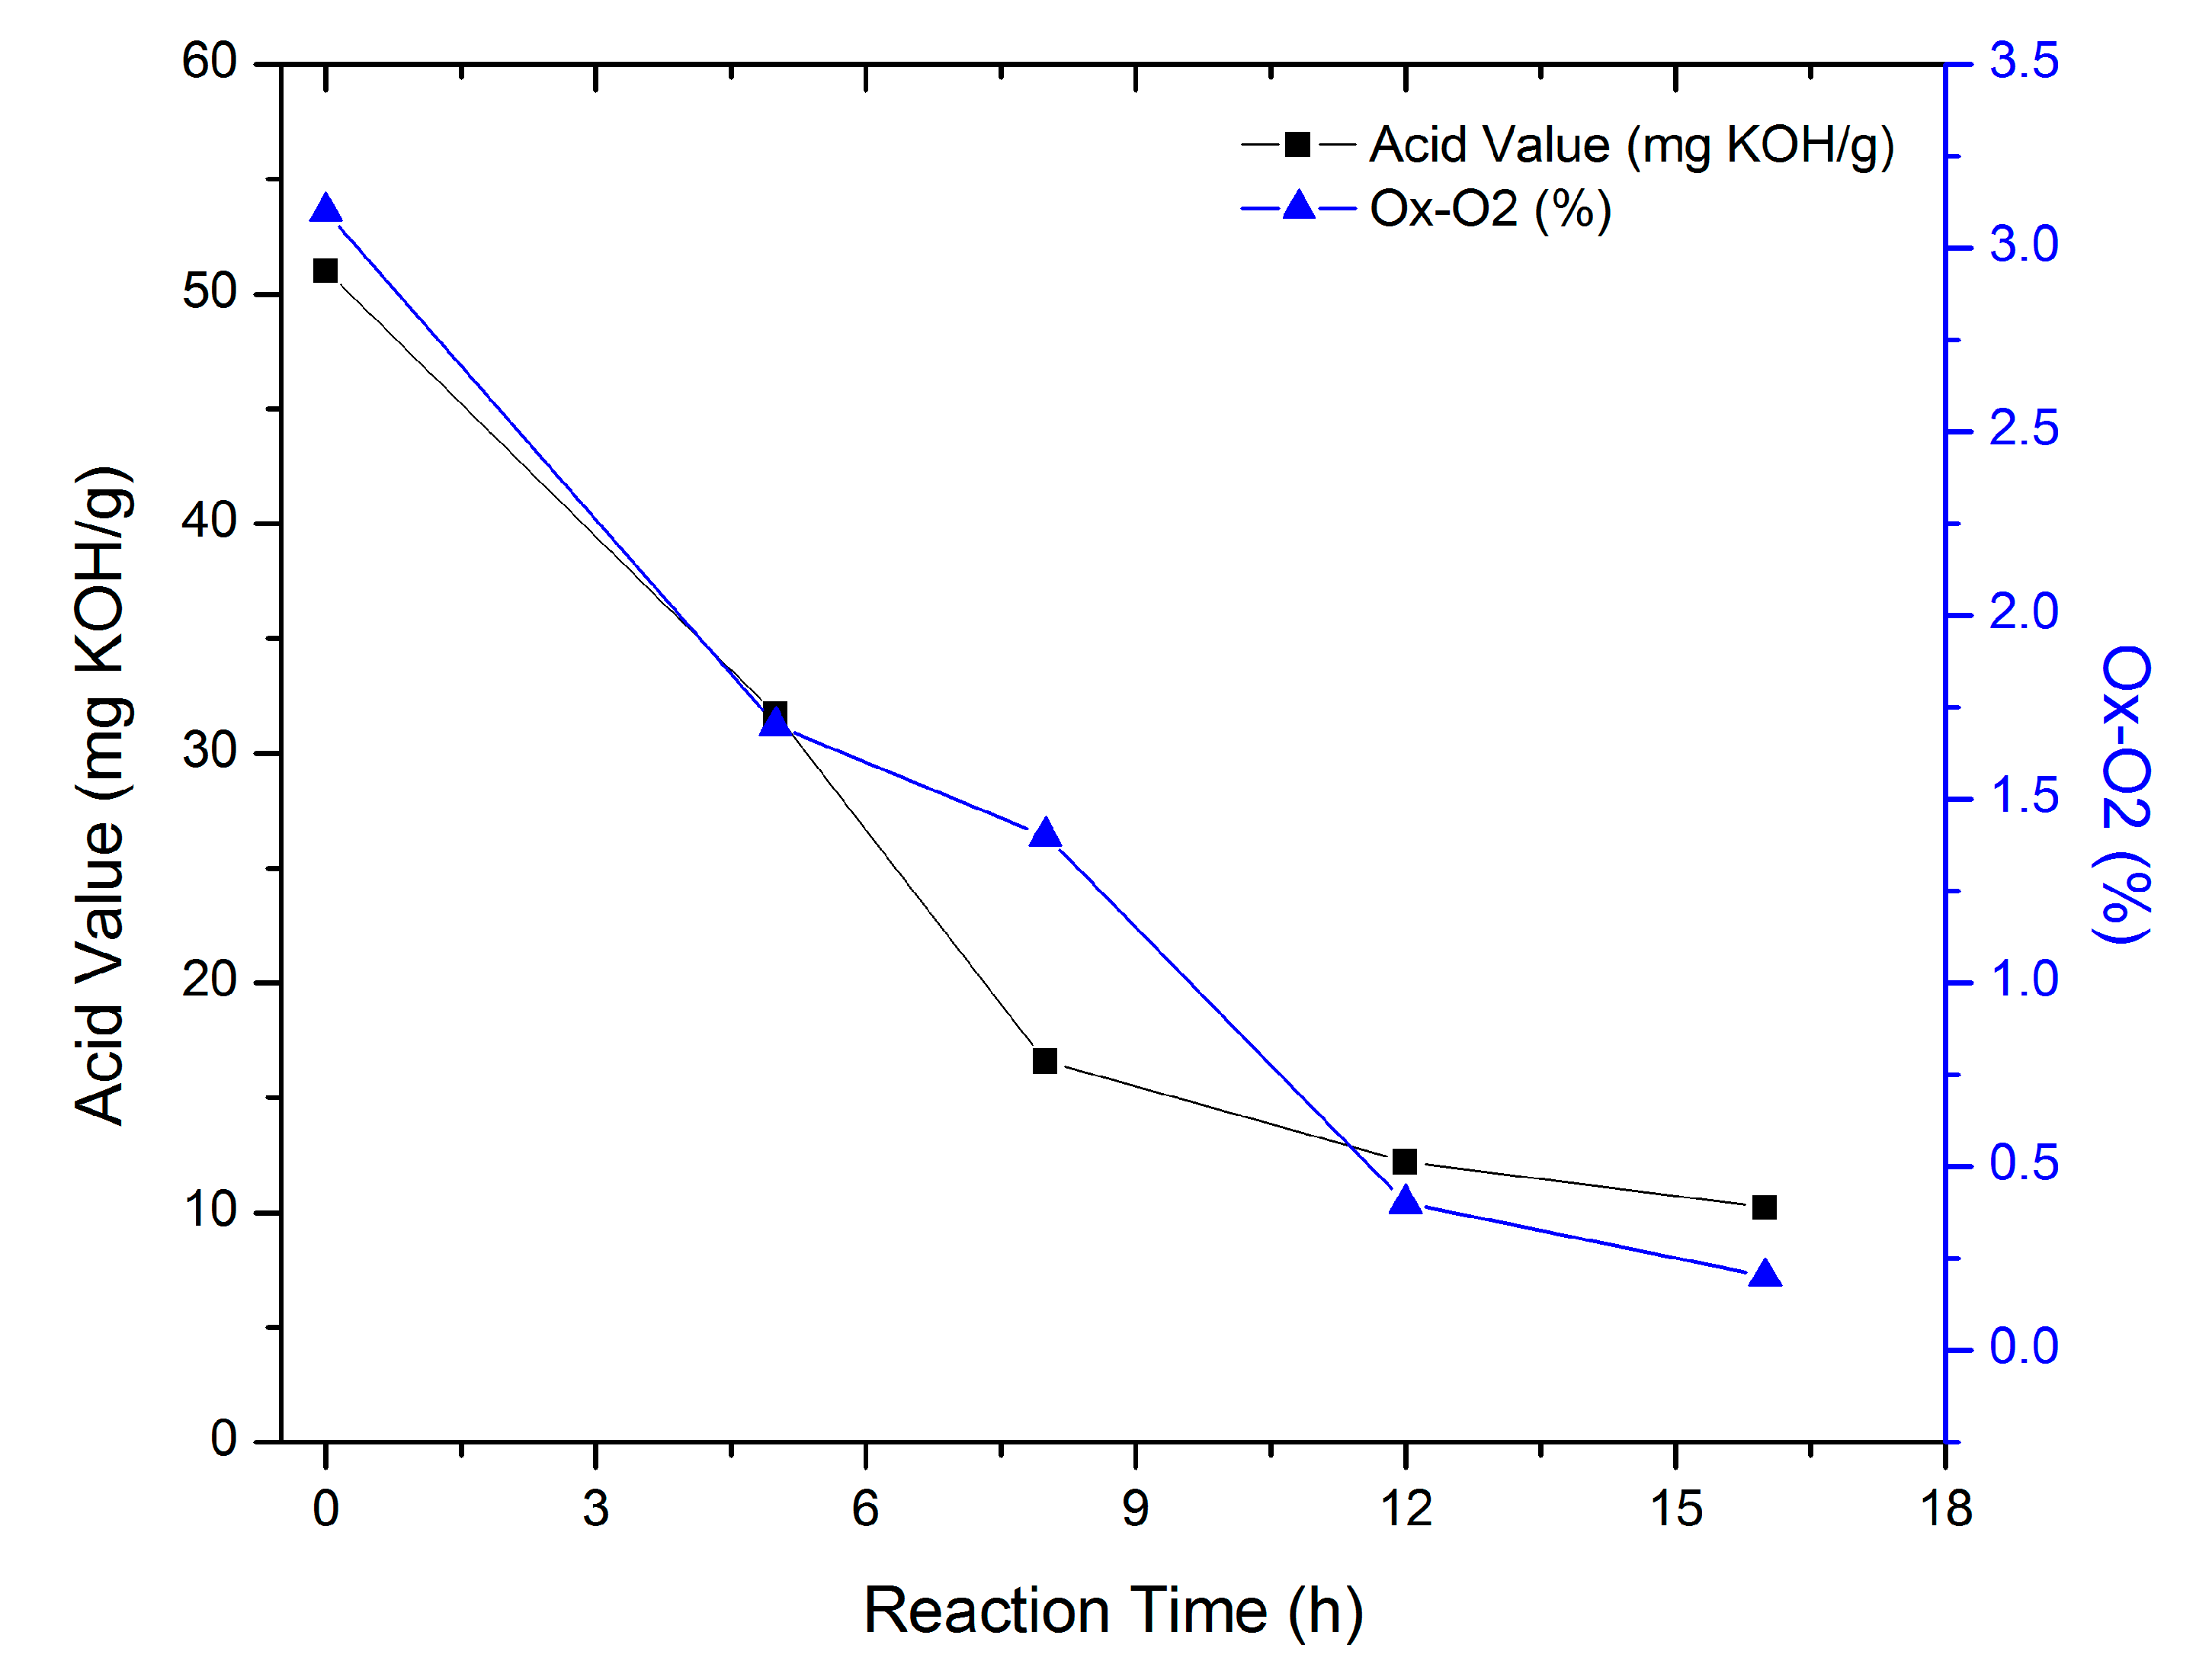
The acrylation reaction involves the consumption of the carboxylic groups of the acrylic acid and the epoxy rings; therefore, the reaction progress was followed by measuring the acid value of the reaction matrix.
Figure 1 shows the decrease of the acid values and the oxirane ring percentages during the reaction course. The initial acid value was 51 mg KOH/g, which started to decrease rapidly in the first 8 h, followed by a slow decrease in the successive hours, and this could be attributed to the elevated concentrations of acrylic acid and oxirane groups during the first hours, and thus higher reactivity, which decreased as the reaction progressed. The reaction was stopped when the acid value was about 10.2 mg KOH/g. The FTIR and NMR results revealed the consumption of the acrylic acid, as well as the formation of new acrylate functional groups.
Figure 1.
EPOLA Synthesis, Acid values and Ox-O2 (%) vs Acrylation Reaction Time.
Figure 1.
EPOLA Synthesis, Acid values and Ox-O2 (%) vs Acrylation Reaction Time.
The physical and analytical characteristics of EPOP and EPOLA are presented in
Table 1. The decrease of the percentage of oxirane rings reveals the consumption of epoxy groups as a result of the acrylation process. On the other hand, the addition of the acrylate groups to the epoxy chain resulted in a higher molecular weight product (EPOLA), with a higher viscosity compared to the starting reactant EPOP. EPOLA was purified by washing with distilled water, whereby a lower acid value product (about 1.5 mg KOH/g) was obtained, which is due to the elimination of the unreacted acrylic acid.
Table 1.
Physio-chemical characteristics of EPOP and EPA.
Table 1.
Physio-chemical characteristics of EPOP and EPA.
| Resin | Acid Value (mg KOH/g) | Iodine Value (I2/100g) | OH-Value (mg KOH/g) | Ox-O2%/100 g | Viscosity (cPs) at 25 °C | Density (g/cm3) |
|---|
| EPOP | 2.5 | 0.76 | 12.9 | 3.0 | 280 | 0.9095 |
| EPOLA | 10.2 | 20.7 | 50.99 | 0.2 | 580 | 0.9748 |
| Purified EPOLA | 1.5 | 18.6 | 44.9 | --- | 1350 | 0.9941 |
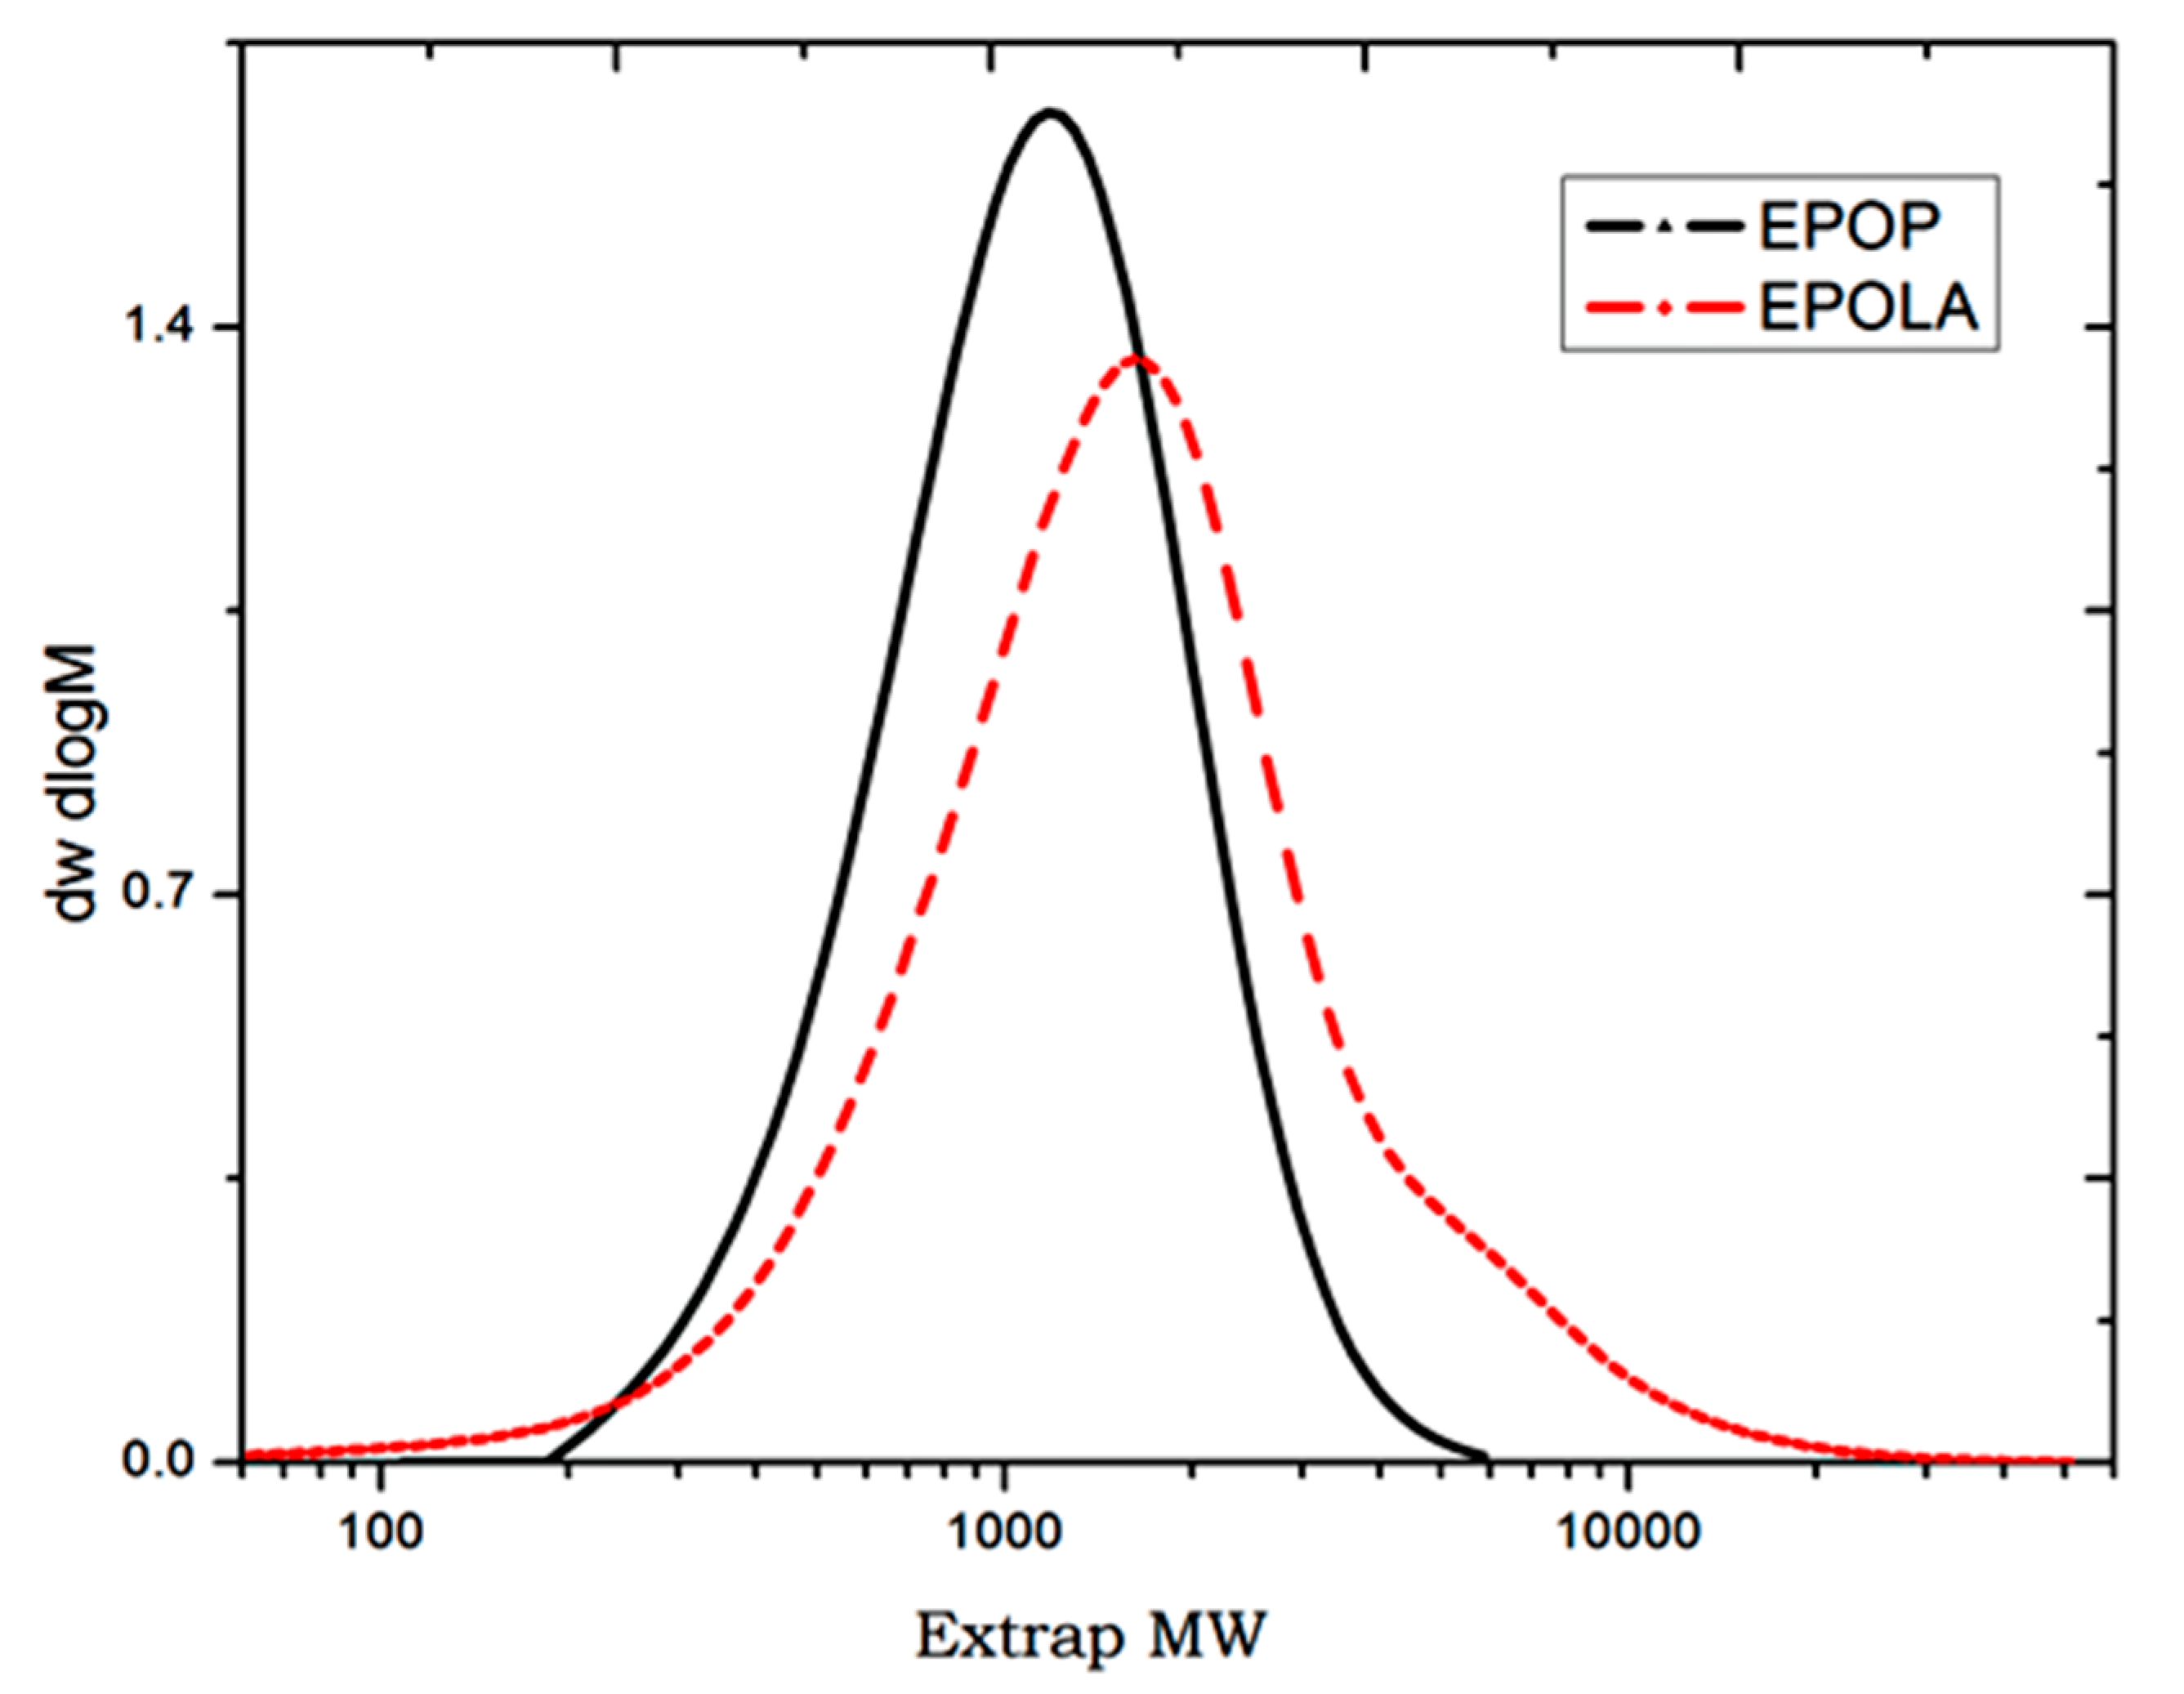
The molecular weight and molecular weight distribution of EPOP and EPOLA were determined by GPC, and the polydispersity index (PDI) was calculated from the ratio of the weight average molecular weight
) to the number average molecular weight
, using Equation (1):
Figure 2 shows the molecular weight distribution of EPOP and EPOLA. It could be observed that both EPOP and EPOLA have monomodal distribution curves, which indicates the homogeneity of the length of the resin molecules. On the other hand, the molecular weight of EPOP was increased due to the extent of the chains increasing by grafting of acrylate groups onto the triglyceride backbone. These results are in good agreement with the increase of the viscosity, as it could be seen in
Table 1 and
Table 2.
Figure 2.
Molecular Weight Distribution Curves of EPOP and EPOLA.
Figure 2.
Molecular Weight Distribution Curves of EPOP and EPOLA.
Table 2.
Molecular weights, PDI of EPOP and EPOLA.
Table 2.
Molecular weights, PDI of EPOP and EPOLA.
| Resin | Mw (g/mol) | Mn (g/mol) | PDI (Mw/Mn) |
|---|
| EPOP | 1262 | 925 | 1.3 |
| EPOLA | 1667 | 1053 | 1.5 |
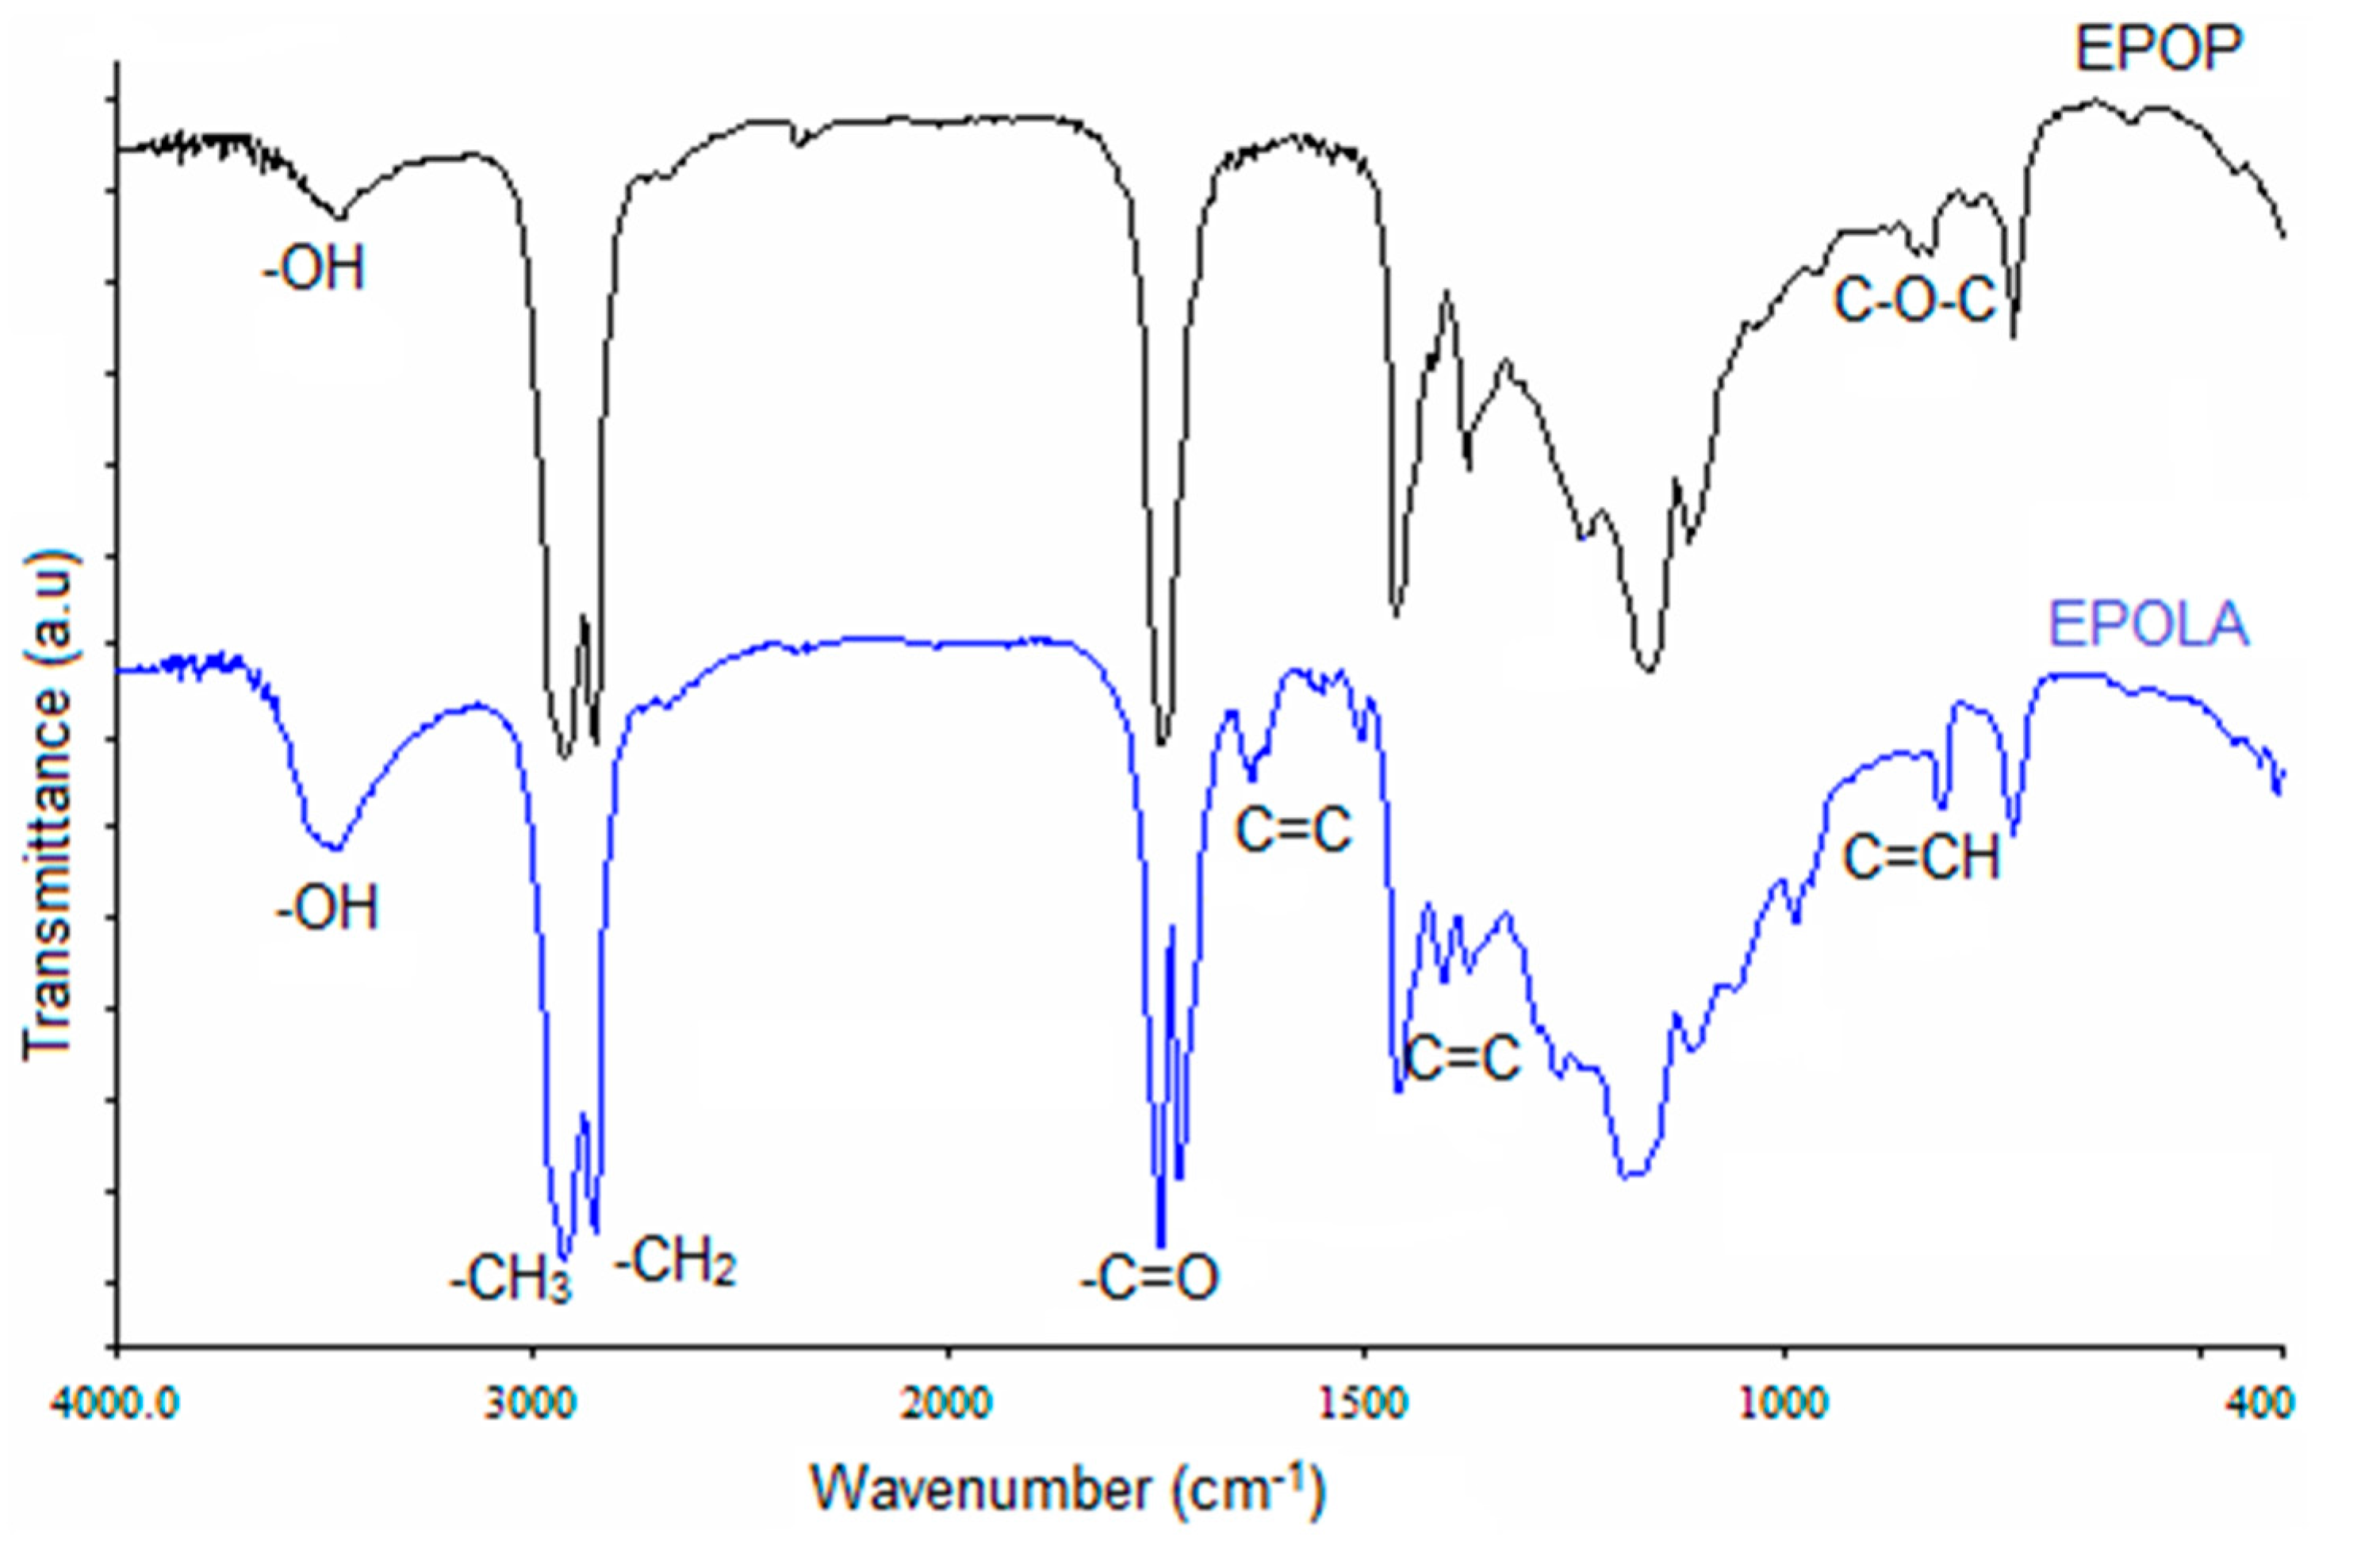
The functional groups of EPOP and EPOLA were determined by FTIR spectroscopy and results are shown in
Figure 3. The FTIR spectra of EPOP shows clearly the stretching vibration of C-O-C groups at 1240 cm
−1, in addition to the other characteristic band of the epoxy rings at the wavenumber between 850–830 cm
−1. The terminal methyl groups (CH
3) of the triglyceride chains showed a strong band of C-H stretching at 2924 cm
−1, while the methylene moieties (CH
2) in the saturated fatty acid backbone show a stretching band at 2853 cm
−1, and a C-H in-plane deformation band at 1378 cm
−1.
Obviously, the comparison between the FTIR spectra of EPOP and EPOLA reveals that there are new IR absorption bands in the spectrum of EPOLA, such as the absorption band at 810 cm
−1, which is attributed to the out-of-plane deformation of the C=C of the vinyl moieties of the acrylate groups, besides, the band at 1636 cm
−1.
Table 3 shows the FTIR assignments of the major functional groups of EPOP and EPOLA.
Figure 3.
FTIR Spectra of EPOP and EPOLA.
Figure 3.
FTIR Spectra of EPOP and EPOLA.
Table 3.
FTIR peaks assignment of EPOP and EPOLA.
Table 3.
FTIR peaks assignment of EPOP and EPOLA.
| Functional Group | FTIR Absorption (cm−1) |
|---|
| EPOP | EPOLA |
|---|
| OH stretching | 3472 | 3470 |
| C-H stretching (CH3) | 2924 | 2924 |
| C-H stretching (CH2) | 2853 | 2853 |
| C=O stretching | 1743 | 1744 |
| C=O (carboxylic group) | ----- | 1725 |
| CH2=CH-R stretching | ----- | 1636 |
| CH2=CH-R Scissoring | ----- | 1406 |
| C=O stretching | 1743 | 1744 |
| C=O (carboxylic group) | ----- | 1725 |
| CH2=CH-R stretching | ----- | 1636 |
| CH2=CH-R Scissoring | ----- | 1406 |
| C-O-C stretching | 1240 | ----- |
| C-O-C asymmetric bending | 835 | ----- |
| CH=C-H out of plane bending | ------ | 810 |
2.2. NMR Analysis of EPOP and EPOLA
The structures of EPOP and EPOLA were investigated by NMR spectrometry. For this the resins were dissolved in deuterated acetone (acetone-d
6) and both
1H-NMR and
13C-NMR spectra were recorded.
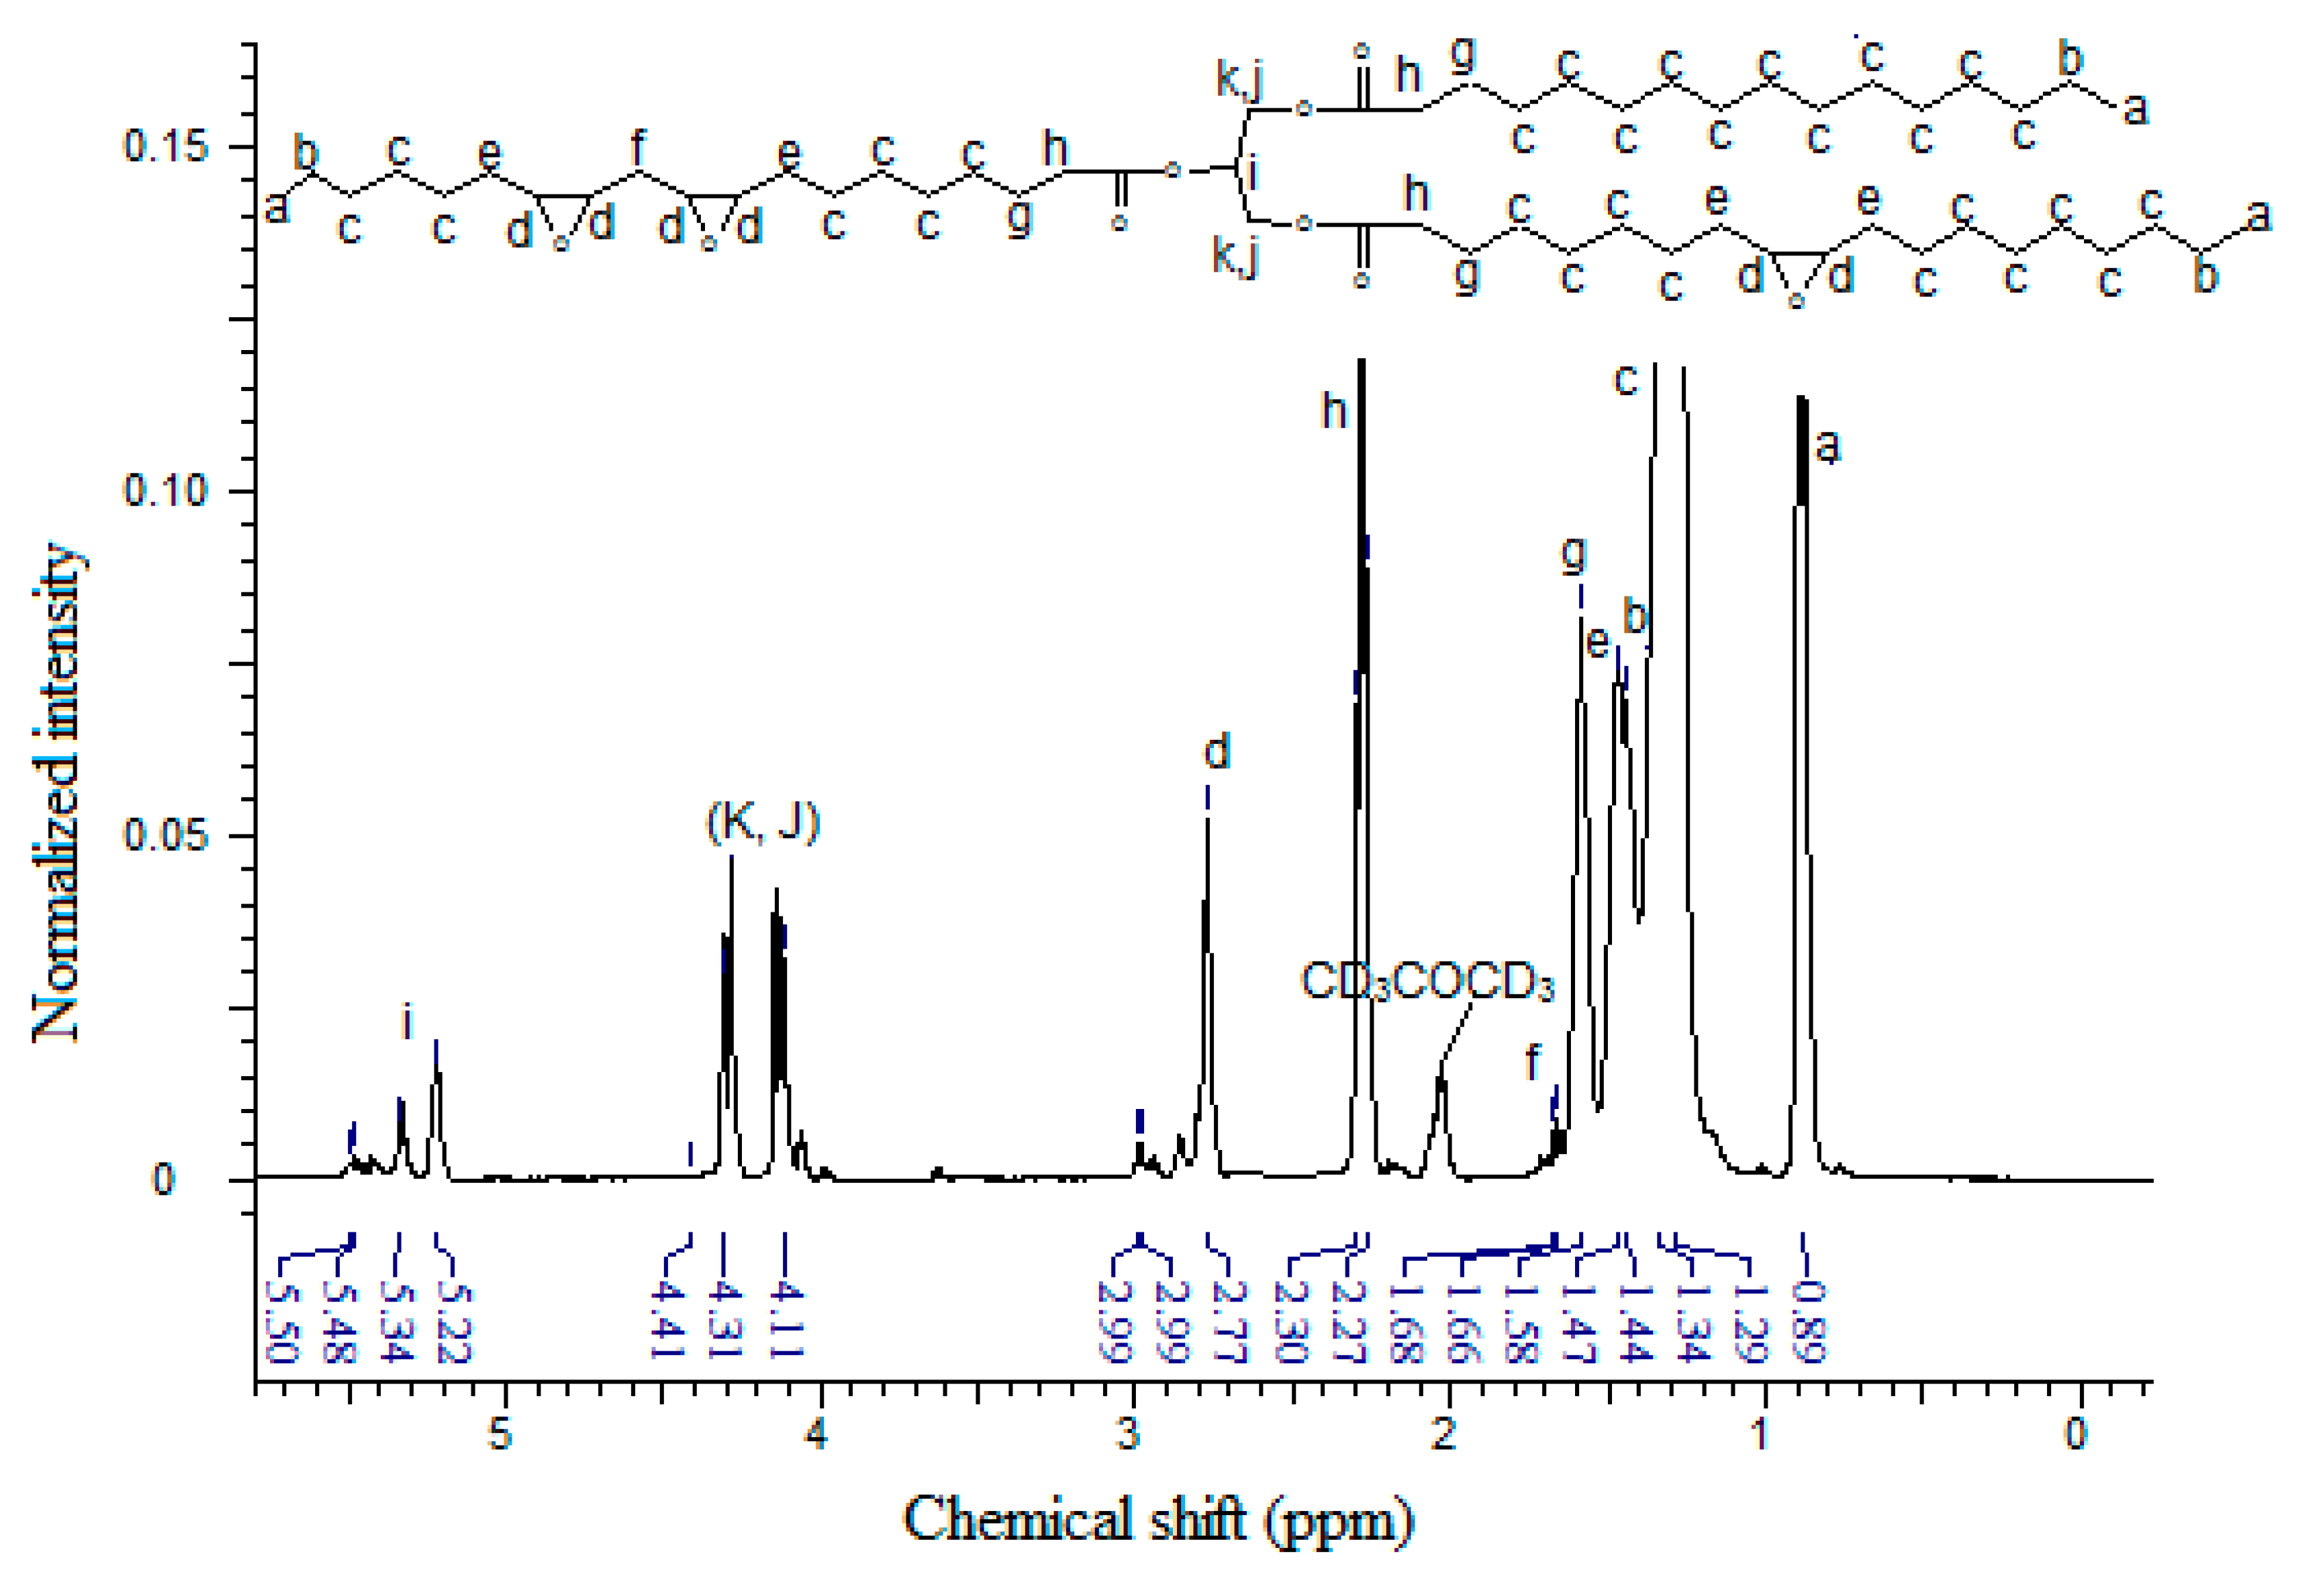
Figure 4 shows the
1H-NMR spectrum of EPOP, where the acetone-d
6 signal appears at (δ) 2.00 ppm. The characteristic peaks of the triglyceride molecule can be observed clearly; for instance, the triplet peak signal with an integration corresponding to nine protons at (δ) 0.89 ppm of the terminal methyl protons –C
H3 (Ha), and the protons of the methylene group adjacent to the methyl terminal in the α-position –CH
2-C
H2-CH
3 (Hb) at δ 1.34 ppm. The backbone methylene protons in the saturated chains of the fatty acid –CH
2–C
H2-CH
2- (Hc) showed signals at δ 1.29 ppm, and the methine of the epoxy ring proton (Hd) peaks in the δ 2.77–2.99 ppm region.
The NMR signal observed in the δ 1.44–1.47 ppm region could be attributed to the methylene groups in the α-position of the epoxy ring, and on the other side in the α position, to (EPOXY-C
H2-CH
2-) methylene groups, labeled as (He). These protons are in a different chemical environments compared with the other methylenes in the α position between two epoxy moieties (EPOXY-C
H2-EPOXY) labeled as (Hf), with a resonance peak at δ 1.66–1.68 ppm, which are more deshielded due to the effect of the second epoxy group [
26]. This observation reveals the presence of the epoxy linoleic fatty acid moiety in the epoxidized palm oil molecule.
The NMR peaks at the 1.58–1.60 ppm region can be due to the resonance of the methylene protons (Hg) β to the >C=O of the glycerol backbone –C=OCH2-CH2, while the methylene in the α position to the carbonyl group showed a signal at δ 2.27–2.30 ppm (Hh), -C=OCH2-CH2. The NMR peaks at the δ 5.23–5.50 and δ 4.1–4.40 ppm region can be attributed to the methine group (Hi) and the methylene group protons (Hj, Hk) –CH2CHCH2- of the glycerol backbone, respectively.
Figure 4.
1H-NMR Spectrum of EPOP.
Figure 4.
1H-NMR Spectrum of EPOP.
Since the synthesis of the epoxy acrylate involves opening of the oxirane rings and grafting of the acrylate moieties on the triglyceride backbone, besides, the formation of hydroxyl groups as described above, NMR analysis can provide strong evidence by tracing the signal of these moieties and their adjacent groups.
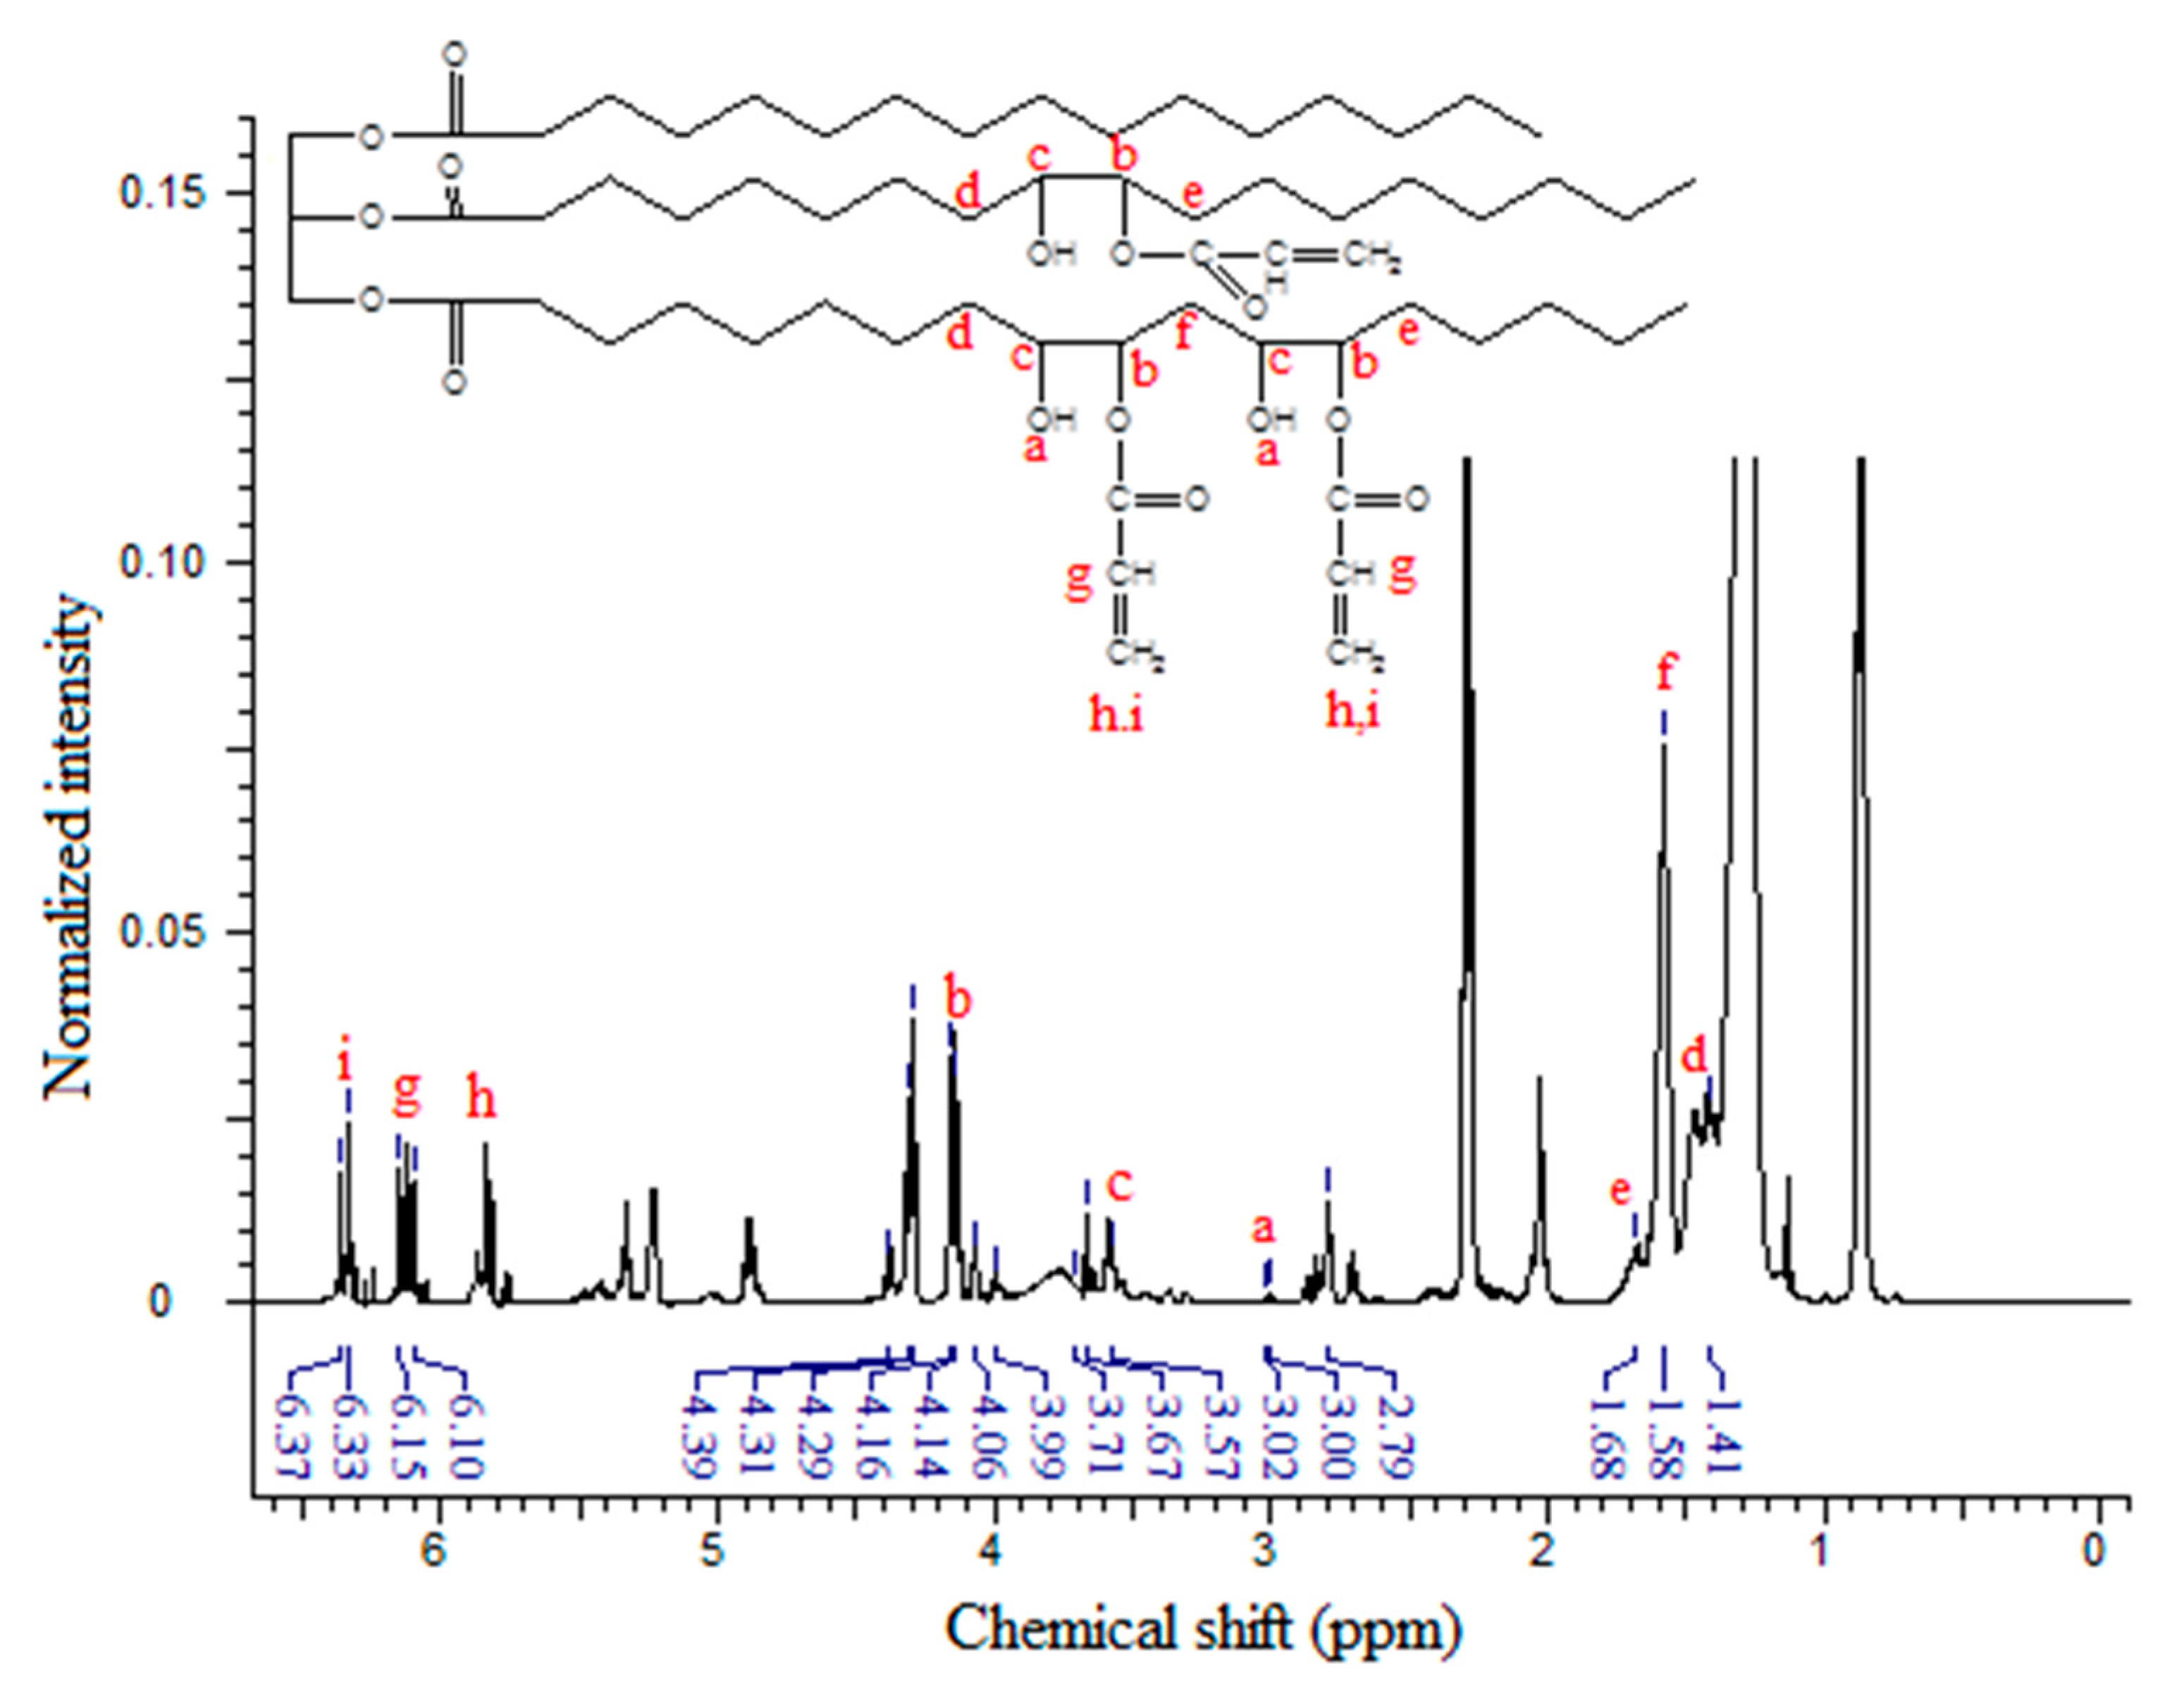
Figure 5 shows the
1H-NMR spectrum of EPOLA, where in addition to the characteristic signals of the triglyceride backbone, the spectrum shows the NMR signals assigned to the acrylate groups. The NMR signal with the chemical shift at δ 3.58–3.71 ppm (multiplet) can be assigned to the methine protons (Hc) in the α position of the –OH groups (-C
H-OH), and the other methine protons (Hb) α to the oxygen atom of the acrylate groups –CH-C
H-O-C=O<, show signals at δ 4.07–4.16 ppm (quartet). These protons (in the epoxy compound
1H-NMR) showed signals at δ 2.77–2.99 ppm, therefore we can state that they became more deshielded due to the stronger anisotropy effect of the adjacent oxygen groups of the hydroxyl and the ester groups, compared with the oxygen of the epoxy group. This result provides excellent evidence for the epoxy ring opening, and grafting of acrylate groups.
Figure 5.
1H-NMR Spectrum of EPOLA.
Figure 5.
1H-NMR Spectrum of EPOLA.
On the other hand, the methylene groups β to the hydroxyl and the oxygen (previously α to the epoxy rings) showed a slight difference in their chemical shift in the EPOLA spectrum
i.e., the Hd (OH-CH-C
H2-CH-O), He (-C
H2-CH-OH), and Hf (-C
H2-CH-O) protons in
Figure 4.
The NMR signals of the vinyl moieties associated to the acrylate groups C
H2=CH- (Hh, Hi) and the methine proton (Hg) CH
2-C
H- were observed at δ 5.77–5.86 ppm, δ 6.33–6.37 ppm and δ 6.10–6.15 ppm, respectively. These protons are not equivalent and they have different chemical shifts due to the effect of their orientation, since (Hh) is
cis, (Hi) is
trans and (Hg) is
gem [
27]. Obviously, due to the opening of the epoxy rings, OH groups are formed, and thus, the NMR signals at δ 2.99–3.01 could be attributed to the resonance of the hydroxyl groups, similar to the reported observation previously [
28].
Although the NMR spectrum of EPOLA showed a signal at δ 2.77 ppm related to the presence of epoxy ring residues there are still strong evidences of the successful synthesis of the epoxy acrylate. The NMR results reveal the presence of vinyl signals, which are due to the grafted acrylate groups’ absorptions and there was no contribution of free acrylic acid residues, since no carboxylic acid group protons are detected (normally at very low field of δ 10–13 ppm).
The acrylation percentage and number of acrylate groups per triglyceride molecule were calculated from the integrated peak areas taking the methyl signals as an internal reference standard. Equation (2) was used in the calculation of the acrylation percentage; similar to the method described previously in [
29]:
where, A
Epoxy is the integrated area of the methine epoxy protons at δ 2.77 ppm, and the A
Acrylate is the integrated peak area of the acrylate protons at δ 5.77–6.37 ppm; the acrylation percent was found to be 82.07%. The EPOP and EPOLA NMR results were found to be in a good agreement with the results obtained from FTIR and quite similar to the previously reported NMR results of epoxy oil acrylates [
30,
31,
32].
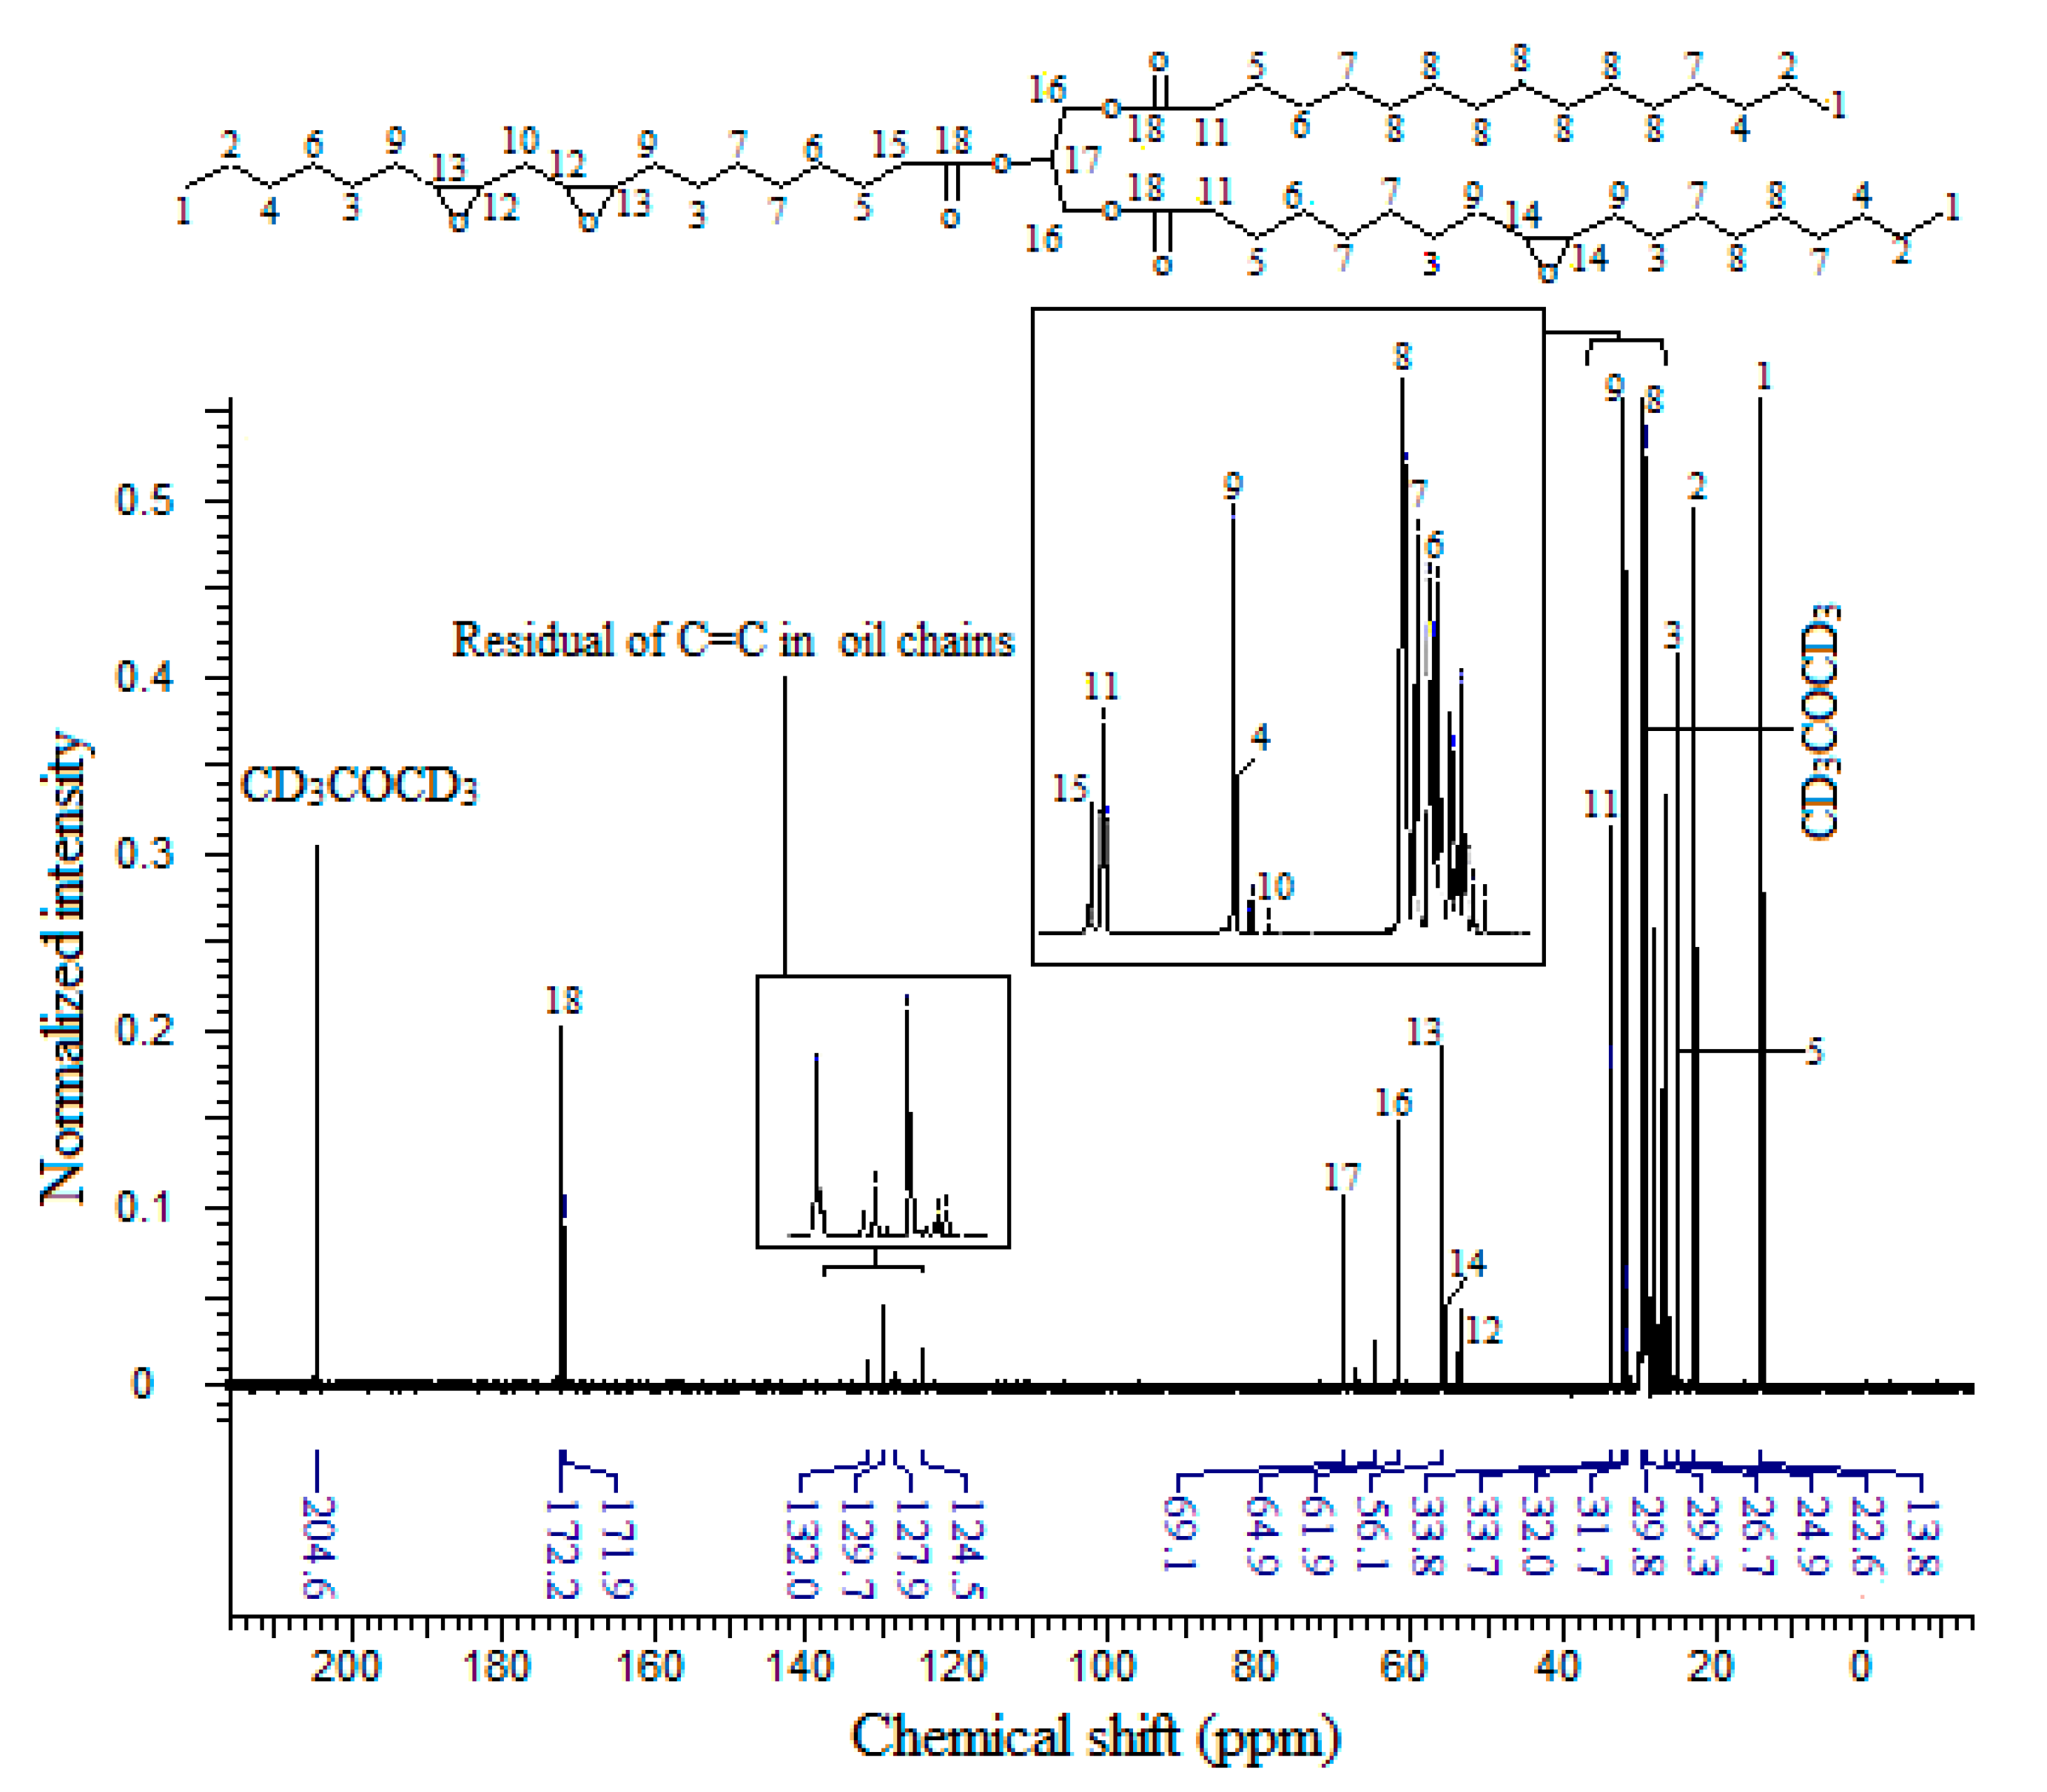
The
13C-NMR spectrum of EPOP is displayed by
Figure 6, where the acetone-d
6 carbons show two signals, the first one at δ 29.0 ppm corresponding to the methyl groups and the signal of the carbonyl group appears at δ 204.6 ppm.
Figure 6.
13C-NMR Spectrum of EPOP.
Figure 6.
13C-NMR Spectrum of EPOP.
The NMR peak at δ 13.8 ppm is related to the carbon atom of the methyl group at the terminus of the fatty acid backbone, –CH2-CH3 (C1), while the methylene groups showed different chemical shifts and peak positions due to the effects of the adjacent groups, and their position with respect to each functional group (δ, β, γ….). The carbon of the methylene groups in the position α to the methyl terminal groups (C2) –CH2-CH3 have an NMR peak at δ 22.6 ppm, while the methylene carbons β to the methyl (C4) absorbed at δ 31.7 ppm. The methylene in the γ position with respect to the CH3 groups (C7) appear at δ 29.7 ppm and methylene carbon (C6) shows a signal at δ 29.6 ppm.
The carbon of the methylene (C6) in the position γ to the carboxyl groups of the glycerol part >C=OCH2CH2CH2- showed a signal at δ 29.6 ppm, while the β carbon (>C=OCH2CH2CH2-) (C5) showed a peak at δ 24.9 ppm. The other methylene groups of the saturated fatty acid backbone (C8) appear at δ 29.8 ppm.
The carbon atoms of the epoxy rings (C13, C14 and C12) were found to have NMR signals in the δ 53.7–56.1 ppm region [
33,
34], while the carbon atom of the methylene group between the two epoxy moieties in the linoleic chain (C10) shows a resonance at δ 31.5 ppm. On the other hand, the methylene groups at the α position with respect to the epoxy groups (epoxy-
CH
2-C9) have NMR signals at δ 32.0 ppm; these groups are shifted downfield due to the electronegativity of the adjacent group. Similarly, the methylenes in the α position of the carboxylic acid groups of the glycerol part, C11 and C15, have signals at δ 33.7 and 33.8 ppm, respectively. The glycerol backbone contains two methylene groups (C16) with signals at δ 61.9 ppm, one methine group (C17) has a signal at δ 69.1 ppm, and the carbons of the carboxylic acid groups (C18) appear in the δ 171.9–172.2 ppm region.
According to the overall analysis of the 13C-NMR spectrum of EPOP, results were consistent with the proton NMR and FTIR results. However, the spectrum showed some signals related to the presence of unsaturated carbon (sp2) of the palm oil fatty acids i.e., a signal in the δ 129.6 ppm region for (>C=C<) moieties, and at δ 27.0–28.0 ppm signal assigned to α methylene groups attached to the unsaturated carbon atoms (>C=C-CH2-).
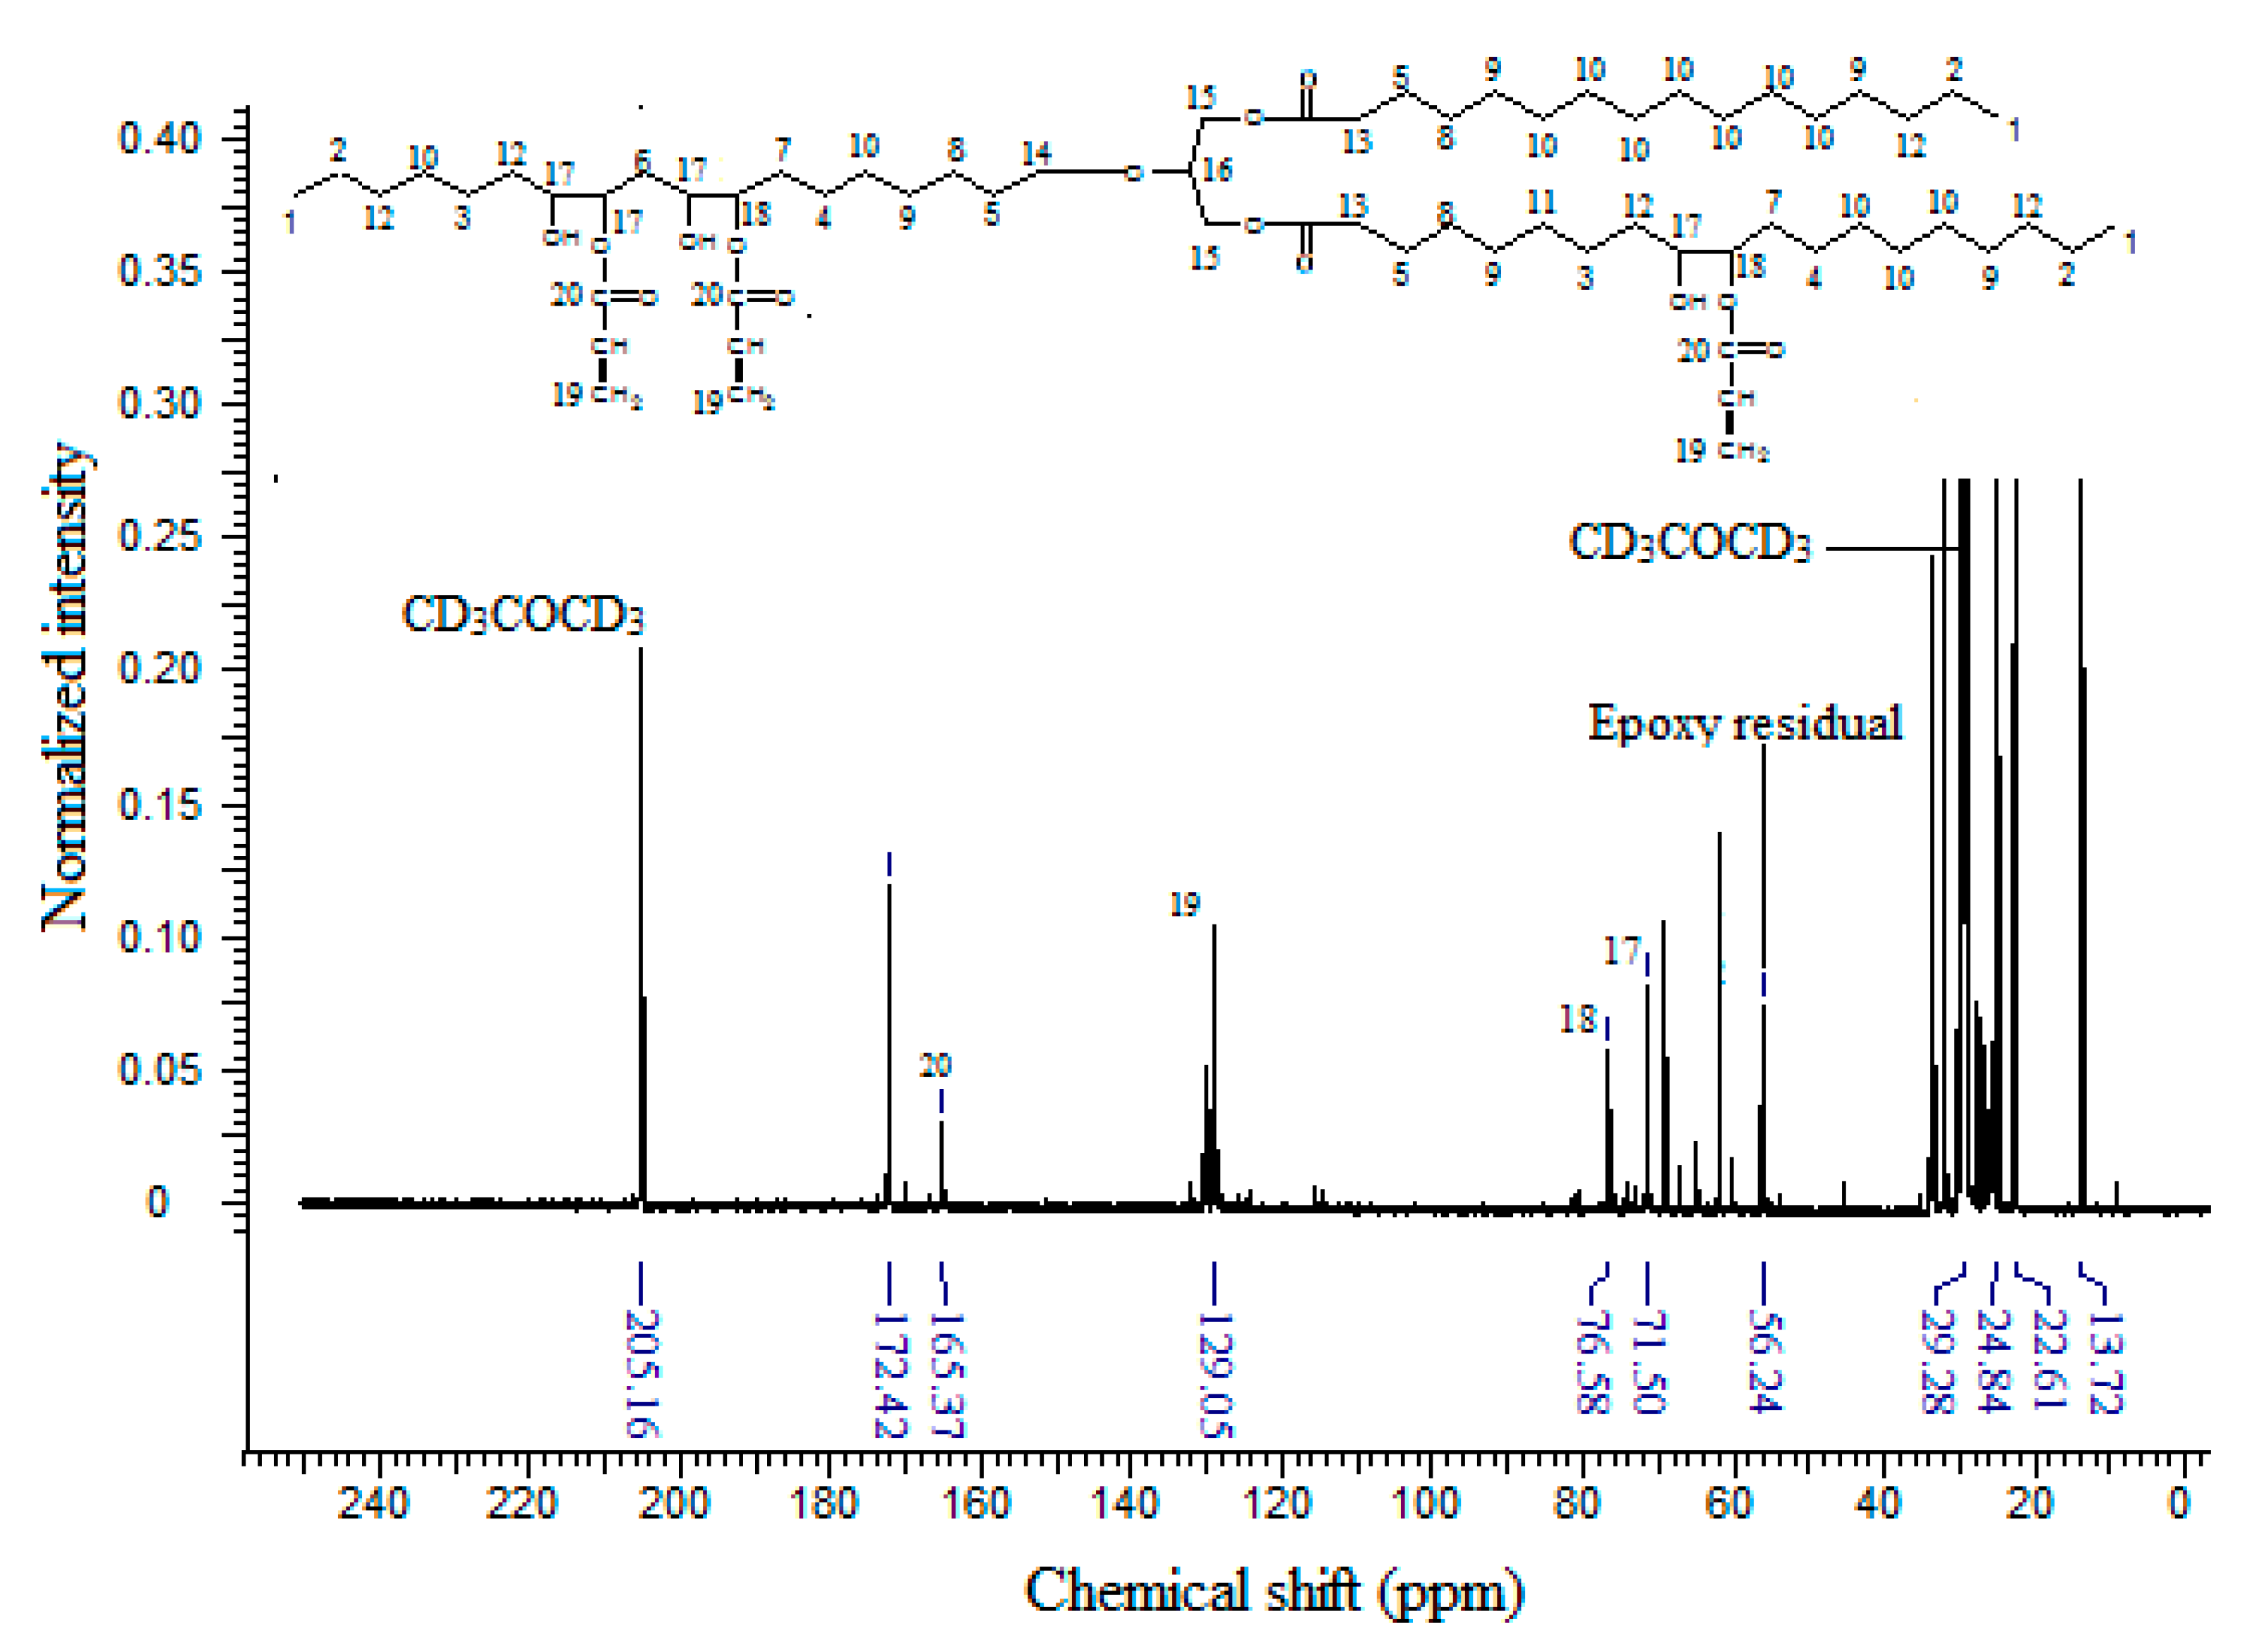
The
13C-NMR spectrum of EPOLA (
Figure 7) showed that the carbon atoms of the acrylate moieties (C19) have NMR signals in the δ 129.0–129.9 ppm region, while the carbonyl carbon atoms of the acrylate groups (C20), showed a resonance signal at δ 166.3 ppm. In addition to the presence of the acrylate carbons, tracing the carbon atoms C17 and C18, which are in the α position of the hydroxyl group and the ester groups, respectively, these show resonances in the δ 71.5–77.5 ppm region. These carbons originate from the oxirane rings, and they previously showed NMR signals in the δ 53 to 66 ppm region (
Figure 6), therefore they became more deshielded due to the stronger anisotropy of the new adjacent hydroxyl and ester groups. These results indicate clearly that the grafting of the acrylate groups on the backbone was achieved successfully.
Figure 7.
13C-NMR Spectrum of EPOLA.
Figure 7.
13C-NMR Spectrum of EPOLA.
2.3. Characterization of the Solid Cured Films of EPOLA
Mixtures of EPOLA resins, reactive acrylate monomers and 4% photoinitiator were exposed to UV radiation for different exposure times to obtain tack-free solid films. Free radical polymerization of EPOLA took place rapidly upon the exposure to UV radiation leading to formation of cross-linked networks; a UV radiation dose about 0.351 mJ/cm2 was found to be sufficient to obtain solid films.
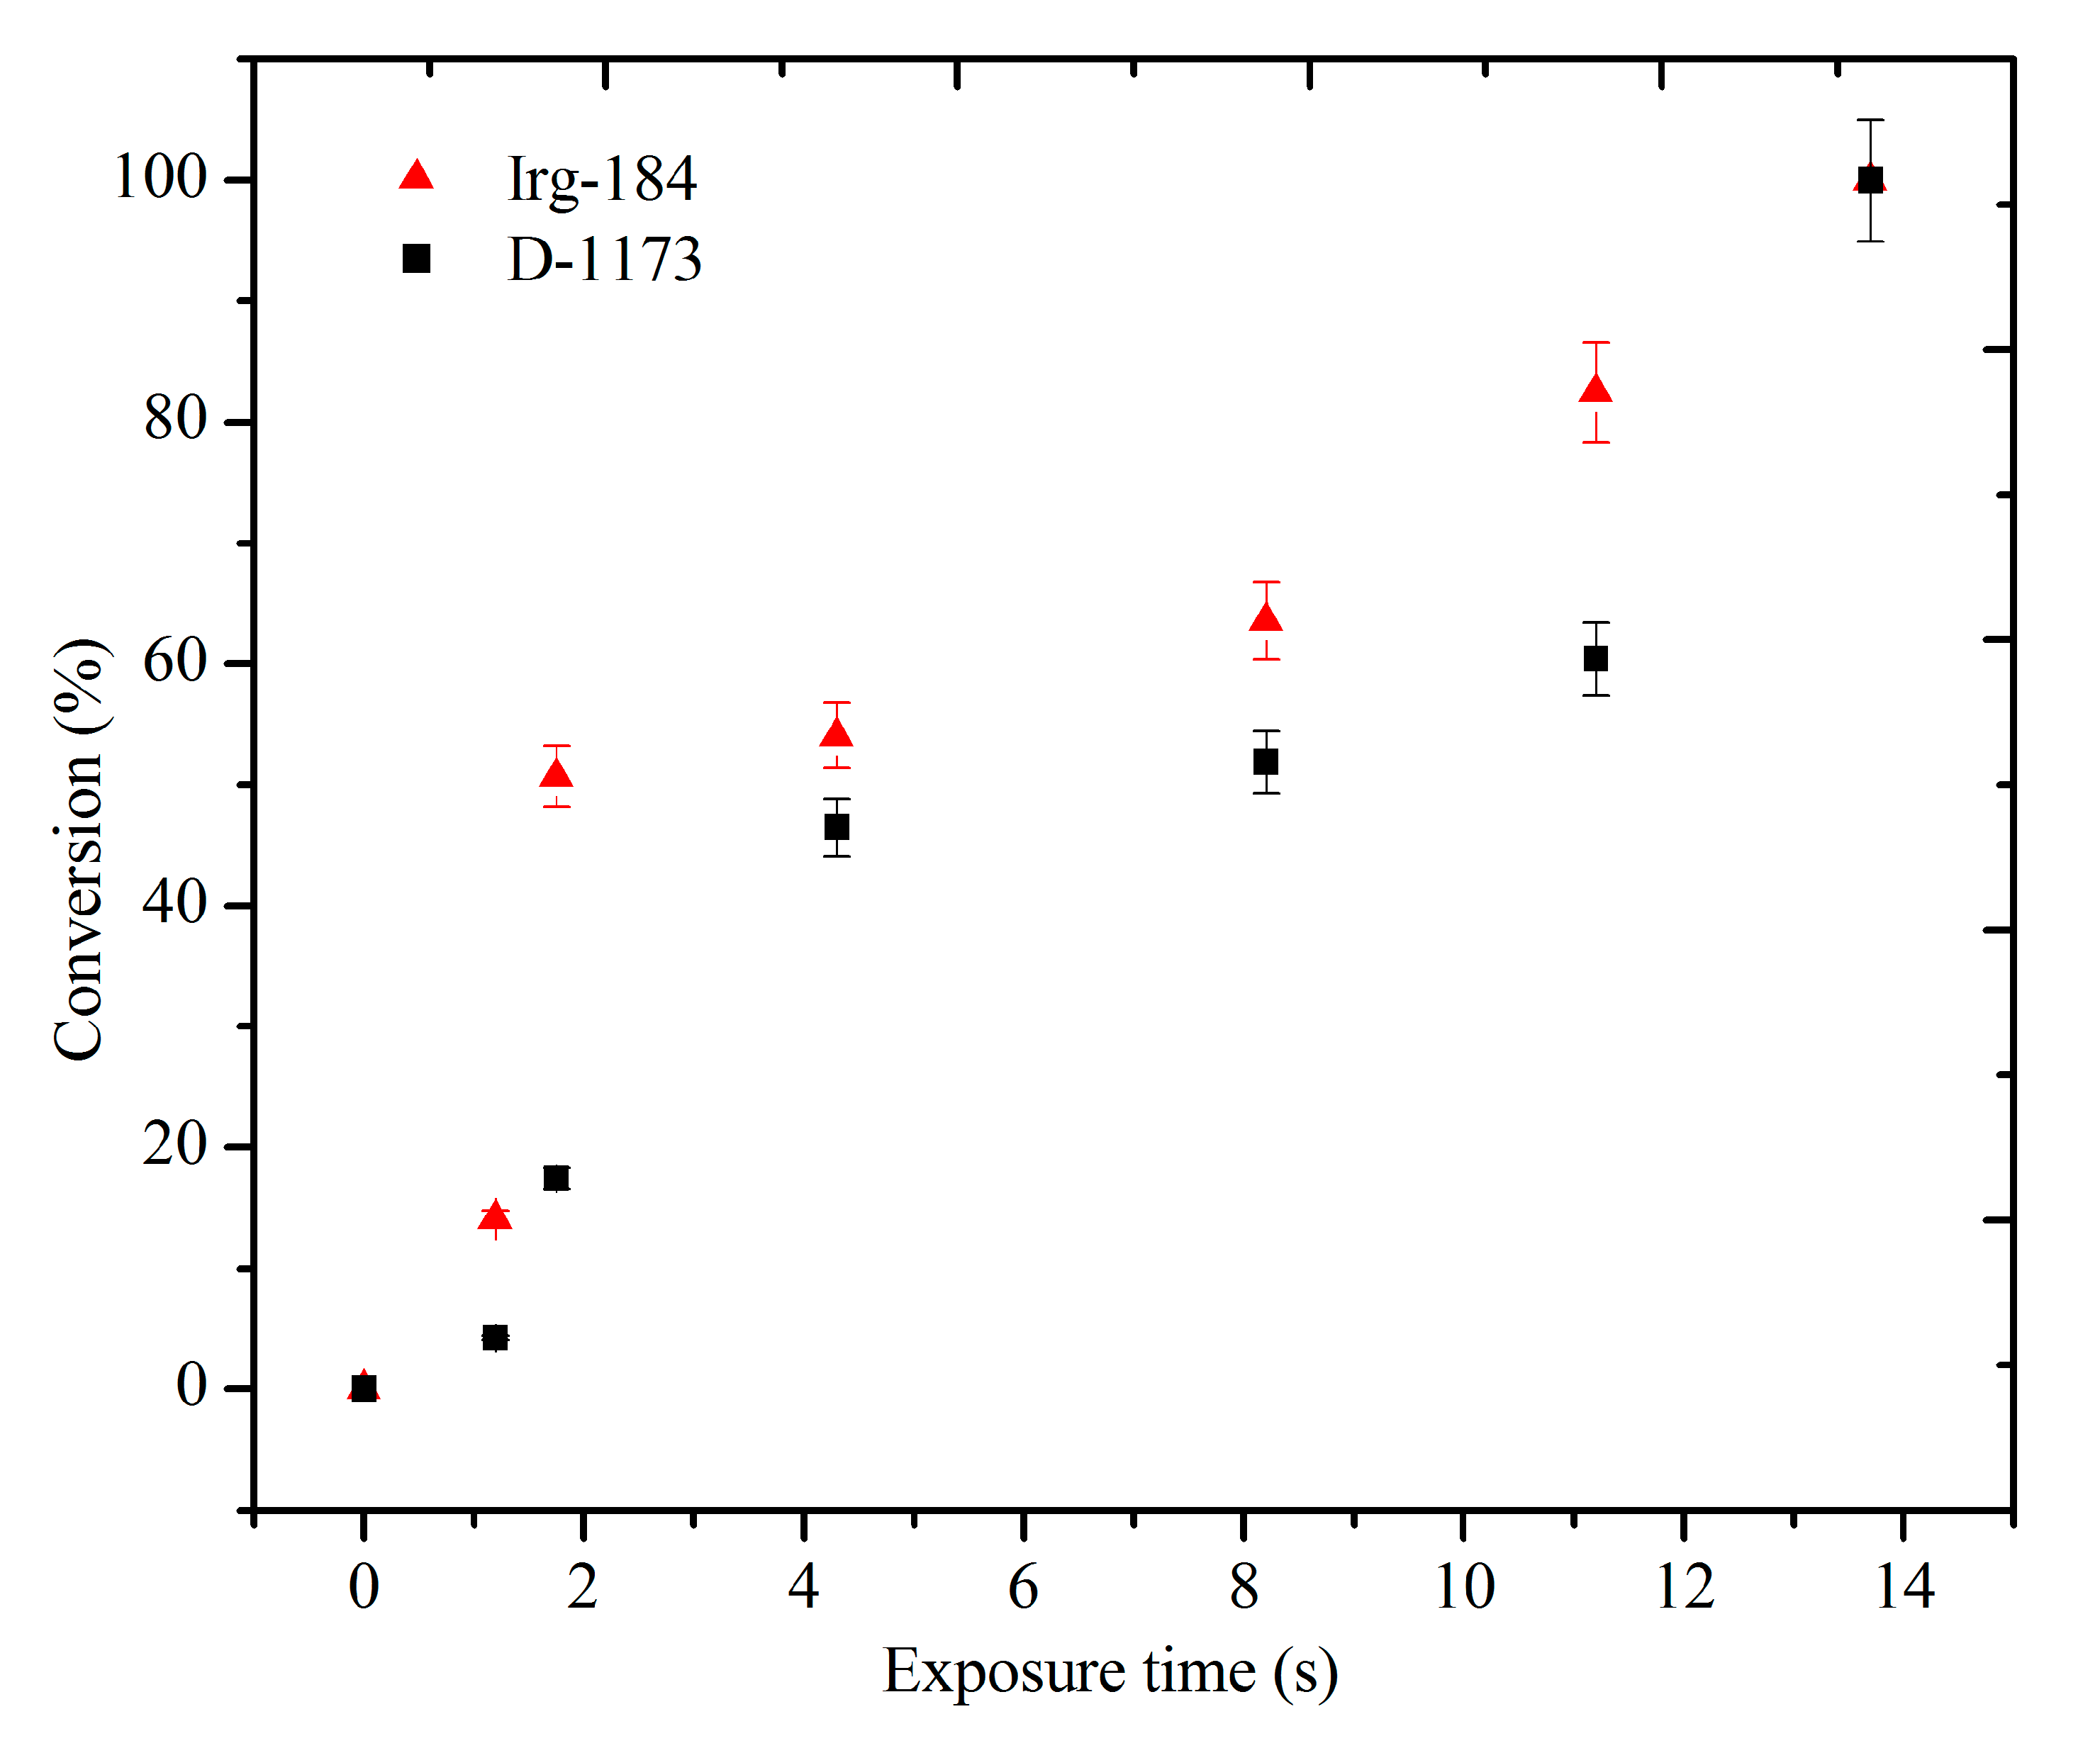
The curing behavior at different exposure times was studied by tracing the intensity of the FTIR band at 810 cm
−1 corresponding to the acrylate vinyl groups. The peak intensity decreased with increasing exposure time to UV radiation, indicating the consumption of the C=C double bonds in the polymerization reaction. The correlation between the exposure time and the percent conversion of the vinyl C=C using two types of photoinitiators,
i.e., D-1173 and Irg-184, is shown in
Figure 8.
Figure 8.
The Conversion of C=C in EPOLA UV cured Films (■) Photoinitiator D-1173 (▲) Photoinitiator Irg-184.
Figure 8.
The Conversion of C=C in EPOLA UV cured Films (■) Photoinitiator D-1173 (▲) Photoinitiator Irg-184.
It was observed that when the EPOLA films containing D-1173 as a photoinitiator were exposed to UV radiation for about 11.2 s, the percent conversion of the vinyl groups was about 60.3%, while, using Irg-184 for a similar exposure time led to a higher conversion of about 82.4%. These results imply that using Irg-184 to initiate the free radical polymerization of EPOLA, increases the chain transfer and the termination rate [
35], which lead to higher conversion, compared to D-1173, therefore it is more suitable for obtaining better curing of the EPOLA resin. However, extending the exposure time to 13.7 s led to the disappearance of the FTIR band at 810 cm
−1, indicating the total consumption of the vinyl groups, and the conversion percentage was 100% for both EPOLA films.
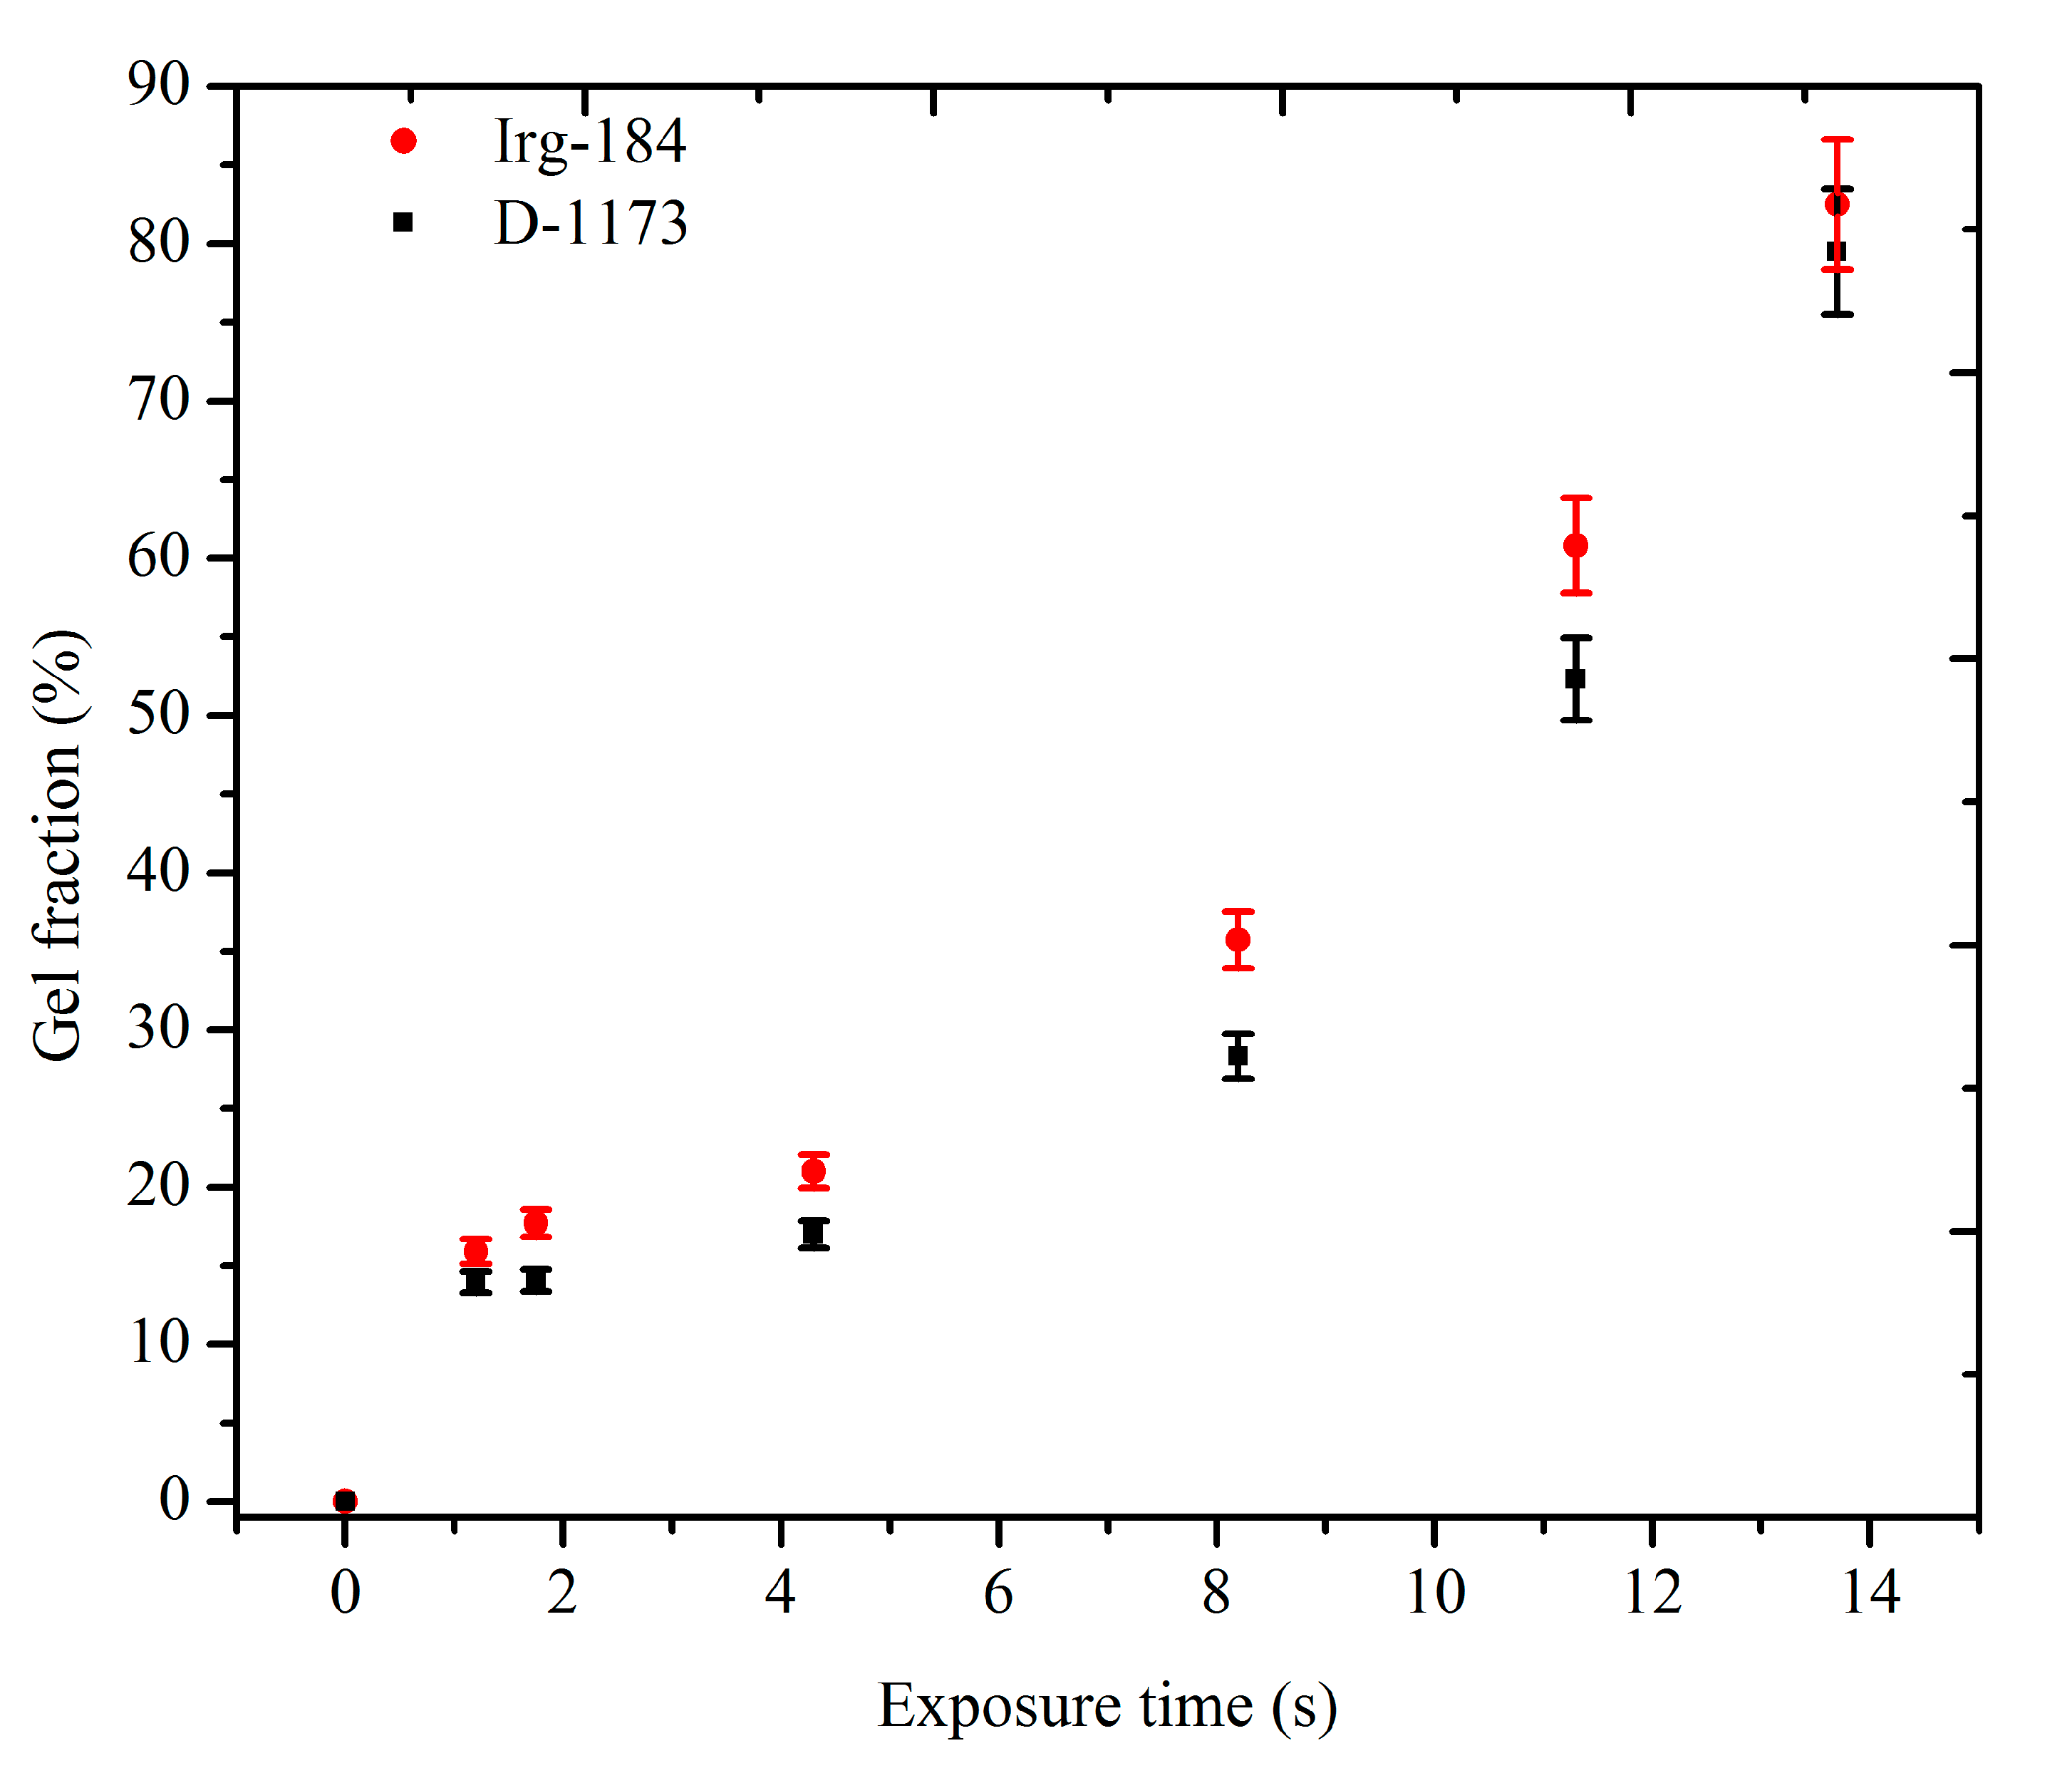
Figure 9 shows the gel fractions of the cured films against the exposure time to UV radiation. It was observed that the cured films obtained using Irg-184 as a photoinitiator, showed higher gel fraction percentages than those containing D-1173. This observation indicates the higher cross-linking density of the first films, and is in good agreement with the results of the conversion. The cross-linking densities were increased as the exposure time increased, which could be attributed to the increase of the deposited energy in the matrix, and resulted in a higher free radicals concentration. The highest cross-linking densities were obtained after 13.7 s exposure time, were about 79.5% and 82.5% of the D-1173 and Irg-184 films, respectively.
Figure 9.
Gel Fraction Percentages of the UV cured EPOLA Films (■) Photoinitiator D-1173 (●) Photoinitiator Irg-184.
Figure 9.
Gel Fraction Percentages of the UV cured EPOLA Films (■) Photoinitiator D-1173 (●) Photoinitiator Irg-184.
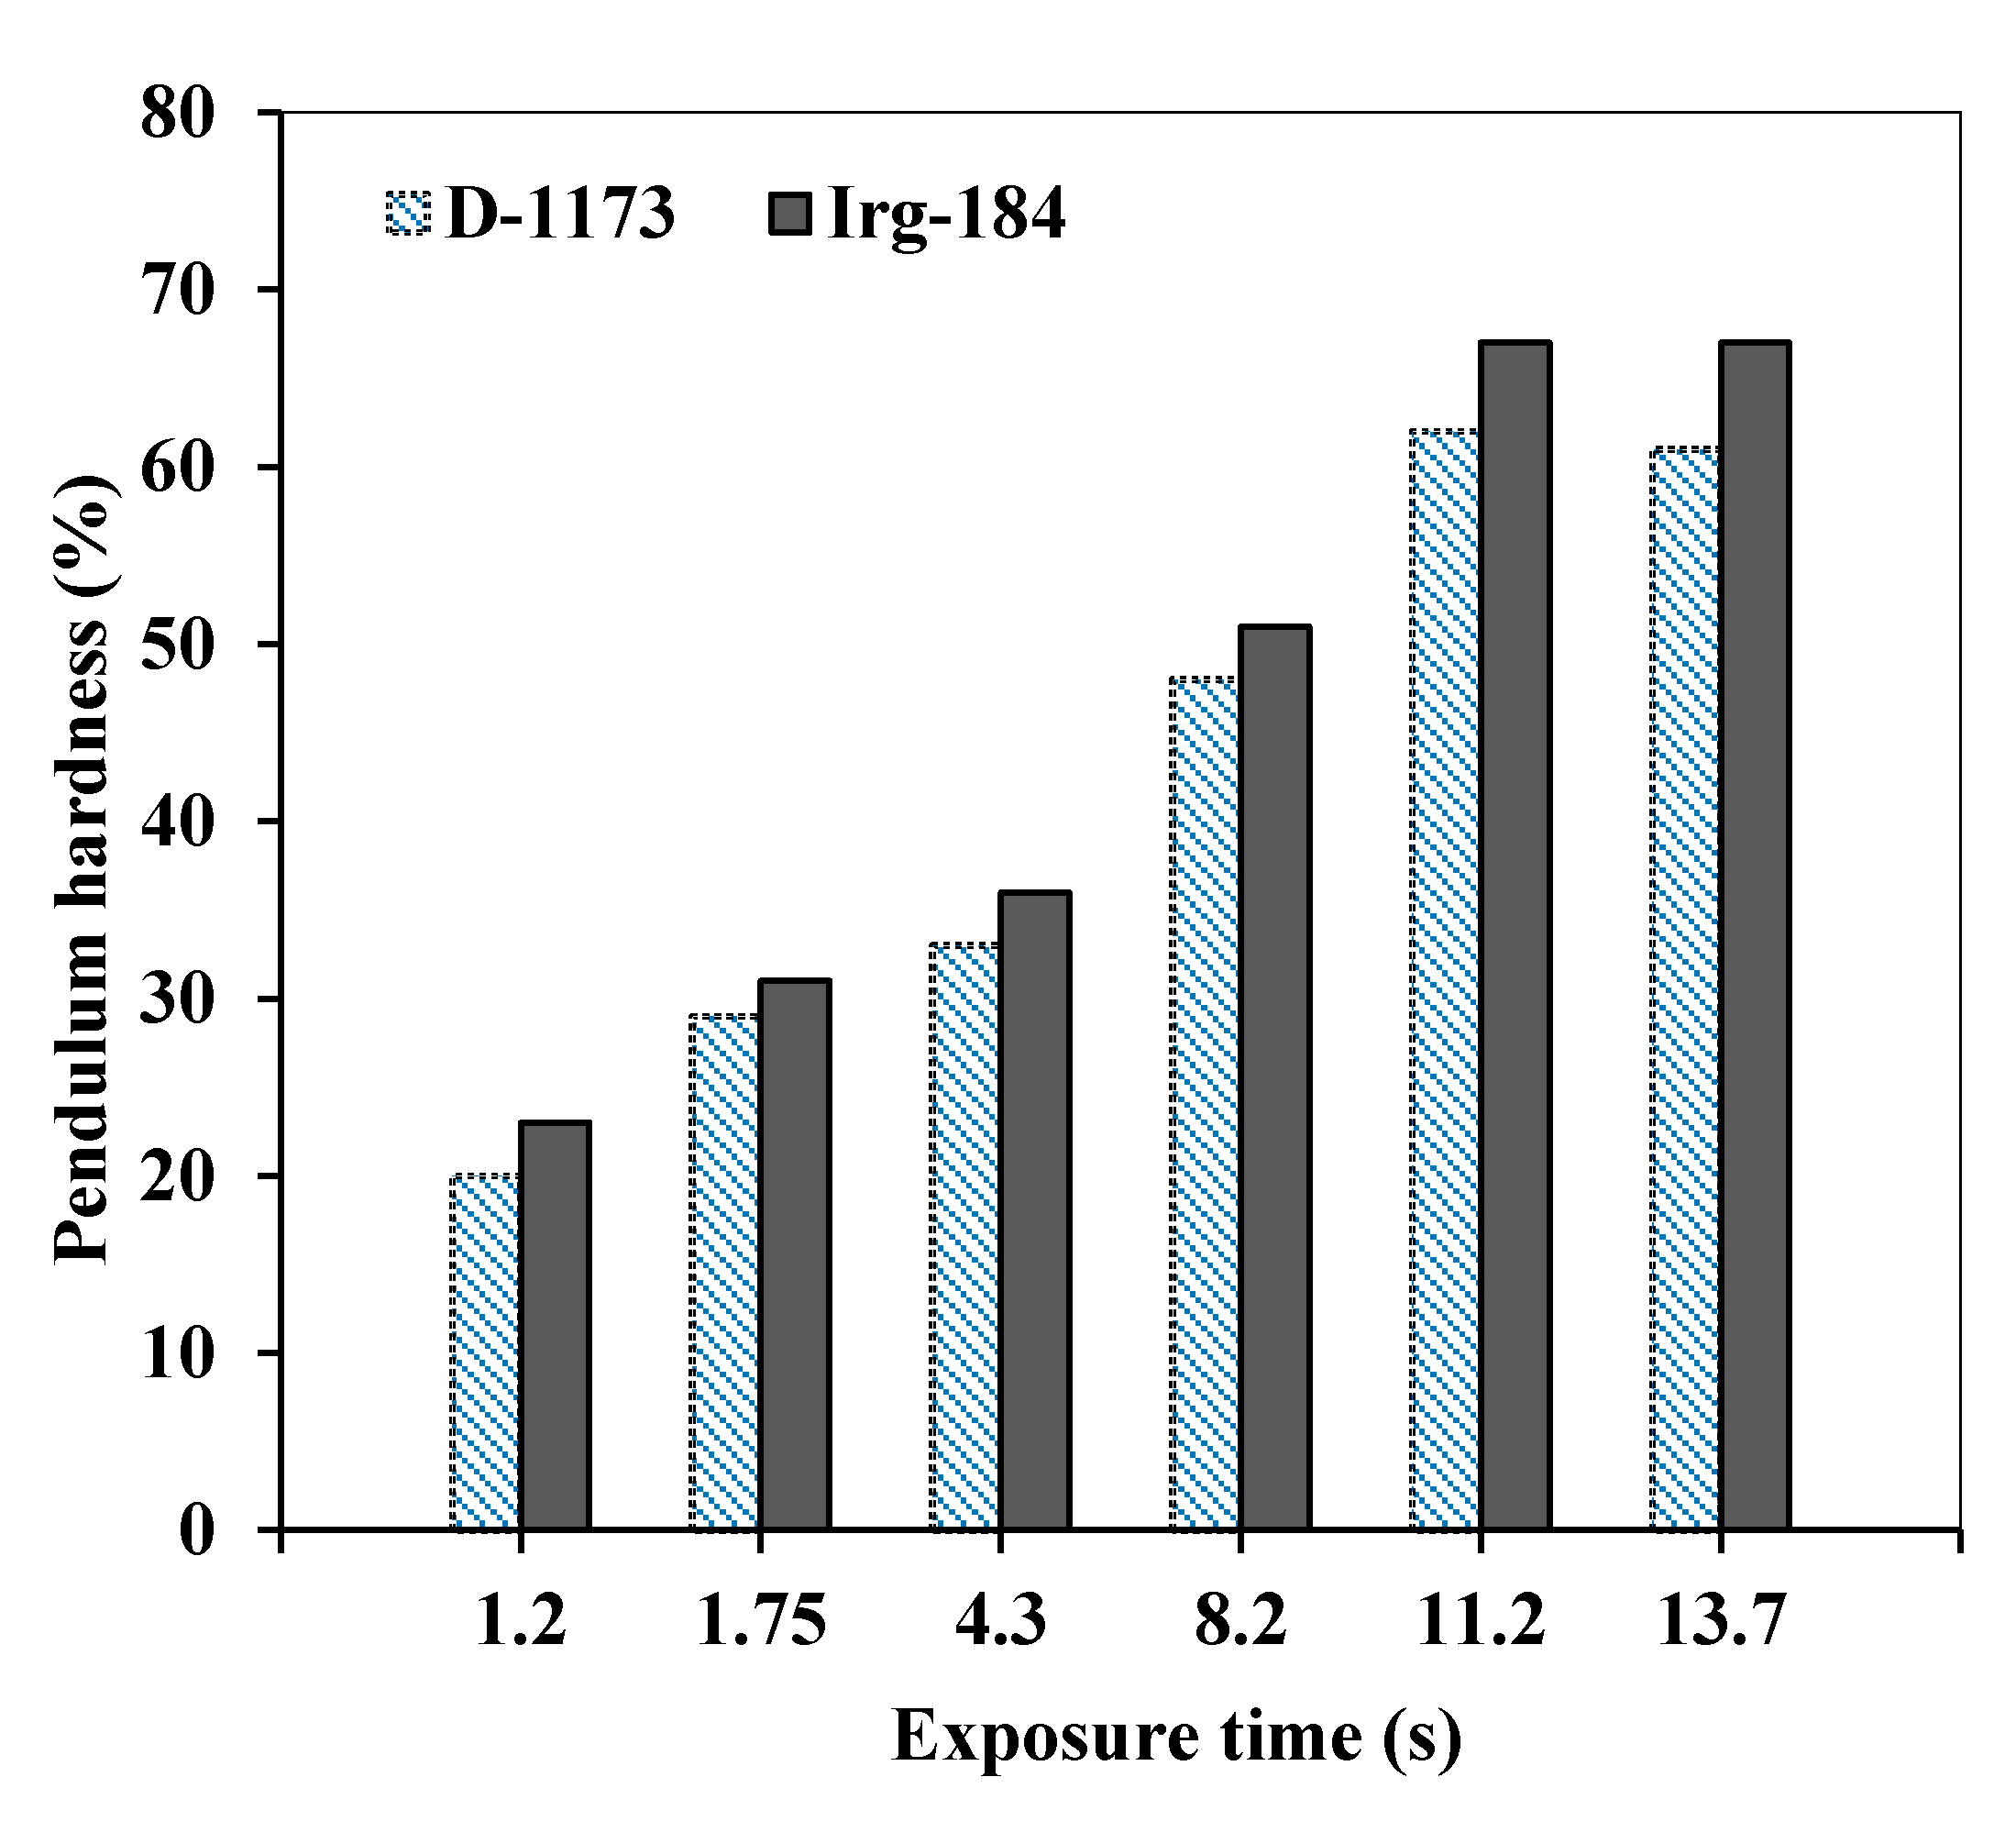
Similarly, the hardness of the cured EPOLA films shows better results when Irg-184 was used as photoinitiator (
Figure 10), which is consistent with the higher conversion rate and cross-linking density, compared to the results obtained by using D-1173 photoinitiator. The hardness percentage was higher than 60% when EPOLA films exposed to UV radiation for 11.2 s, and was found to better than EPOLA hardness results reported previously [
24]. Therefore, the overall results revealed that EPOLA films showed better performance when Irg-184 was used as photoinitiator, and it is more suitable than D-1173 to obtain better curing results for potential uses in coating applications.
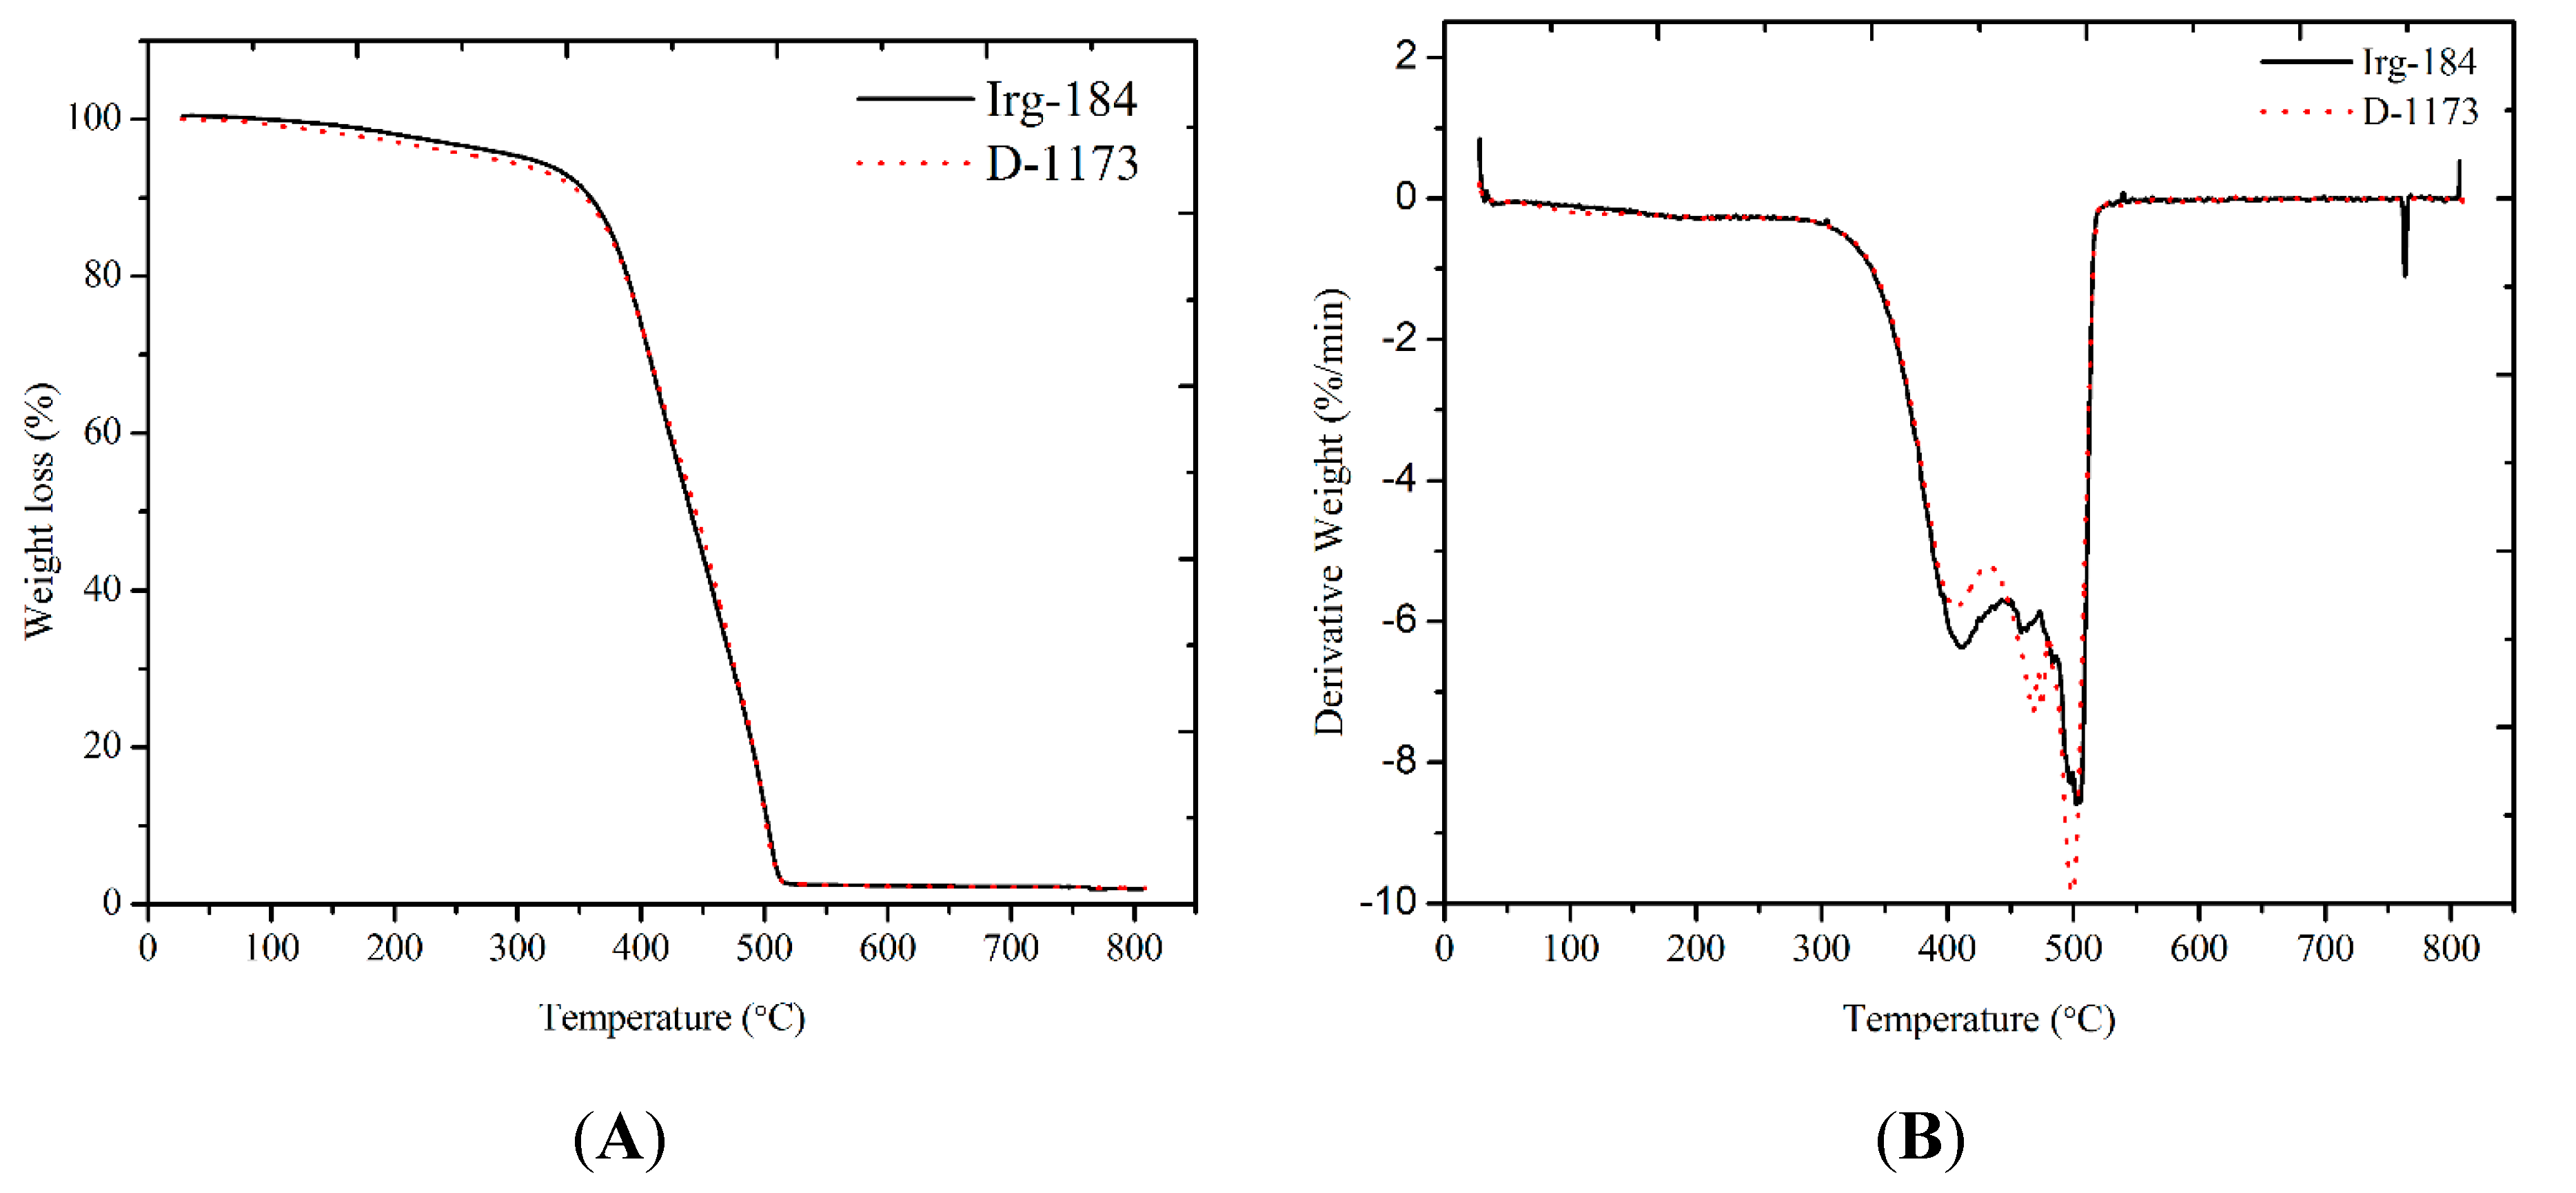
The thermal properties of EPOLA films were characterized by thermogravimetric analysis (TGA) under a N
2 atmosphere.
Figure 11A shows the TGA traces of EPOLA films, the weight derivatives curves (DTG) are shown in
Figure 11B and data are collected in
Table 4.
It has been observed that EPOLA films showed significant difference in the T
5% (temperature of 5% weight loss) values, and Irg-184 film showed a higher value by 31 °C, compared to D-1173 film. This result implies that the initial degradation temperature of the first film was higher than the second one, indicating a better thermal stability, which can be due to the higher cross-linking density. Moreover, the T
max (temperature of maximum degradation rate) showed higher value, confirming the higher thermal stability of the first films. In general, both EPOLA films showed similar degradation behavior, and lost a very small percentage of their weight in the temperature range below 200 °C, which can be attributed to the decomposition of the volatile components (
i.e., unreacted monomers and photoinitiator). The main degradation step was observed in the temperature range between 250 °C and 550 °C, related to the decomposition of the unreacted palm oil epoxy fatty acids, at a lower temperature compared to the polymerized epoxy acrylate parts, which are expected to dissociate at higher temperature [
36]. In addition, the char yields at 600 °C were found to be around 2.3% for both EPOLA films.
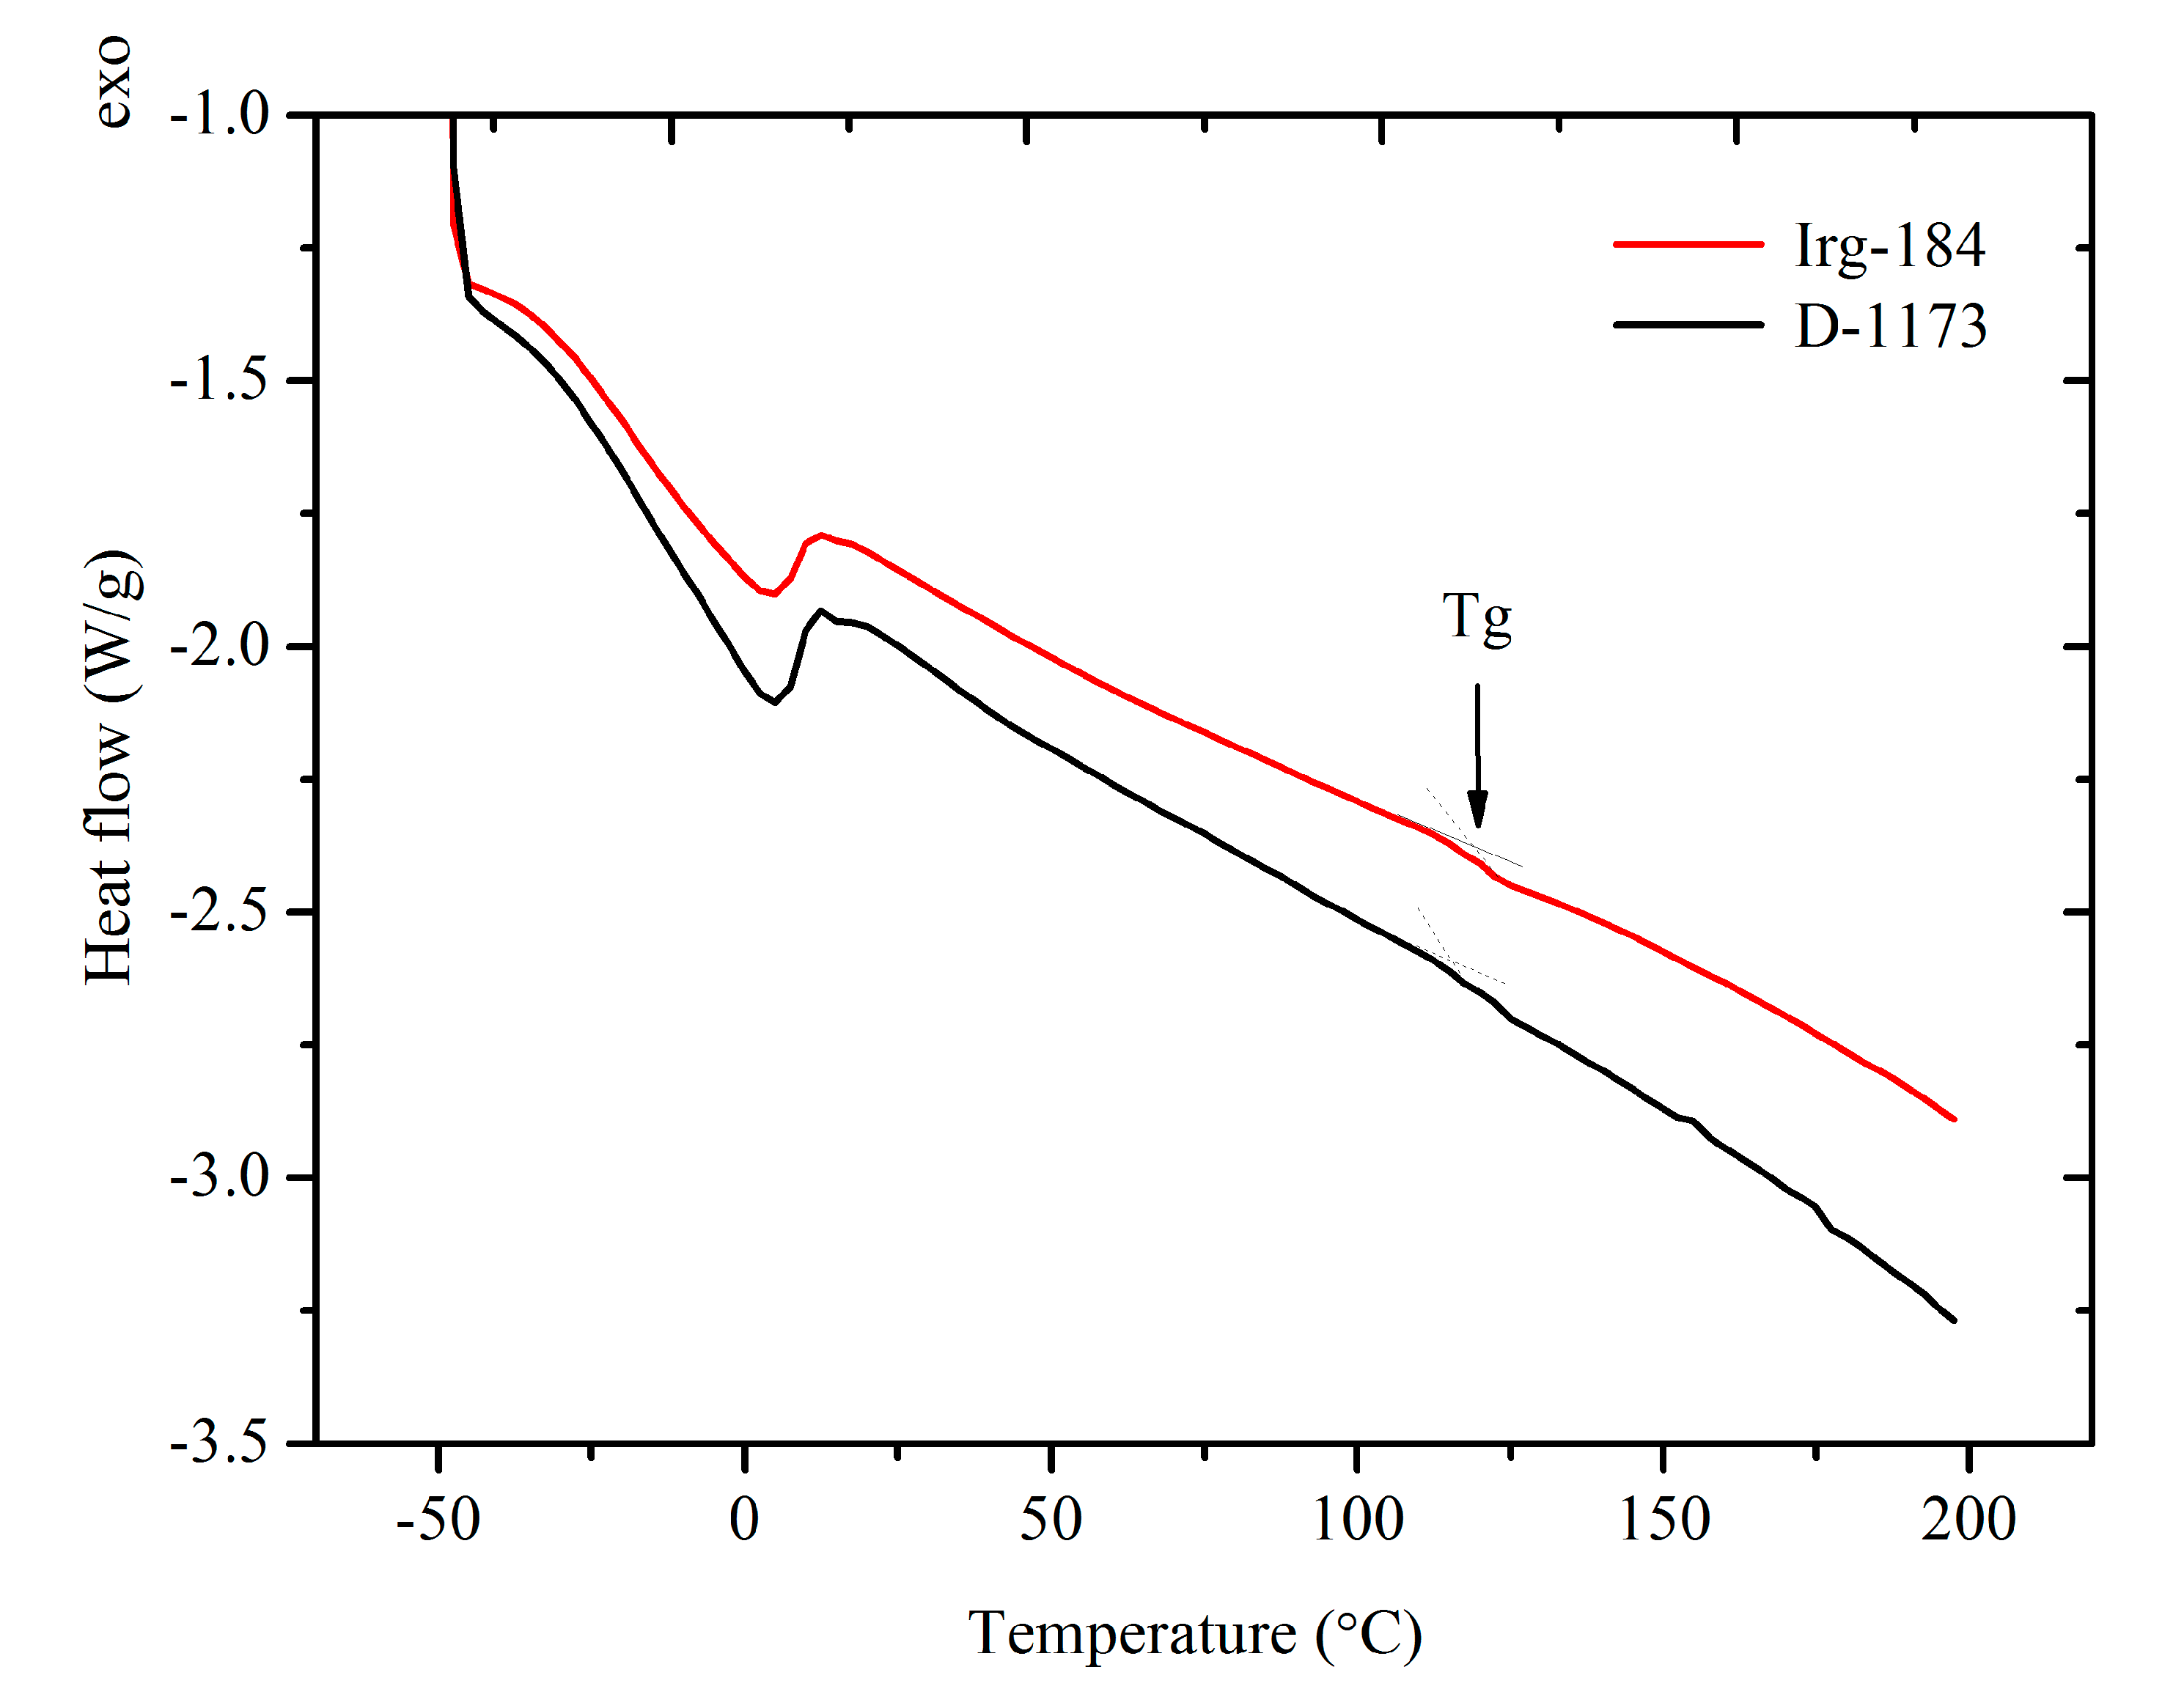
Figure 12 shows the DSC thermograms of EPOLA films containing Irg-184 and D-1173 photoinitiators. It was observed that both films showed only one glass transition temperature (
Tg), indicating that both systems have uniform structures. The
Tg value (
Table 4) of EPOLA film containing Irg-184 was about 119.6 °C, slightly higher than the value of EPOLA containing D-1173 (115.5 °C). This can be attributed to the higher cross-linking density in the first film, which leads to reduce the chain motion. These values are quiet similar to those reported by Kardar
et al. [
37].
Figure 10.
Pendulum Hardness Percentages of the UV cured EPOLA Films with D-1173 and Irg-184 Photoinitiators.
Figure 10.
Pendulum Hardness Percentages of the UV cured EPOLA Films with D-1173 and Irg-184 Photoinitiators.
Figure 11.
(A) TGA Thermograms and (B) Derivatives Curves of EPOLA Films with D-1173 and Irg-184 Photoinitiators.
Figure 11.
(A) TGA Thermograms and (B) Derivatives Curves of EPOLA Films with D-1173 and Irg-184 Photoinitiators.
Table 4.
Thermal data of EPOLA Films Containing Irg-184 and D-1173 Photoinitiators.
Table 4.
Thermal data of EPOLA Films Containing Irg-184 and D-1173 Photoinitiators.
| EPOLA | T5%/°C | T10%/°C | T50%/°C | Tmax/°C | Tg/°C | Char (%) |
|---|
| Irg-184 | 308.5 | 359.2 | 440.3 | 506.0 | 119.6 | 2.34 |
| D-1173 | 277.0 | 354.0 | 444.0 | 496.0 | 115.5 | 2.30 |
Figure 12.
DSC Therograms of EPOLA Films Containing Irg-184 and D-1173 photoinitiators.
Figure 12.
DSC Therograms of EPOLA Films Containing Irg-184 and D-1173 photoinitiators.
In summary, the obtained results showed that the thermal stability is better than that of the previously prepared UV-curable epoxy acrylates including arylene ether sulfone linkages. However, they reported higher solid residue percentages at 600 °C, revealing that the additional functional groups significantly improved the thermal and thermo-oxidative properties at high temperature [
38]. Similar findings were also reported in curable systems including phthalonitrile-functional phthalazazine, which indicated also the potential improvement of the thermal and thermo-oxidative stability by introducing such functional groups in the curable systems [
39].
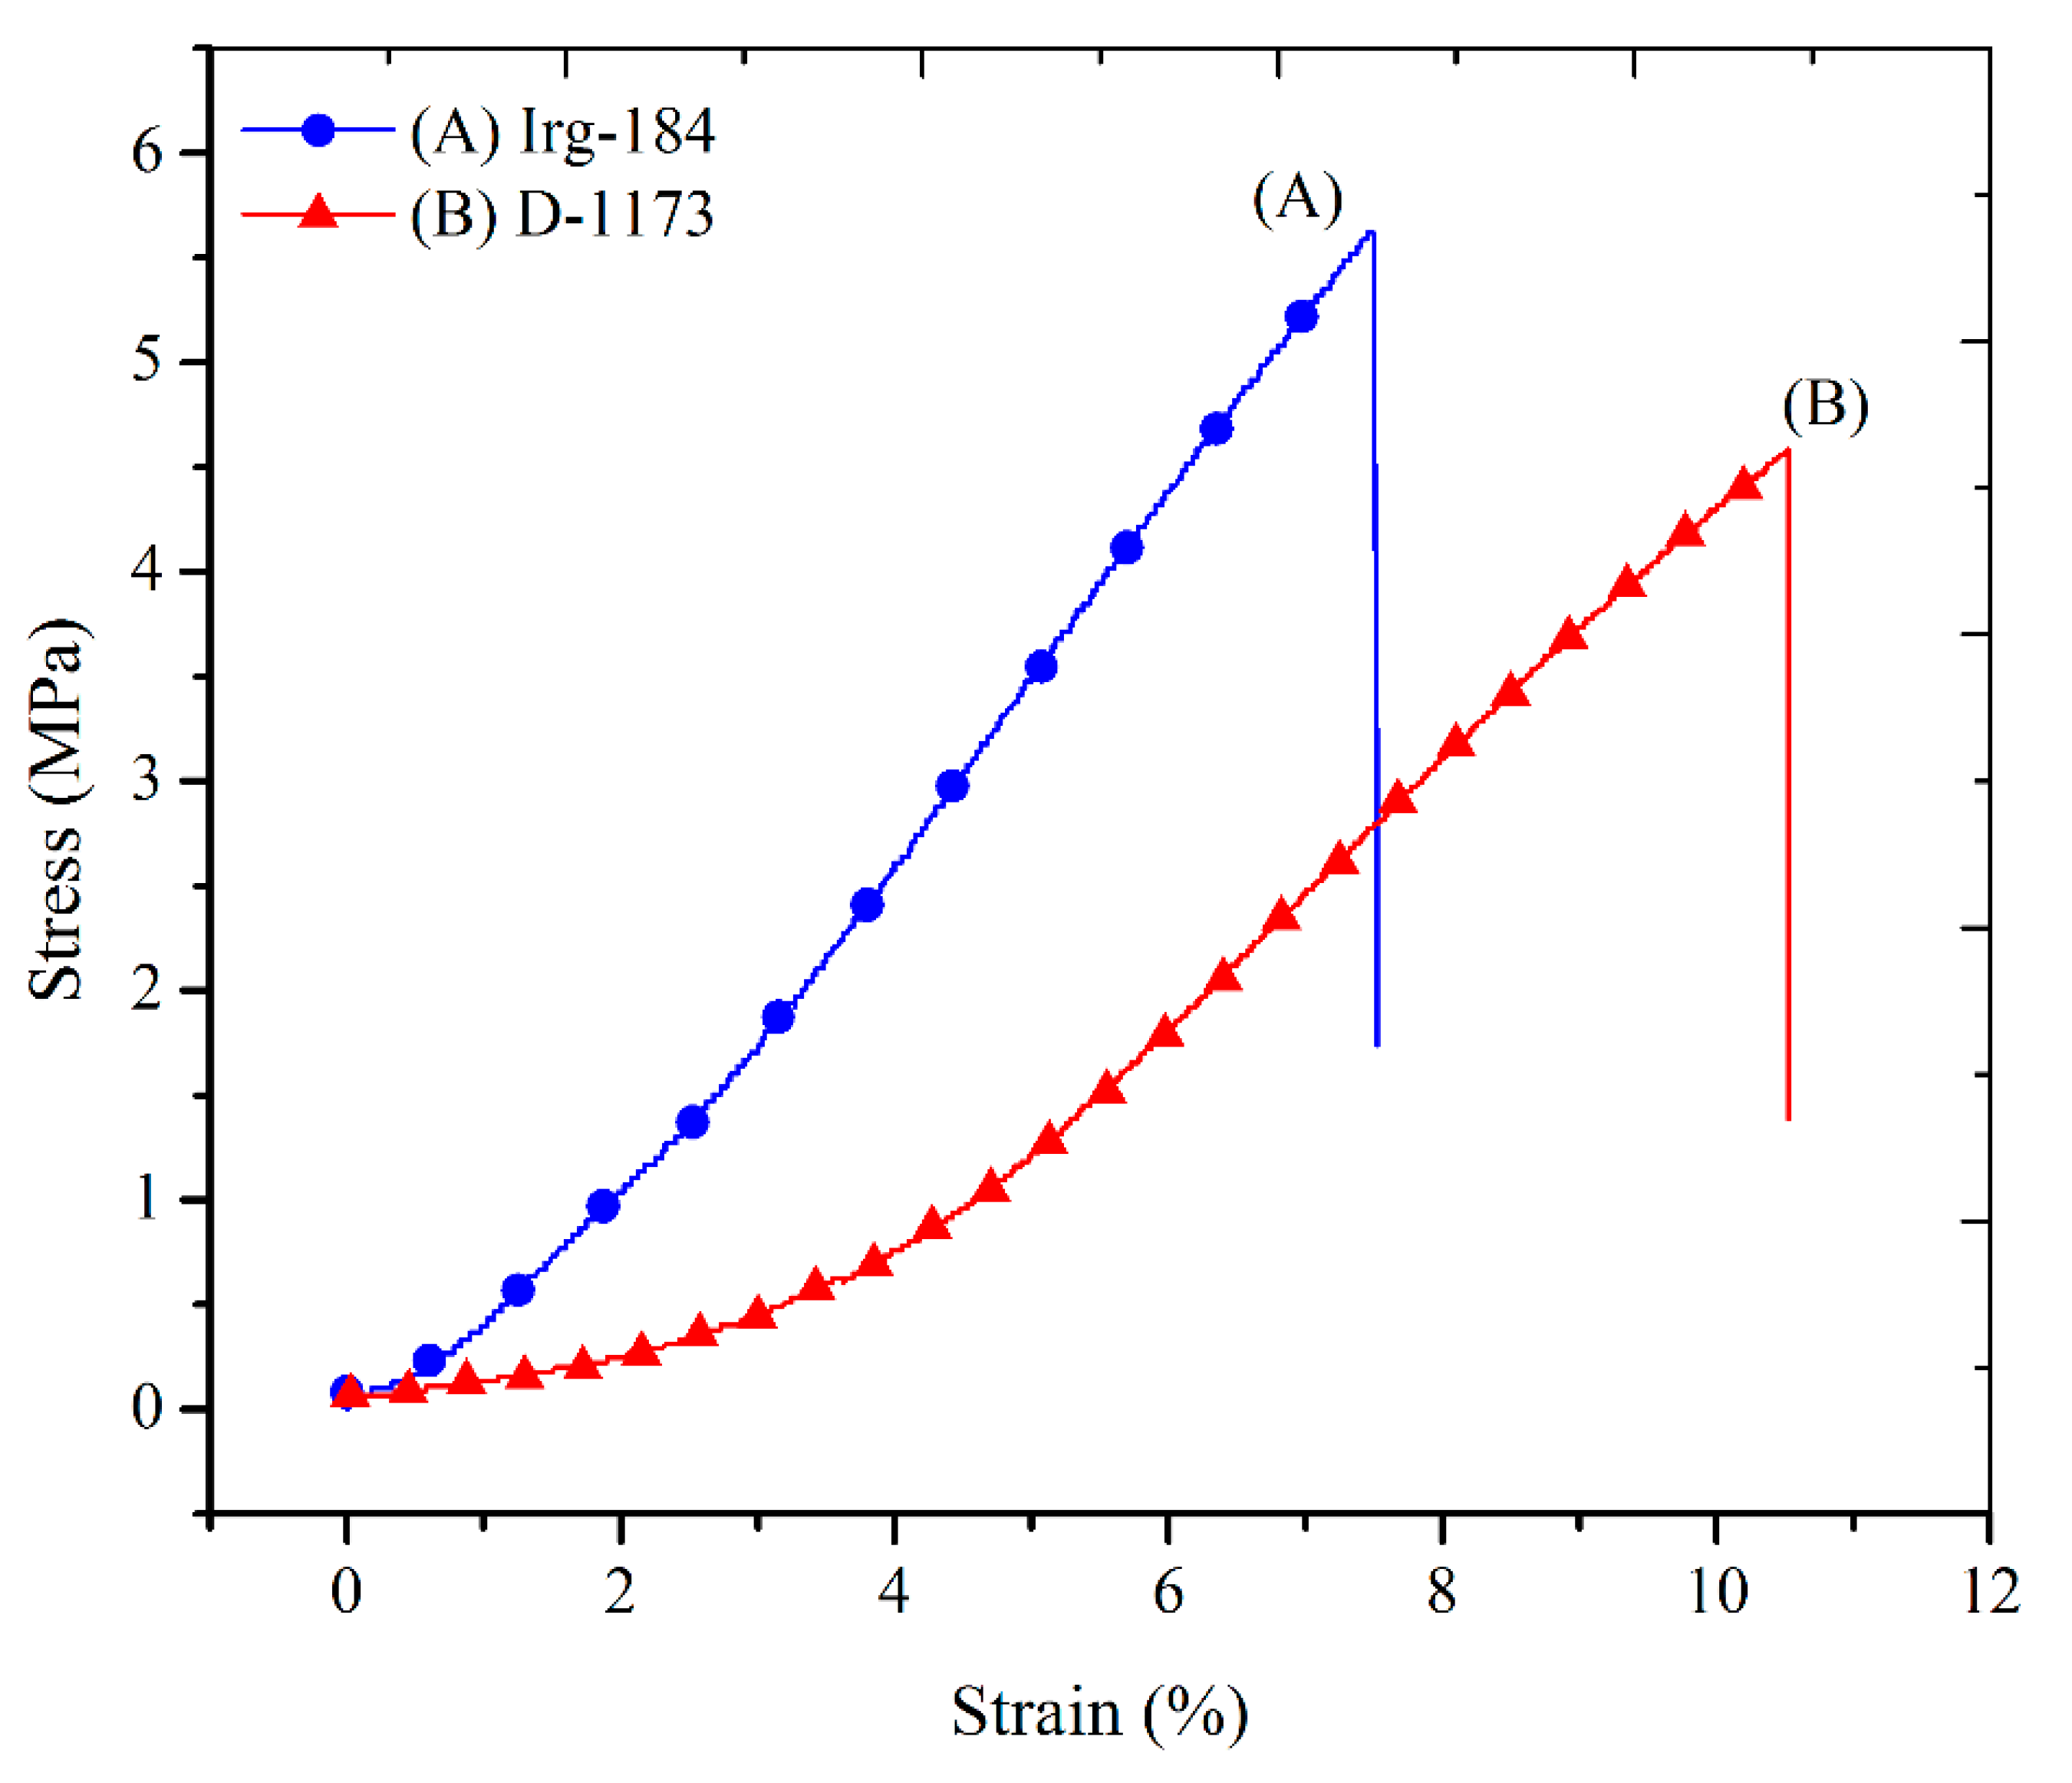
The stress-strain curves of EPOLA films are shown in
Figure 13. The typical values of the tensile strength, Young’s modulus and the elongation at break percentages are presented in
Table 5. It could be observed that EPOLA film containing Irg-184 has a higher tensile strength value compared to the film with D-1173. This result is compatible with the higher cross-linking density of the first films, which is attributed to the strong tethering between the epoxy acrylate chains, and therefore, higher stiffness. The Young’s modulus values showed more pronounced differences between the two EPOLA films, while the elongation at break was lower in the first film, confirming the higher stiffness due to the strong cross-linking. The obtained tensile values were found to be higher than those of a previously reported vernonia oil-based epoxy acrylate [
10], while, Li
et al., reported better mechanical properties when they investigated a soybean oil-based epoxy acrylate [
40].
Figure 13.
Stress-strain Curves of EPOLA Films Containing Irg-184 and D-1173 Photoinitiators.
Figure 13.
Stress-strain Curves of EPOLA Films Containing Irg-184 and D-1173 Photoinitiators.
Table 5.
Tensile strength, Young’s Modulus and Elongation at break of EPOLA Films Containing Irg-184 and D-1173 Photoinitiators.
Table 5.
Tensile strength, Young’s Modulus and Elongation at break of EPOLA Films Containing Irg-184 and D-1173 Photoinitiators.
| EPOLA | Tensile Strength (MPa) | Young’s Modulus (MPa) | Elongation at Break (%) |
|---|
| Irg-184 | 6.2(±0.7) | 65.7(±5.0) | 8.7(±0.15) |
| D-1173 | 5.2(±1.2) | 53.6(±2.3) | 12.5(±0.19) |


