Article

New Fluorescence Probes for Biomolecules

Faculty of Chemical Technology and Engineering, University of Science and Technology, UTP, Bydgoszcz 85-326, Poland
*
Author to whom correspondence should be addressed.
Molecules 2015, 20(7), 13071-13079; https://doi.org/10.3390/molecules200713071
Submission received: 12 June 2015 / Revised: 8 July 2015 / Accepted: 9 July 2015 / Published: 20 July 2015
(This article belongs to the Section Molecular Diversity)

Abstract

:
Steady state fluorescence measurements have been used for the investigation of interaction between the bovine serum albumin (BSA) and fluorescence probes: 3-hydroxy-2,4-bis[(3-methyl-1,3-benzoxazol-2(3H)-ylidene)methyl]cyclobut-2-en-1-one (SQ6), 3-hydroxy-2,4-bis[(3-methyl-1,3-benzothiazol-2(3H)-ylidene)methyl]cyclobut-2-en-1-one (SQ7) and 3-hydroxy-2,4-bis[(1,3,3-trimethyl-1,3-dihydro-2H-indol-2-ylidene)methyl]cyclobut-2-en-1-one (SQ8). The binding constant between bovine serum albumin and squarine dyes has been determined by using both the Benesi-Hildebrand and Stern-Volmer equations. The negative value of free energy change indicates the existence of a spontaneous complexation process of BSA with squarine dyes.

Graphical Abstract

1. Introduction

The development of efficient and photostable fluorophores that absorb and emit in the visible and near-infrared spectral regions is of interest in many fields, such as optical engineering, analytical chemistry, biology, and medicine as new revolutionary tools for noninvasively and simple in vivo optical imaging. The visible and NIR fluorescent dyes have been often used, having the lowest autoabsorption and autofluorescence of biomolecules in the visible and NIR regions and the possibility to use low-cost excitation light sources [1,2,3,4,5,6,7,8,9,10,11,12,13].
There are several examples of BODIPY-based chemosensors. Boratriazaindacene derivatives act as chemosensors for metal cations and shows spectacular metal ion selectivity [14].
Among the metal ions showing minor fluorescence changes, whereas on addition of Hg (II) at the same concentration, the emission ratio changes more than 90-fold. Squarine dyes are ideally suited for this purpose because of their favourable optical properties associated with the peculiar zwitterionic structure, which gets perturbed with metal ions, pH, and other additives [15]. The naphthalimide and rhodamine derivatives are also reported as chemosensors for detection metal cations such as Pb(II), Cd(II), Cu(II), Ag(I) and other [16,17,18,19,20,21].
An environmental sensitive NIR fluorescent squarine dye with a thiol-reactive linker has been applied for biosensing of glucose [22].
The squarine dye molecular structures, strategies to shift the absorption and emission bands of such dyes into the visible and NIR region of the spectrum—which are outside of the self-absorption and self-emission region of biological molecules—and their spectroscopic properties are comprehensively presented eluding to their applications.
In the present paper, the series of squarine dyes are presented for their applicability as probes for detection of proteins, particularly albumins. For these purposes, the fluorescent properties of dyes in the presence of bovine serum albumin were investigated. The structure of squarine dyes selected for this study are shown in Scheme 1.
Scheme 1. Structures of squarine dyes.
Molecules 20 13071 g005

2. Results and Discussion

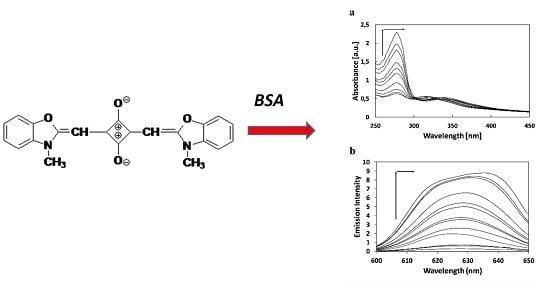
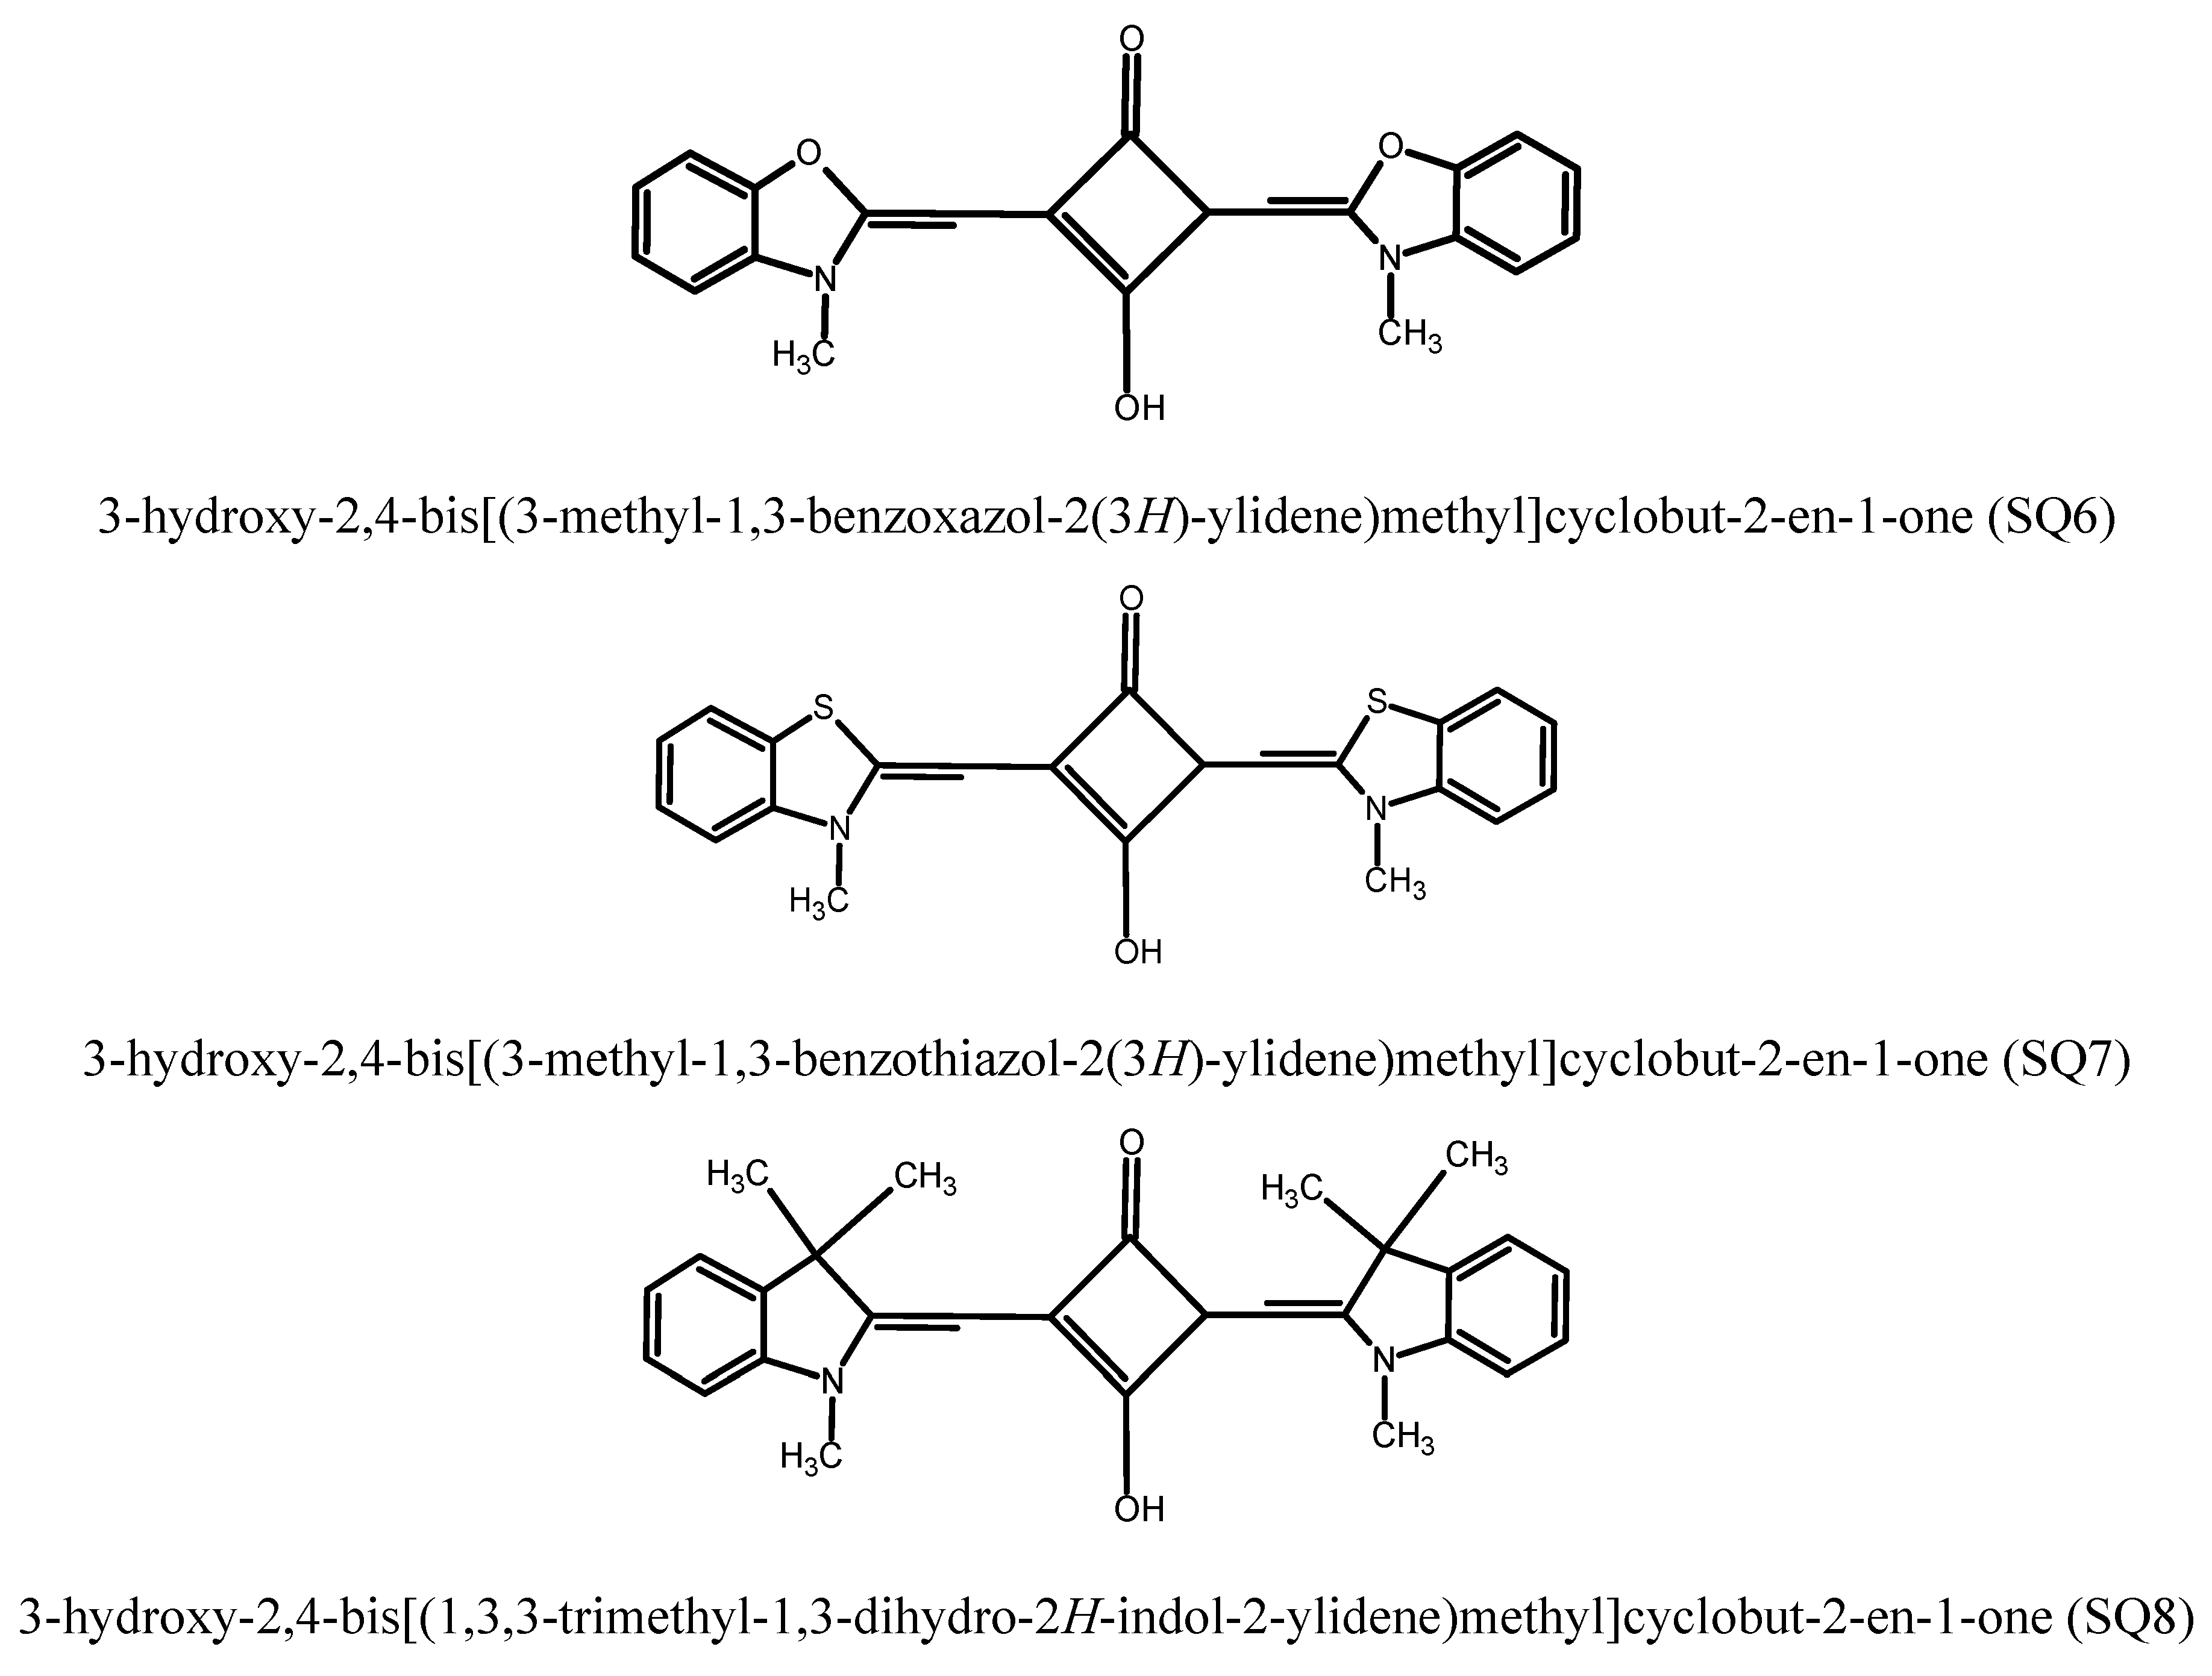
2.1. The Study of Squarine with BSA Association Process

The spectral data of squarine dyes in different solvents are listed in Table 1. For all dyes the red shift of the absorption band was observed with increasing of solvent polarity except water for SQ6 and dichloromethane for SQ8.
Table 1. Spectral data of dyes in different solvents.
DyeSolventAbsorption (nm)ε1ε2ε3
λ1λ2λ3(×105 mol−1·cm−1·L)(×105 mol−1·cm−1·L)(×105 mol−1·cm−1·L)
SQ6Dichloromethane283316 0.610.46
Methanol278330 0.5070.48
DMSO284343 0.390.437
Water275316 0.7770.595
SQ7Tetrahydrofurane625 1.25
Methanol629 1.135
Nitromethane631 1.25
Acetonitrile635 1.19
DMSO639 2.45
SQ8Dichloromethane5616147950.020.0230.014
Acetone5546037880.0240.030.014
Methanol5546097800.0450.0490.025
Nitromethane5556077870.0460.0490.029
Acetonitrile5526027850.0270.0290.013
DMSO568611 0.0490.055
As shown in Figure 1, the changes in absorption and emission spectra of SQ6 as an effect of increasing concentration of bovine serum albumin results in an increase of the absorbance at 277 without changing the position of the first absorption maximum and with a gradual red shift of the second absorption maximum from 316 nm to 350 nm. The similar effect was observed on absorption spectra of SQ7 and SQ8. The absorbance increasing at 277 nm without a shift of maxima and with a red shift from 620 to 640 nm was observed for the SQ7. The fluorescence spectra showed a gradual shift of emission maxima from 622 to 637 nm (SQ6), 675 to 732 nm (SQ7) and 680 to 650 nm (SQ8), respectively.
The binding constant of monomeric dyes with albumin, K in M−1 and the binding parameters were determined basing on the equilibrium [Equation (1)]:
S Q + B S A k S Q : B S A K = [ S Q : B S A ] b [ S Q ] f [ B S A ] f
where [SQK:BSA], [SQK] were concentration of bounded and free dye, respectively. The concentration of each components can be expressed in terms of fluorescence intensity. Assuming that the concentration of protein-dye complex is very low compared to the free BSA concentration, the modification of Benesi-Hildenbrand equation can be written as follows (Equation (2)) [23,24].
1 I I 0 = 1 I 1 I 0 + 1 ( I 1 I 0 ) K [ B S A ]
where I0 and I is intensity of dye in absence and presence of bovine serum albumin.
Figure 1. Effect of increasing concentration of BSA on the absorption (a) ([BSA] = 0, 2, 3, 7, 13, 16, 20, 27, 30, 40 µM) and fluorescence emission (b) ([BSA] = 0, 2, 3, 7, 13, 16, 20, 27, 30, 40, 80, 100, 140 µM) spectra of SQ6 ([SQ6] = 150 µM).
Molecules 20 13071 g001
The plots of 1/(I − I0) vs. 1/[BSA] presented on Figure 2b,c shows the linear fitting is less correlated than parabolic fitting which suggests to 1:2 complexation between fluorophore and protein with very high binding constants 2.58 ´ 104 (SQ6), 3.03 #x00B4;; 106 (SQ7), 1.02 #x00B4;; 106 M−2 (SQ8), respectively. From the value of binding constants, it is known that the all squarine dyes bind very strongly with BSA. The calculated negative free energy change, ΔG (Table 2) from the K value for squarine:BSA binding process indicated that spontaneous complexation occurs.

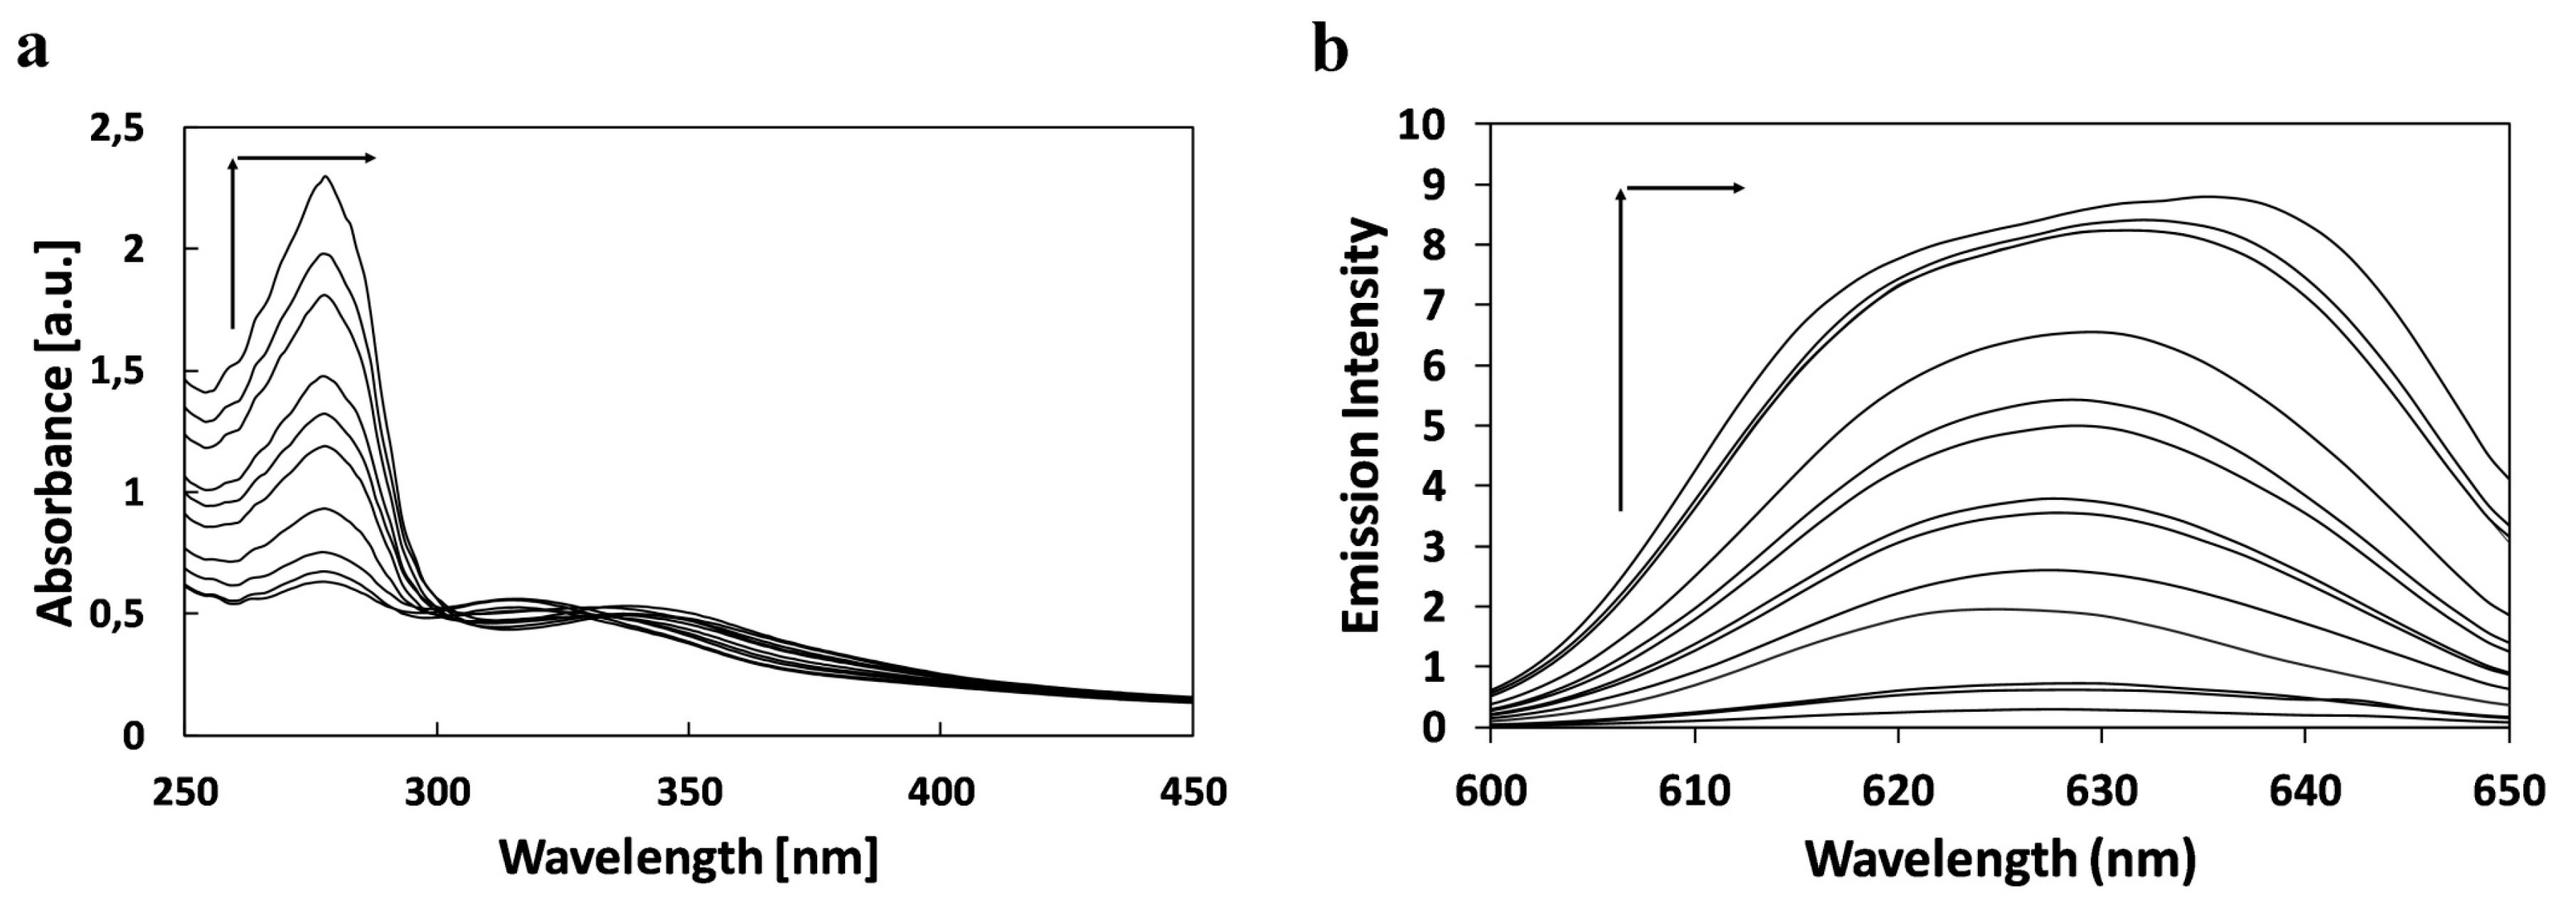
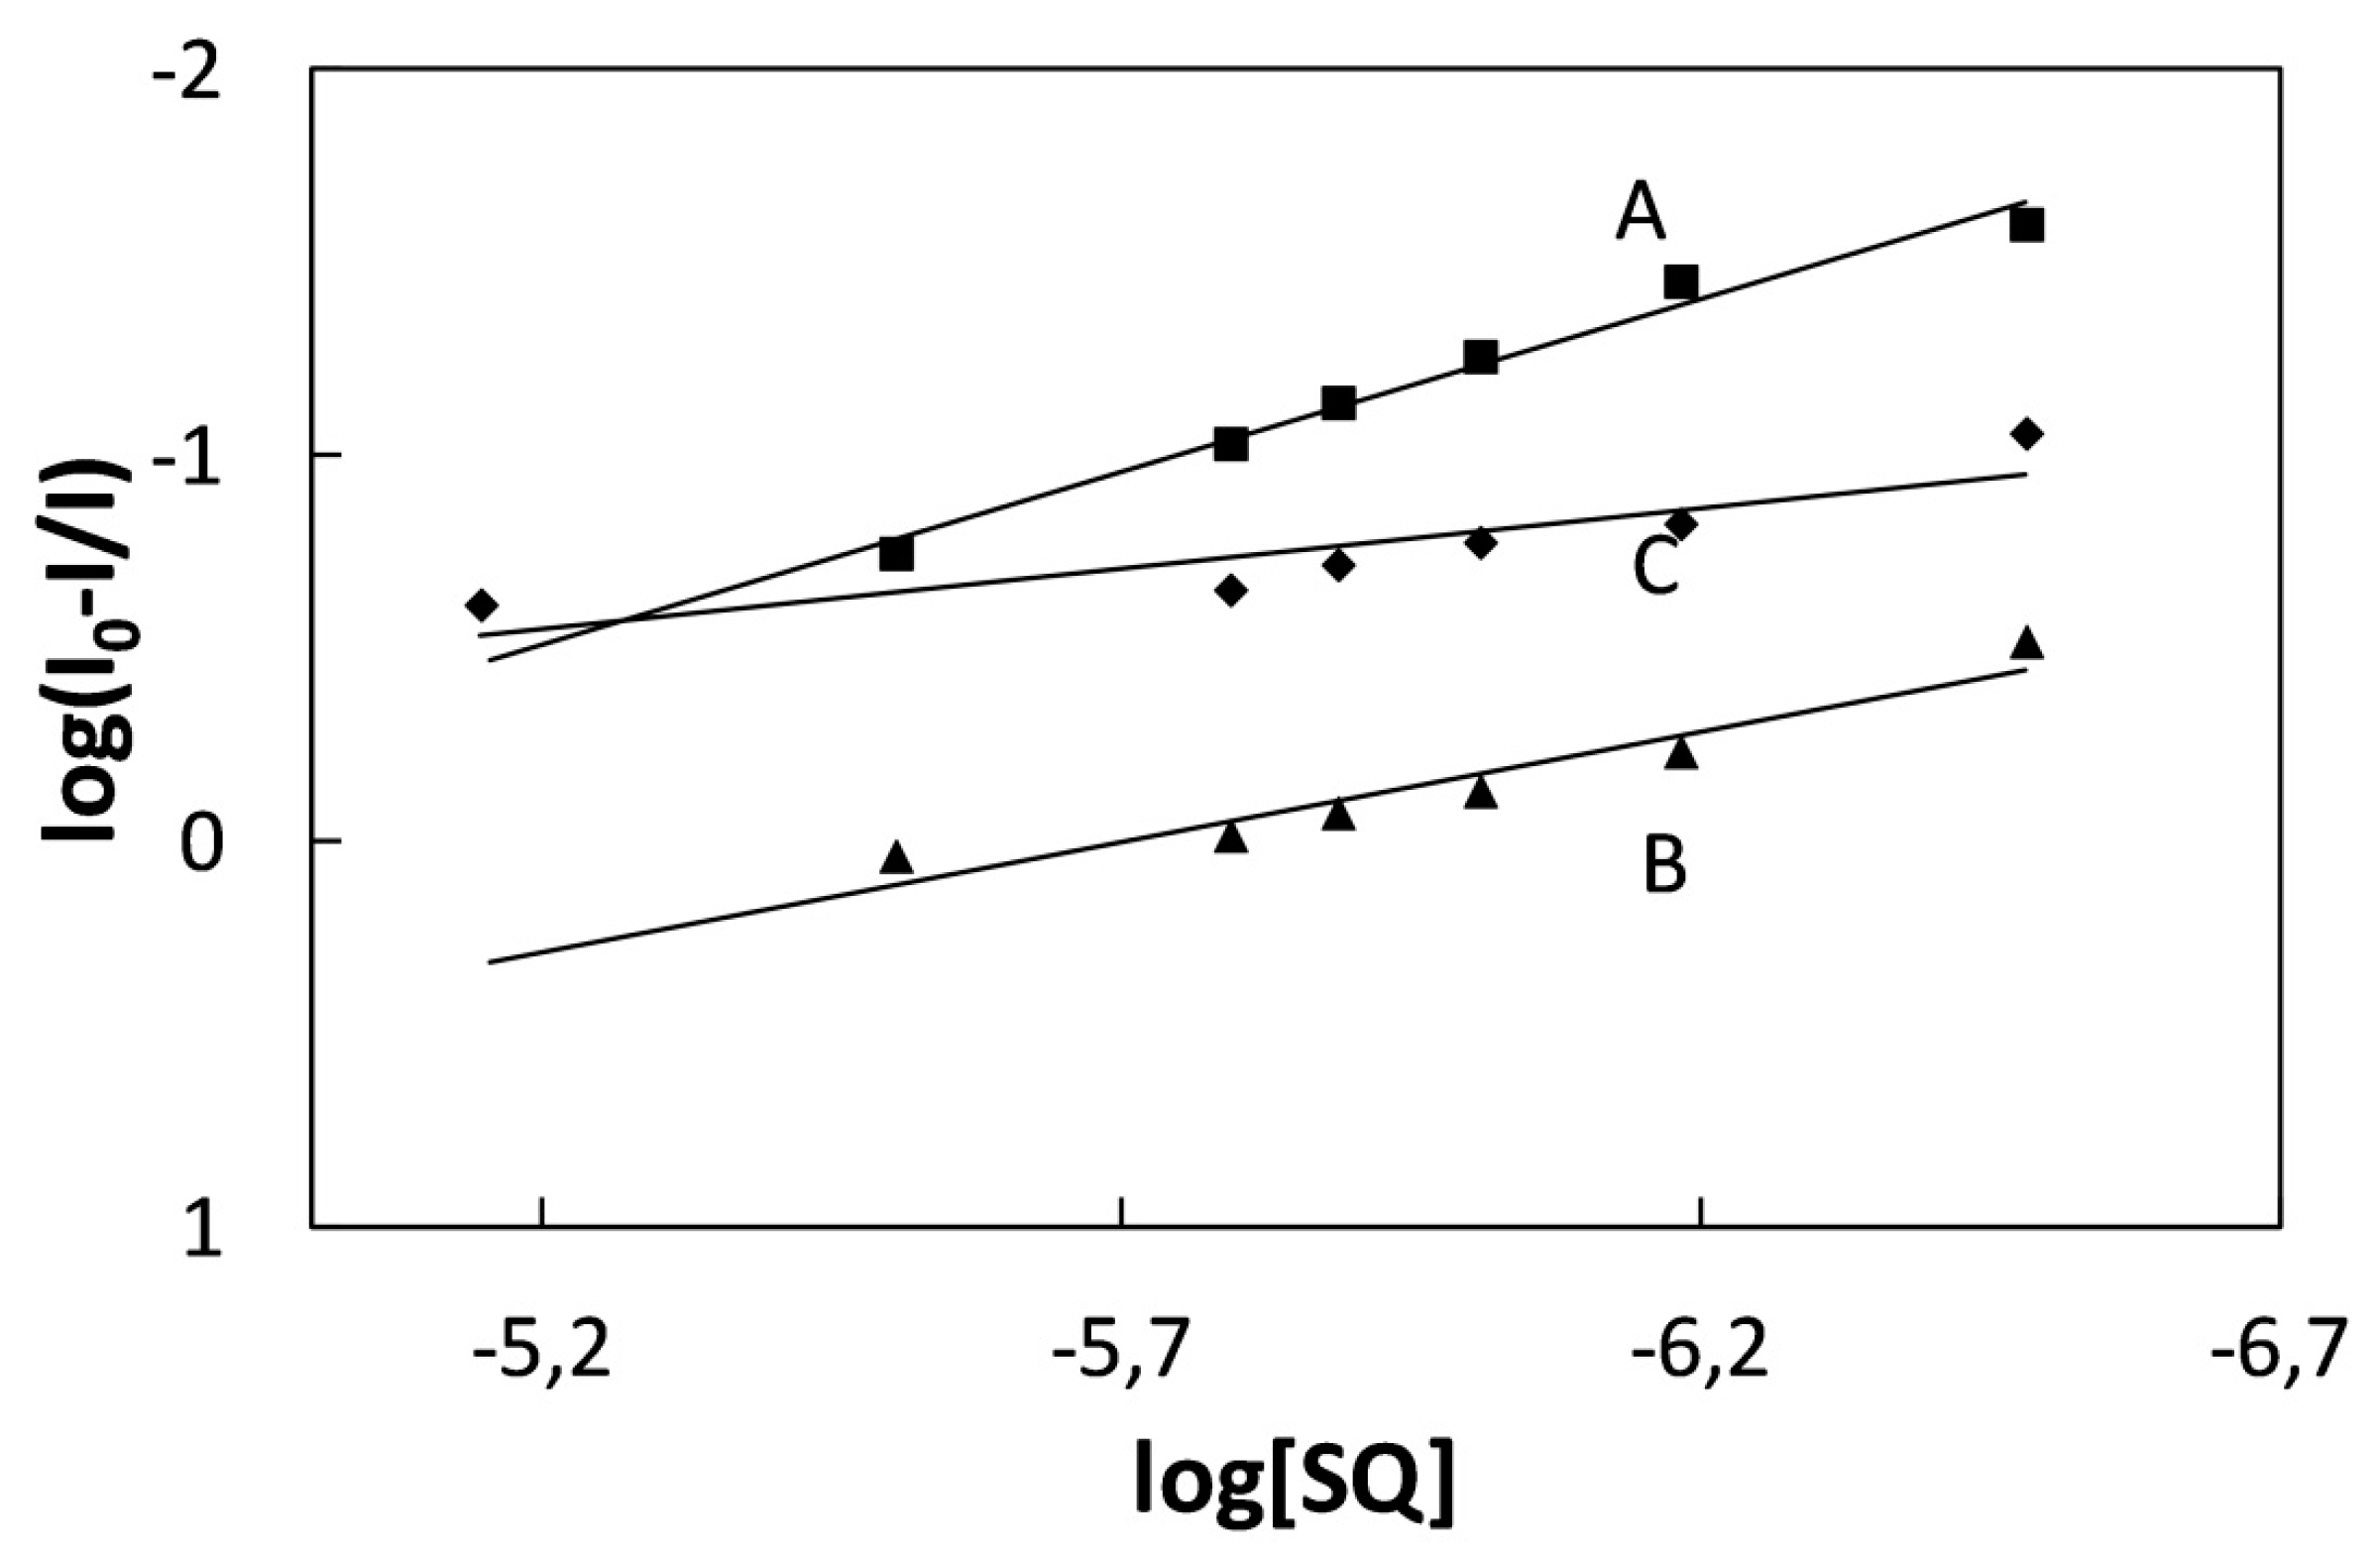
2.2. Study of Quenching Process of BSA by Squarine Dyes
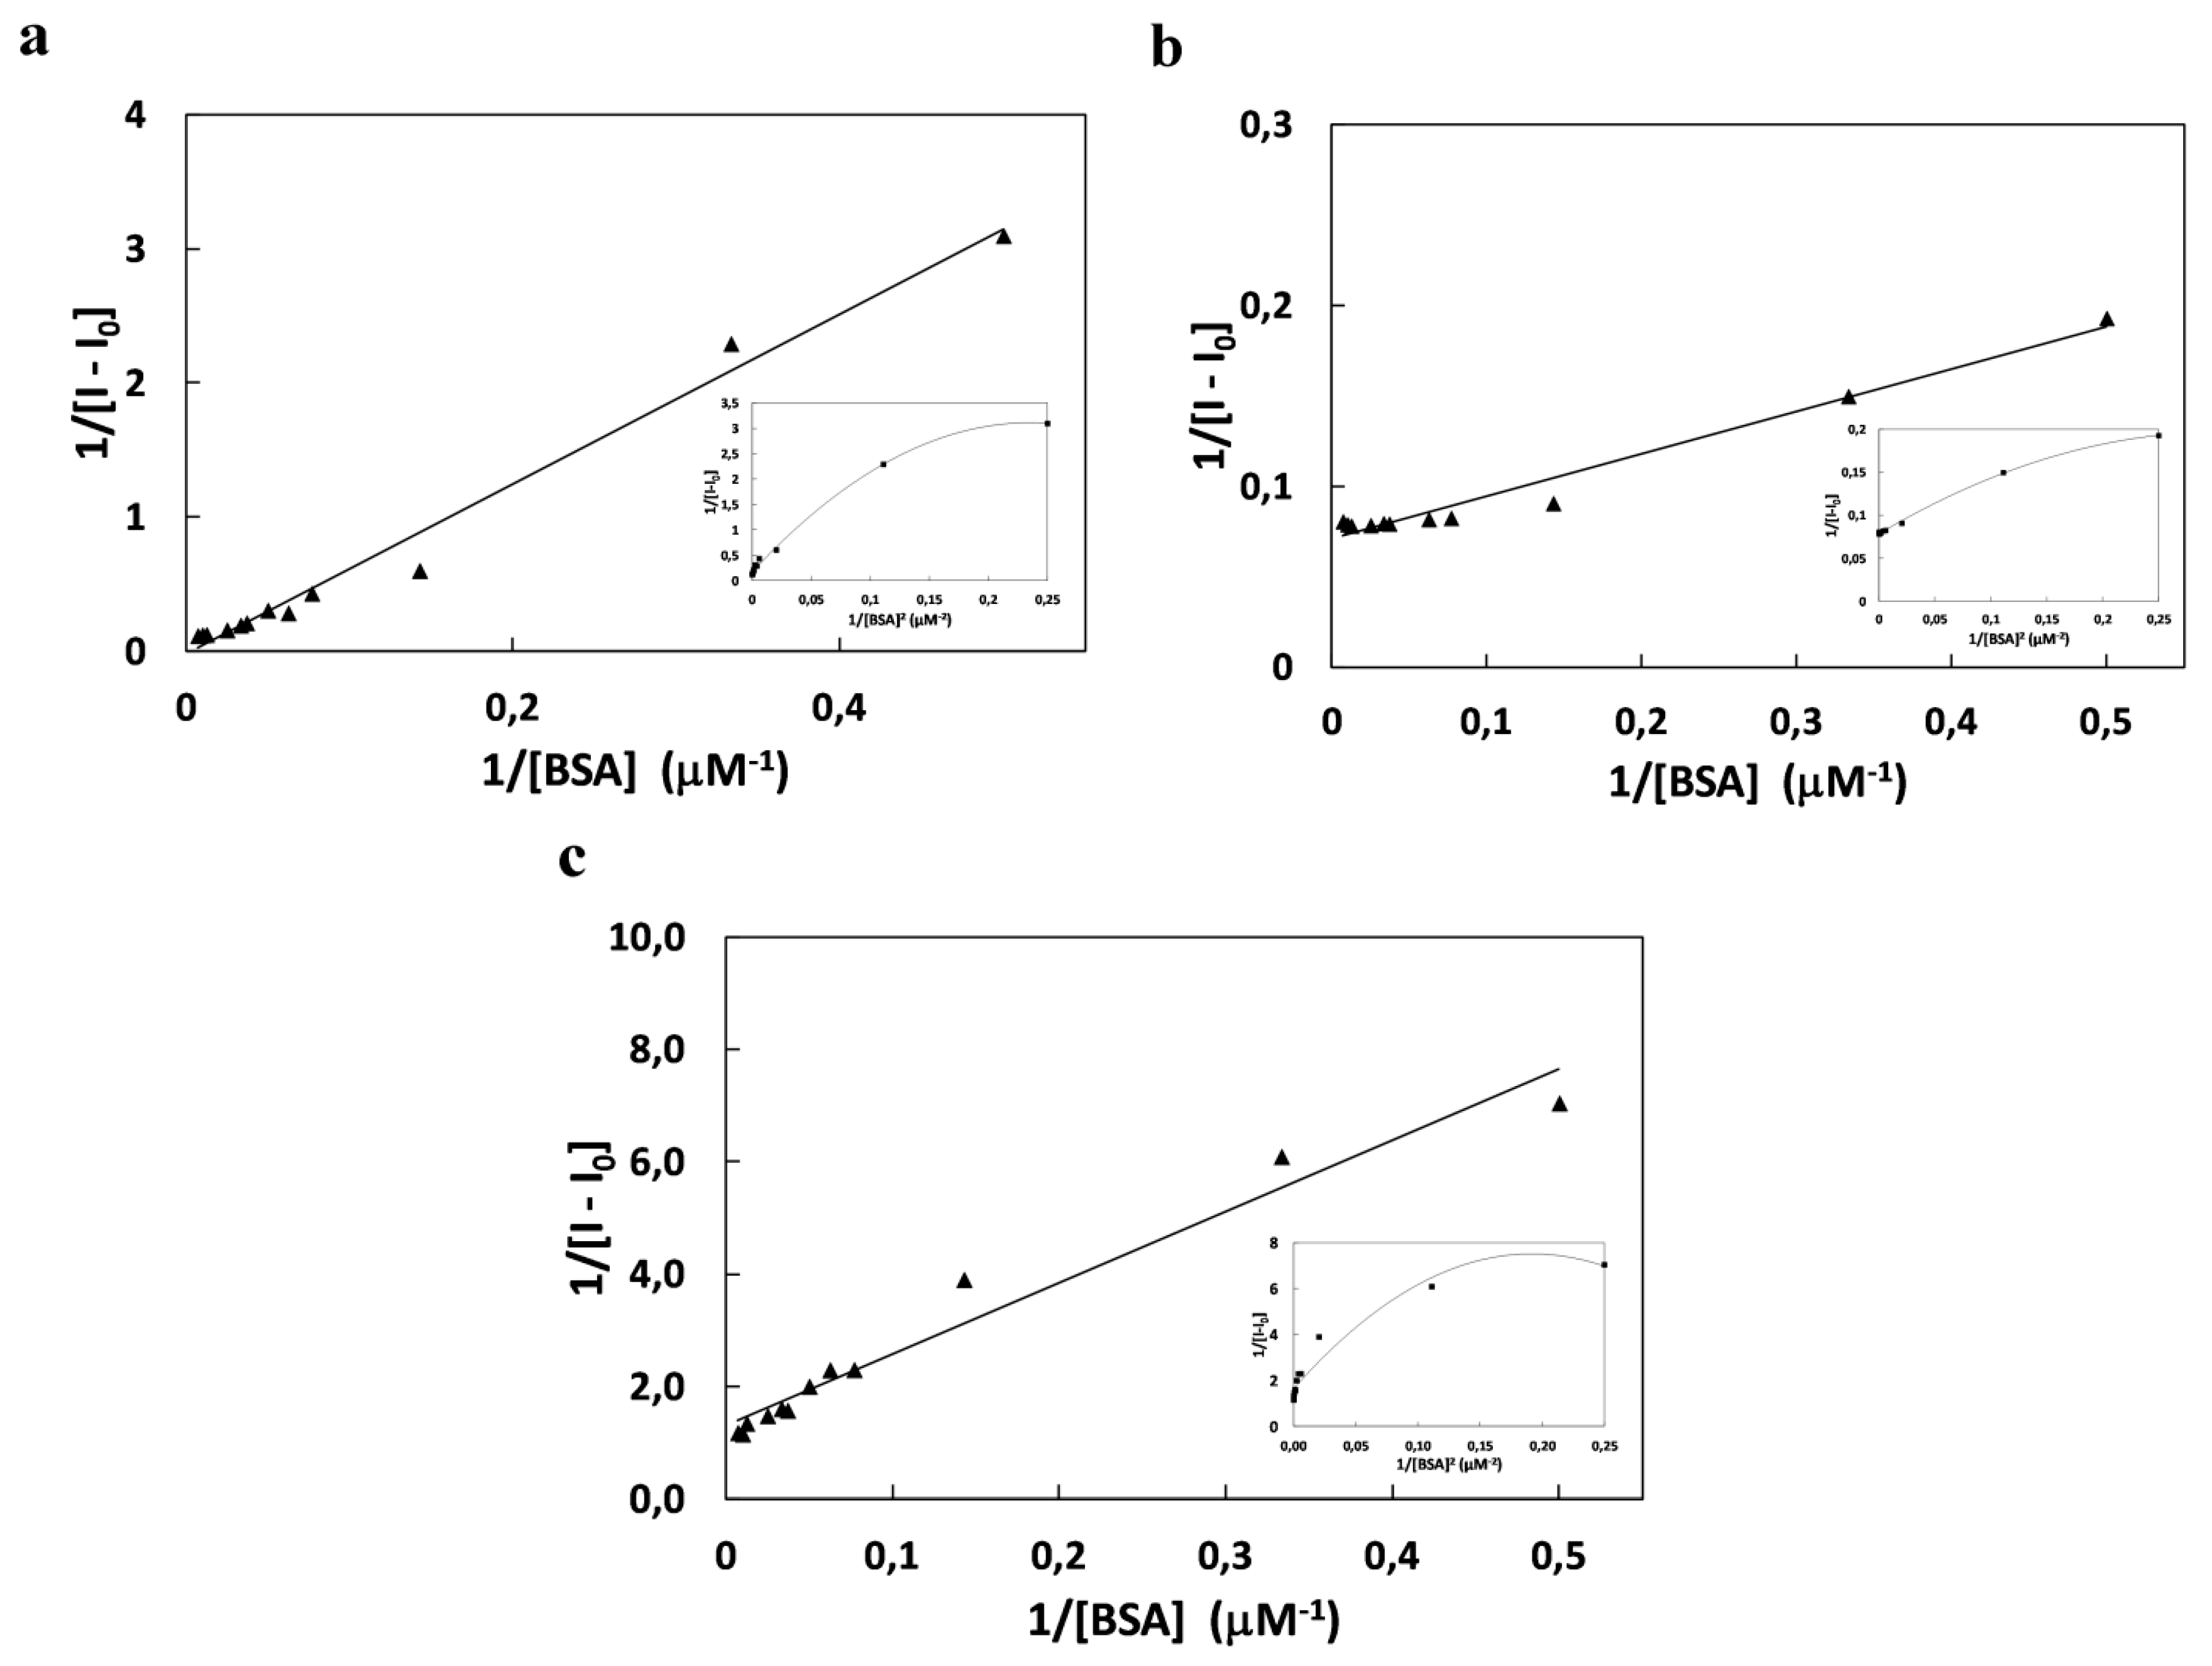
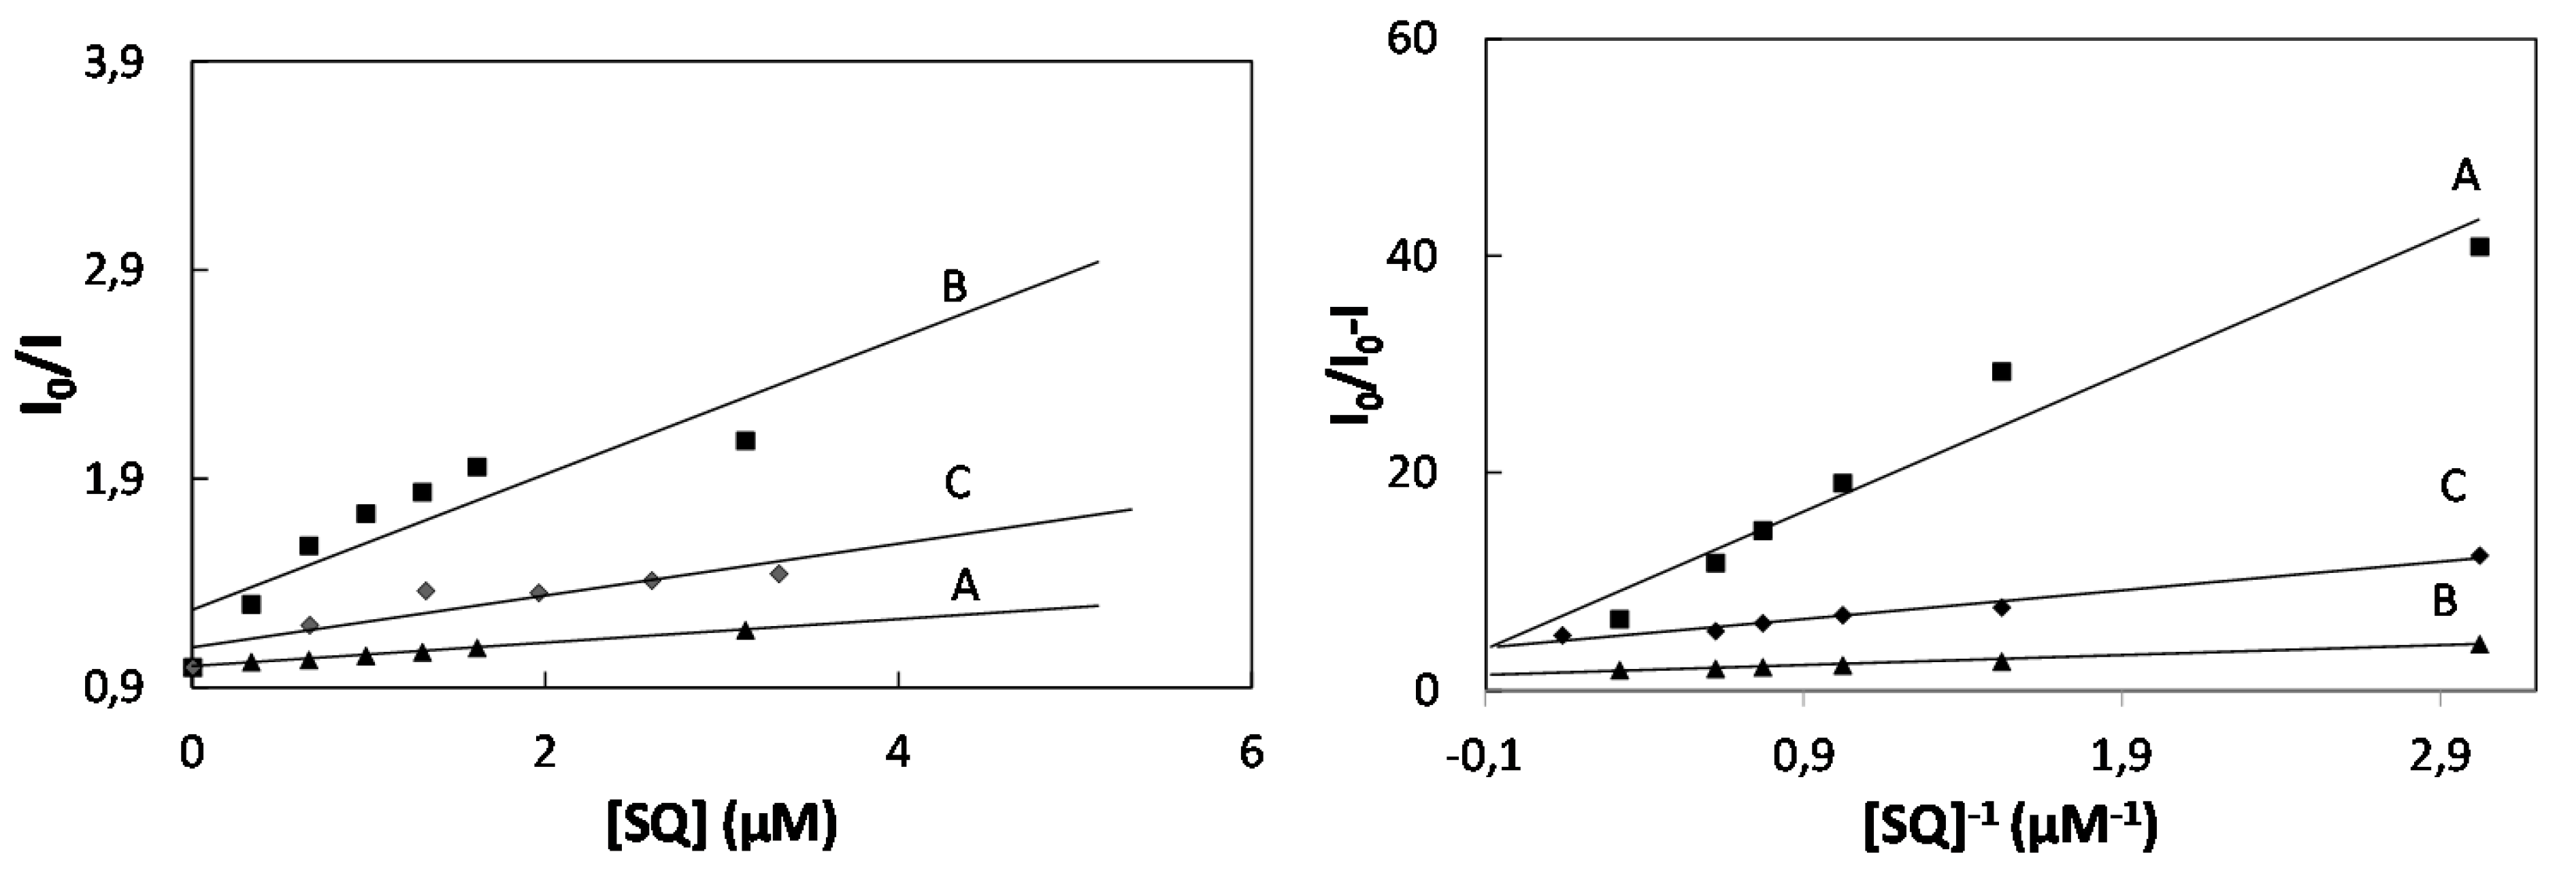
The intrinsic quenching effect of bovine serum albumin by squarine dyes was studied. The decrease of fluorescence intensity of BSA with increasing concentration of squarine dye was observed. The effective quenching constant for the accessible fluorophore, Ka and fraction of accessible fluorescence, fa were found using the Lehrer equation (Equation (3)) [25] presented below:
I 0 I 1 I = 1 f a K a [ S Q ] + 1 f a
where I0 and I are the intensities of BSA in the absence and presence of the quencher (squarine dye) at concentration [SQ].
The fluorescence data were analyzed also using the Stern-Volmer equation (Equation (4)):
I 0 I = 1 + K S V [ S Q ]
where: KSV is Stern-Volmer constant of SQ:BSA complex.
The Lehrer and Stern-Volmer plots are presented in Figure 3.
Figure 2. Benesi Hildebrandt plot of 1/I − I0 vs. 1/[BSA] for binding of SQ6 (a); SQ7 (b); SQ8 (c) with inserted correlation 1/I − I0 with 1/[BSA]2 for binding process of squarine dyes with BSA.
Molecules 20 13071 g002
As shown in Figure 3, the effect of increasing concentration of squarine dyes have linear dependence which provided to determination of quenching constant for the accessible fluorophore, Ka and Stern-Volmer constant of SQ:BSA complex, KSV (Table 2).
Figure 3. (Left) Stern-Volmer plot and (Right) Lehrer plot for the quenching of BSA by SQ6 (A), SQ7 (B) and SQ8 (C).
Molecules 20 13071 g003
The quenching constant and number of binding sites were calculated from Stern-Volmer equation (Equation (5)) presented below:
l o g I 0 I I = l o g K b + n l o g [ S Q ]
where I0 and I are the fluorescence intensities of BSA in absence and presence of SQ, Kb and n are quenching constant and number of binding sites, respectively. The quenching parameters of squarine dyes with bovine serum albumin are collected in Table 2.
Table 2. Binding parameters for interaction of squarine dyes with BSA.
K (×104 M−2)Ka (×104 M−1)KSV (×104 M−1)Kb (×104 M−1)nΔG (kJmol−1)
SQ62.5840.45.651.490.90−25.17
SQ730318,732.50.180.57−36.98
SQ810216012.80.040.56−34.29
As shown in Figure 4, the quenching constant increases with following series of dye: SQ8, SQ7, and SQ6. From the increasing concentration of squarine dye the number of binding sites of quenching process is lower than 1 for SQ7 and SQ8 which confirms that the 1:2 complexation process of bovine serum albumin with squarine dyes.
Figure 4. Modified Stern-Volmer plots of binding parameters BSA with squarine dyes: SQ6 (A), SQ7 (B), SQ8 (C).
Molecules 20 13071 g004

3. Experimental Section

3.1. Synthesis

The substrates used for synthesis of squarine dyes were purchased from Sigma-Aldrich (Poznań, Poland) and were used without further purification. The squarylium dyes: 3-hydroxy-2,4-bis[(3-methyl-1,3-benzoxazol-2(3H)-ylidene)methyl]cyclobut-2-en-1-one (SQ6), 3-hydroxy-2,4-bis[(3-methyl-1,3-benzothiazol-2(3H)-ylidene)methyl]cyclobut-2-en-1-one (SQ7) and 3-hydroxy-2,4-bis[(1,3,3-trimethyl-1,3-dihydro-2H-indol-2-ylidene)methyl]cyclobut-2-en-1-one (SQ8) were synthesized by the methodology described in work [4].

3.2. Materials

Distilled water, Tris-HCl buffer, bovine serum albumin (BSA) were purchased from Sigma-Aldrich (Poznań, Poland). Solvents were of the analytical grade.

3.3. Preparation of Stock Solutions of Dyes and Proteins

The 2 #x00B4;; 10−3 M dye stock solutions were prepared by dilution of the dye in DMSO. Stock solutions of proteins BSA 0.15 mM were prepared by dissolving in 0.05 M Tris-HCl buffer (pH 8.0).

3.4. Preparation of Working Solutions

The working solutions of free dyes were prepared by dilution of the dye stock solution in 0.05 M Tris-HCl buffer. Working solutions of the dyes in the presence of proteins were prepared by addition of the dye stock solution to the protein stock solution. The concentrations of dye and protein in working solutions amounted to 2 #x00B4;; 10−6 M and 1.4 #x00B4;; 10−4 M, respectively. All working solutions were prepared immediately before the experiments. The 1 #x00B4;; 10−4 and 5 #x00B4;; 10−5 M titration solutions of free dyes and BSA were prepared by dilution of the dye and protein stocks solution in 0.05 M Tris-HCl buffer.

3.5. Spectroscopic Measurements

The effect of an increasing concentration of BSA on absorption spectra of dyes were measured on a Cary 50 spectrophotometer (Varian, Warsaw, Poland). Working solution in presence of BSA was prepared by addition of dye stock solution to the protein solution. The concentration of dye in working solution was equal 1.5 #x00B4;; 10−4 M. The concentration of BSA were: 0, 2, 3, 7, 13, 16, 20, 27, 30, 40 µM, respectively.
The effect of an increasing concentration of BSA on fluorescence spectra of fluorophores was study on the same working solution in the addition of following concentration of BSA: 0, 2, 3, 7, 13, 16, 20, 27, 30, 40, 80, 100, 140 µM. Fluorescence spectra were taken on FLS 920 Spectrofluorimeter (Edinberg Instruments). Spectroscopic measurements were performed in standard quartz cell (1 × 1 cm).
The parameter of binding process of squarines with BSA were determinated by titration process of BSA solution (5 #x00B4;; 10−5 M) with increasing amounts of dye: 0.66, 1.32, 1.96, 2.60, 3.32, 6.25, 14.30 µM. The fluorescence spectra were recorded on FLS 920 Spectrofluorimeter (Edinberg Instruments, Livingstone, UK).

4. Conclusions

The series of squarine dyes was characterized in the presence of bovine serum albumin using fluorescence spectroscopy. The studied dyes presented a very high binding constant which confirms the very strong binding of fluorophore with bovine serum albumin. The negative free energy change indicated that an interaction of squarine dyes with BSA is a spontaneous complexation process. This indicates the potential of the studied squarine dyes as a spectral and fluorescence probe for BSA.

Acknowledgements

This work was supported by The National Science Centre (NCN Cracow, Poland) Grant No. 2013/11/B/ST5/01281.

Author Contributions

J.K. and K.J. designed research; J.K., K.J., K.K. and M.G. performed research and analyzed the data; K.J. and J.K. wrote the paper. All authors read and approved the final manuscript.

Conflicts of Interest

The authors declare no conflict of interest.

References

  1. Carrie, L.; Amiot, S.X.; Song, L.; Lingyun, P.; Julia, X.Z. Near-Infrared Fluorescent Materials for Sensing of Biological Targets. Sensors 2008, 8, 3082–3105. [Google Scholar]
  2. Demchenko, A.P. Introduction to Fluorescence Sensing; Springer: Amsterdam, The Netherland, 2009. [Google Scholar]
  3. Changxia, S.; Jinghe, Y.; Lei, L.; Xia, W.; Yang, L.; Shufang, L. Advances in the Study of Luminescence Probes for Proteins. J. Chromatogr. B 2004, 803, 173–190. [Google Scholar]
  4. Soo-Youl, P.; Kun, J.; Sea-Whe, O. The Novel Functional Chromophores Based on Squarylium Dyes. Korean Chem. Soc. 2005, 26, 428–432. [Google Scholar]
  5. Kiyose, K.; Aizawa, S.; Sasaki, E.; Kojima, H.; Hanaoka, K.; Terai, T.; Urano, Y.; Nagano, T. Molecular Design Strategies for Near-Infrared Ratiometric Fluorescent Probes Based on the Unique Spectral Properties of Aminocyanines. Chem. Eur. 2009, 15, 9191–9200. [Google Scholar] [CrossRef] [PubMed]
  6. Loudet, A.; Burgess, K. BODIPY Dyes and their Derivatives: Syntheses and Spectroscopic Properties. Chem. Rev. 2007, 107, 4891–4932. [Google Scholar] [CrossRef] [PubMed]
  7. Pham, W.; Cassell, L.; Gillman, A.; Koktysh, D.; Gore, J.C. A Near-Infrared Dye for Multichannel Imaging. Chem. Commun. 2008, 16, 1895–1897. [Google Scholar] [CrossRef] [PubMed]
  8. Lakowicz, J.R. Topics in Fluorescence Spectroscopy: Probe Design and Chemical Sensing; Plenum Press: New York, NY, USA, 1994; Volume 4. [Google Scholar]
  9. Drexhage, K.H. Structure and Properties of Laser Dyes in Dye Lasers; Springer: New York, NY, USA, 1990; pp. 155–200. [Google Scholar]
  10. Masotti, A.; Vicennati, P.; Boschi, F.; Calderan, L.; Sbarbati, A.; Ortaggi, G. A Novel near Infrared Indocyanine Dye–Polyethylenimine Conjugate Allows DNA delivery imaging in vivo. Bioconjugate Chem. 2008, 19, 983–987. [Google Scholar] [CrossRef] [PubMed]
  11. Kasten, F.H. Introduction to Fluorescent Probes: Properties, History and Applications. In Fluorescent and Luminescent Probes for Biological Activity; Mason, W.T., Ed.; Academic Press: Cambridge, UK, 1993; pp. 12–33. [Google Scholar]
  12. Frangioni, J.V. In vivo Near-Infrared Fluorescence Imaging. Curr. Opin. Chem. Biol. 2003, 7, 626–634. [Google Scholar] [CrossRef] [PubMed]
  13. Cheng, Z.; Wu, Z.; Xiong, Z.; Gambhir, S.S.; Chen, X. Near-Infrared Fluorescent RGD Peptides for Optical Imaging of Integrin avb3 Expression in Living Mice. Bioconjug. Chem. 2005, 16, 1433–1441. [Google Scholar] [CrossRef] [PubMed]
  14. Coskun, A.; Yilmaz, M.D.; Akkaya, E.U. Bis(2-pyridyl)-Substituted Boratriazaindacene as an NIR-Emitting Chemosensor for Hg(II). Org. Lett. 2007, 9, 607–609. [Google Scholar] [CrossRef] [PubMed]
  15. Ayyappanpillai, A. Chemistry of squarine-derived materials: near-IR dyes, Low Band Gap Systems, and Cation Sensors. Acc. Chem. Res. 2005, 38, 449–459. [Google Scholar]
  16. Xu, L.; Xu, Y.; Zhu, W.; Zeng, B.; Chunmei Yang, Ch.; Wu, B.; Qian, X. Versatile Trifunctional Chemosensor of Rhodamine Derivative for Zn2+, Cu2+ and His/Cys in Aqueous Solution and Living Cells. Org. Biomol. Chem. 2011, 9, 8284–8287. [Google Scholar] [CrossRef] [PubMed]
  17. Xu, L.; Xu, Y.; Zhu, W.; Sun, X.; Xu, Z.; Qian, X. Modulating the Selectivity by Switching Sensing Media: A Bifunctional Chemosensor Selectivity for Cd2+ and Pb2+ in Different Aqueous Solutions. RSC Adv. 2012, 2, 6323–6328. [Google Scholar] [CrossRef]
  18. Xu, L.; Xu, Y.; Zhu, W.; Yang, C.; Han, L.; Qian, X. A Highly Selective and Sensitive Fluorescence “Turn-on” Probe for Ag+ in Aqueous Solution and Live Cells. Dalton Trans. 2012, 41, 7212–7217. [Google Scholar] [CrossRef] [PubMed]
  19. Huang, C.B.; Li, H.R.; Luo, Y.; Xu, L. A Naphthalimide-Based Bifunctional Fluorescent Probe for the Differential Detection of Hg2+ and Cu2+ in Aqueous Solution. Dalton Trans. 2014, 43, 8102–8108. [Google Scholar] [CrossRef] [PubMed]
  20. Un, H.I.; Huang, C.B.; Huang, C.; Jia, T.; Zhao, X.L.; Wang, C.H.; Xu, L.; Yang, H.-B. A Versatile Fluorescent Dye Based on Naphthalimide: Highly Selective Detection of Hg2+ in Aqueous Solution and Living Cells and its Aggregation-Induced Emission Behavior. Org. Chem. Front. 2014, 1, 1083–1090. [Google Scholar] [CrossRef]
  21. Un, H.I.; Huang, C.B.; Huang, J.; Huang, C.; Jia, T.; Xu, L. A Naphthalimide-Based Fluorescence “Turn-On” Probe for the Detection of Pb2+ in Aqueous Solution and Living Cells. Chem. Asian J. 2014, 9, 3397–3402. [Google Scholar] [CrossRef] [PubMed]
  22. Joseph, T.; Douglas, B.S.; Terry, J.A.; Sandra, A.A.; Bruce, P.J. Synthesis and Biosensor Performance of a Near-IR thiol-Reactive Fluorophore based on Benzothiazolium Squaraine. Bioconjugate Chem. 2007, 18, 1841–1846. [Google Scholar]
  23. Singh, R.B.; Mahanta, S.; Bagchi, A.; Guchhait, N. Interaction of Human Serum Albumin with Charge Transfer Probe Ethyl Ester of N,N-dimethylamino Naphtyl Acrylic Acid: an Extrinsic Fluorescence Probe for Studying Protein Environment. Photochem. Photobiol. Sci. 2009, 8, 101–110. [Google Scholar] [CrossRef] [PubMed]
  24. Ghosh, S.; Guchhait, N. Chemically Induced Unfolding of Bovine Serum Albumin by Urea and Sodium Dodecyl Sufate: A Spectral Study with Polarity-Sensitive Charge-Transfer Fluorescent Probe (E)-3-(4-methylaminophenyl)acrylic acid methyl ester. Chem. Phys. Chem. 2009, 10, 16641–16671. [Google Scholar]
  25. Lehrer, S.S. Solute Perturbation of Protein Fluorescence. The Quenching of the Tryptophyl Fluorescence of Model Compounds and of Lysozyme by Iodide Ion. Biochemistry 1971, 10, 32543–32263. [Google Scholar]
  • Sample Availability: Samples of the compounds are available from the authors.

