
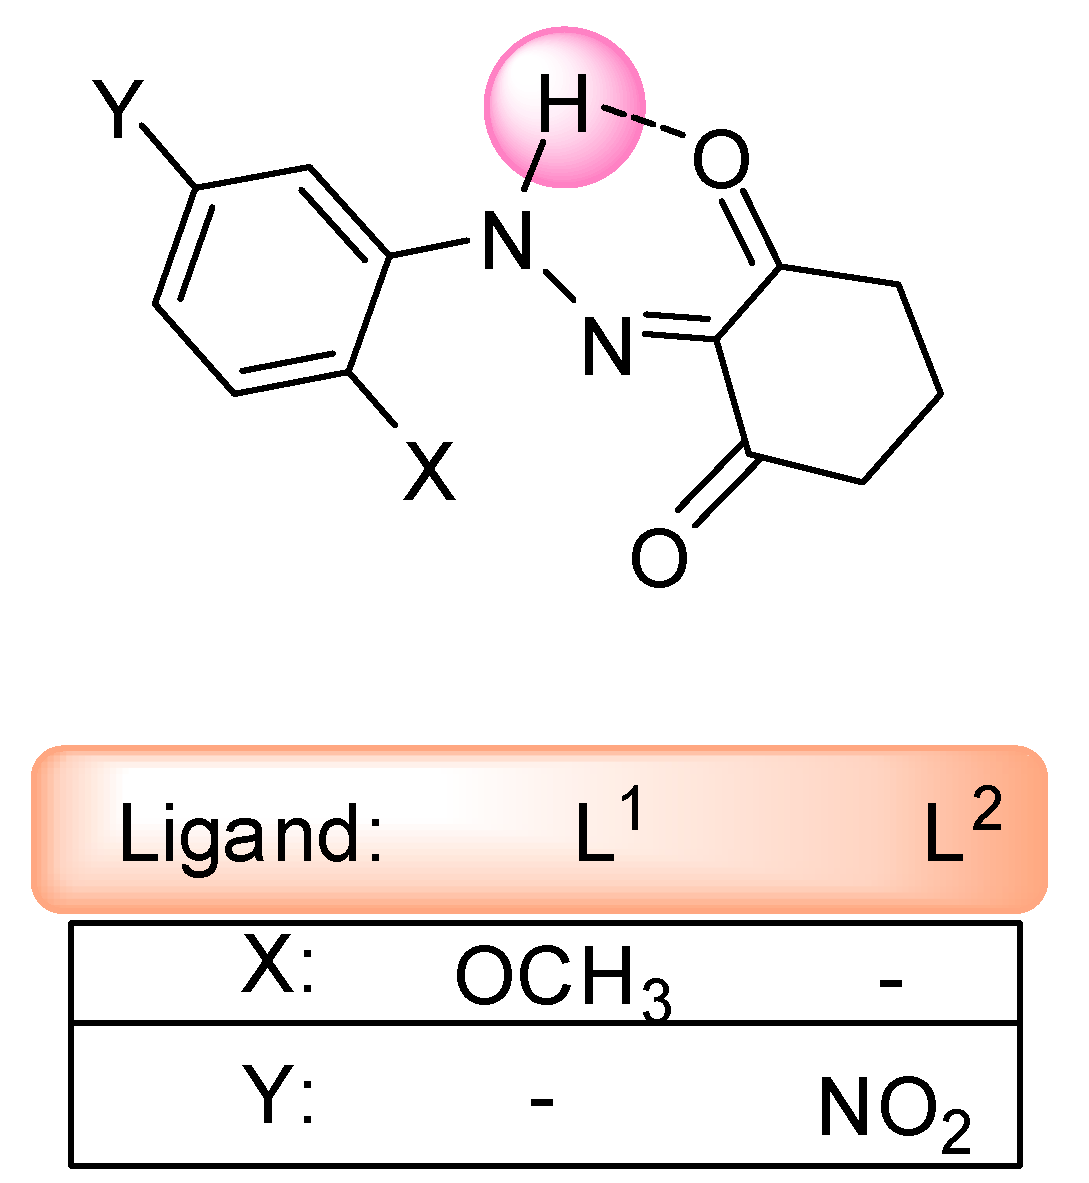
Synthesis, Structural Characterization and Biological Activity of Novel Cyclohexane-1,3-dione Ligands and Their Metal Complexes

Abstract
:1. Introduction
2. Results and Discussion
2.1. Infrared Spectra
2.2. 1H-NMR and 13C-NMR Spectra
2.3. Electronic Spectra and Magnetic Properties
2.4. Thermal Studies

| Equations | Temperature (°C) | % Loss in Weight % Found(% Calculated) | Decomp. Products |
|---|---|---|---|
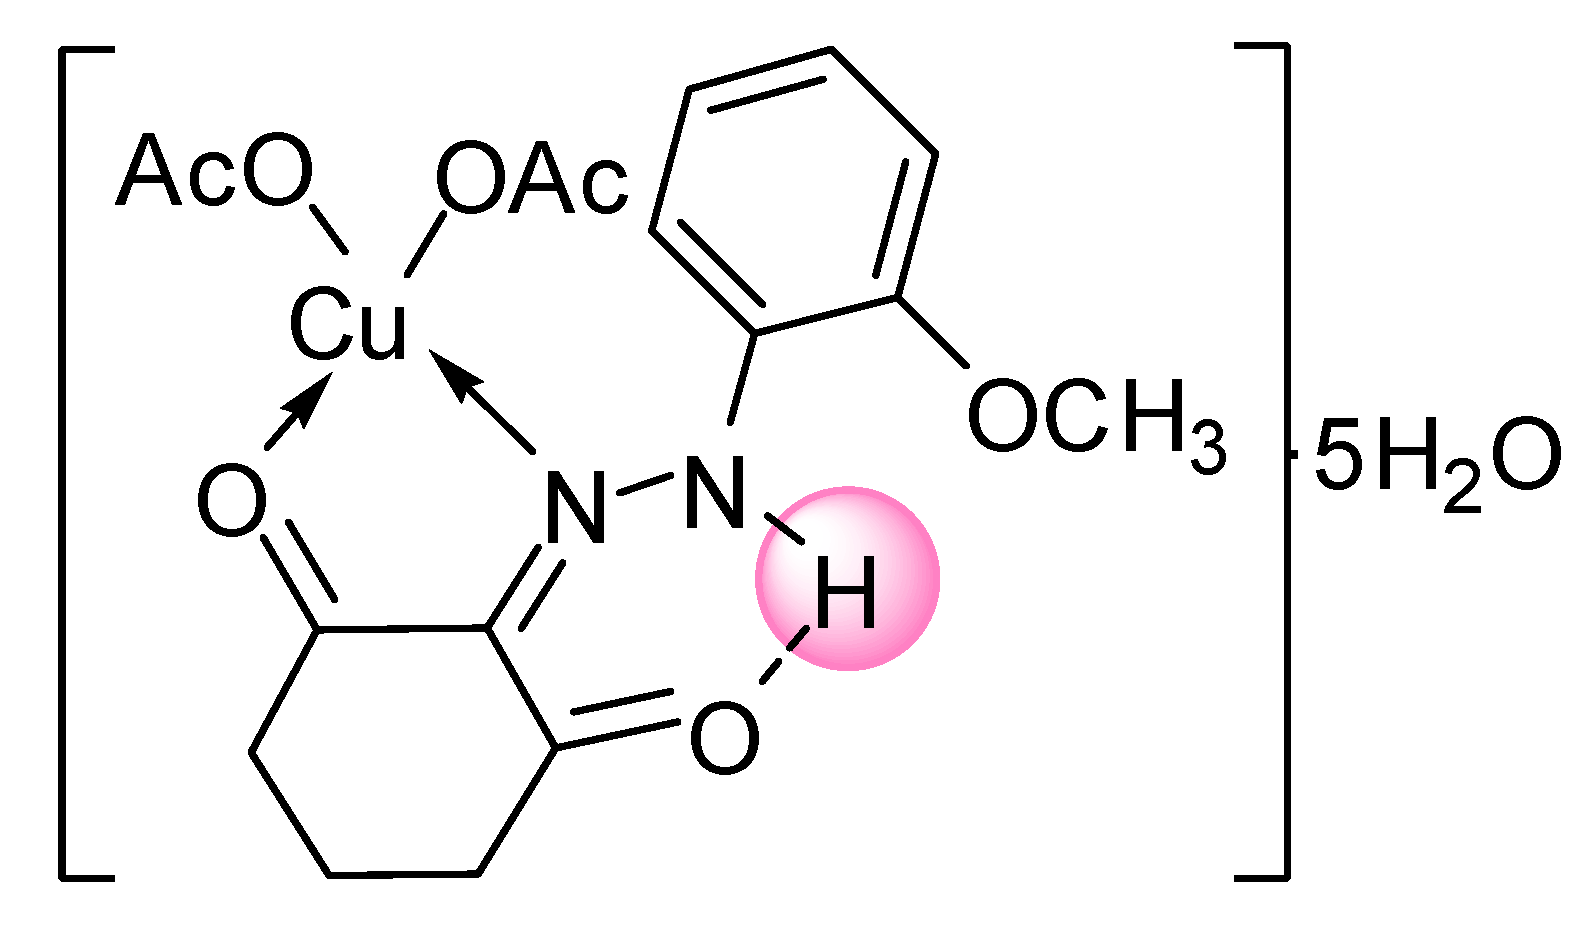
| [Cu(L1)(OAc)2]∙5H2O | |||
| C17H30N2O12Cu | 95.50–250.00 | 16.92(17.39) | 5 H2O |
| C17H20N2O7Cu | 250.00–514.29 | 40.00(40.36) | 2 OAc−, C6H5N |
| C7H9NO3Cu | 514.29–650.00 | 24.62(23.96) | C6H6NO2 |
| CH3OCu | 650–Cont. | ||
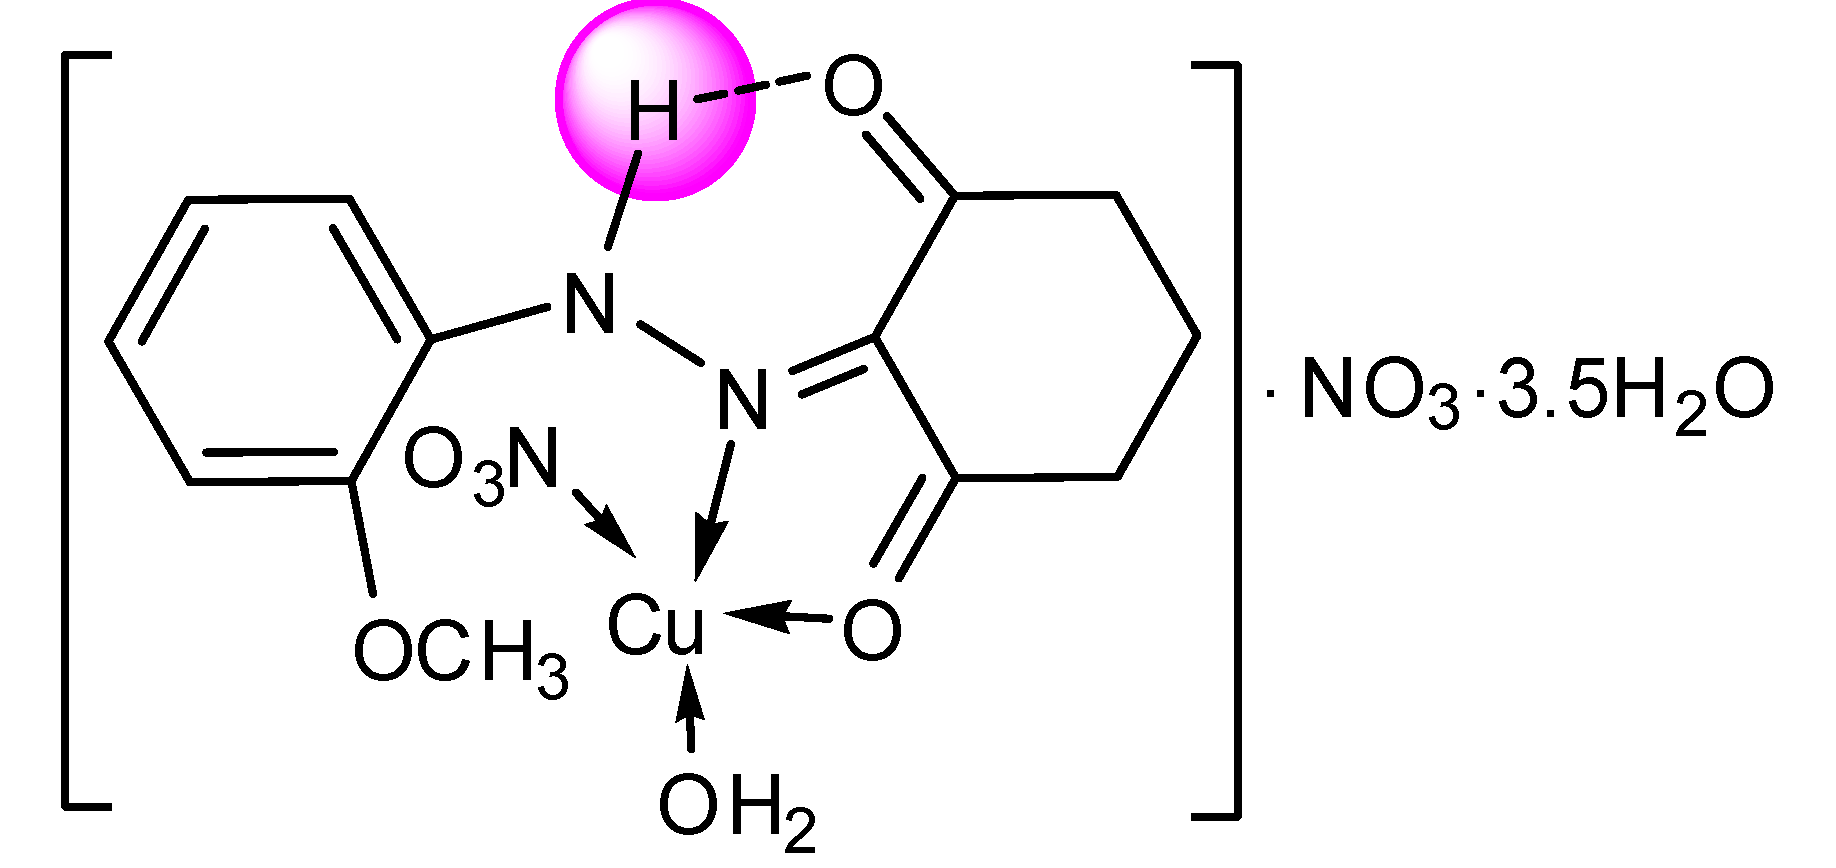
| [Cu(L1)(NO3)H2O]∙NO3∙3.5H2O | |||
| C13H16N4O10Cu∙3.5H2O | 85.25–234.48 | 24.62(24.29) | 3.5 H2O, NO3− |
| C13H16N3O7Cu | 234.48–494.55 | 40.00(39.64) | H2O and NO3−,C6H6O2N |
| C7H8NOCu | 494.55–Cont. | ||
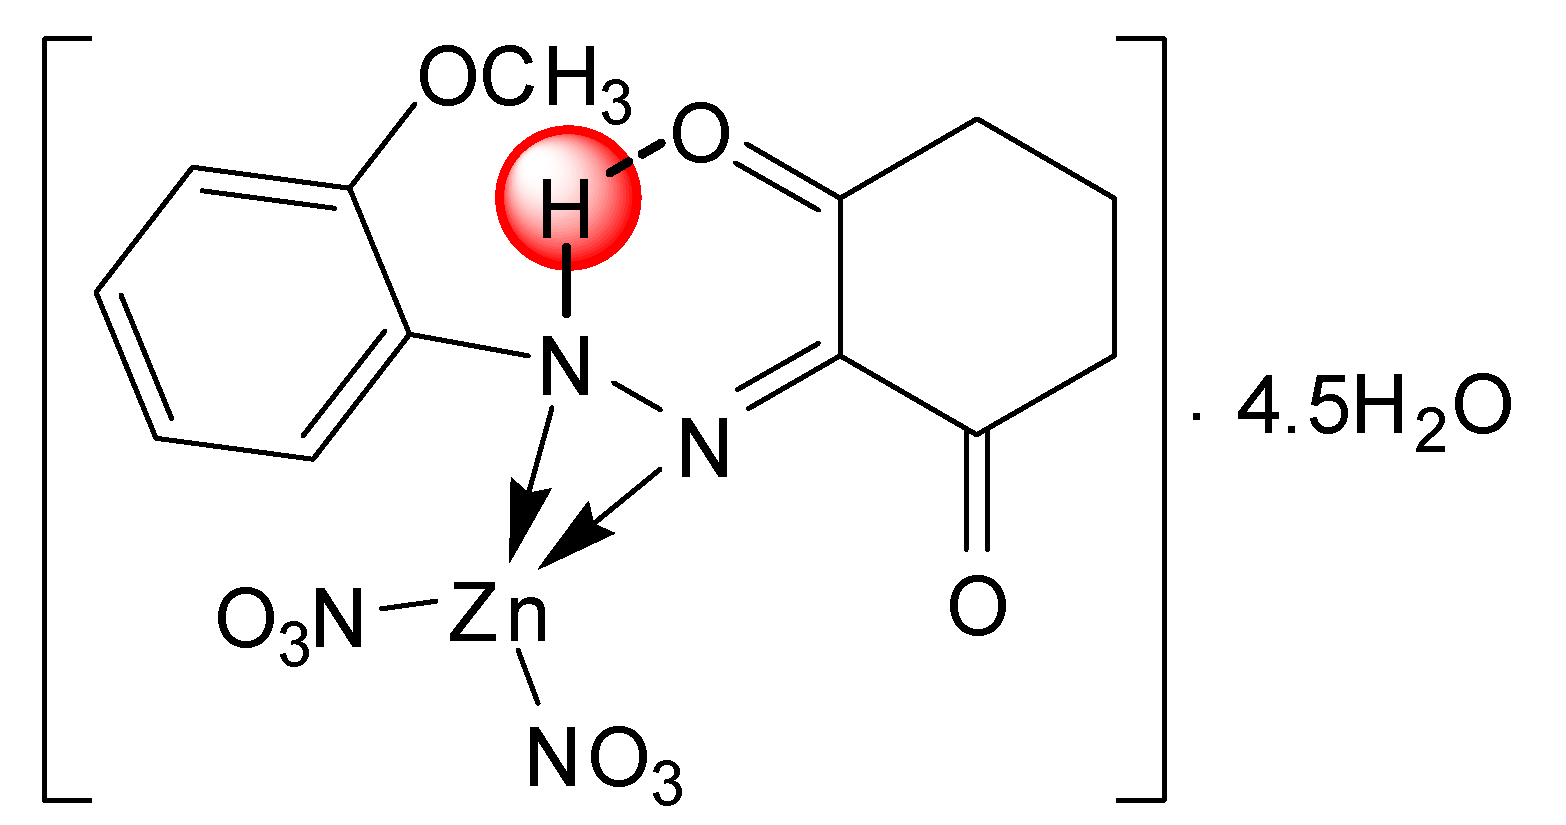
| [Zn(L1)(NO3)2]∙4.5H2O | |||
| C13H14N4O9Zn∙4.5H2O | 76.19–457.14 | 15.39(15.69) | 4.5 H2O |
| C13H14N4O9Zn | 457.14–495.23 | 67.69(68.55) | 2NO3−, C13H14O2N2 |
| ZnO | 495.23–Cont. | ||
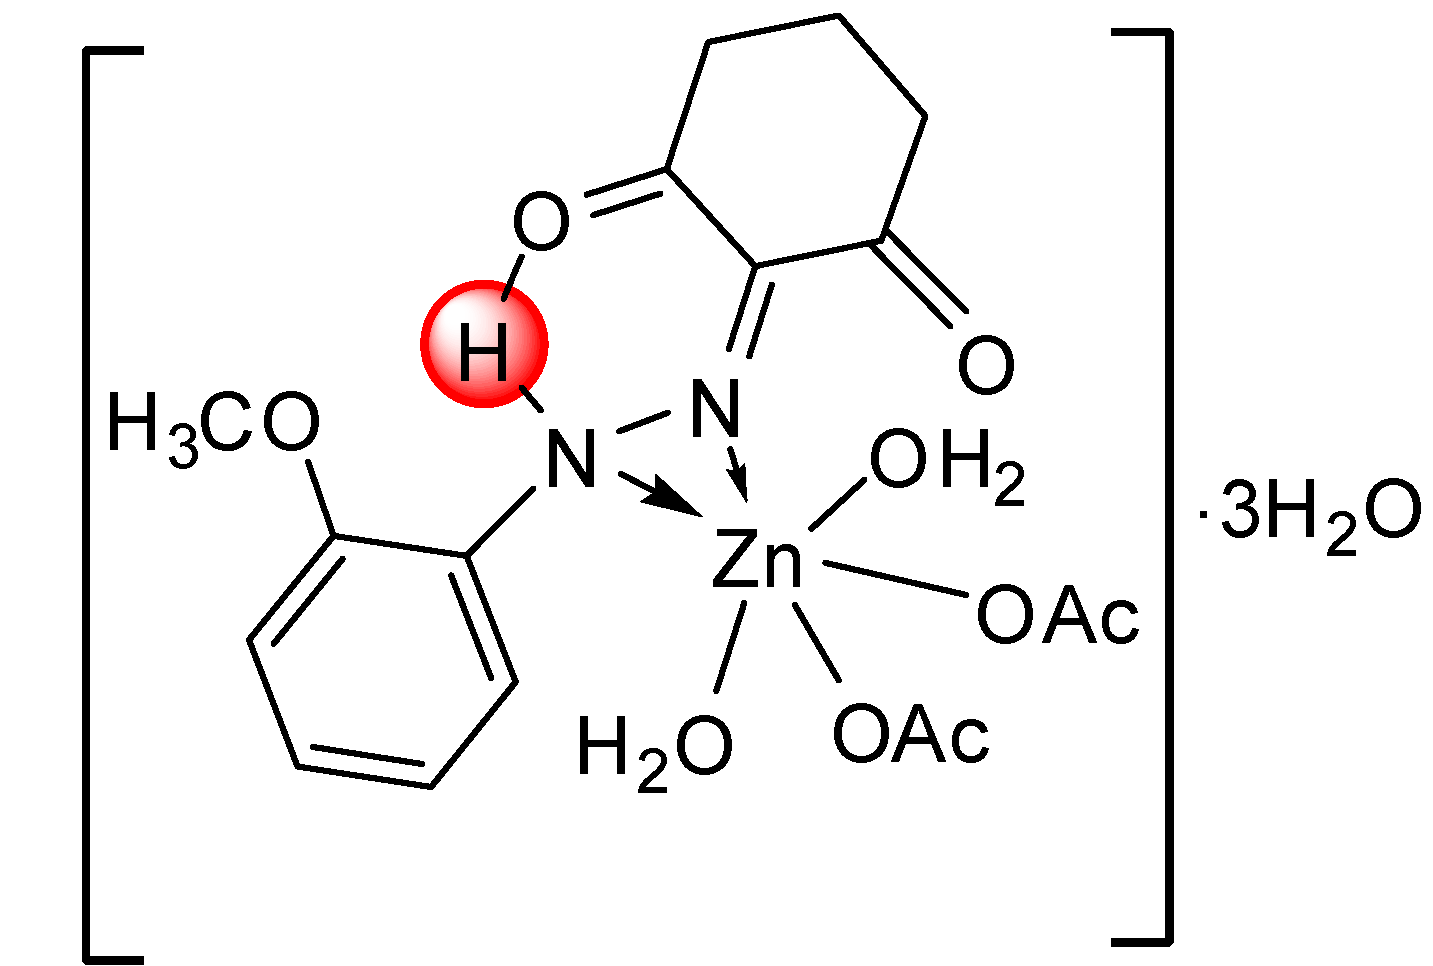
| [Zn(L1)(OAc)2(H2O)2]∙3H2O | |||
| C17H30N2O12Zn | 80.32–284.75 | 18.76(18.83) | 3 H2O |
| C17H24N2O9Zn | 284.75–423.50 | 29.23(29.65) | 2 H2O and 2 C2H3O2− |
| C13H14N2O3Zn | 423.50–Cont. | ||
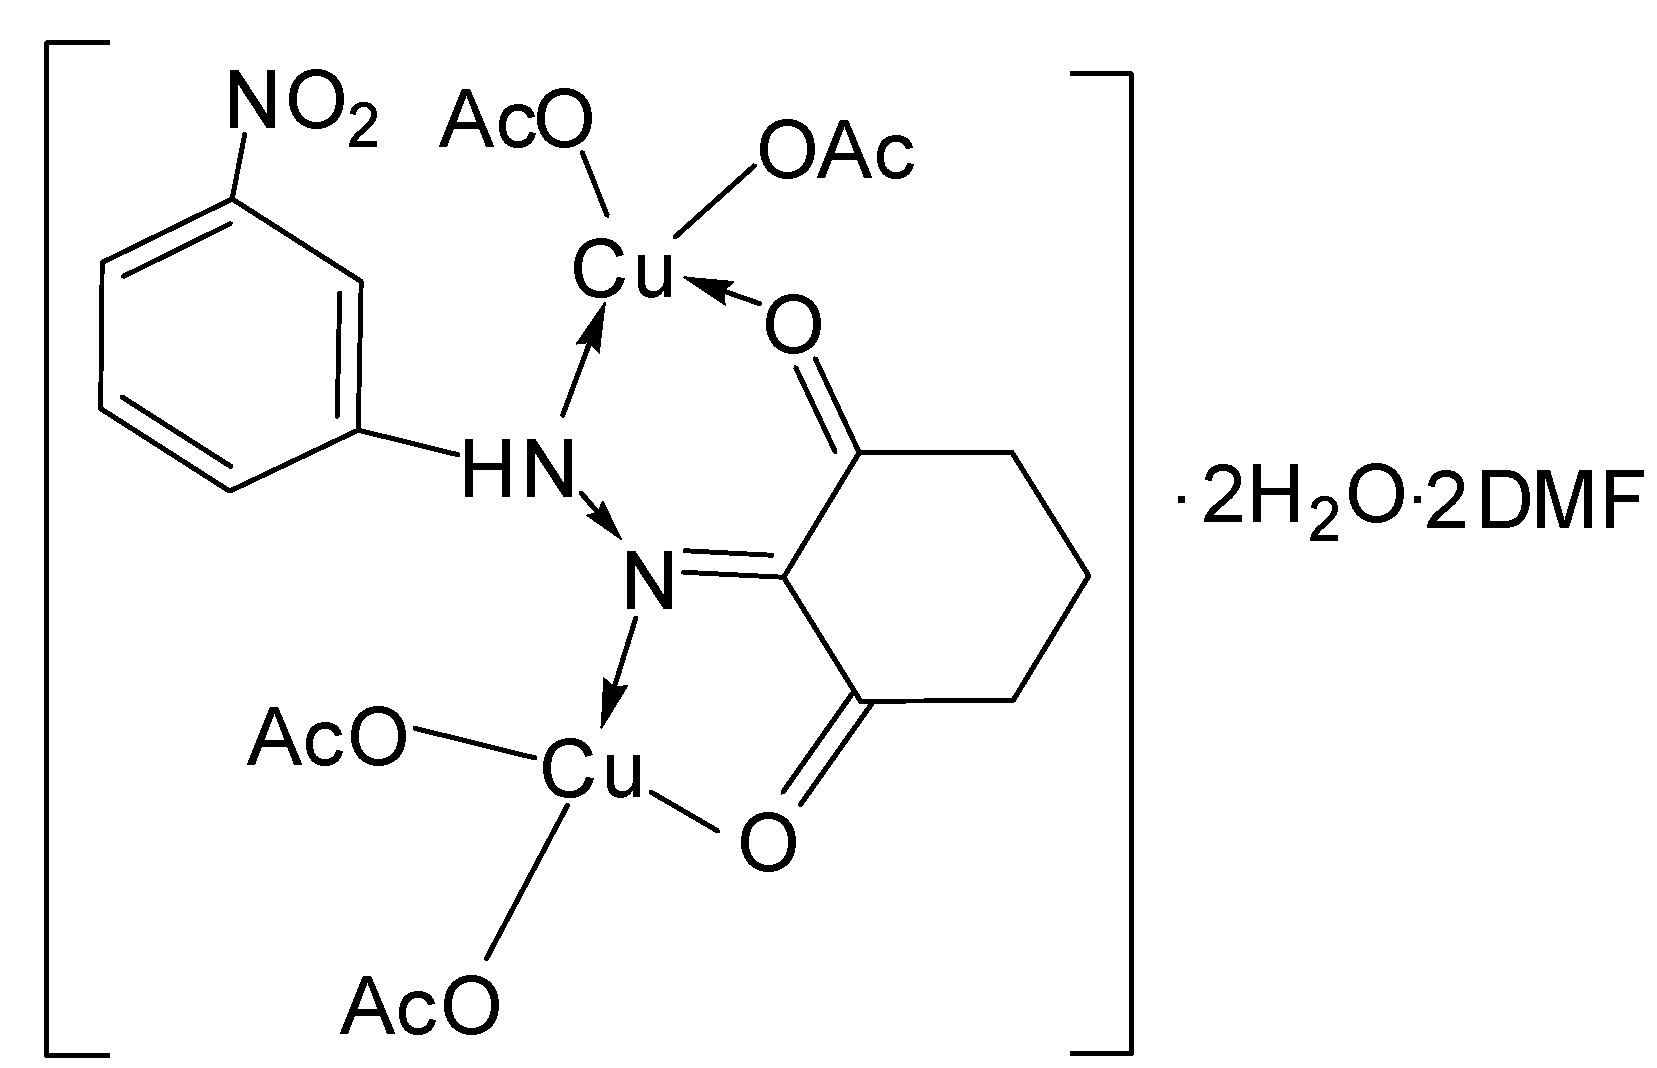
| [Cu2(L2)(OAc)4]∙2H2O∙2DMF | |||
| C26H41N5O16Cu2 | 180.12–240.32 | 23.08(22.58) | 2 H2O and 2DMF |
| C20H23N3O12Cu2 | 240.32–285–340 | 29.23(29.27) | 4 OAc− |
| C12H11N3O4Cu2 | 285–340 | ||
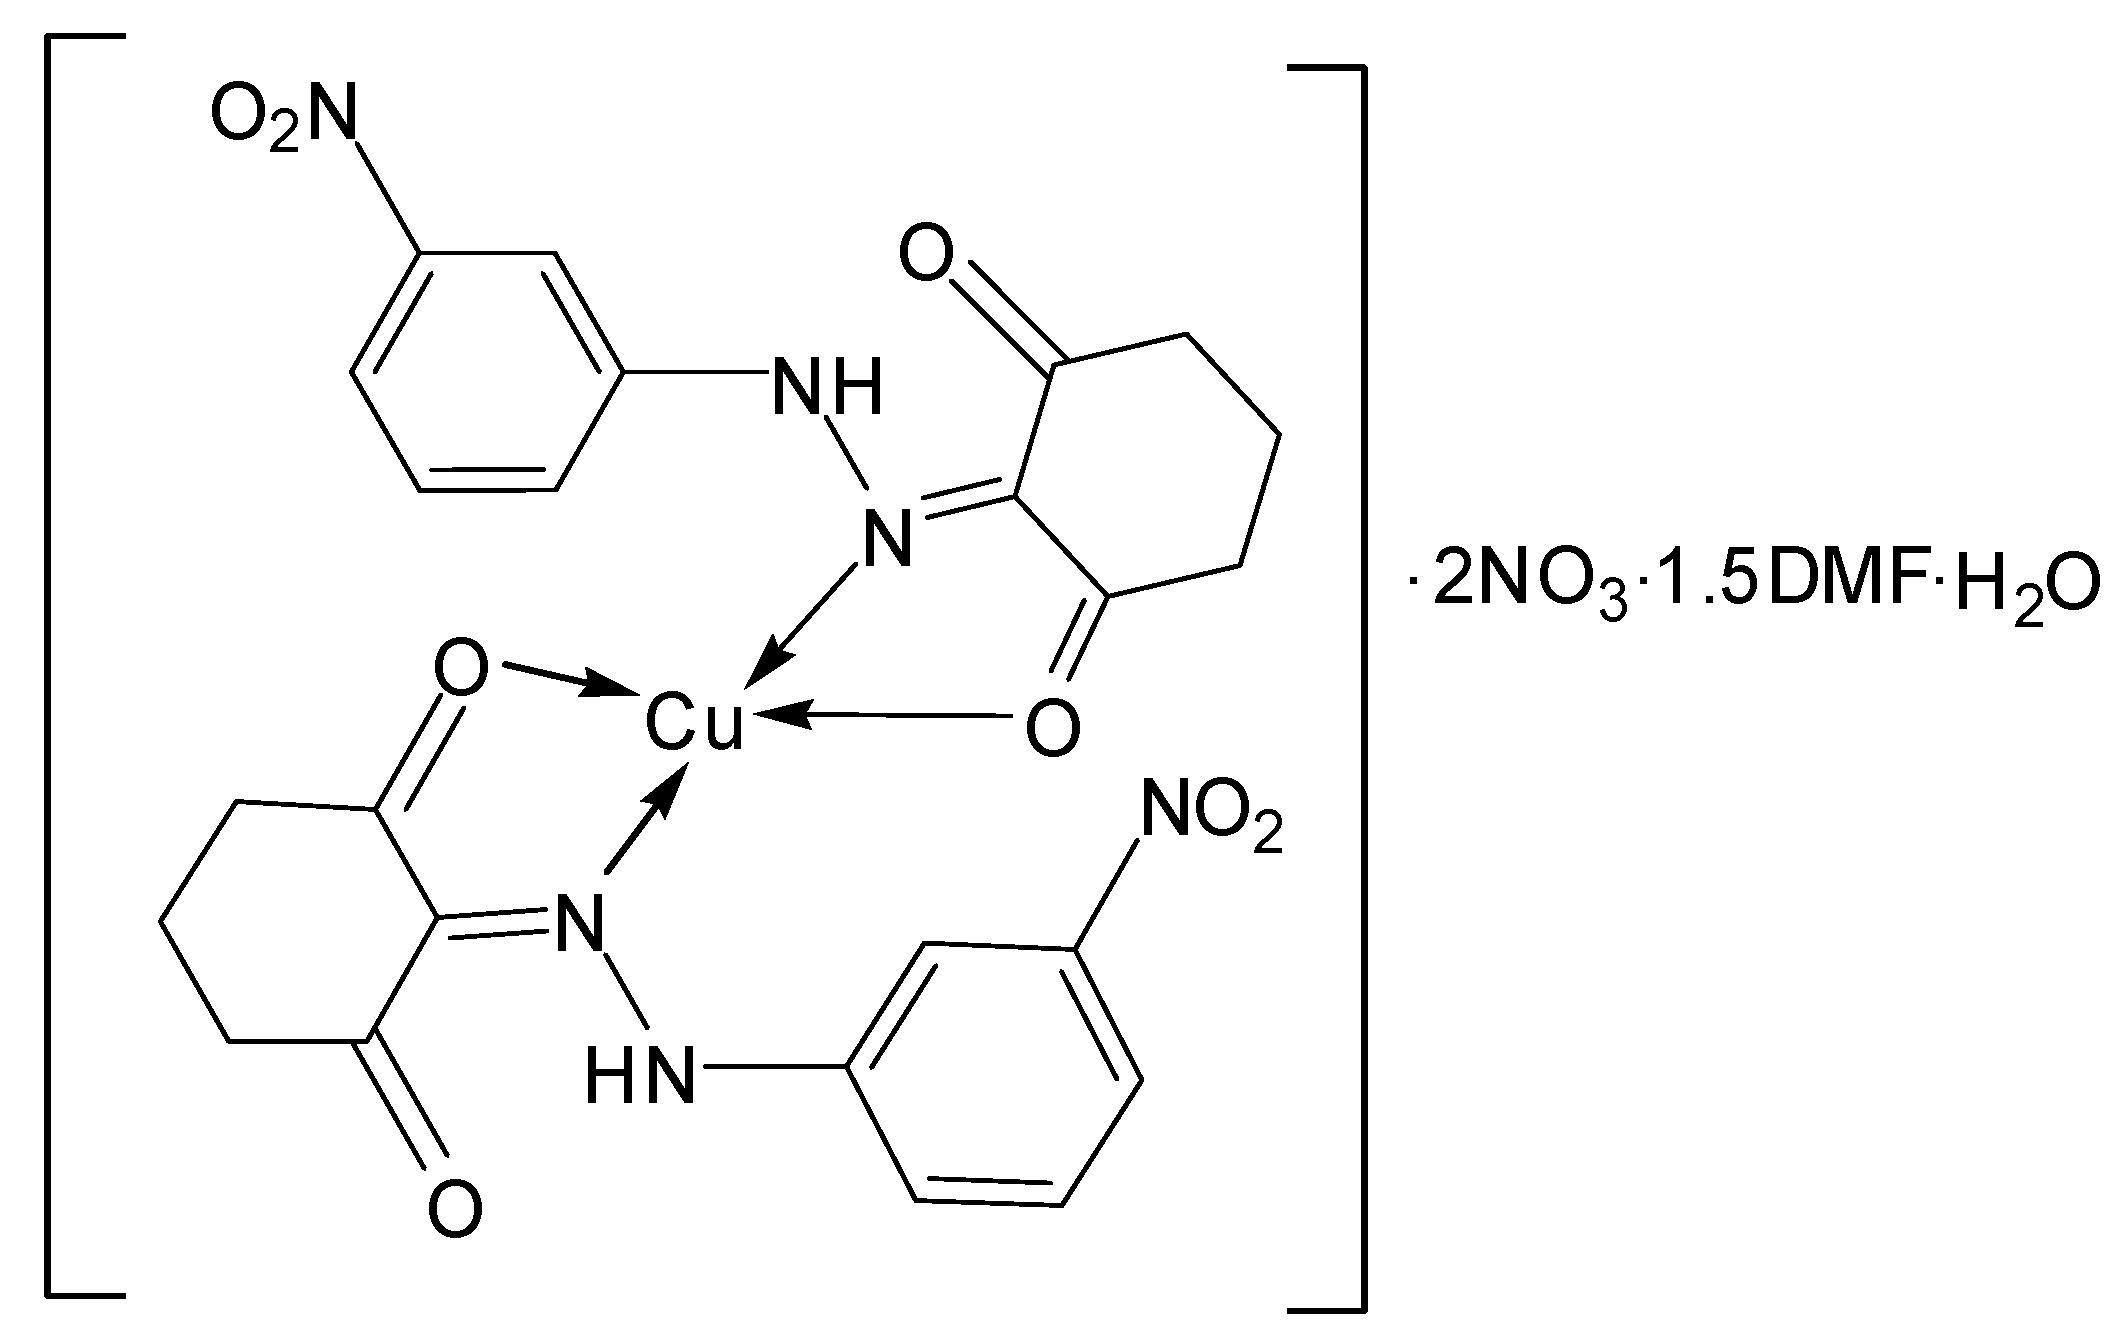
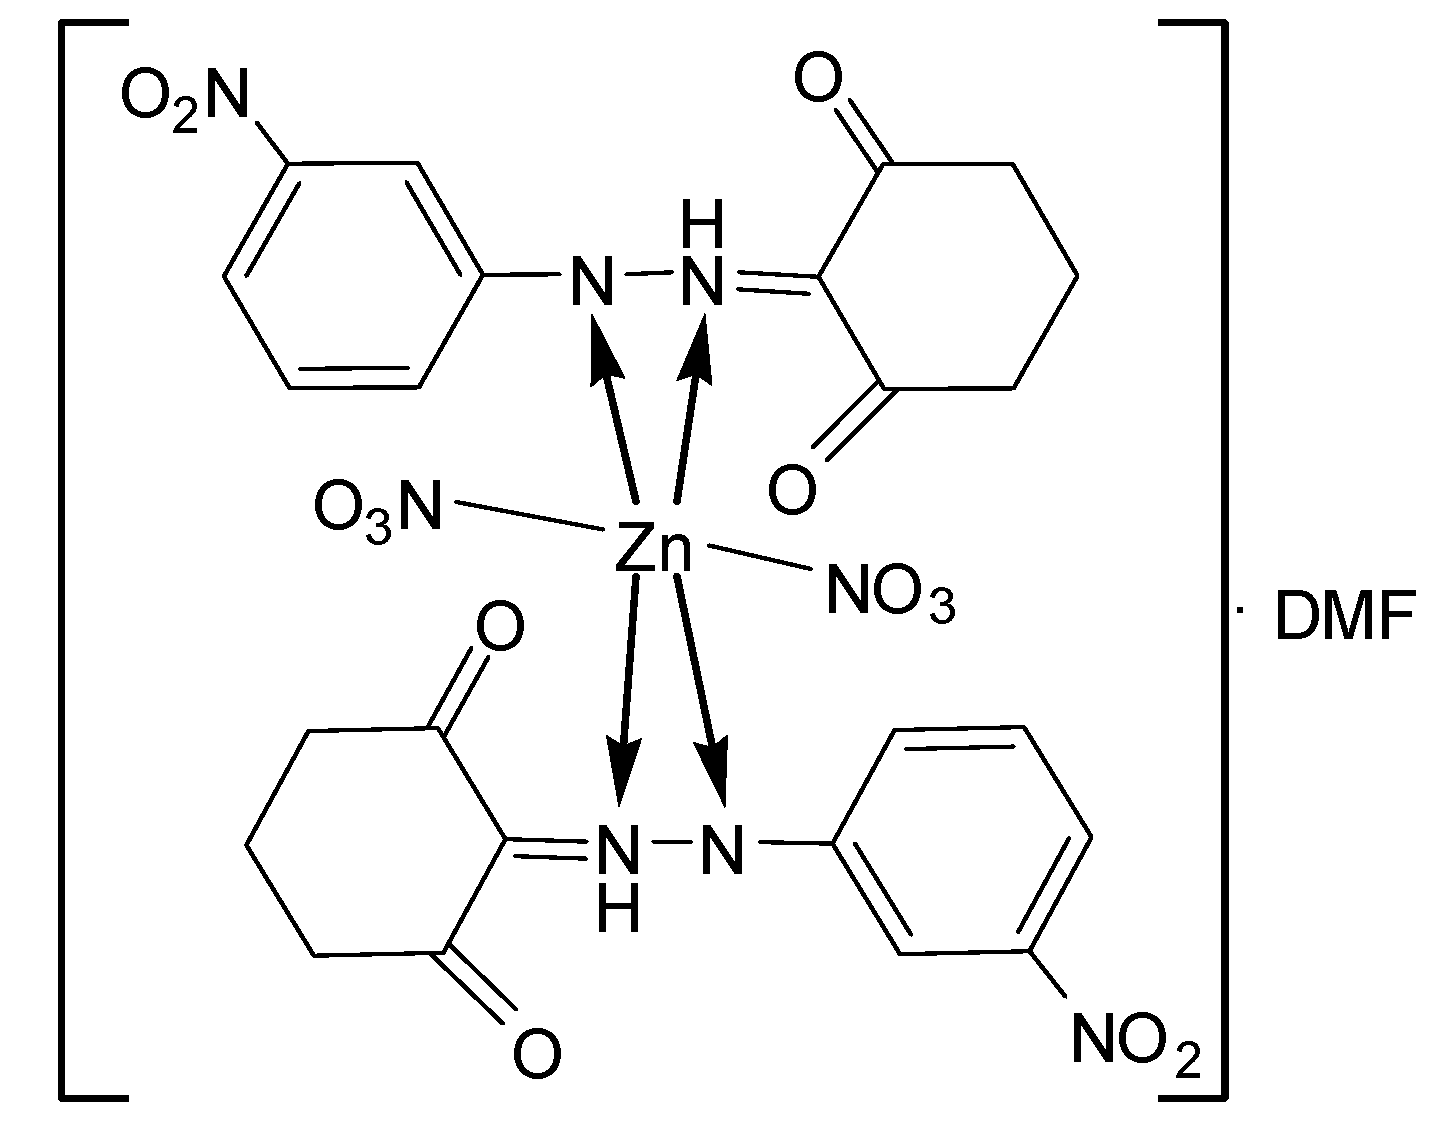
| [Cu(L2)2]∙2NO3∙1.5DMF∙H2O | |||
| C24H24N8O15Cu∙1.5DMF | 100.05–280.14 | 24.62(24.79) | H2O, 1.5 DMF, 2 NO3− |
| C24H22N6O8Cu | 280.14–600.00 | 58.46(58.55) | C24H22N6O7Cu |
| CuO | |||
| [Zn(L2)2(NO3)2]∙DMF | |||
| C24H22N7O16Zn | 160.53–241.20 | 9.23(9.30) | DMF |
| C21H15N6O15Zn | 241.20–277.55 | 44.61(44.10) | 2 NO3−, C12H14N2O2 |
| C9HN2O7Zn | 277.55–458.33 | ||
| [Zn2(L2)(OAc)4(H2O)4]∙5H2O | |||
| C20H41N3O21Zn2 | 75–120.20 | 12.30(11.39) | 5H2O |
| C20H31N3O16Zn2 | 120.20–190.55 | 10.76(9.12) | 4 H2O |
| C20H23N3O12Zn2 | 190.55–360.35 | 29.23(29.87) | 4 C2H3O2− |
| C12H11N3O4Zn2 | 360.35–Cont. | 15.38(15.70) | C6H6O2N |
| C6H5N2O2Zn2 |
2.5. Mass Spectra
2.6. Biological Evaluation
| Chemicals | Escherichia coli ATCC 25922 | Enterococcus faecalis ATCC 29212 | Staphylococcus aureus ATCC 25923 | Salmonella typhimurium CCM 583 | |
|---|---|---|---|---|---|
| Bacteria | Zone Diameter (mm) (blank disk diameter, 6 mm) | ||||
| [Cu(L1)(OAc)2]∙5H2O | 0 | 0 | 0 | 0 | |
| [Cu(L1)(NO3)H2O]∙NO3∙3.5H2O | 0 | 0 | 0 | 0 | |
| [Cu2(L2)(OAc)4]∙2H2O∙2DMF | 0 | 0 | 0 | 0 | |
| [Cu(L2)2]∙2NO3∙1.5DMF∙H2O | 0 | 0 | 11 | 7 | |
| [Zn(L1)(NO3)2]∙4.5H2O | 0 | 0 | 0 | 0 | |
| [Zn(L1)(OAc)2(H2O)2]∙3H2O | 10 | 0 | 11 | 8 | |
| [Zn(L2)2(NO3)2]∙DMF | 0 | 0 | 0 | 0 | |
| [Zn2(L2)(OAc)4(H2O)4]∙5H2O | 0 | 0 | 7 | 0 | |
| Ampicillin | 16 | 22 | 32 | 26 | |
3. Experimental Section
3.1. Reagents and Instrumentation
3.2. Antibacterial Activity Studies
3.3. Synthesis of the Ligands L1 and L2
3.4. Synthesis of the Zn(II) and Cu(II) Complexes of the Ligands


4. Conclusions
Acknowledgments
Author Contributions
Conflicts of Interest
References
- Lee, D.L.; Prisbylla, M.P.; Cromartie, T.H.; Dagarin, D.P.; Howard, S.W.; Provan, W.M.; Ellis, M.K.; Fraser, T.; Mutter, L.C. The discovery and structural requirements of inhibitors of p-hydroxyphenylpyruvatedioxygene. Weed Sci. 1997, 45, 601–609. [Google Scholar]
- Lock, E.A.; Ellis, M.K.; Gaskin, P.; Robinson, M.; Auton, T.R.; Provan, W.M.; Smith, L.L.; Prisbylla, M.P.; Mutter, L.C.; Lee, D.L. From toxicological problem to therapeutic use: the discovery of the mode of action of 2-(2-nitro-4-trifluoromethylbenzoyl)-1,3-cyclohexanedione (NTBC), its toxicology and development as a drug. J. Inherit. Metab. Dis. 1998, 21, 498–506. [Google Scholar] [CrossRef] [PubMed]
- Sethukumar, A.; Arul Prakasam, B. Spectral and cyclic voltammetric studies on some intramolecularly hydrogen bonded arylhydrazones: Crystal and molecular structure of 2-(2-(3-nitrophenyl)hydrazono)-5,5-dimethylcyclohexane-1,3-dione. J. Mol. Struct. 2010, 963, 250–257. [Google Scholar] [CrossRef]
- Dey, K. Schiff bases and their uses. J. Sci. Ind. Res. 1974, 33, 76–97. [Google Scholar]
- Nehru, K.; Athappan, P.; Rajagopal, G. Ruthenium(II)/(III) complexes of bidentate acetyl hydrazide Schiff bases. Transit. Metal Chem. 2001, 26, 652–656. [Google Scholar] [CrossRef]
- Deepa, K.; Aravindakshan, K.K. Synthesis, characterization and antifungal studies of metal complexes of benzoyl- and salicylylhydrazones of ω-bromoacetoacetanilide. Synth. React. Inorg. Met. 2005, 35, 409–416. [Google Scholar] [CrossRef]
- El-Dissouky, A.; Shuaib, N.M.; Al-Awadi, N.A.; Abbas, A.B.; El-Sherif, A. Synthesis, characterization, potentiometric and thermodynamic studies of transition metal complexes with 1-benzotriazol-1-yl-1-[(p-methoxyphenyl)hydrazono]propan-2-one. J. Coord. Chem. 2008, 61, 579–594. [Google Scholar] [CrossRef]
- Chang, H-L.; Chao, T-Y.; Yang, C-C.; Dai, S.A.; Jeng, R.-J. Second-order nonlinear optical hyperbranched polymers via facile ring-opening addition reaction of azetidine-2,4-dione. Eur. Polym. J. 2007, 43, 3988–3996. [Google Scholar] [CrossRef]
- Dabbagh, H.A.; Teimouri, A. Insertion reaction of azidosulfonylazo dye with model alicyclic and heterocyclic compounds. Russ. J. Org. Chem. 2008, 44, 1464–1470. [Google Scholar] [CrossRef]
- Tuncel, M.; Serin, S. Synthesis and characterization of Copper(II), Nickel(II) and Cobalt(II) complexes with azo-linked Schiff base ligands. Synth. React. Inorg. Met. 2005, 35, 203–212. [Google Scholar] [CrossRef]
- Raval, J.P.; Rai, A.R.; Patel, N.H.; Patel, H.V.; Patel, P.S. Synthesis and in vitro antimicrobial activity of N′-(4-(arylamino)-6-(pyridin-2-ylamino)-1,3,5-triazin-2-yl)benzohydrazide. Int. J. ChemTech Res. 2009, 1, 616–620. [Google Scholar]
- Kuznik, W.; Kityk, I.V.; Kopylovich, M.N.; Mahmudov, K.T.; Ozga, K.; Lakshminarayana, G.; Pombeiro, A.J.L. Quantum chemical simulations of solvent influence on UV-vis spectra and orbital shapes of azo derivatives of diphenylpropane-1,3-dione. Spectrochim. Acta Part A 2011, 78, 1287–1294. [Google Scholar] [CrossRef]
- Pulimamidi, R.R.; Addla, S.; Nomula, R.; Pallepogu, R. Synthesis, structure, DNA binding and cleavage properties of ternary amino acid Schiff base-phen/bipy Cu(II) complexes. J. Inorg. Biochem. 2011, 105, 1603–1612. [Google Scholar] [CrossRef] [PubMed]
- Bhowon, M.G.; Wah, H.L.K.; Dosieah, A.; Ridana, M.; Ramalingum, O.; Lacour, D. Synthesis, characterization, and catalytic activity of metal Schiff base complexes derived from pyrrole-2-carboxyaldehyde. Synth. React. Inorg. Met. 2004, 34, 1–16. [Google Scholar] [CrossRef]
- Berestovitskaya, V.M.; Selivanova, M.V.; Vakulenko, M.I.; Efremova, I.E.; Berkova, G.A. Reactions of 2-benzylidene-3-methyl-4-nitro-2,5-dihydrothiophene 1,1-dioxide with CH acids. Russ. J. Org. Chem. 2009, 45, 1814–1817. [Google Scholar] [CrossRef]
- Abu-El-Wafa, S.M.; El-Wakiel, N.A.; Issa, R.M.; Mansour, R.A. Formation of novel mono- and multi-nuclear complexes of Mn(II), Co(II) and Cu(II) with bisazo-dianils containing the pyrimidine moiety: Thermal, magnetic and spectral studies. J. Coord. Chem. 2005, 58, 683–694. [Google Scholar] [CrossRef]
- Anant, P.; Bibhesh, K.S.; Narendar, B.; Devjani, A. Synthesis and Characterization of bioactive Zinc(II) and Cadmium(II) complexes with new Schiff bases derived from 4-nitrobenzaldehyde and acetophenone with ethylenediamine. Spectrochim. Acta Part A 2010, 76, 356–362. [Google Scholar] [CrossRef]
- Turan, N.; Sekerci, M. Synthesis and spectral studies of novel Co(II), Ni(II), Cu(II), Cd(II), and Fe(II) metal complexes with N-[5′-amino-2,2′-bis(1,3,4-thiadiazole)-5-yl]-2-hydroxybenzaldehyde imine (HL). Spectrosc. Lett. 2009, 42, 258–267. [Google Scholar]
- El-Haty, M.T.; Adam, F.A. Chelating properties of heterocyclic Schiff bases derived from 2-amino-5-phenyl-1,3,4-thiadiazole. Bull. Soc. Chim. Fr. 1986, 5, 729–732. [Google Scholar]
- Hui, R-H.; Zhou, P.; You, Z.L. Syntheses crystal structures and antibacterial activities of two end-on azido bridged copper(II) complexes with Schiff bases. Indian J. Chem. Sect. A 2009, 48, 1102–1106. [Google Scholar]
- Gup, R.; Kırkan, B. Synthesis and spectroscopic studies of Copper(II) and Nickel(II) complexes containing hydrazonic ligands and heterocyclic coligand. Spectrochim. Acta Part A 2005, 62, 1188–1195. [Google Scholar]
- Borras, E.; Alzuet, G.; Borras, J.; Serevr-Carrio, J.; Castineiras, A.; Liu-Gonzalez, M.; Sanz-Ruiz, F. Coordination chemistry of sulfamethizole: Crystal structures of [Cu(sulfamethizolate)2(py)2(OH2)]H2O, [M(sulfamethizolate)2(py)2(OH2)2] [M = Co and Ni] and {Cu(sulfamethizolate)2(DMF)2}. Polyhedron 2000, 19, 1859–1866. [Google Scholar]
- Cao, G.-B. Synthesis, characterization, and crystal structure of a novel trinuclear Schiff base Nickel(II) complex. Synth. React. Inorg. Met. 2007, 37, 639–642. [Google Scholar]
- Chandra, S.; Vandana; Kumar, S. Synthesis, spectroscopic, anticancer, antibacterial and antifungal studies of Ni(II) and Cu(II) complexes with hydrazine carboxyamide, 2-[3-methyl-2-thienylmethylene]. Spectrochim. Acta Part A 2015, 135, 356–363. [Google Scholar]
- Şekerci, M.; Alkan, C. The Synthesis and Co(II), Ni(II), Cu(II) and UO2(VI) complexes of 1,2-O-benzal-4-aza-7-aminoheptane. Synth. React. Inorg. Met. 1999, 29, 1685–1697. [Google Scholar]
- AbouEl-Enein, S.A.; El-Saied, F.A.; Kasher, T.I.; El-Wardany, A.H. Synthesis and characterization of Iron(III), Manganese(II), Cobalt(II), Nickel(II), Copper(II) and Zinc(II) complexes of salicylidene-N-anilinoacetohydrazone (H2L1) and 2-hydroxy-1-naphthylidene-N-anilinoacetohydrazone (H2L2). Spectrochim. Acta Part A 2007, 67, 737–743. [Google Scholar]
- Silverstein, R.M.; Bassler, G.C.; Morrill, T.C. Spectrometric Identification of Organic Compounds, 4th ed.; Wiley: New York, NY, USA, 1981. [Google Scholar]
- Losada, J.; delPeso, I.; Beyer, L. Electrochemical and spectroelectrochemical properties of Copper(II) Schiff-base complexes. Inorg. Chim. Acta 2001, 321, 107–115. [Google Scholar]
- Tabassum, S.; Bashar, A.; Arjmand, F.; Siddigi, G. Synthesis and characterization of lanthanide chelates with metal-containing ligands. Synth. React. Inorg. Met. 1997, 27, 487. [Google Scholar]
- Nakamoto, K. Infrared Spectra of Inorganic and Coordination Compounds, 3rd ed.; Wiley Inter Science: New York, NY, USA, 1970; pp. 159, 167, 214. [Google Scholar]
- Tharmaraj, P.; Kodimunthiri, D.; Prakash, P.; Sheela, C.D. Catalytic and biological activity of transition metal complexes of salicylaldiminopropylphosphine. J. Coord. Chem. 2009, 62, 2883–2892. [Google Scholar]
- Uçan, S.Y.; Uçan, M. Synthesis and characterization of new Schiff bases and their Cobalt(II), Nickel(II), Copper(II), Zinc(II), Cadmium(II) and Mercury(II) complexes. Synth. React. Inorg. Met. 2005, 35, 417–421. [Google Scholar]
- El-Metwally, N.M.; Gabr, I.M.; Shallaby, A.M.; El-Asmy, A.A. Synthesis and spectroscopic characterization of new mono- and binuclear complexes of some NH(1) thiosemicarbazides. J. Coord. Chem. 2005, 58, 1145–1159. [Google Scholar]
- Sönmez, M.; Sekerci, M. The template synthesis, characterization, and thermal investigation of new heterocyclic binucleating Schiff base complexes. Synth. React. Inorg. Met. 2004, 34, 1551–1561. [Google Scholar]
- Sekerci, M. Synthesis, magnetospectral, and thermal studies of Cobalt(II), Nickel(II), and Copper(II) Complexes of new asymmetrical 1,2-dihydroxyimino-3,8-diaza-9-phenylnonane. Russ. J. Inorg. Chem. 2000, 45, 1525–1530. [Google Scholar]
- Turan, N.; Sekerci, M. Synthesis, characterization and thermal behavior of some Zn(II) complexes with ligands having 1,3,4-thiadiazole moieties. Heteroat. Chem. 2010, 21, 14–23. [Google Scholar]
- El-Bindary, A.A.; El-Sonbati, A.Z.; Diab, M.A.; Attallah, M.E. Polymer complexes. LVI. supramolecular architectures consolidated by hydrogen bonding and π–π Interaction. Spectrochim. Acta Part A 2012, 86, 547–553. [Google Scholar]
- Adiguzel, R.; Esener, H.; Ergin, Z.; Aktan, E.; Turan, N.; Sekerci, M. Synthesis and structural characterization of bis(2-amino-1,3,4-thiadiazolyl)methane complexes. Asian J. Chem. 2011, 23, 2795–2800. [Google Scholar]
- Esener, H.; Adıgüzel, R.; Ergin, Z.; Aktan, E.; Turan, N.; Sekerci, M. Synthesis and characterization of novel Mn(II), Co(II), Ni(II) and Cd(II) complexes from 4-(2-nitrophenylazo)-1H-pyrazole-3,5-diamine. Adv. Sci. Lett. 2011, 4, 3669–3675. [Google Scholar]
- Clinical and Laboratory Standards Institute. Performance Standards for Antimicrobial Disk Susceptibility Tests, 9th ed.; Approved Standard M2-A9; CLSI: Wayne, PA, USA, 2006. [Google Scholar]
- National Committee for Clinical Laboratory Standards. Performance Standards for Antimicrobial Disk Susceptibility Tests, 7th ed.; Approved Standard M2-A7; NCCLS: Wayne, PA, USA, 2000. [Google Scholar]
- Sample Availability: Samples of the newly synthesized compounds are available from the authors.
© 2015 by the authors. Licensee MDPI, Basel, Switzerland. This article is an open access article distributed under the terms and conditions of the Creative Commons Attribution license ( http://creativecommons.org/licenses/by/4.0/).
Share and Cite
Turan, N.; Körkoca, H.; Adigüzel, R.; Çolak, N.; Buldurun, K. Synthesis, Structural Characterization and Biological Activity of Novel Cyclohexane-1,3-dione Ligands and Their Metal Complexes. Molecules 2015, 20, 9309-9325. https://doi.org/10.3390/molecules20059309
Turan N, Körkoca H, Adigüzel R, Çolak N, Buldurun K. Synthesis, Structural Characterization and Biological Activity of Novel Cyclohexane-1,3-dione Ligands and Their Metal Complexes. Molecules. 2015; 20(5):9309-9325. https://doi.org/10.3390/molecules20059309
Chicago/Turabian StyleTuran, Nevin, Hanifi Körkoca, Ragıp Adigüzel, Naki Çolak, and Kenan Buldurun. 2015. "Synthesis, Structural Characterization and Biological Activity of Novel Cyclohexane-1,3-dione Ligands and Their Metal Complexes" Molecules 20, no. 5: 9309-9325. https://doi.org/10.3390/molecules20059309
APA StyleTuran, N., Körkoca, H., Adigüzel, R., Çolak, N., & Buldurun, K. (2015). Synthesis, Structural Characterization and Biological Activity of Novel Cyclohexane-1,3-dione Ligands and Their Metal Complexes. Molecules, 20(5), 9309-9325. https://doi.org/10.3390/molecules20059309