2.1. Chemical Composition of SP, CMP, CFMP and CFBP
Four polysaccharides (named SP, CMP, CFMP and CFBP) were extracted from the A. mellea sporophores, mycelia, fermentation mixture and fermentation broth by boiling-water extraction, centrifugation, ethanol precipitation and deproteinization, respectively.
The yields and carbohydrate contents of these polysaccharides are shown in
Table 1. Among the four samples, CFBP showed the highest yield (24.38% ± 3.34%) and lowest carbohydrate content (52.73% ± 3.41%). SP showed a moderate yield (16.89% ± 0.71%) and the highest carbohydrate content (68.48% ± 0.14%). The yield of CFMP was the lowest (13.77% ± 1.03%). The carbohydrate contents of CMP and CFBP were moderate (57.68% ± 0.20%, 60.35% ± 0.16%). There was no significant difference (
p > 0.05) between CMP and CFMP in the yields and carbohydrate contents. The reason for this result maybe that CFBP is an extracellular polysaccharide, whereas SP and CMP are intracellular polysaccharides. The results suggested that extracellular polysaccharides had higher yield and lower carbohydrate contents than intracellular polysaccharides.
Table 1.
The polysaccharide yields and carbohydrate contents of SP, CMP, CFMP and CFBP.
Table 1.
The polysaccharide yields and carbohydrate contents of SP, CMP, CFMP and CFBP.
| Samples | Polysaccharide Yield (%) | Carbohydrate Content (%) |
|---|
| SP | 16.89 ± 0.71 b | 68.48 ± 0.14 a |
| CMP | 14.20 ± 2.00 a | 57.68 ± 0.20 b |
| CFMP | 13.77 ± 1.03 a | 60.35 ± 0.16 b |
| CFBP | 24.38 ± 3.34 c | 52.73 ± 3.41 c |
The proteins of the four polysaccharides were detected using the biuret and spectrophotometric methods. No significant absorption at 540 nm (biuret method) and at 260 or 280 nm (spectrophotometric method) in the UV-vis spectra of all samples indicated that there was no protein or nucleic acid in the polysaccharides of
A. mellea [
23].
The monosaccharide compositions of the polysaccharides were determined by gas chromatography and compared with monosaccharide standards. The results are shown in
Table 2. All of the polysaccharides had the same monosaccharide compositions. The major monosaccharide components were
d-xylose,
d-glucose and
d-galactose, whereas the molar percentages were different for the four polysaccharides. In SP, CMP and CFMP, glucose was the main monosaccharide (55.83%, 46.49% and 44.20%, respectively) and xylose was the least prevalent monosaccharide (9.80%, 19.10% and 20.30%, respectively). The percentages of galactose were similar (34.37%, 34.41% and 35.50%, respectively). In CFBP, glucose was the least prevalent monosaccharide (24.33%), and galactose was the main monosaccharide (43.96%). The percentage of xylose in the polysaccharides of the cultured products was higher than that of the sporophores, whereas the percentage of glucose in the polysaccharides of the cultured products was lower than that of the sporophores.
Table 2.
Monosaccharide compositions and molar percentages (%) of SP, CMP, CFMP and CFBP.
Table 2.
Monosaccharide compositions and molar percentages (%) of SP, CMP, CFMP and CFBP.
| Sample | Xylose (%) | Glucose (%) | Galactose (%) |
|---|
| SP | 9.80 | 55.83 | 34.37 |
| CMP | 19.10 | 46.49 | 34.41 |
| CFMP | 20.30 | 44.20 | 35.50 |
| CFBP | 31.71 | 24.33 | 43.96 |
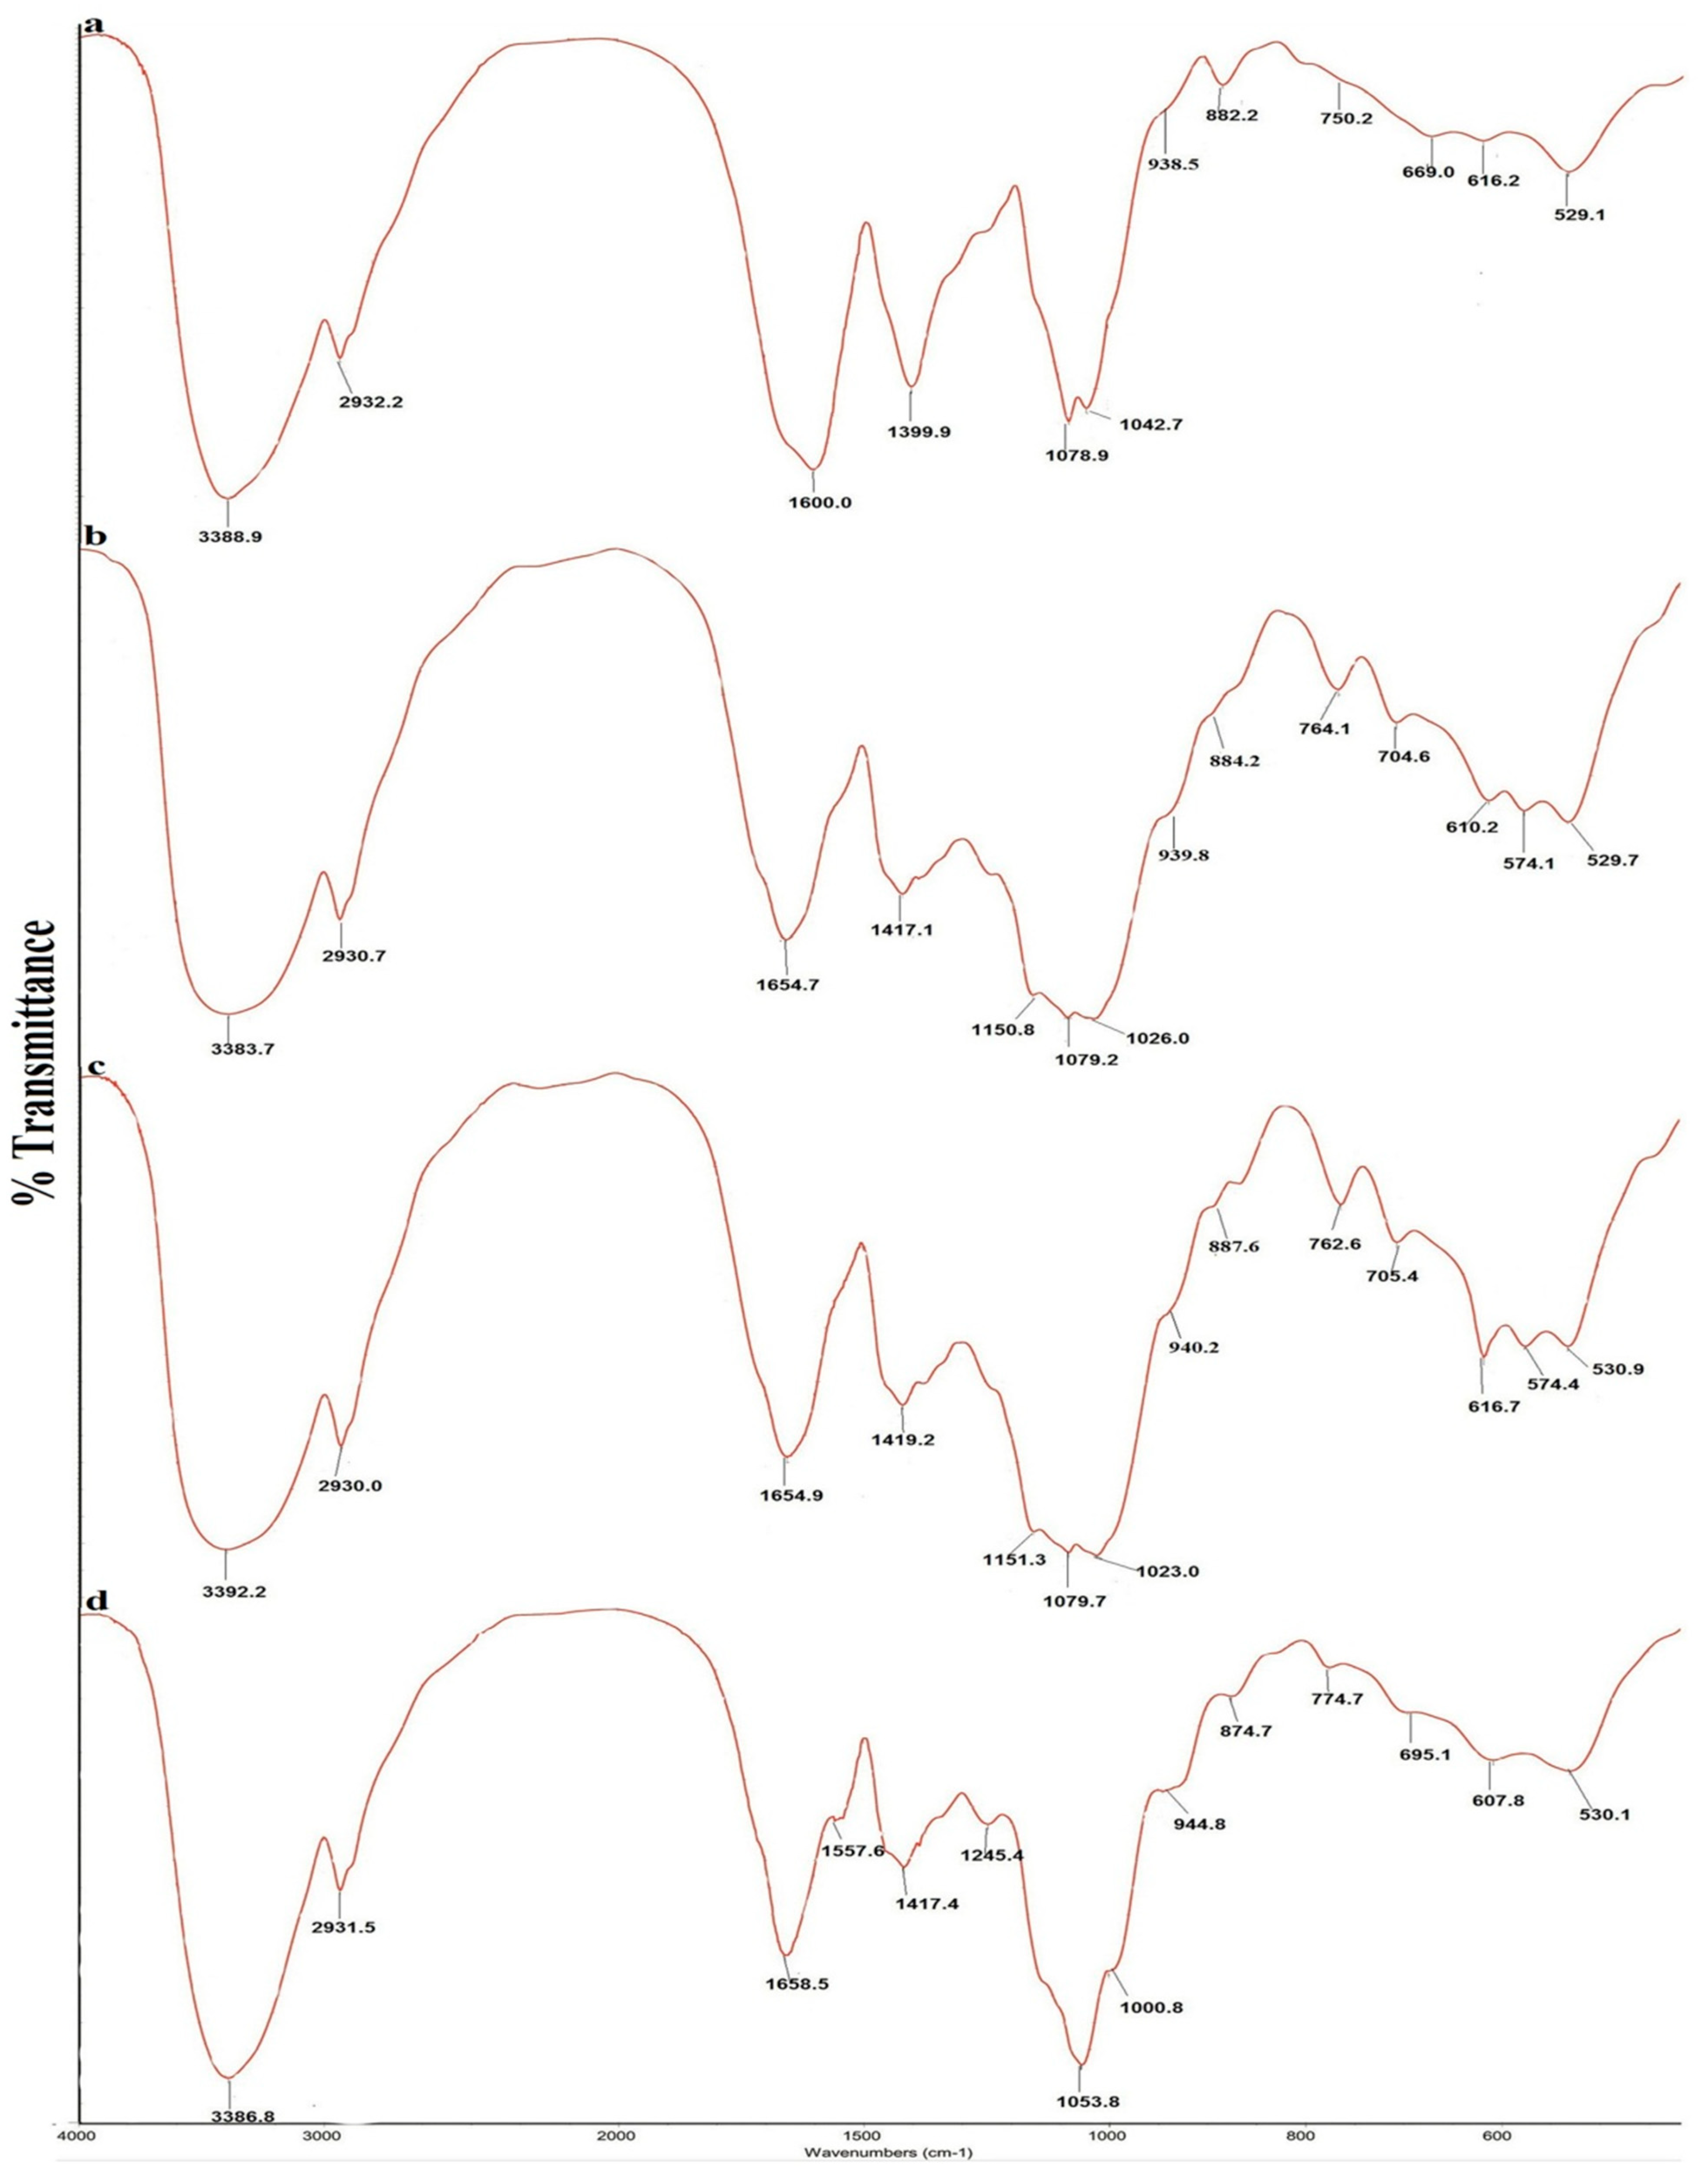
The FT-IR spectra of the four polysaccharides are shown in
Figure 1, and the absorption bands of the four polysaccharides are shown in
Table 3. All spectra were similar and showed characteristic polysaccharide bands. The strong and wide absorption of approximately 3390 cm
−1 was attributed to O-H stretching vibrations. The weak absorption band of approximately 2930 cm
−1 was attributed to C-H stretching vibrations of methylene [
24,
25]. The bands of approximately 1600–1654 cm
−1 were due to bound water [
26]. A sharp absorption band of approximately 1410 cm
−1 was attributed to methylene C-H bending vibrations [
24]. A strong and wide absorption band from 1000 cm
−1 to 1150 cm
−1 was attributed to the characteristic stretching vibration of C-O-C and the C-O-H bending vibration [
26]. The characteristic band of approximately 940 cm
−1 was attributed to D-glucopyranose ring antisymmetrical vibration [
24,
27]. The peak at around 880 cm
−1 was attributed to the D-galactopyranose or β-D-glucopyranose bending vibration [
26,
27]. The characteristic band atapproximately 770 cm
−1 was attributed to D-glucopyranose ring symmetrical ring vibration [
24]. The FT-IR spectra indicate that the four
A. mellea polysaccharides contain more β-configuration monosaccharides.
Figure 1.
FT-IR spectra of four polysaccharides from Armillaria mellea. (a) SP; (b) CMP; (c) CFMP; (d) CFBP.
Figure 1.
FT-IR spectra of four polysaccharides from Armillaria mellea. (a) SP; (b) CMP; (c) CFMP; (d) CFBP.
Table 3.
FT-IR absorption bands of SP, CMP, CFMP and CFBP.
Table 3.
FT-IR absorption bands of SP, CMP, CFMP and CFBP.
| Structural Characteristics | Absorption (cm−1) a |
|---|
| SP | CMP | CFMP | CFBP |
|---|
| O-H stretching vibration | 3388.9 | 3383.7 | 3392.2 | 3386.8 |
| C-H stretching vibration | 2932.2 | 2930.7 | 2930.0 | 2931.5 |
| bound water | 1600.0 | 1654.7 | 1654.9 | 1658.5 |
| C-H bending vibration | 1399.9 | 1417.1 | 1419.2 | 1417.4 |
| C-O-C stretching vibration | 1078.9 | 1140.8, 1079.2 | 1151.3, 1079.7 | 1053.8 |
| C-O-H bending vibration | 1042.7 | 1026.0 | 1023.0 | 1000.8 |
| antisymmetrical ring vibration | 938.5 | 939.8 | 940.2 | 944.8 |
| d-galactopyranose/β-d-glucopyranose bending vibration | 882.2 | 884.2 | 887.8 | 874.7 |
| symmetrical ring vibration | 750.2 | 764.1 | 762.6 | 774.7 |
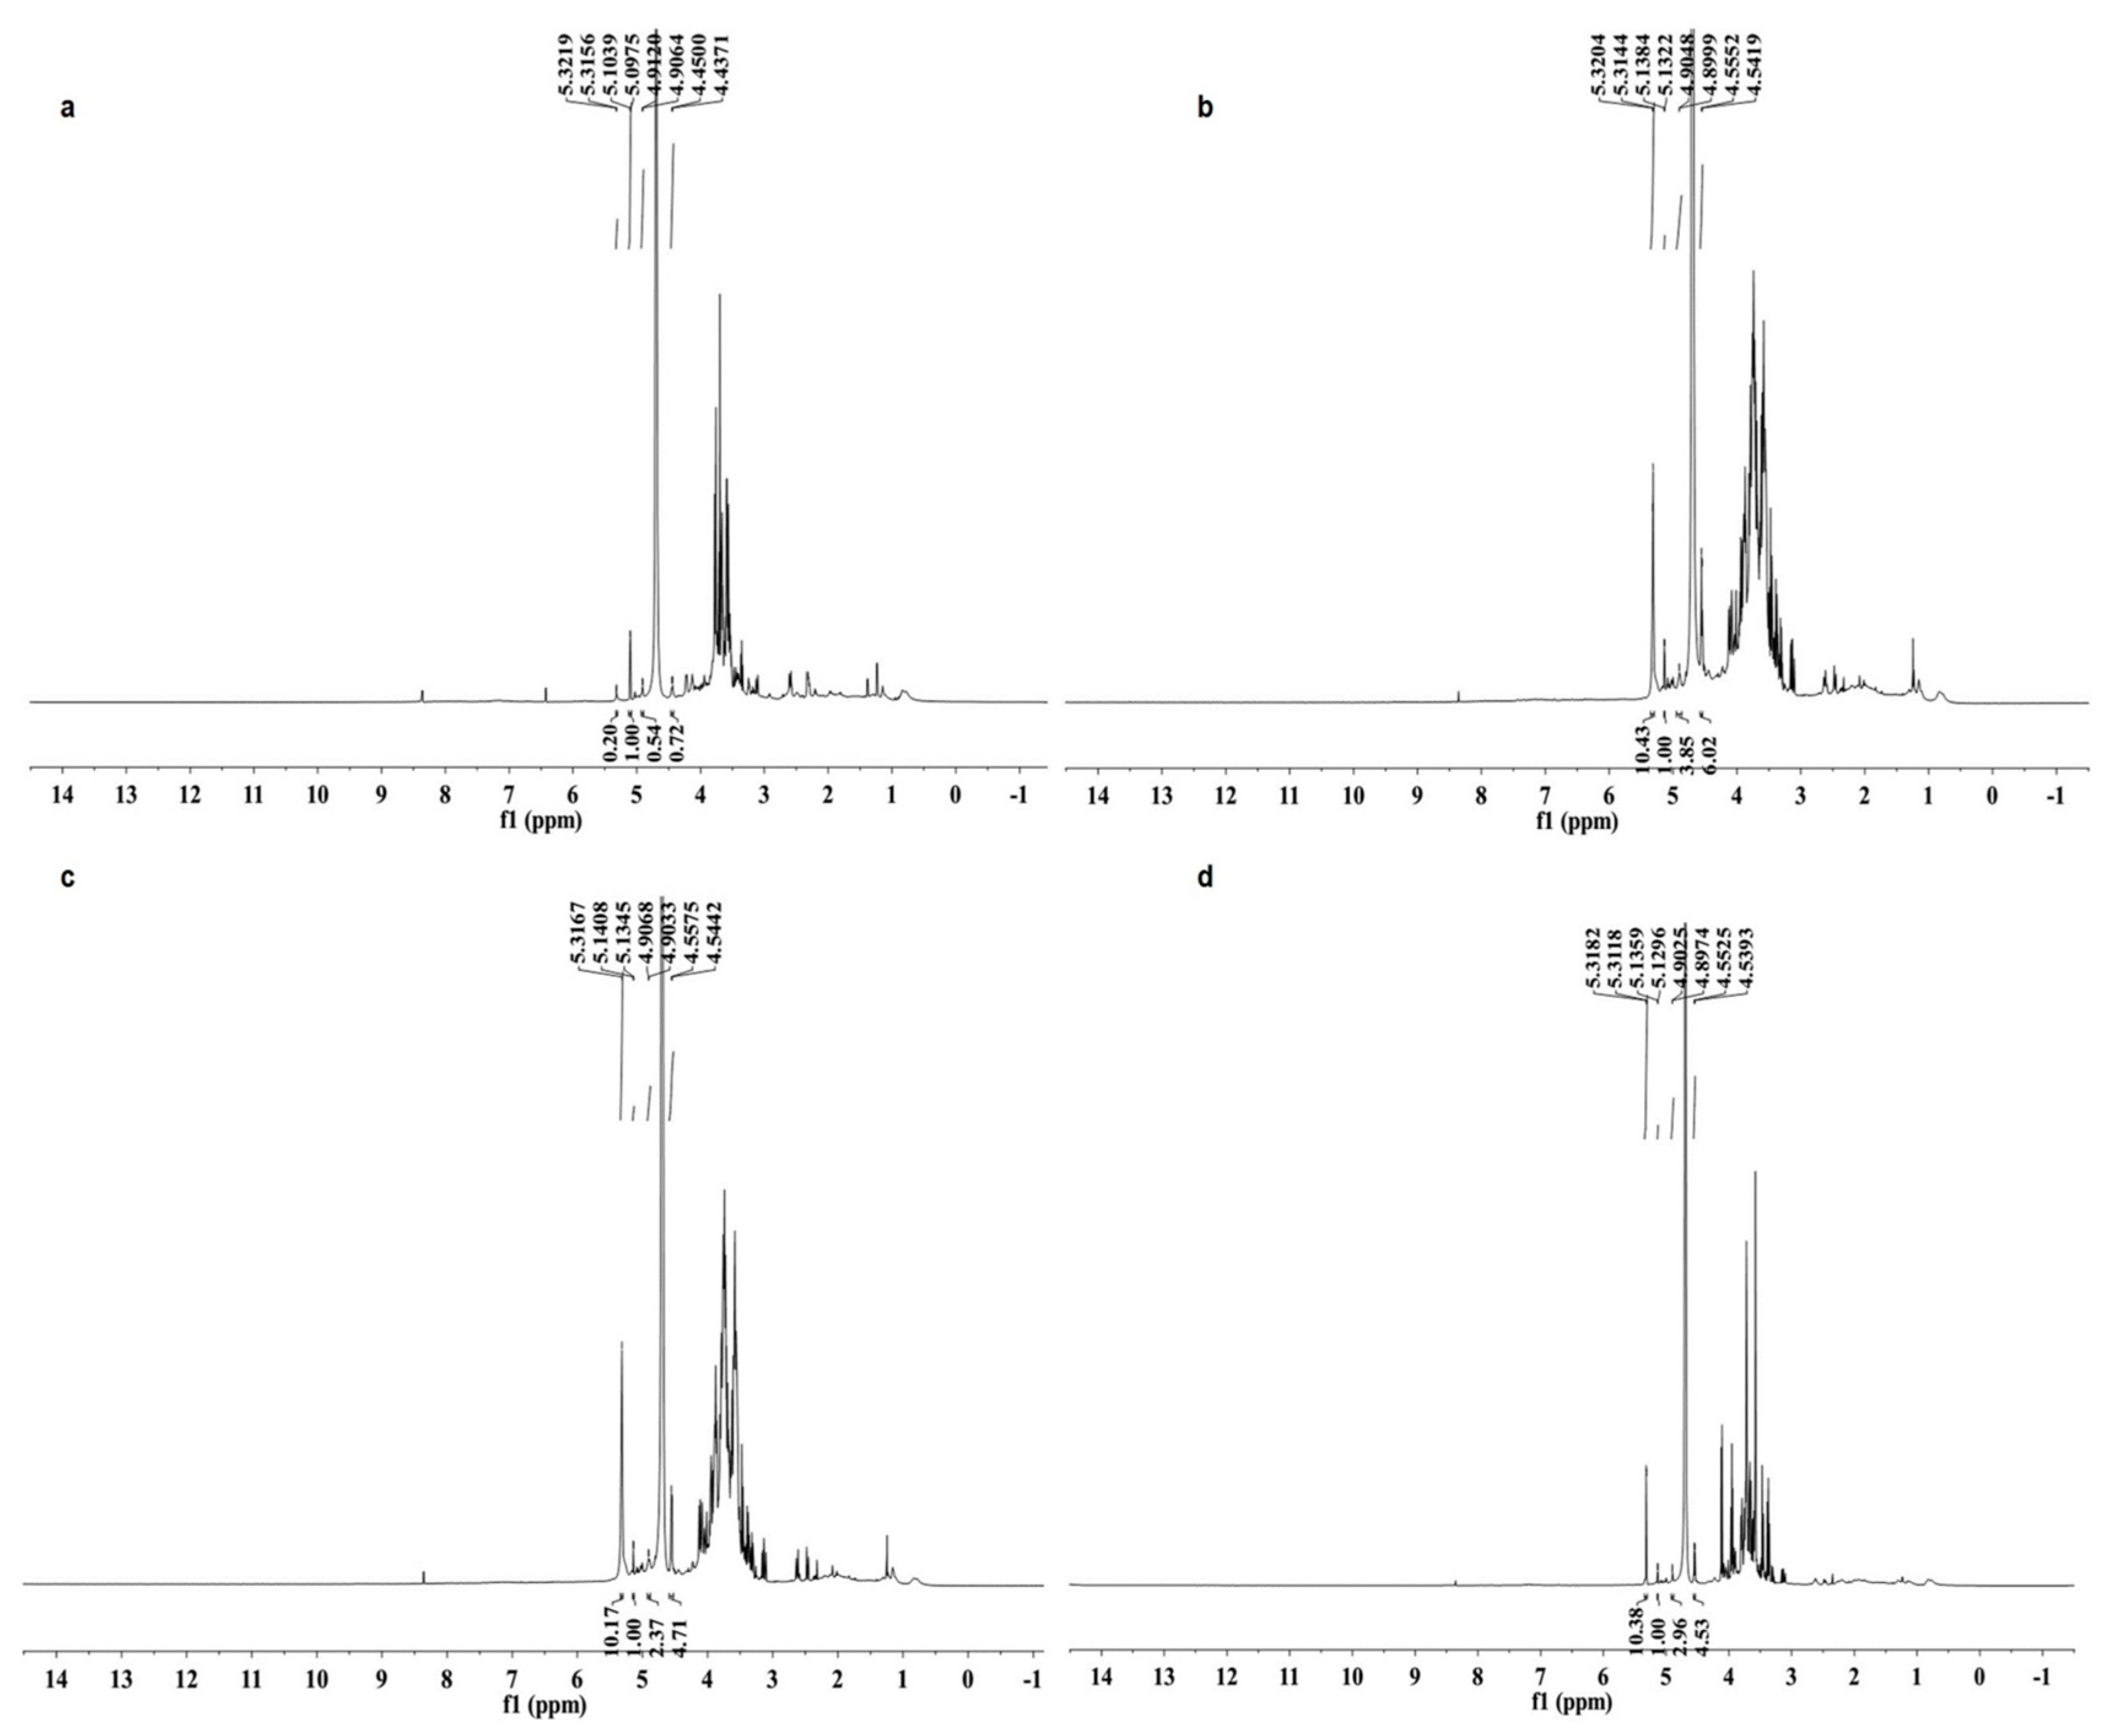
The
1H-NMR spectra of the four polysaccharides are shown in
Figure 2. The
1H signals at δ 4.90–5.32 ppm with coupling constants (
3J1,2) less than 4.0 Hz and
1H signal at δ 4.44–4.45 ppm with
3J1,2 larger than 7.0 Hz indicated that the glycosidic linkages of monosaccharides are both α and β configurations in the four polysaccharides [
28]. The chemical shifts from 3.29 to 4.23 ppm were assigned to protons of C2 to C5 (C6) of the glycosidic ring [
29].
Figure 2.
1H-NMR spectra (600 MHz, D2O, 27 °C) of four polysaccharides from Armillaria mellea. (a) SP; (b) CMP; (c) CFMP; (d) CFBP.
Figure 2.
1H-NMR spectra (600 MHz, D2O, 27 °C) of four polysaccharides from Armillaria mellea. (a) SP; (b) CMP; (c) CFMP; (d) CFBP.
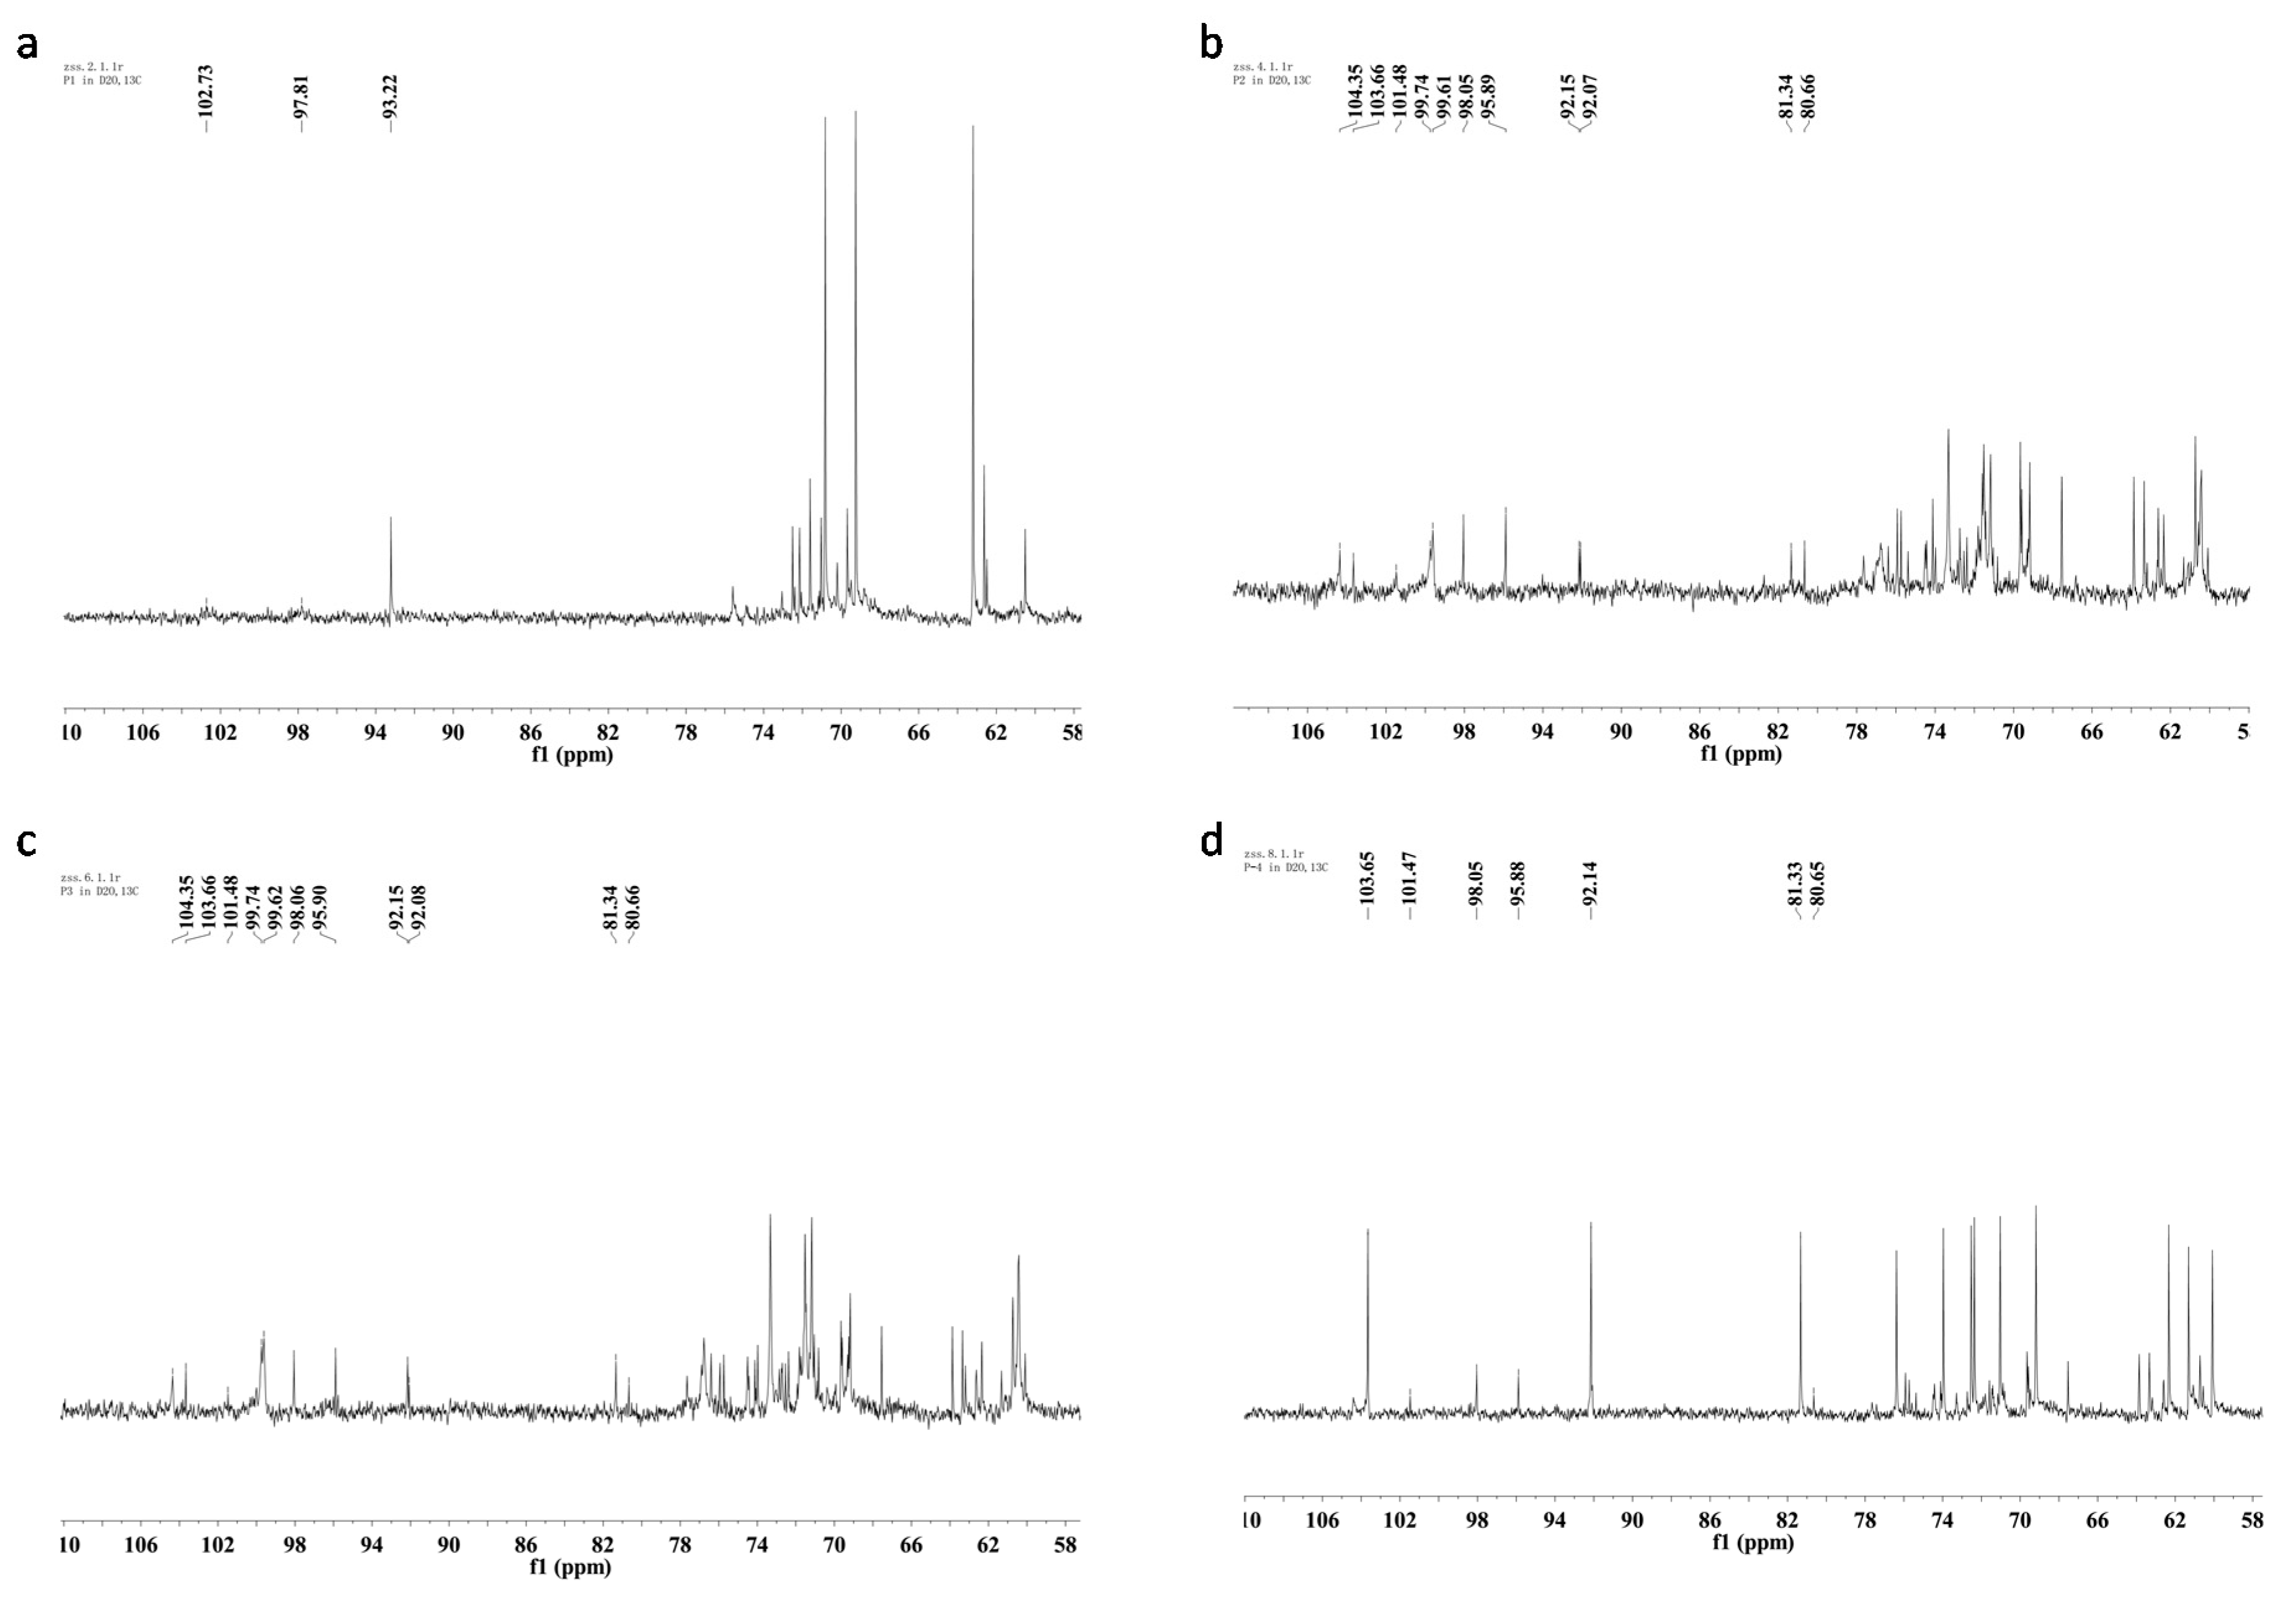
The
13C-NMR spectra of the four polysaccharides are illustrated in
Figure 3. SP showed a different
13C-NMR spectrum from other samples. Only one obvious signal appeared in the anomeric carbon resonances region at δ 93.2. The major anomeric carbons signals of the other three polysaccharides at δ 92.1–103.7 ppm suggested the presence of both α and β anomeric configurations [
29].
Figure 3.
13C-NMR spectra (150 MHz, D2O, 27 °C) of four polysaccharides from Armillaria mellea. (a) SP; (b) CMP; (c) CFMP; (d) CFBP.
Figure 3.
13C-NMR spectra (150 MHz, D2O, 27 °C) of four polysaccharides from Armillaria mellea. (a) SP; (b) CMP; (c) CFMP; (d) CFBP.
1H-NMR and 13C-NMR spectra of CMP and CFMP are similar, which conforms to the monosaccharide composition and FT-IR analysis. SP and CFBP show different NMR spectra than CMP and CFMP, which may be caused by the different linkage types, the different degree of branching, or the different purity of the crude polysaccharides. All four polysaccharides have both α- and β-configuration sugar residues and the β-configuration is more prevalent.
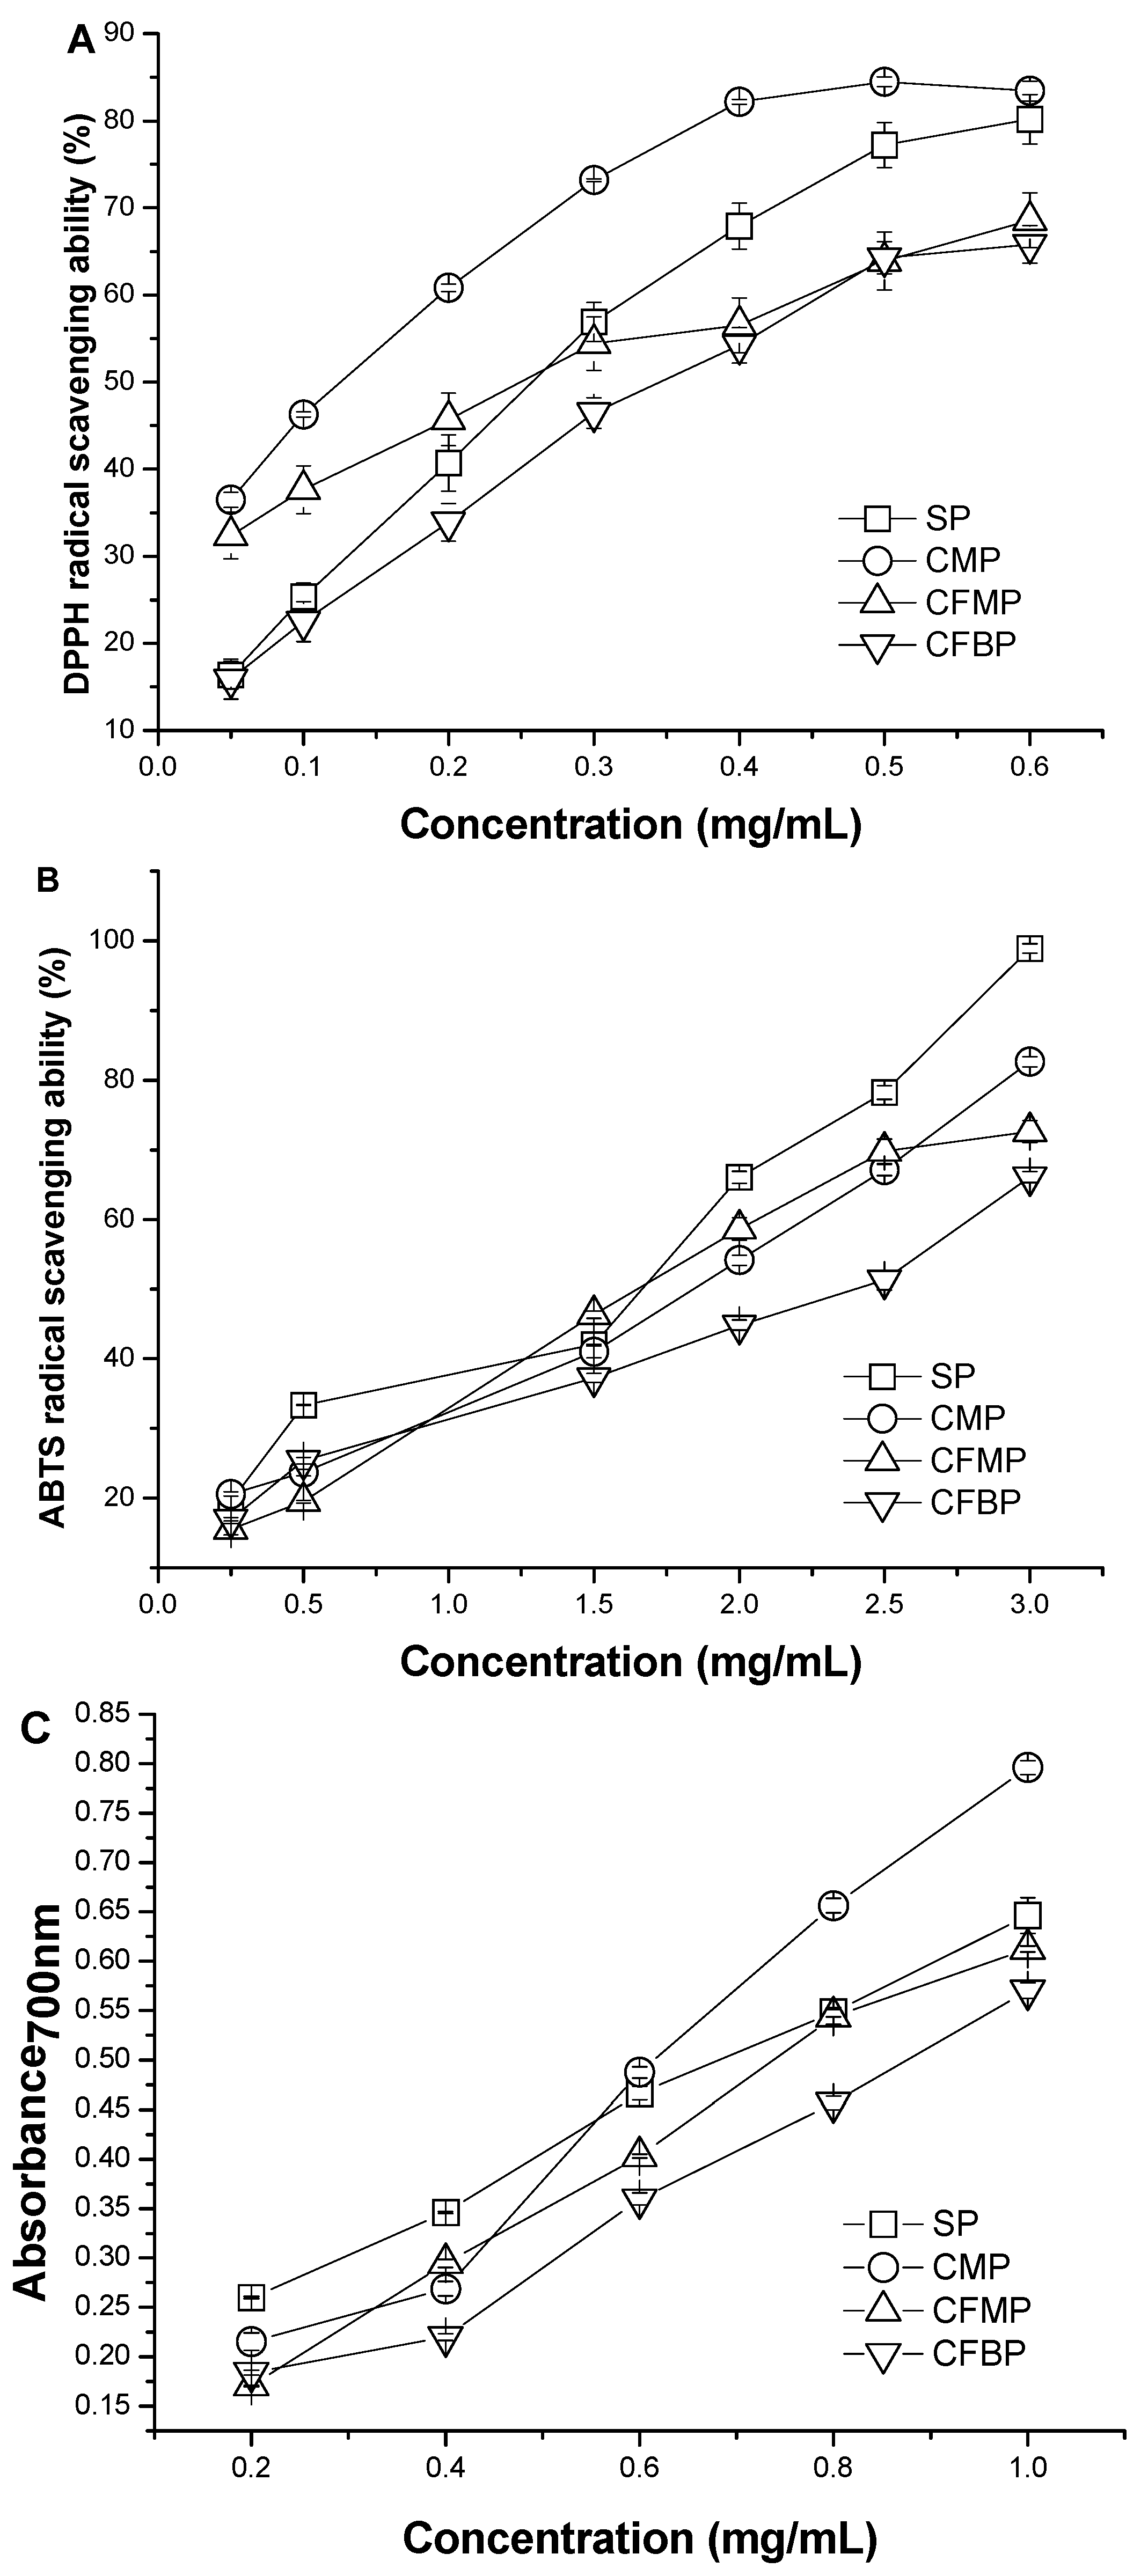
2.2. DPPH Radical Scavenging Activity
The scavenging abilities of
A. mellea polysaccharides for DPPH radical are shown in
Figure 4A, and the IC
50 values of the samples are listed in
Table 4. In general, the antioxidant activity is expressed as the IC
50 values of the samples. The lower the IC
50 value is, the higher the antioxidant activity is. The IC
50 values of the four polysaccharides were in the order of CFBP > SP > CFMP > CMP. The IC
50 value of SP (223.7 ± 0.011 μg/mL) was similar to the IC
50 value of CFMP (206.0 ± 0.036 μg/mL) (
p > 0.05). Although the scavenging activities of the four polysaccharides were lower than that of the positive controls (7.032 ± 0.006 μg/mL of BHA, 7.296 ± 0.004 μg/mL of VC), the four polysaccharides also demonstrated good scavenging activity for DPPH radicals. All four polysaccharides had scavenging activities in a concentration-dependent manner at a concentration range from 0.05 mg/mL to 0.60 mg/mL. At the low concentration of 0.05 mg/mL, the scavenging activities of the four polysaccharides were in the order of CMP > CFMP > SP > CFBP. At the high concentration of 0.60 mg/mL, the scavenging activities were in the order of CMP > SP > CFMP > CFBP, and the scavenging rate of CMP and SP reached more than 80%. The results indicated that polysaccharides from
A. mellea had an effect on scavenging DPPH radicals, and CMP showed better scavenging activity for DPPH radicals than the other polysaccharides.
Table 4.
The IC50 values of BHA, VC and the four A. mellea polysaccharides for DPPH radicals, ABTS radicals and reducing power.
Table 4.
The IC50 values of BHA, VC and the four A. mellea polysaccharides for DPPH radicals, ABTS radicals and reducing power.
| Sample | IC50 Values (μg/mL) |
|---|
| DPPH• | ABTS•+ | FRAP |
|---|
| VC | 7.032 ± 0.006 | 29.82 ± 0.021 | 13.13 ± 0.070 |
| BHA | 7.296 ± 0.004 | 15.79 ± 0.107 | 5.867 ± 0.075 |
| SP | 223.7 ± 0.011 b | 885.7 ± 0.015 a | 693.7 ± 0.009 b |
| CMP | 103.7 ± 0.003 a | 1348 ± 0.040 b | 552.0 ± 0.011 a |
| CFMP | 206.0 ± 0.036 b | 1420 ± 0.058 b | 768.2 ± 0.004 c |
| CFBP | 322.3 ± 0.030 c | 2118 ± 0.096 c | 996.3 ± 0.009 d |
2.5. Discussion of the Chemical Composition-Activity Relationship
The antioxidant activity of polysaccharides can be affected by their chemical composition, contents, conformation and molecular size [
30], whereas the chemical compositions and contents depend on the cultivation method, environmental conditions [
31] or different species [
32] of raw materials. In our study, the difference in antioxidant activities of the four polysaccharides may be affected by the different chemical compositions of the different species of raw materials (sporophores and cultured products).
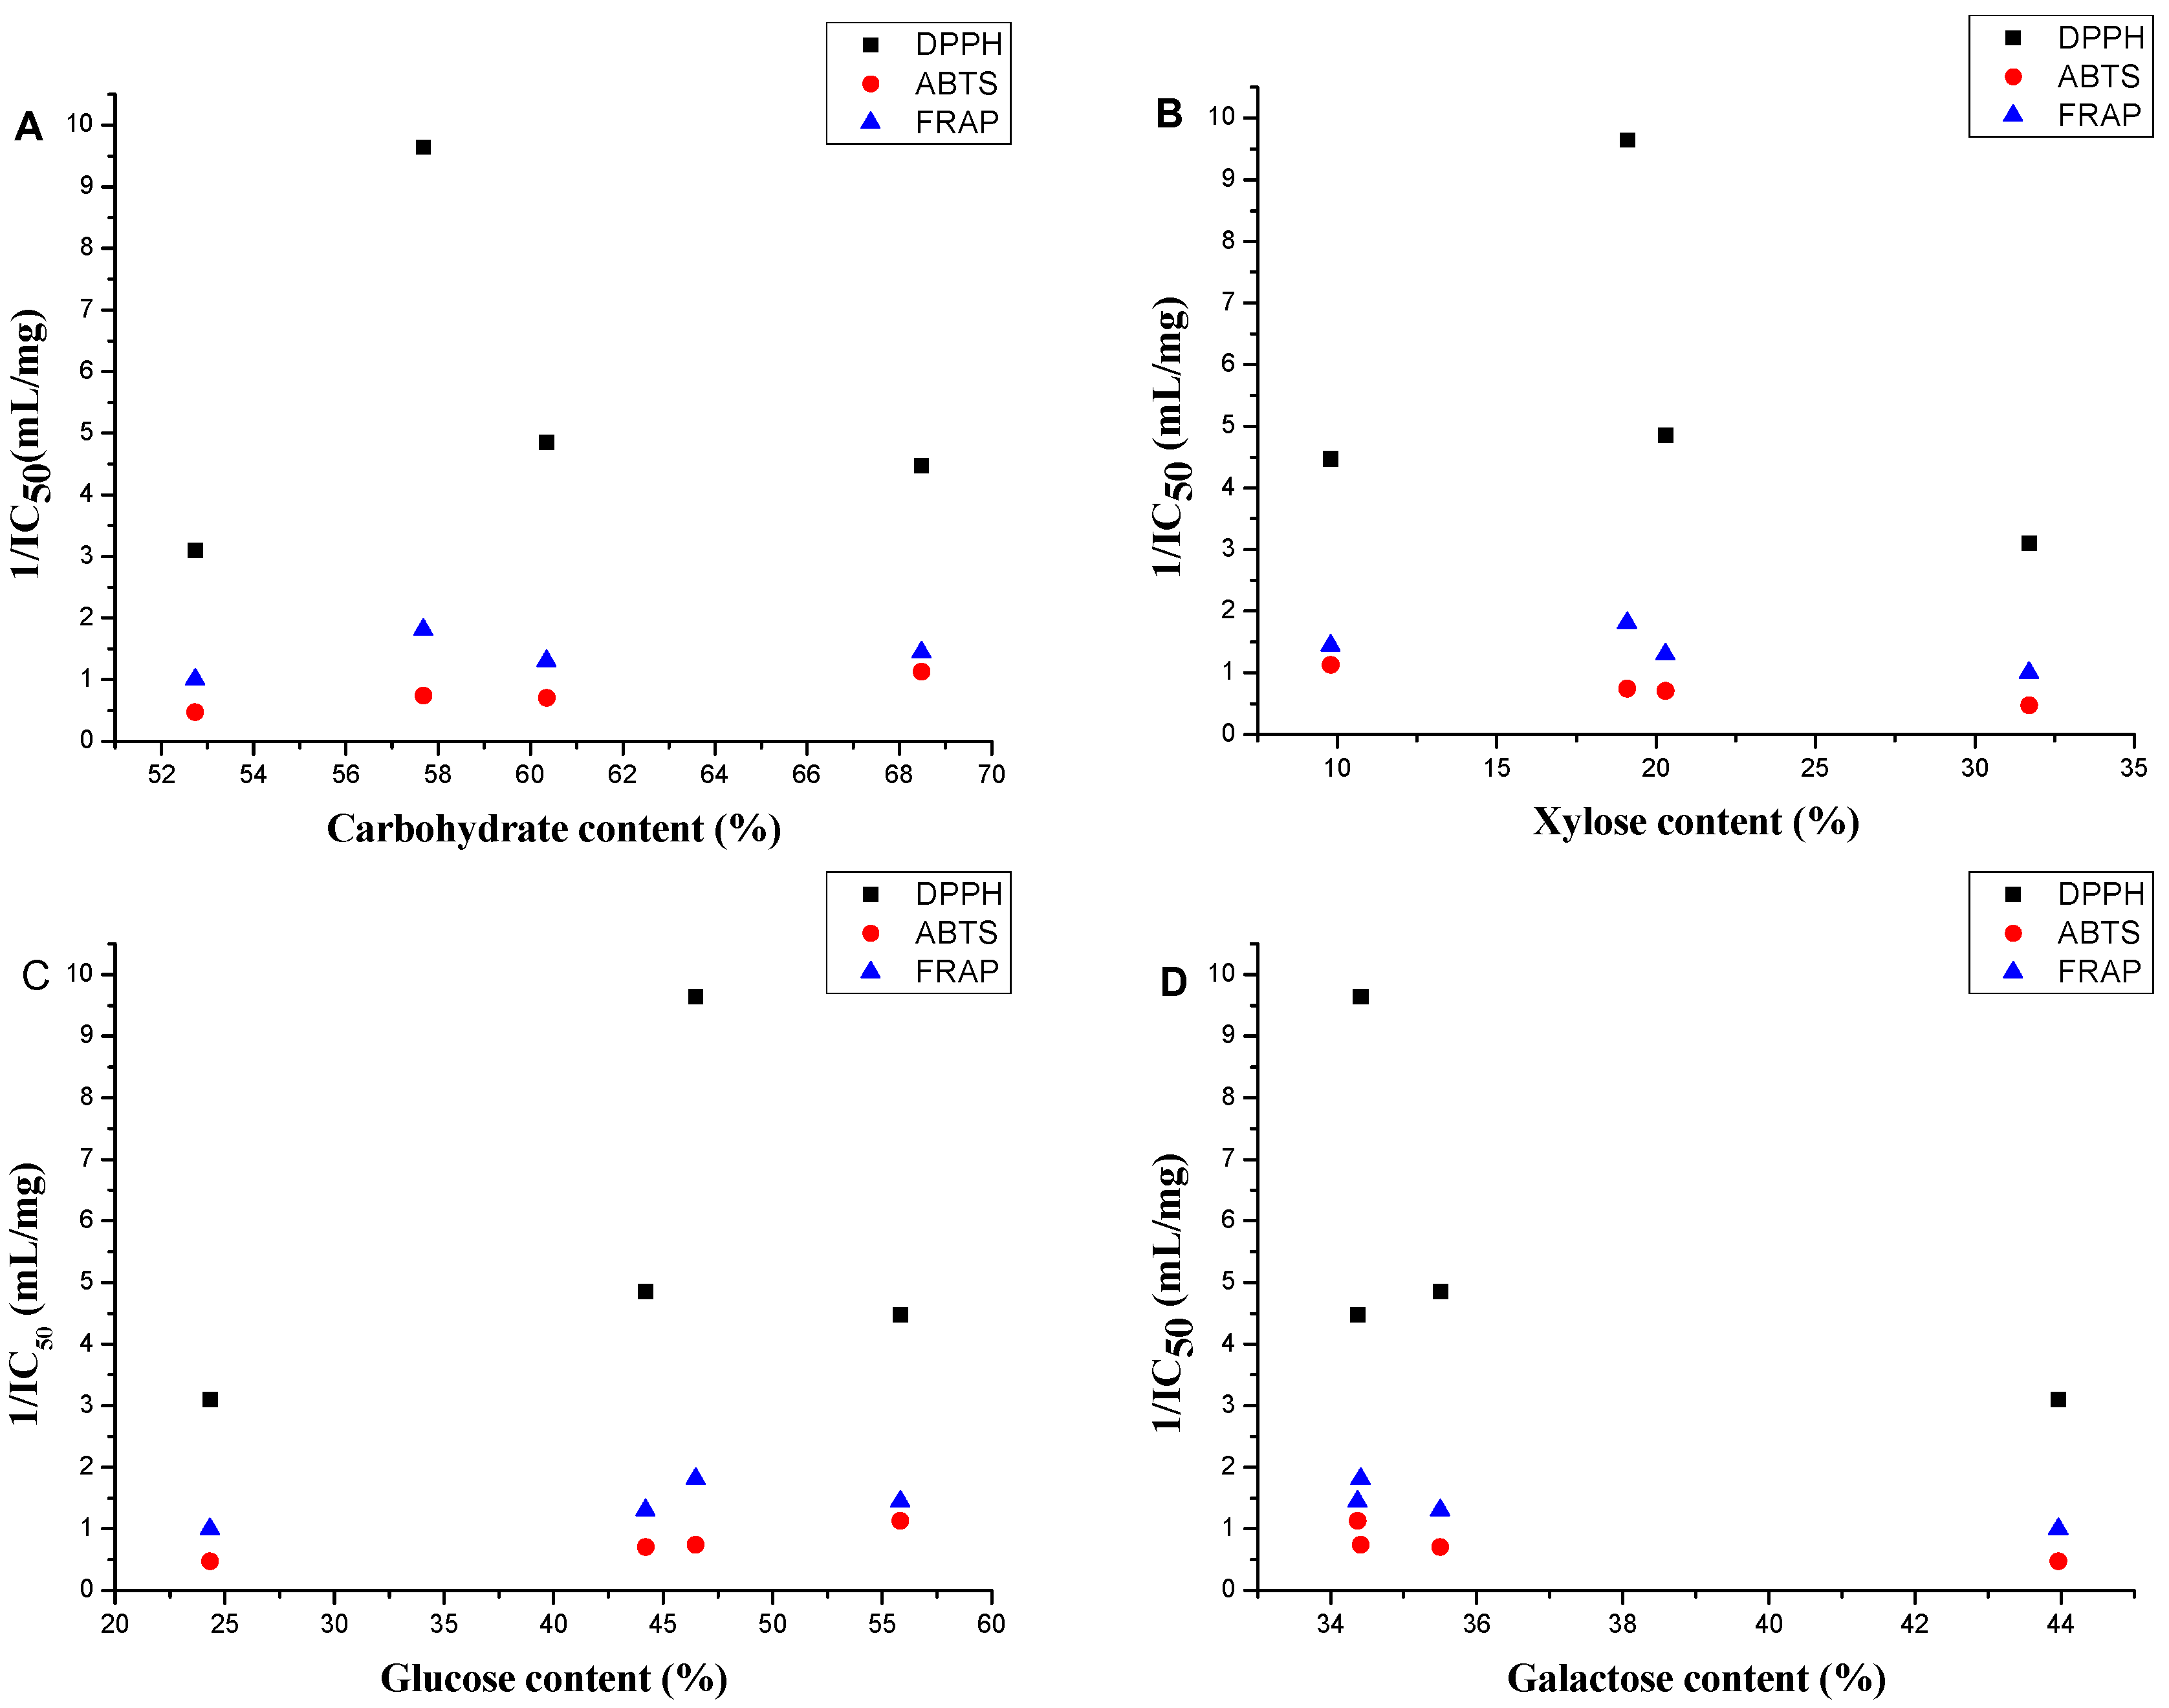
The scatter diagrams for the antioxidant activity 1/IC
50 values and the chemical compositions of the four polysaccharides are shown in
Figure 5 to show the relation between the antioxidant activity and the chemical composition. The polysaccharides with carbohydrate content over 58% had better antioxidant activities in the three models (
Figure 5A). This phenomenon can be explained by the fact that polysaccharides with higher numbers of hydroxyls have better antioxidant activity [
33]. Polysaccharides with higher corresponding molar percentage of glucose and lower corresponding molar percentage of xylose and galactose had better antioxidant abilities in the three models (
Figure 5B–D).
Figure 5.
Scatter diagram for the antioxidant 1/IC50 values and (A) carbohydrate content, (B) xylose percentage; (C) glucose percentage and (D) galactose percentage in four A. mellea polysaccharides.
Figure 5.
Scatter diagram for the antioxidant 1/IC50 values and (A) carbohydrate content, (B) xylose percentage; (C) glucose percentage and (D) galactose percentage in four A. mellea polysaccharides.
Correlation analysis was used to further analyzing the relationships between the chemical compositions and the antioxidant activities (IC
50 values) of the four polysaccharides. The correlation coefficients have been shown in
Table 5 and the linear regression equations have been shown in
Table 6.
Table 5.
Pearson correlation coefficients between carbohydrate content/monosaccharide percentage and antioxidant activities (IC50).
Table 5.
Pearson correlation coefficients between carbohydrate content/monosaccharide percentage and antioxidant activities (IC50).
| | DPPH | ABTS | FRAP |
|---|
| DPPH | 1.000 | 0.580 * | 0.931 ** |
| ABTS | 0.580 * | 1.000 | 0.799 ** |
| FRAP | 0.931 ** | 0.799 ** | 1.000 |
| Carbohydrate content | −0.671 *a | −0.915 ** | −0.667 *a |
| Xylose percentage | 0.682 * | 0.796 ** | 0.797 ** |
| Glucose percentage | −0.616 * | −0.993 ** | −0.803 ** |
| Galactose percentage | 0.830 ** | 0.844 ** | 0.883 ** |
Table 6.
The linear regression equations of the relation between carbohydrate content/monosaccharide percentage (X) and antioxidant activities (Y).
Table 6.
The linear regression equations of the relation between carbohydrate content/monosaccharide percentage (X) and antioxidant activities (Y).
| | | DPPH | ABTS | FRAP |
|---|
| | |
|---|
| Carbohydrate content | Y = −1.076ln(X) + 4.560 a | Y = −3.922ln(X) + 17.50 | Y = −2.156ln(X) + 9.480 a |
| Xylose percentage | Y = 0.006X + 0.090 | Y = 0.039X + 0.696 | Y = 0.015X + 0.461 |
| Glucose percentage | Y = −0.04X + 0.396 | Y = −0.036X + 3.008 | Y = −0.011X + 1.230 |
| Galactose percentage | Y = 0.017X − 0.426 | Y = 0.093X − 1.967 | Y = 0.037X − 0.616 |
Significant correlations between DPPH, ABTS and FRAP were observed (
p < 0.05,
p < 0.01) indicating that these three assays showed consistent results for the polysaccharides of four
A. mellea samples [
34]. Carbohydrate content showed significant correlation with antioxidant activities in the ABTS radical assay (
p < 0.01), whereas it did not show good correlation with antioxidant activities in the DPPH radical assay (r = −0.257) and FRAP assay (r = −0.499). With the exception of SP, a strong correlation was found between carbohydrate content and the antioxidant activities (
p < 0.05) in DPPH radical assay and FRAP assay. The xylose percentages, the glucose percentages and the galactose percentages of four polysaccharides also showed strong correlation with antioxidant activities in three antioxidant activity evaluation methods (
p < 0.05). These results indicated that the carbohydrate content and the corresponding glucose percentage had a positive influence on the activity, whereas the influence of the corresponding xylose and galactose percentages were negative.


