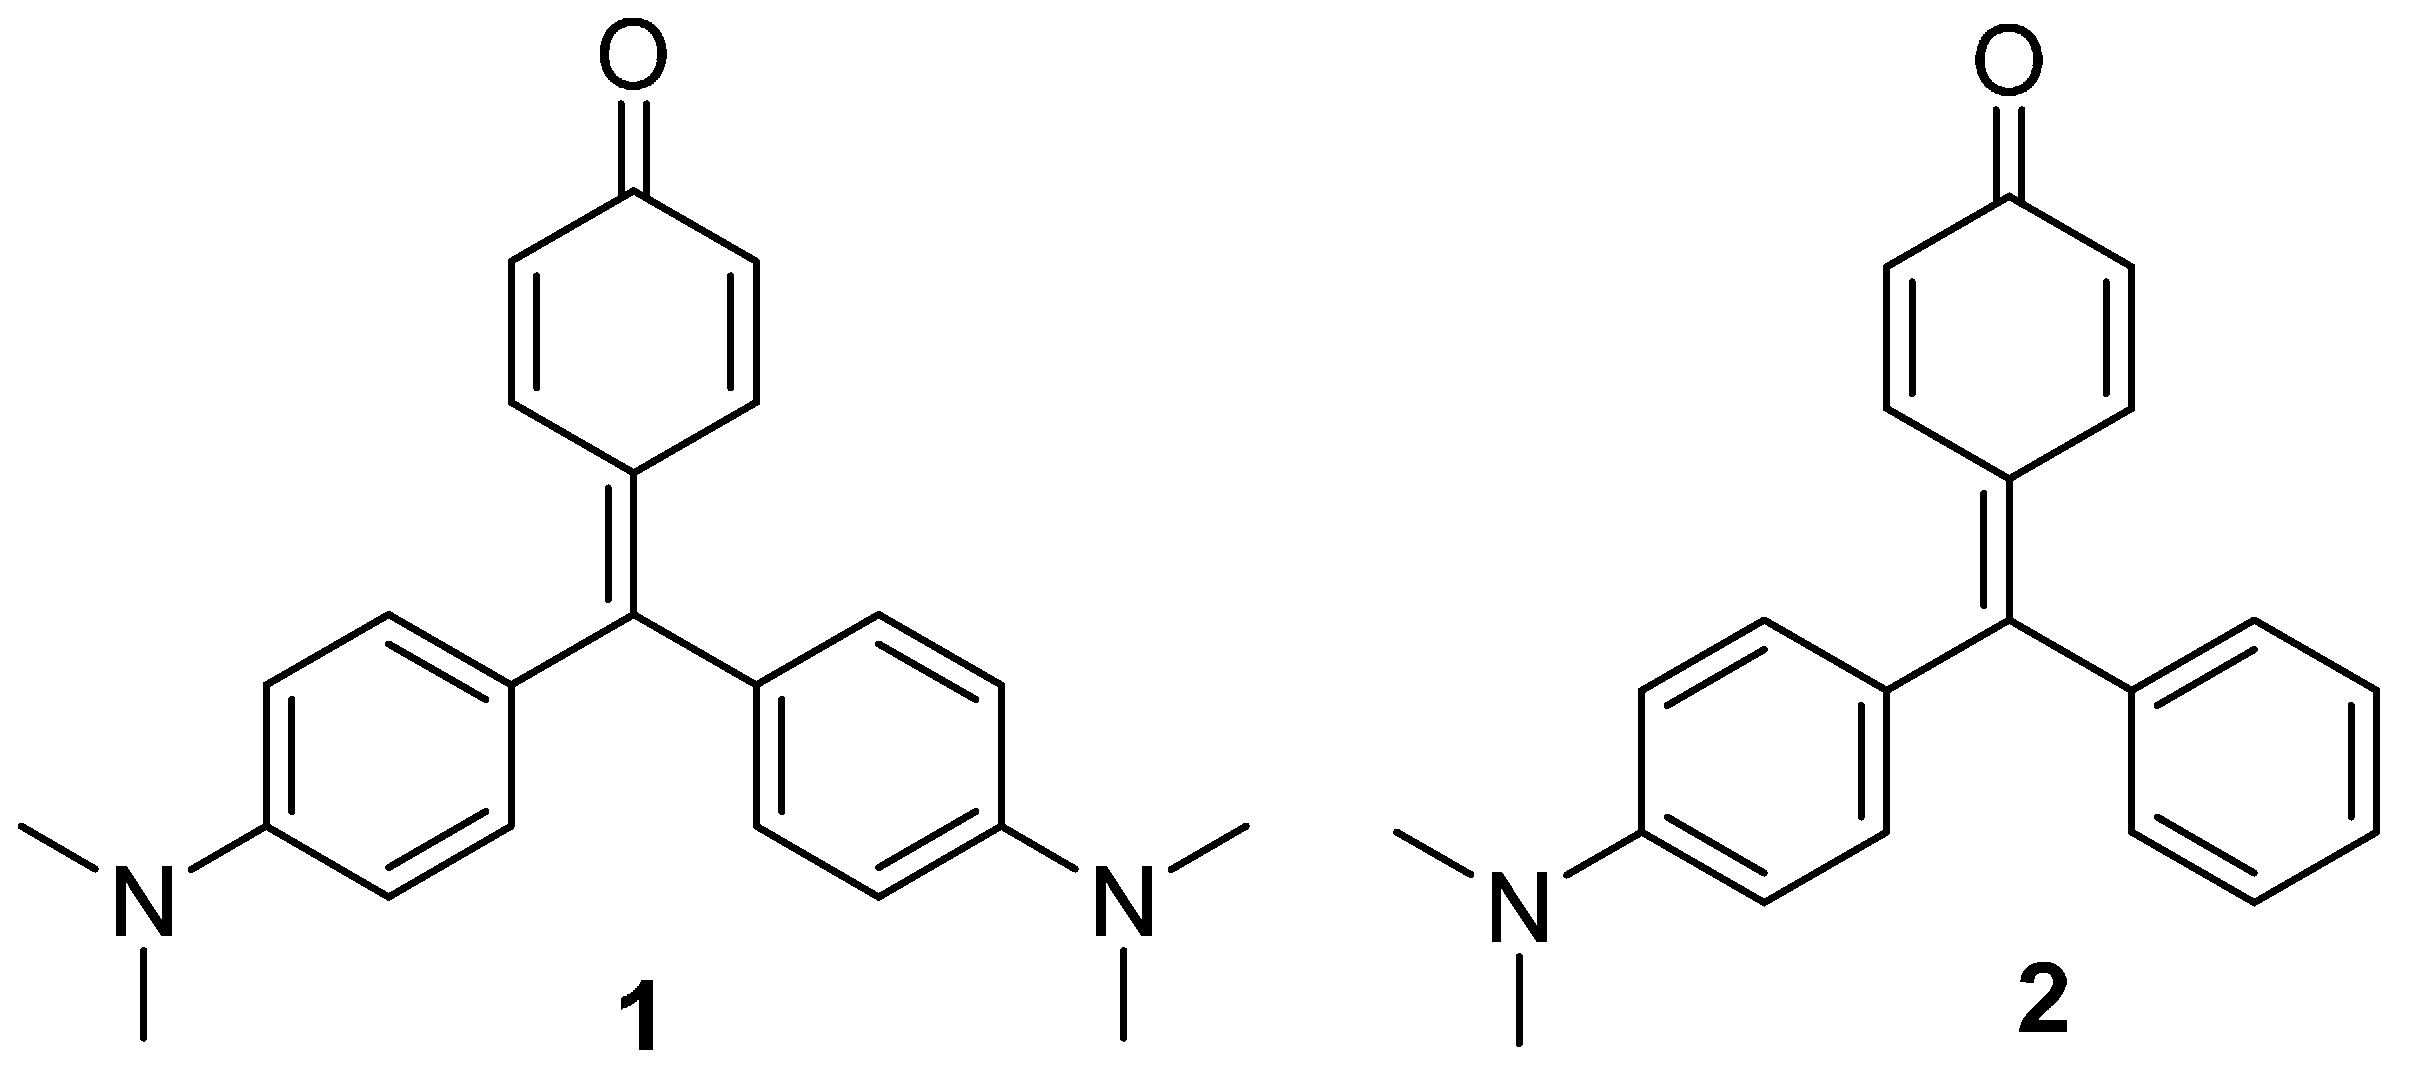
2.1. Synthesis and X-ray Diffraction Studies
Compounds
1 and
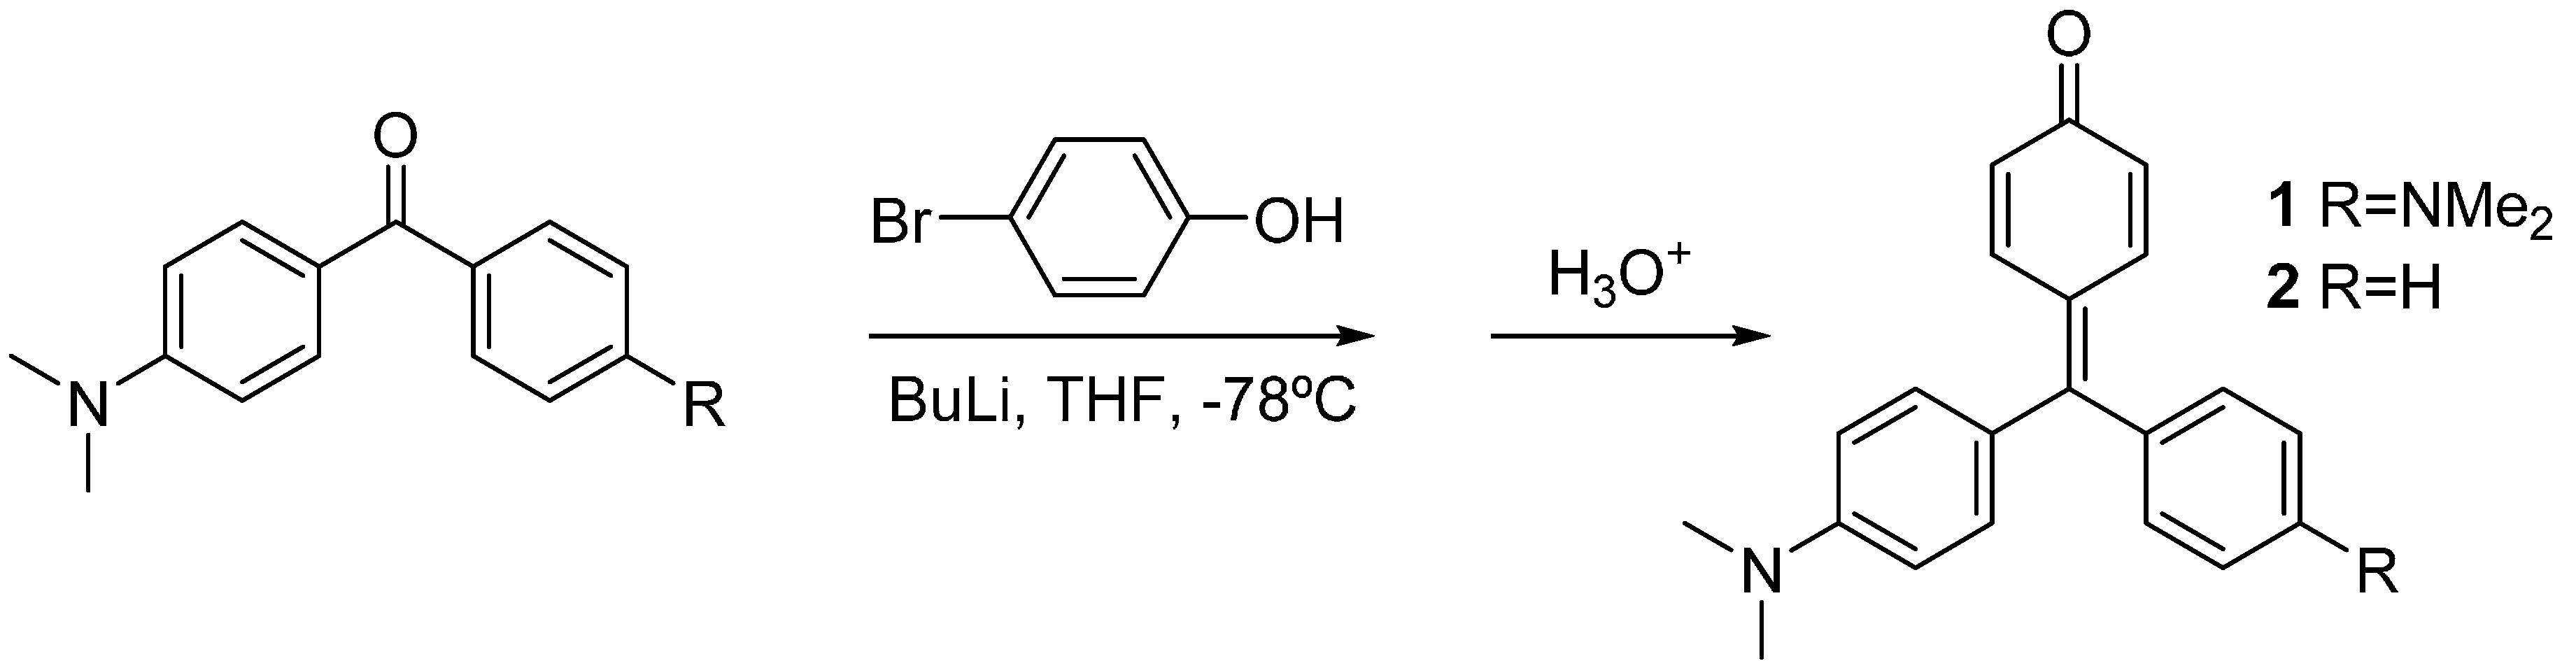
2 were synthesized by lithiation of 4-bromophenol with two equivalents of butyl lithium, and subsequent addition of the Michler’s ketone or 4-dimethylamino benzophenone, respectively. Acidic work-up was used to force dehydration of the carbinols to yield the corresponding dyes [
8] (
Scheme 1).
Scheme 1.
Synthesis of compounds 1 and 2.
Scheme 1.
Synthesis of compounds 1 and 2.
Single crystals of compounds
1 and
2 suitable for X-ray diffraction were obtained by slow evaporation of trichloromethane and ethyl acetate solutions, respectively. There are eight symmetry-independent molecules in the orthorhombic unit cell of compound
1 with Pbca as space group. In the case of compound
2, the unit cell was monoclicic P2
1/c with four molecules in the unit cell. Selected geometric characteristics are present in
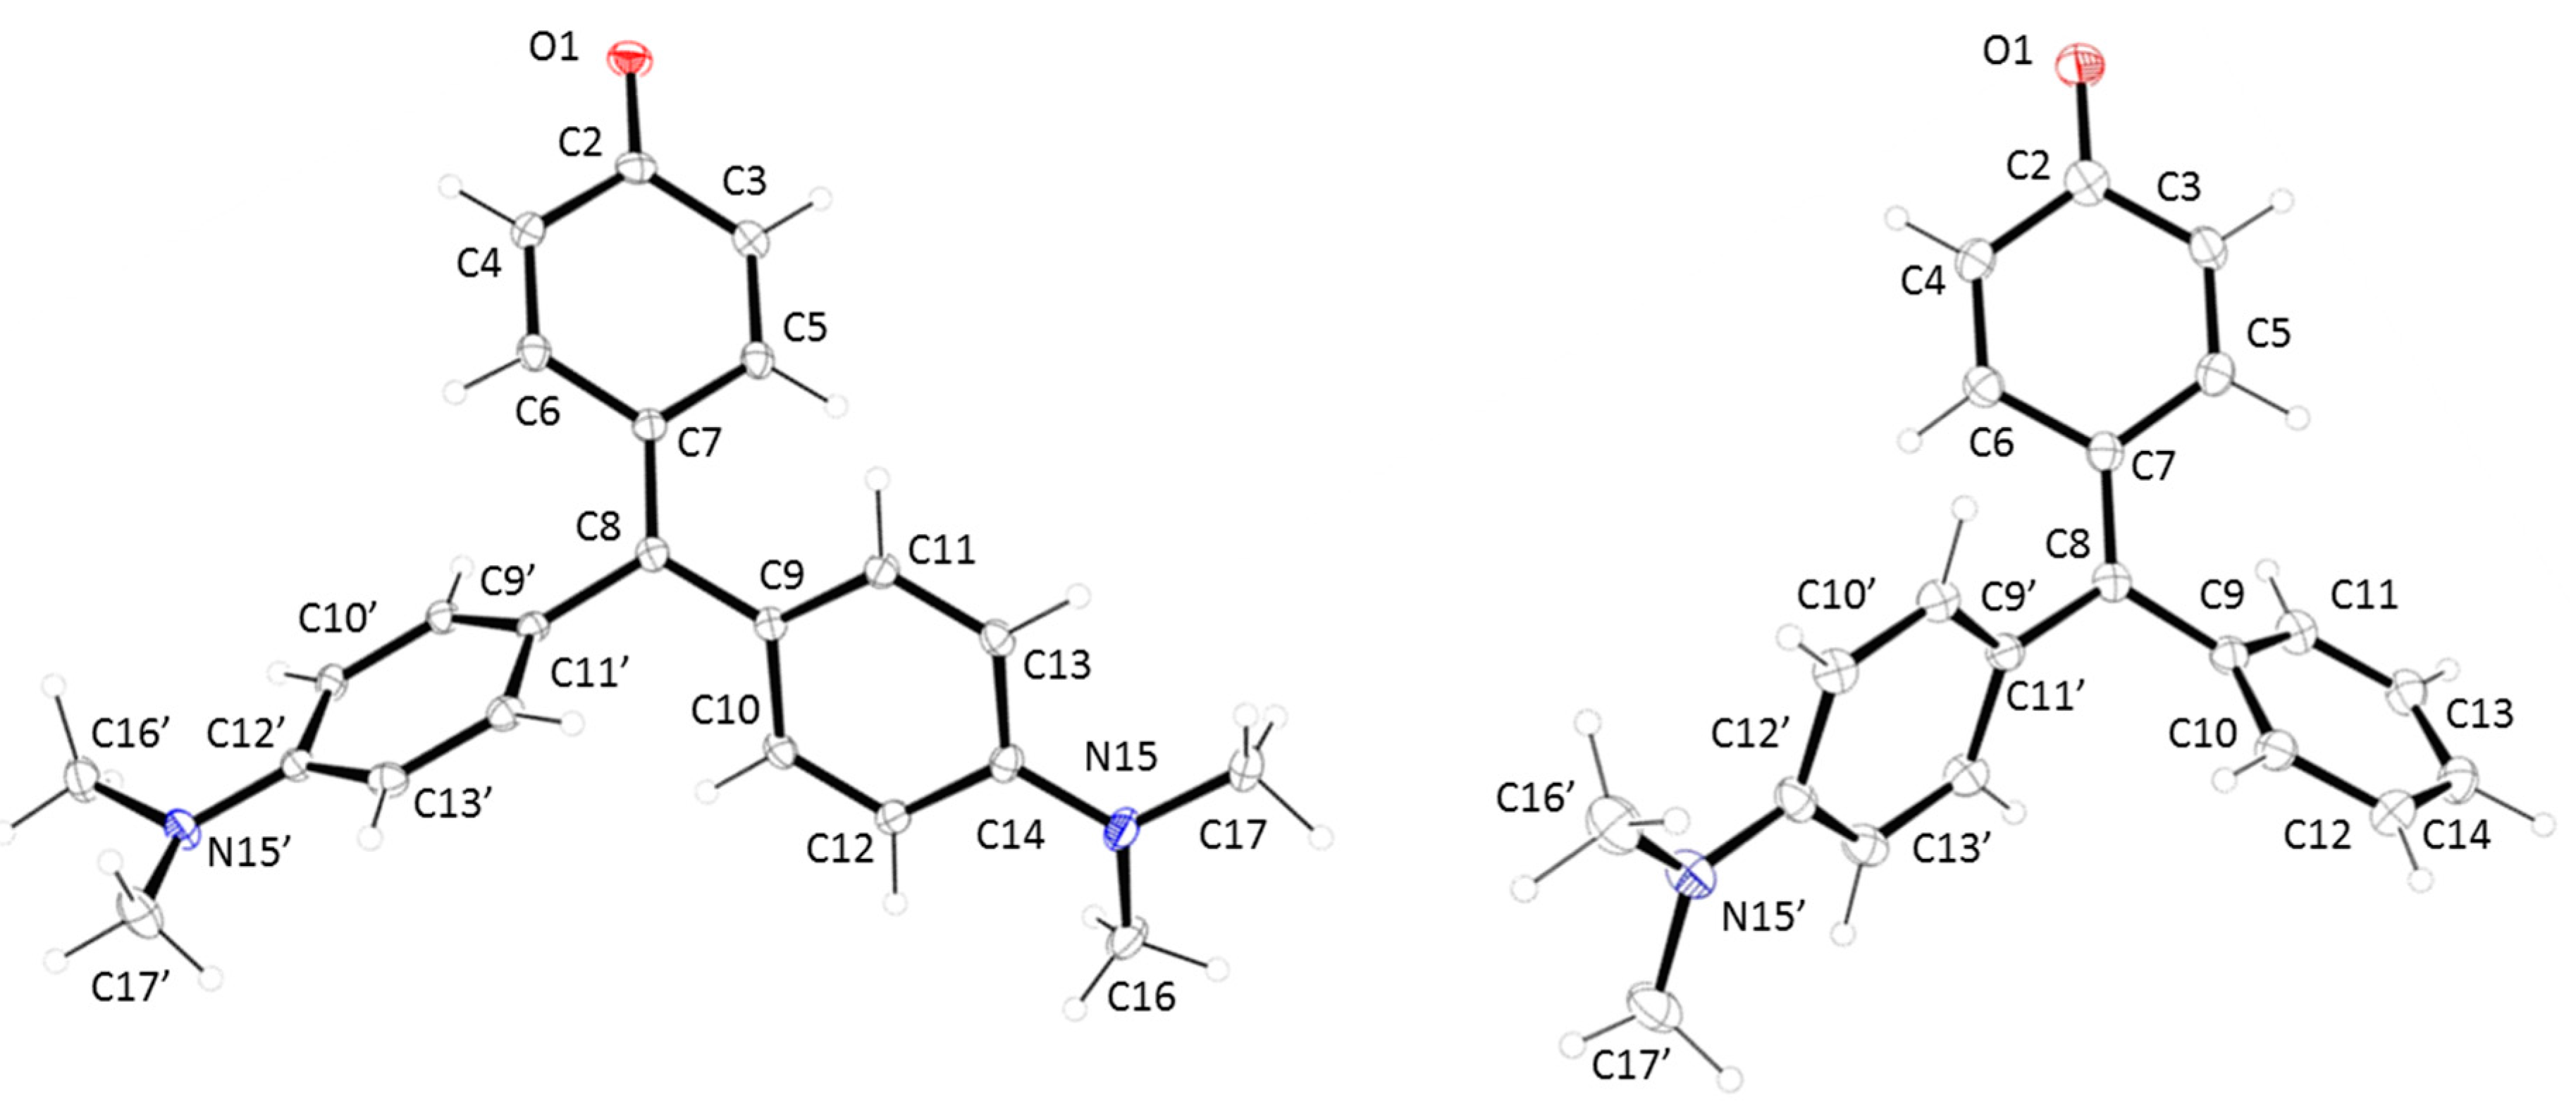
Table 1. Both structures are very similar (see
Figure 1), with a clear double bond character in the O(1)-C(2) bond (1.248(3) and 1.249(3) Å for
1 and
2, respectively). These data indicate that both compounds have a strong
para-quinone methide structure (
Chart 1). This suggestion is corroborated by the short distance of the C(7)-C(8) bond (1.396(3) and 1.381(4) Å for
1 and
2, respectively). In the same sense, the quinone ring shows the expected values for the simple and double bonds in this type of compounds. The hybridation of C(8) is sp
2 with bond angles of C(7)-C(8)-C(9), C(7)-C(8)-C(9′) and C(9)-C(8)-C(9′) of 123.25(19)°, 120.0(2)° and 116.71(19)° for compound
1 and 121.4(3)°, 121.7(3)° and 116.8(3)° for compound
2. On the other hand, a clear contribution of the lone electron pair of the nitrogen atoms in the conjugation system is present, being the ArC-N bond distances similar to these showed by aromatic amines with a planar distribution of the dimethylamine group (see
Table 2).
Figure 1.
X-ray structures for (left) compound 1 and (right) compound 2.
Figure 1.
X-ray structures for (left) compound 1 and (right) compound 2.
Table 1.
Selected atomic bond distances and angles for compounds 1 and 2.
Table 1.
Selected atomic bond distances and angles for compounds 1 and 2.
| Atomic Bond Distances (Å) | 1 | 2 | Angles (°) | 1 | 2 |
|---|
| O1-C2 | 1.248(3) | 1.249(3) | C8-C7-C5 | 123.1(2) | 123.4(3) |
| C2-C4 | 1.445(3) | 1.446(4) | C8-C7-C6 | 121.4(2) | 121.3(3) |
| C2-C3 | 1.451(3) | 1.451(4) | C7-C8-C9 | 123.25(19) | 121.4(3) |
| C3-C5 | 1.384(3) | 1.342(4) | C7-C8-C9′ | 120.0(2) | 121.7(3) |
| C4-C6 | 1.340(3) | 1.346(4) | C9-C8-C9′ | 116.71(19) | 116.8(3) |
| C5-C7 | 1.440(3) | 1.440(4) | | | |
| C6-C7 | 1.441(3) | 1.452(4) | | | |
| C7-C8 | 1.396(3) | 1.381(4) | | | |
| C8-C9 | 1.454(3) | 1.482(4) | | | |
| C8-C9′ | 1.469(3) | 1.466(4) | | | |
Table 2.
Torsion angles, atomic bond distances and angles for the dimethylamino group in compounds 1 and 2.
Table 2.
Torsion angles, atomic bond distances and angles for the dimethylamino group in compounds 1 and 2.
| | Angles (°) | Atomic Bond Distances (Å) | Torsion Angles (°) |
|---|
| | C14′-N15′-C16′ | C14′-N15′-C17′ | C16′-N15′-C17′ | C14′-N15′ | C12′-C14′-N15′-C16′ | C13′-C14′-N15′-C17′ |
| 1 | 118.6(2) | 119.8(2) | 116.7(2) | 1.373(2) | −21.3(3) | 5.1(3) |
| 2 | 120.6(3) | 121.6(3) | 117.7(3) | 1.372(4) | −1.5(5) | 2.8(5) |
| | C14-N15-C16 | C14-N15-C17 | C16-N15-C17 | C14-N15 | C12-C14-N15-C16 | C13-C14-N15-C17 |
| 1 | 118.6(2) | 121.5(2) | 116.1(2) | 1.380(3) | 13.9(4) | −9.6(4) |
In addition, helical rotations are present in the aromatic rings, for both compounds
1 and
2, which are responsible of the non-planarity in the molecules. Analysing the values of the dihedral angles on the three aromatic rings, it is possible to confirm a propeller like conformation (
Table 3) with one ring twisted in the opposite sense to the other two. The torsion angles are lower in the
p-quinone methide ring (around 20°) than in the phenyl and dimethylaniline rings (around 40°).
Table 3.
Torsion angles for aromatic rings.
Table 3.
Torsion angles for aromatic rings.
| | Torsion Angles (°) | | |
|---|
| | C6-C7-C8-C9′ | C7-C8-C9-C11 | C7-C8-C9′-C11′ |
| 1 | 18.1(3) | 35.8(3) | −134.6(2) |
| 2 | −20.4(5) | −40.5(5) | 139.2(3) |
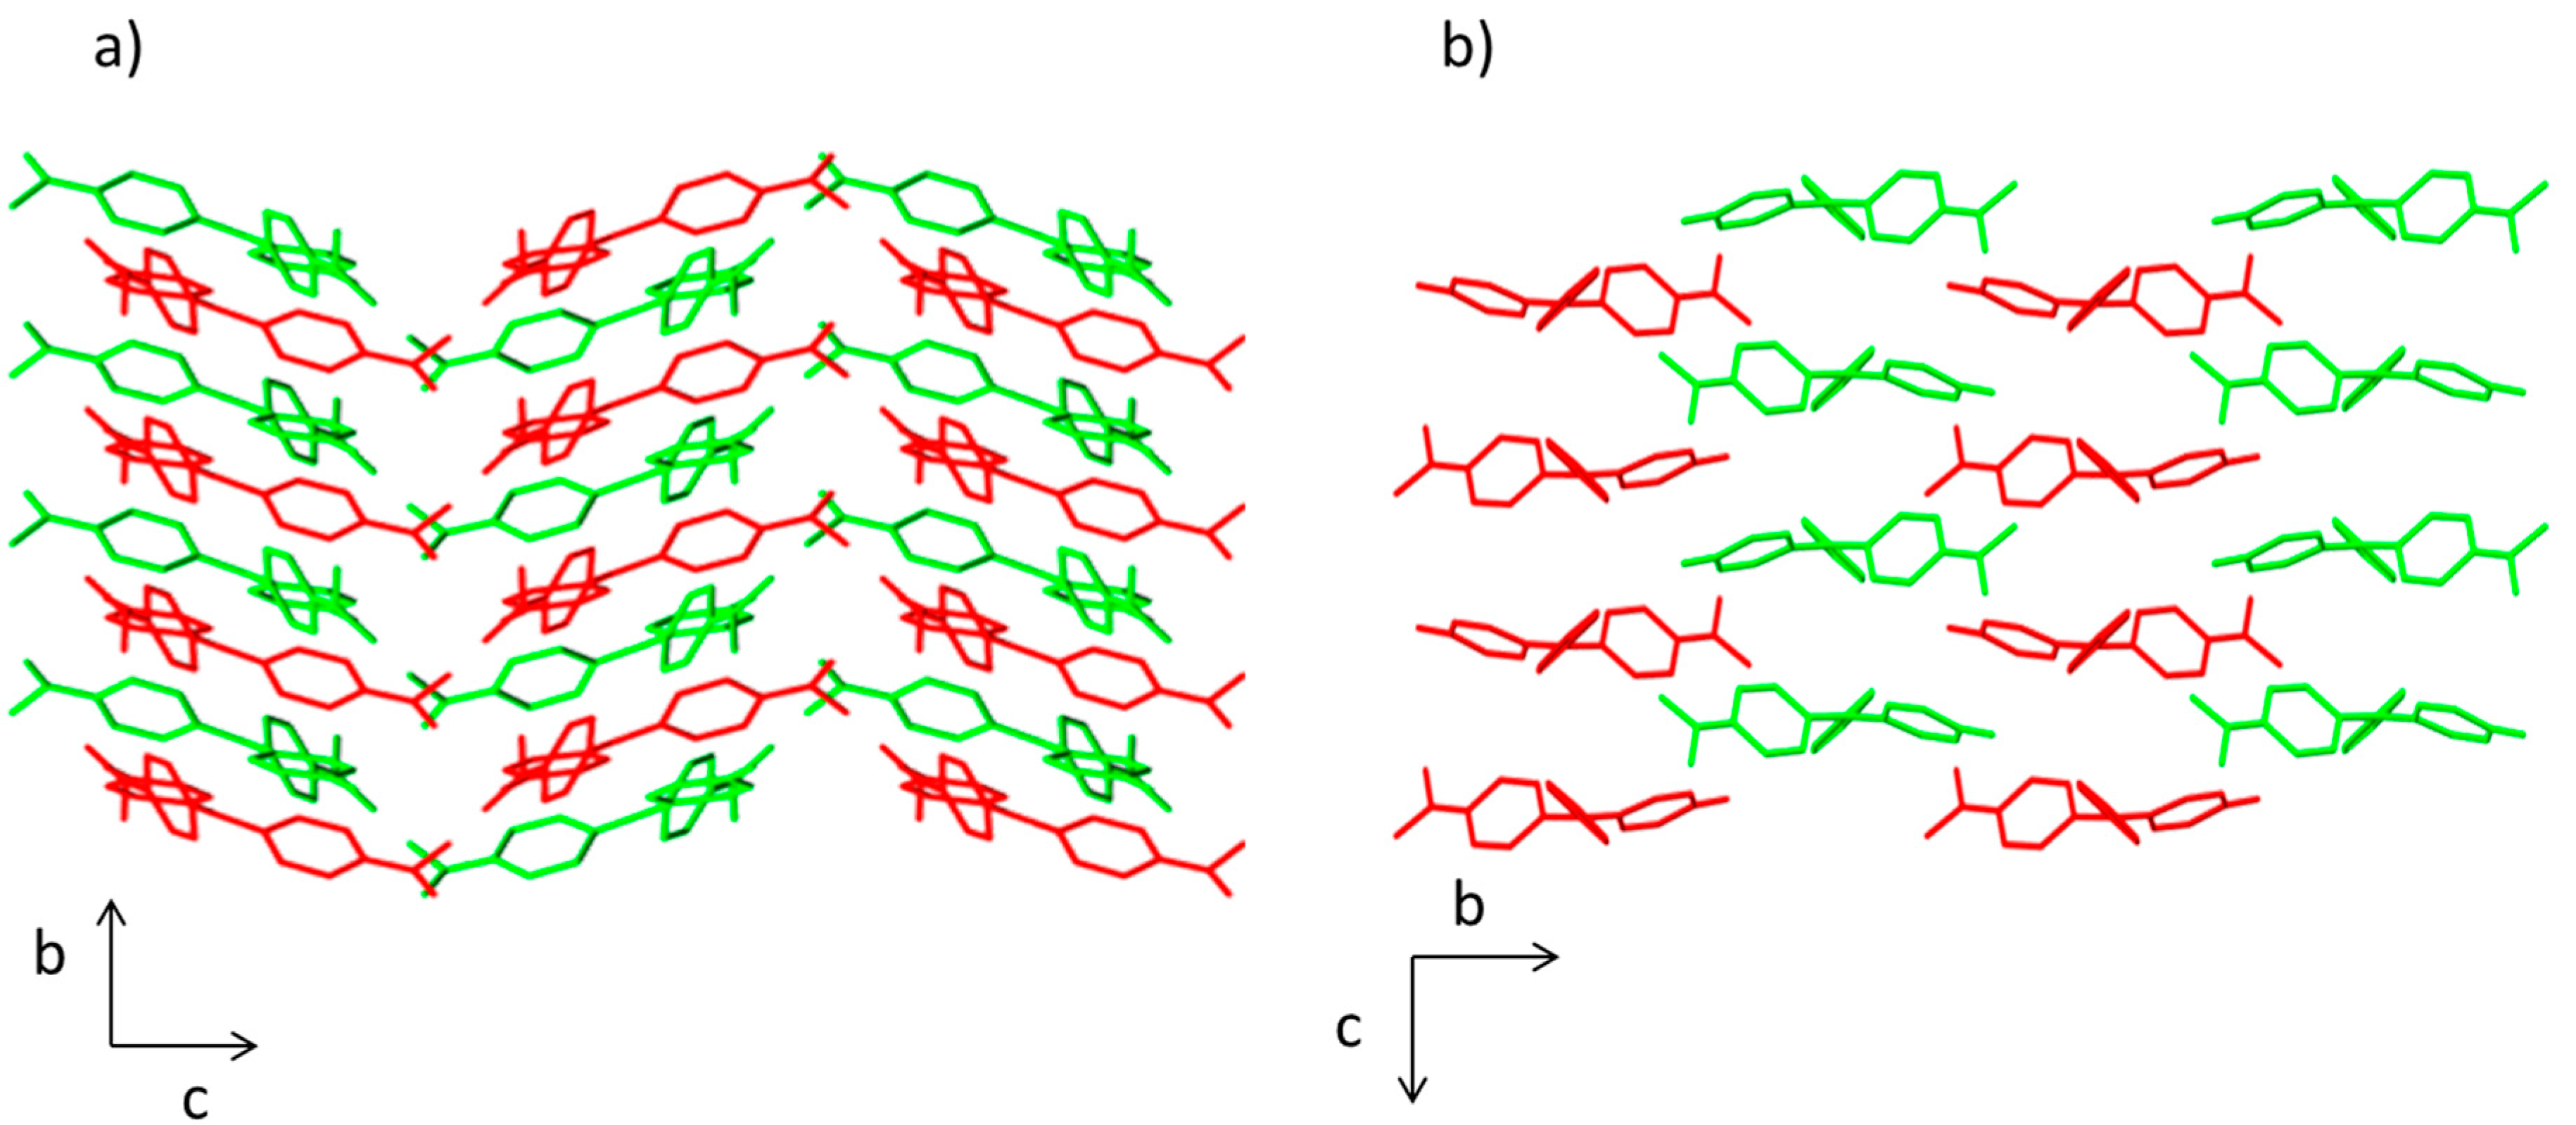
The crystal packing in compounds
1 and
2 is different. In both structures, there is an ABABA three-dimensional disposition. However, a herringbone pattern is present in the compound
1, whereas brickwork motif is observed in compound
2 (
Figure 2). This effect influences the molecular volume being higher for compound
1 (457.63 Å
3) than for compound
2 (401.23 Å
3).
Figure 2.
View of the packing diagram along a axis for (a) compound 1 and (b) compound 2. Hydrogen atoms have been omitted for clarity.
Figure 2.
View of the packing diagram along a axis for (a) compound 1 and (b) compound 2. Hydrogen atoms have been omitted for clarity.
2.2. Solvatochromic Studies
The UV-VIS spectra of 1·10
−5 M solutions of compounds
1 and
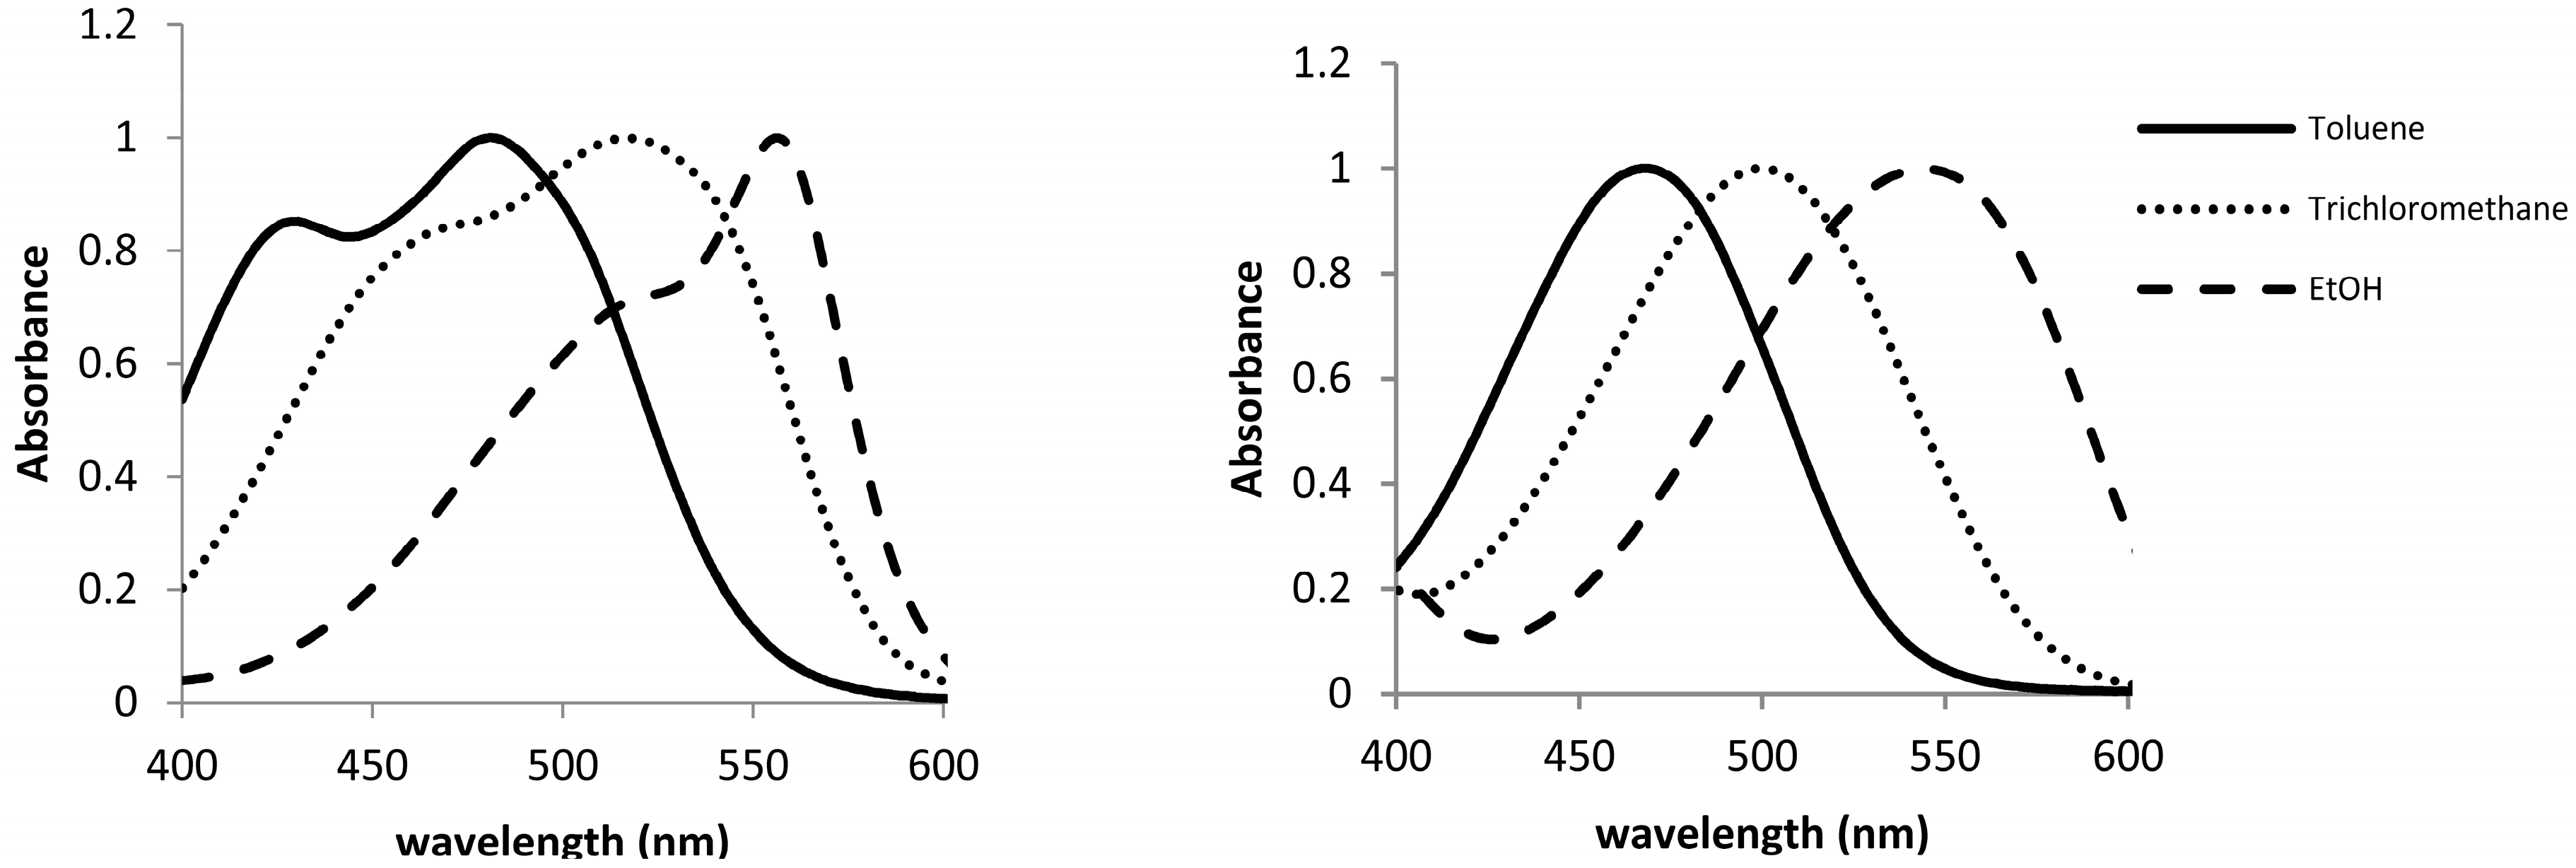
2 in different solvents were registered at room temperature, in order to study their solvatochromic behavior. As can be seen in
Figure 3, the UV-VIS spectra of both compounds show different pattern in toluene. Thus, whereas compound
1 presents a main absorption band at 485 nm with a marked shoulder at 430 nm, compound
2 shows only a band at 470 nm. This behavior is similar to the classical one described in the pioneer publication of Lewis [
13] for crystal violet (tris(
p-dimethylaminophenyl)methylium ion,
CV) and malachite green (phenyl bis(
p-dimethylaminophenyl)methylium ion,
MG) which in some solvents show either two or one absorption bands, respectively.
Figure 3.
Normalized UV-VIS spectra of 1·10−5 mol·L−1 solutions of 1 (left) and 2 (right) in toluene, CHCl3, and EtOH.
Figure 3.
Normalized UV-VIS spectra of 1·10−5 mol·L−1 solutions of 1 (left) and 2 (right) in toluene, CHCl3, and EtOH.
Since Lewis’s publication suggesting the existence of two isomers in
CV solutions, a large number of explanations for the shoulder observed in the absorption spectrum of
CV have been proposed [
14], being one of the most accepted that the two bands arise from ground-state absorptions into two neighboring excited states [
15]. However, the possibility of an equilibrium between two ground states has also been suggested [
16,
17,
18,
19]. On the other hand, it has been also argued that counter anions interacting with the dimethylamino groups of
CV could be responsible for the changes in the UV-VIS spectra [
20]. In our case, as
1 and
2 are neutral compounds no effect of counter anion can be observed and thus the presence of two bands in the UV-visible spectrum of
1 has to be related to the existence of an equilibrium between two ground states or the split of the excited state into two neighboring electronic levels.
When UV-VIS spectra of both compounds (1·10
−5 mol·L
−1) in different solvents were registered, the observed tendency for compound
1 was similar to that described for
CV [
21,
22]
i.e., a bathochromic shift of the overlapped absorption bands on increasing the solvent polarity. Thus, as shown in
Figure 3, on changing the solvent from toluene to trichloromethane and ethanol (for the other solvents, see
Supplementary Material), a red shift in the wavelengths of maximum absorption bands of compound
1 was observed. This shift was larger for the short-wavelength side of the absorption envelope, diminishing the magnitude of the splitting between the overlapped absorption bands. This fact gives rise to a small resolution in the spectra for the alcoholic solvents and even to a unique band in the case of water. As it was expected, compound
2, which can be related with
MG, only shows a band in the UV-spectra, which also experiments with a bathochromic shift on increasing the polarity of the solvent.
Taking into account these results, a more complete study of the solvatochromic properties of compounds
1 and
2 was carried out using 23 solvents with different properties (see
Table 4).
The interactions of a solute with solvent molecules can be classified into nonspecific, such as polarity effects, or specific, such as hydrogen bonding. The α and β scales are used to describe the ability of a hydrogen-bond donor (HBD) solvent to donate a proton to the solute or that of a hydrogen-bond acceptor (HBA) solvent to accept a proton from the solute, respectively [
23,
24]. On the other hand, the solvent polarity scale
ET(30) of Reichardt [
25] and the solvent dipolarity/polarizability scale π* of Kamlet
et al. [
23,
24] are widely used as nonspecific solvatochromic polarity scales, and also as parameters of linear solvation energy relationships.
Table 4.
Solvatochromic parameters π*, β and α [
23,
24]
ET(30) [
25] of studied solvents, and λ
max (nm) and
ET (kcal·mol
−1) of compounds
1 and
2.
Table 4.
Solvatochromic parameters π*, β and α [23,24] ET(30) [25] of studied solvents, and λmax (nm) and ET (kcal·mol−1) of compounds 1 and 2.
| Solvent | Type of Solvent | ET(30) | π* | β | α | λmax(1) | λmax(2) | ET(1) | ET(2) |
|---|
| Toluene | NHB-weak HBA | 33.9 | 0.54 | 0.11 | 0.0 | 480.5 | 467 | 59.50 | 61.22 |
| Benzene | NHB-weak HBA | 34.3 | 0.59 | 0.10 | 0.0 | 483 | 469.5 | 59.20 | 60.90 |
| Diethylether | HBA | 34.5 | 0.27 | 0.47 | 0.0 | 475 | 456.5 | 60.19 | 62.63 |
| Bromobenzene | NHB-weak HBA | 36.6 | 0.79 | 0.06 | 0.0 | 504 | 488.5 | 56.73 | 58.53 |
| Chlorobenzene | NHB-weak HBA | 36.8 | 0.71 | 0.07 | 0.0 | 503 | 484.5 | 56.84 | 59.01 |
| THF | HBA | 37.4 | 0.58 | 0.55 | 0.0 | 487.5 | 474.5 | 58.65 | 60.26 |
| Ethyl acetate | HBA | 38.1 | 0.55 | 0.45 | 0.0 | 482.5 | 471 | 59.26 | 60.70 |
| Methyl acetate | HBA | 38.9 | 0.60 | 0.42 | 0.0 | 490 | 474.5 | 58.35 | 60.26 |
| Trichloromethane | weak HBD | 39.1 | 0.58 | 0.0 | 0.44 | 515 | 498.5 | 55.52 | 57.35 |
| Pyridine | HBA | 40.5 | 0.87 | 0.64 | 0.0 | 512.5 | 499 | 55.79 | 57.30 |
| Dichloromethane | NHB | 40.7 | 0.82 | 0.0 | 0.30 | 510.5 | 494 | 56.01 | 57.88 |
| 2-Butanone | HBA | 41.3 | 0.67 | 0.48 | 0.0 | 503.5 | 483 | 56.79 | 59.20 |
| Acetone | HBA | 42.2 | 0.71 | 0.48 | 0.0 | 501 | 487 | 57.07 | 58.71 |
| N,N-Dimethylacetamide | HBA | 42.9 | 0.88 | 0.76 | 0.0 | 510 | 497.5 | 56.06 | 57.47 |
| DMF | HBA | 43.2 | 0.88 | 0.69 | 0.0 | 514 | 500.5 | 55.62 | 57.13 |
| 2-Methylpropan-2-ol | HBA-D | 43.3 | 0.41 | 1.01 | 0.68 | 541 | 507.5 | 52.85 | 56.34 |
| DMSO | HBA | 45.1 | 1.00 | 0.76 | 0.0 | 525 | 510.5 | 54.46 | 56.06 |
| Acetonitrile | weak HBA | 45.6 | 0.75 | 0.31 | 0.19 | 507.5 | 491.5 | 56.34 | 58.17 |
| 1-Butanol | HBA-D | 49.7 | 0.47 | 0.88 | 0.79 | 555.5 | 537 | 51.47 | 53.24 |
| 1-Propanol | HBA-D | 50.7 | 0.52 | 0.78 | 0.78 | 555.5 | 534.5 | 51.47 | 53.49 |
| Ethanol | HBA-D | 51.9 | 0.54 | 0.77 | 0.83 | 556 | 543 | 51.42 | 52.65 |
| Methanol | HBA-D | 55.4 | 0.60 | 0.62 | 0.93 | 555 | 552 | 51.52 | 51.80 |
| H2O | HBA-D | 63.1 | 1.09 | 0.18 | 1.17 | 572 | 581 | 49.98 | 49.21 |
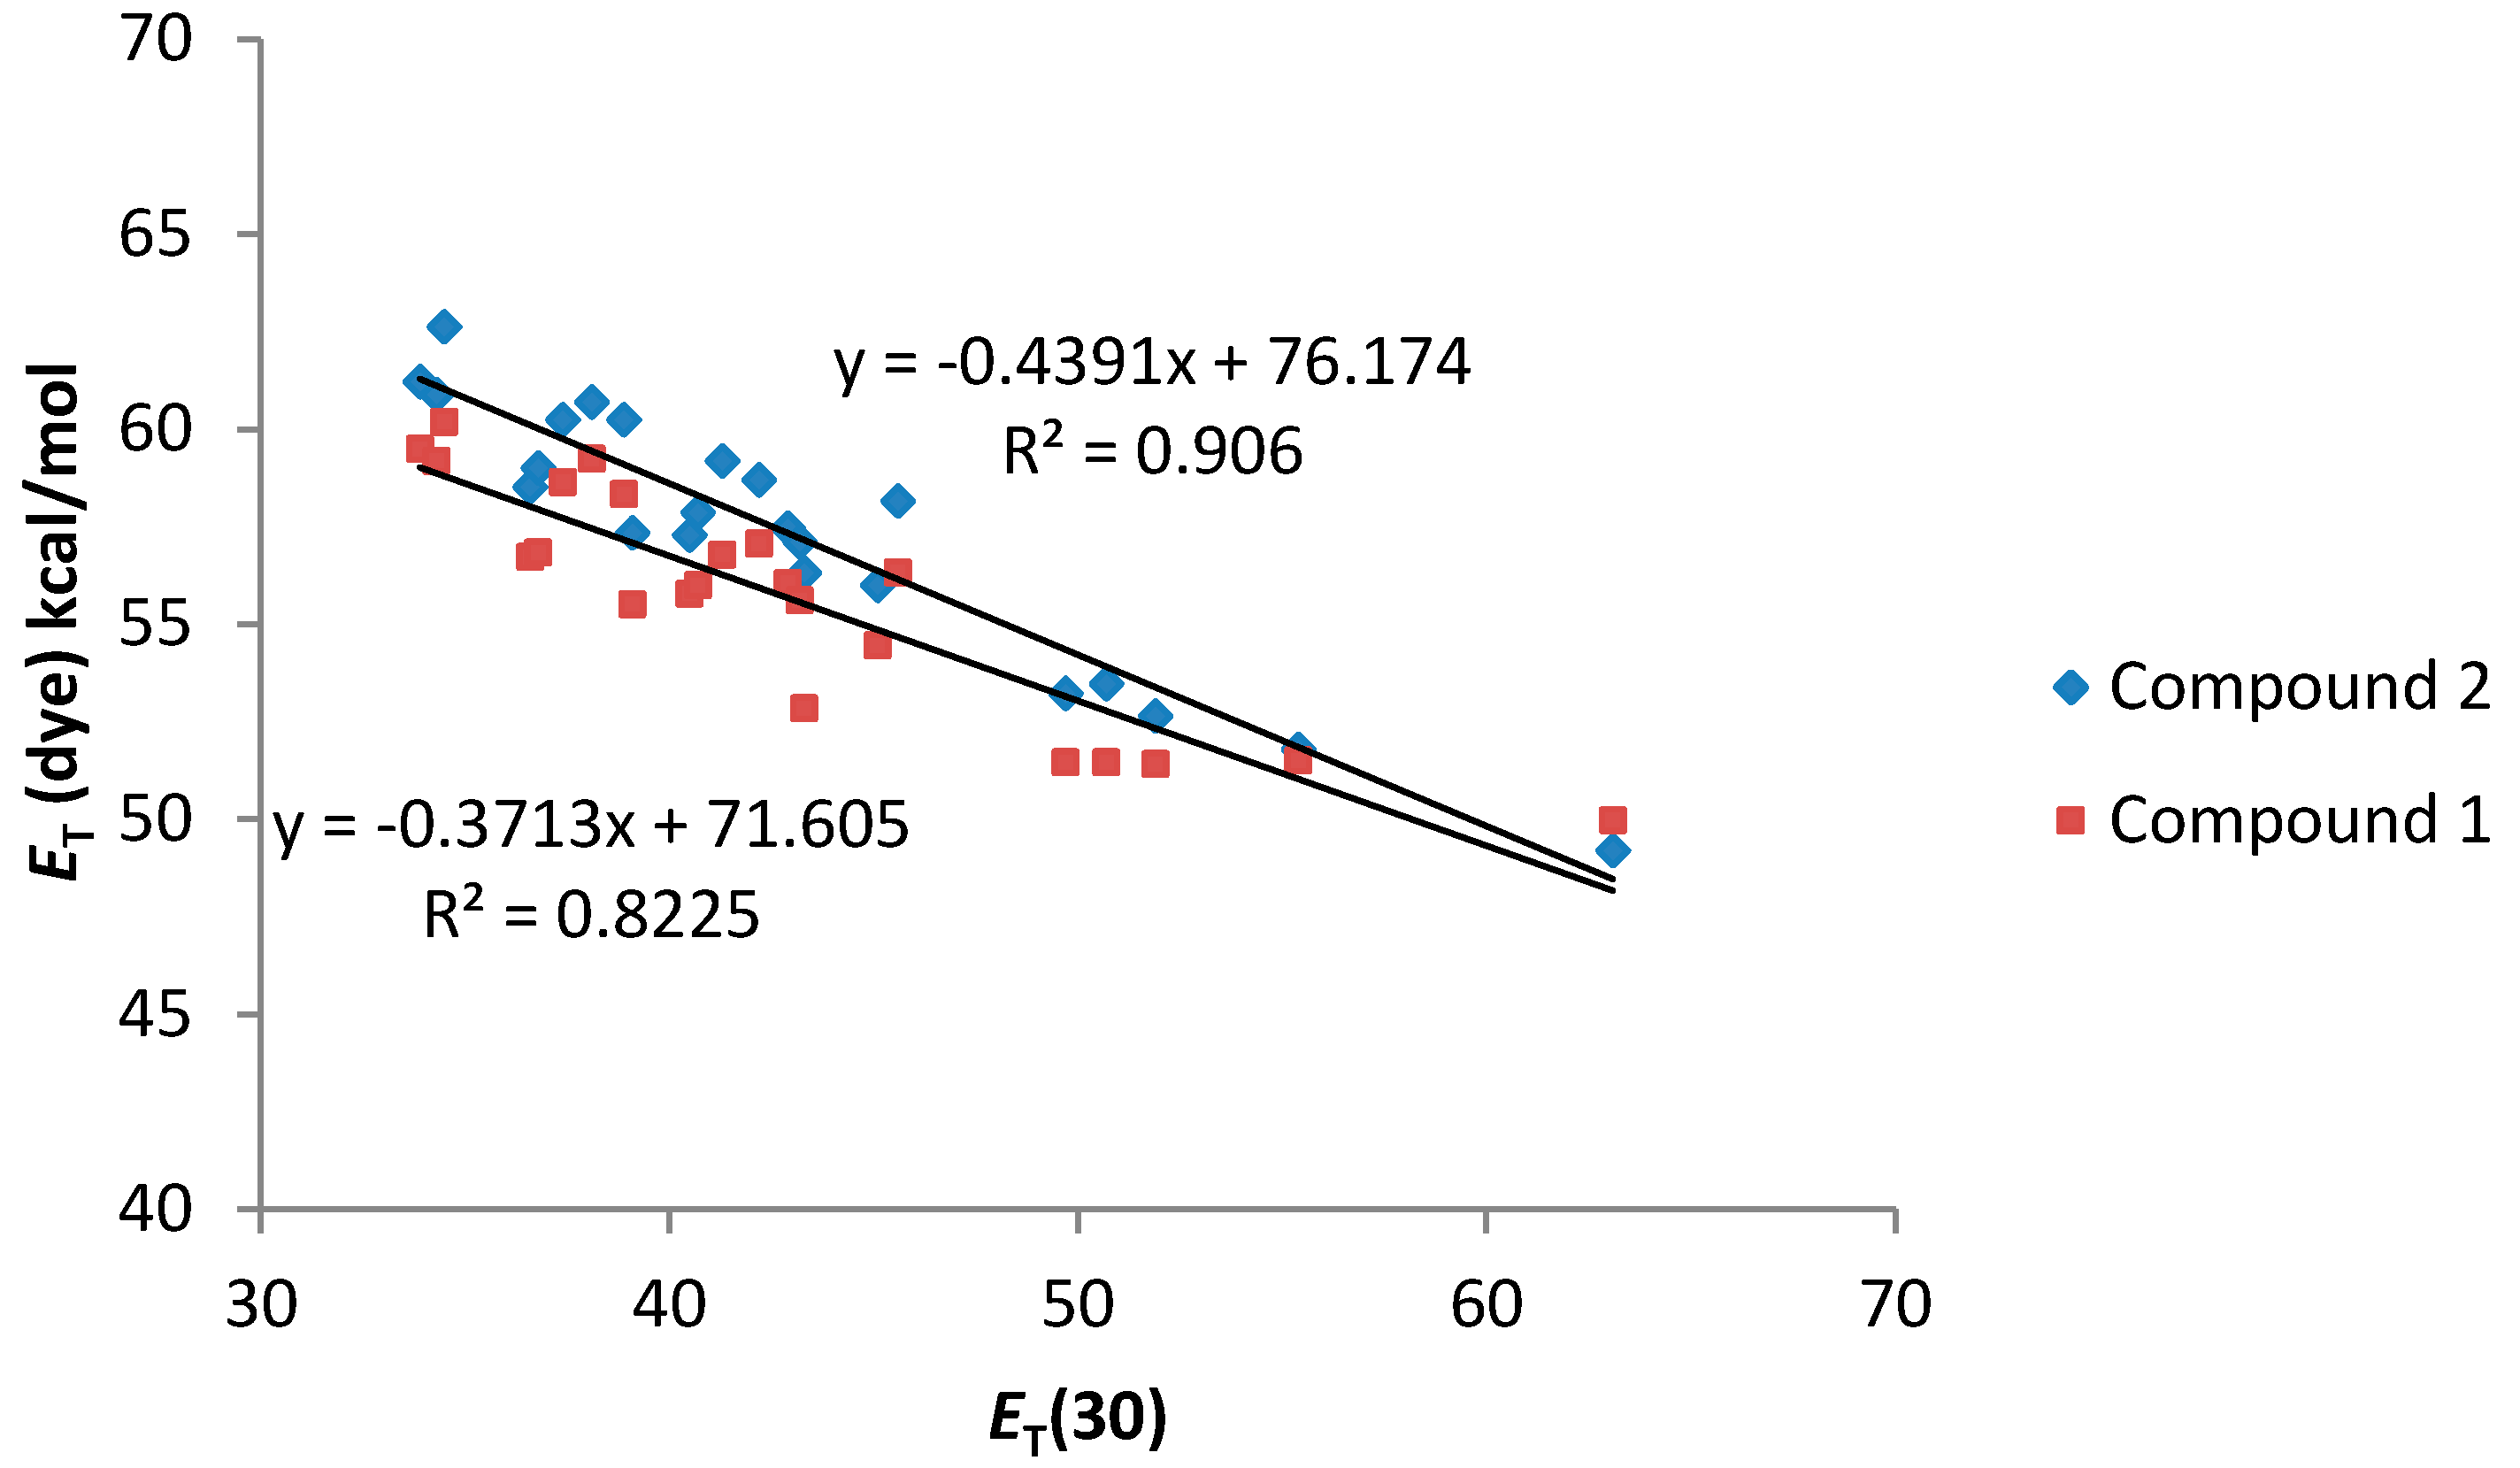
To study the solvatochromic shifts of main absorption bands of
1 and
2, as a function of the solute/solvent interactions, plots of the corresponding molar electronic transition energy (
ET(dyes)) values (kcal·mol
−1) [
25]
vs. the solvatochromic parameters
ET(30), π* and α were obtained.
As can be seen in
Figure 4, a good relationship between the
ET (dye) values and the
ET(30) value of the solvents was observed. In addition, both compounds
1 and
2 present a similar solvatochromic behavior. Even though a gap in the correlations under the transition from the non-polar to alcoholic solutions has been reported for some dyes in the literature [
26], compounds
1 and
2 show an almost linear dependence.
Figure 4.
ET (dye) values (kcal·mol−1) for compounds 1 and 2 vs. ET (30) solvent polarity parameter.
Figure 4.
ET (dye) values (kcal·mol−1) for compounds 1 and 2 vs. ET (30) solvent polarity parameter.
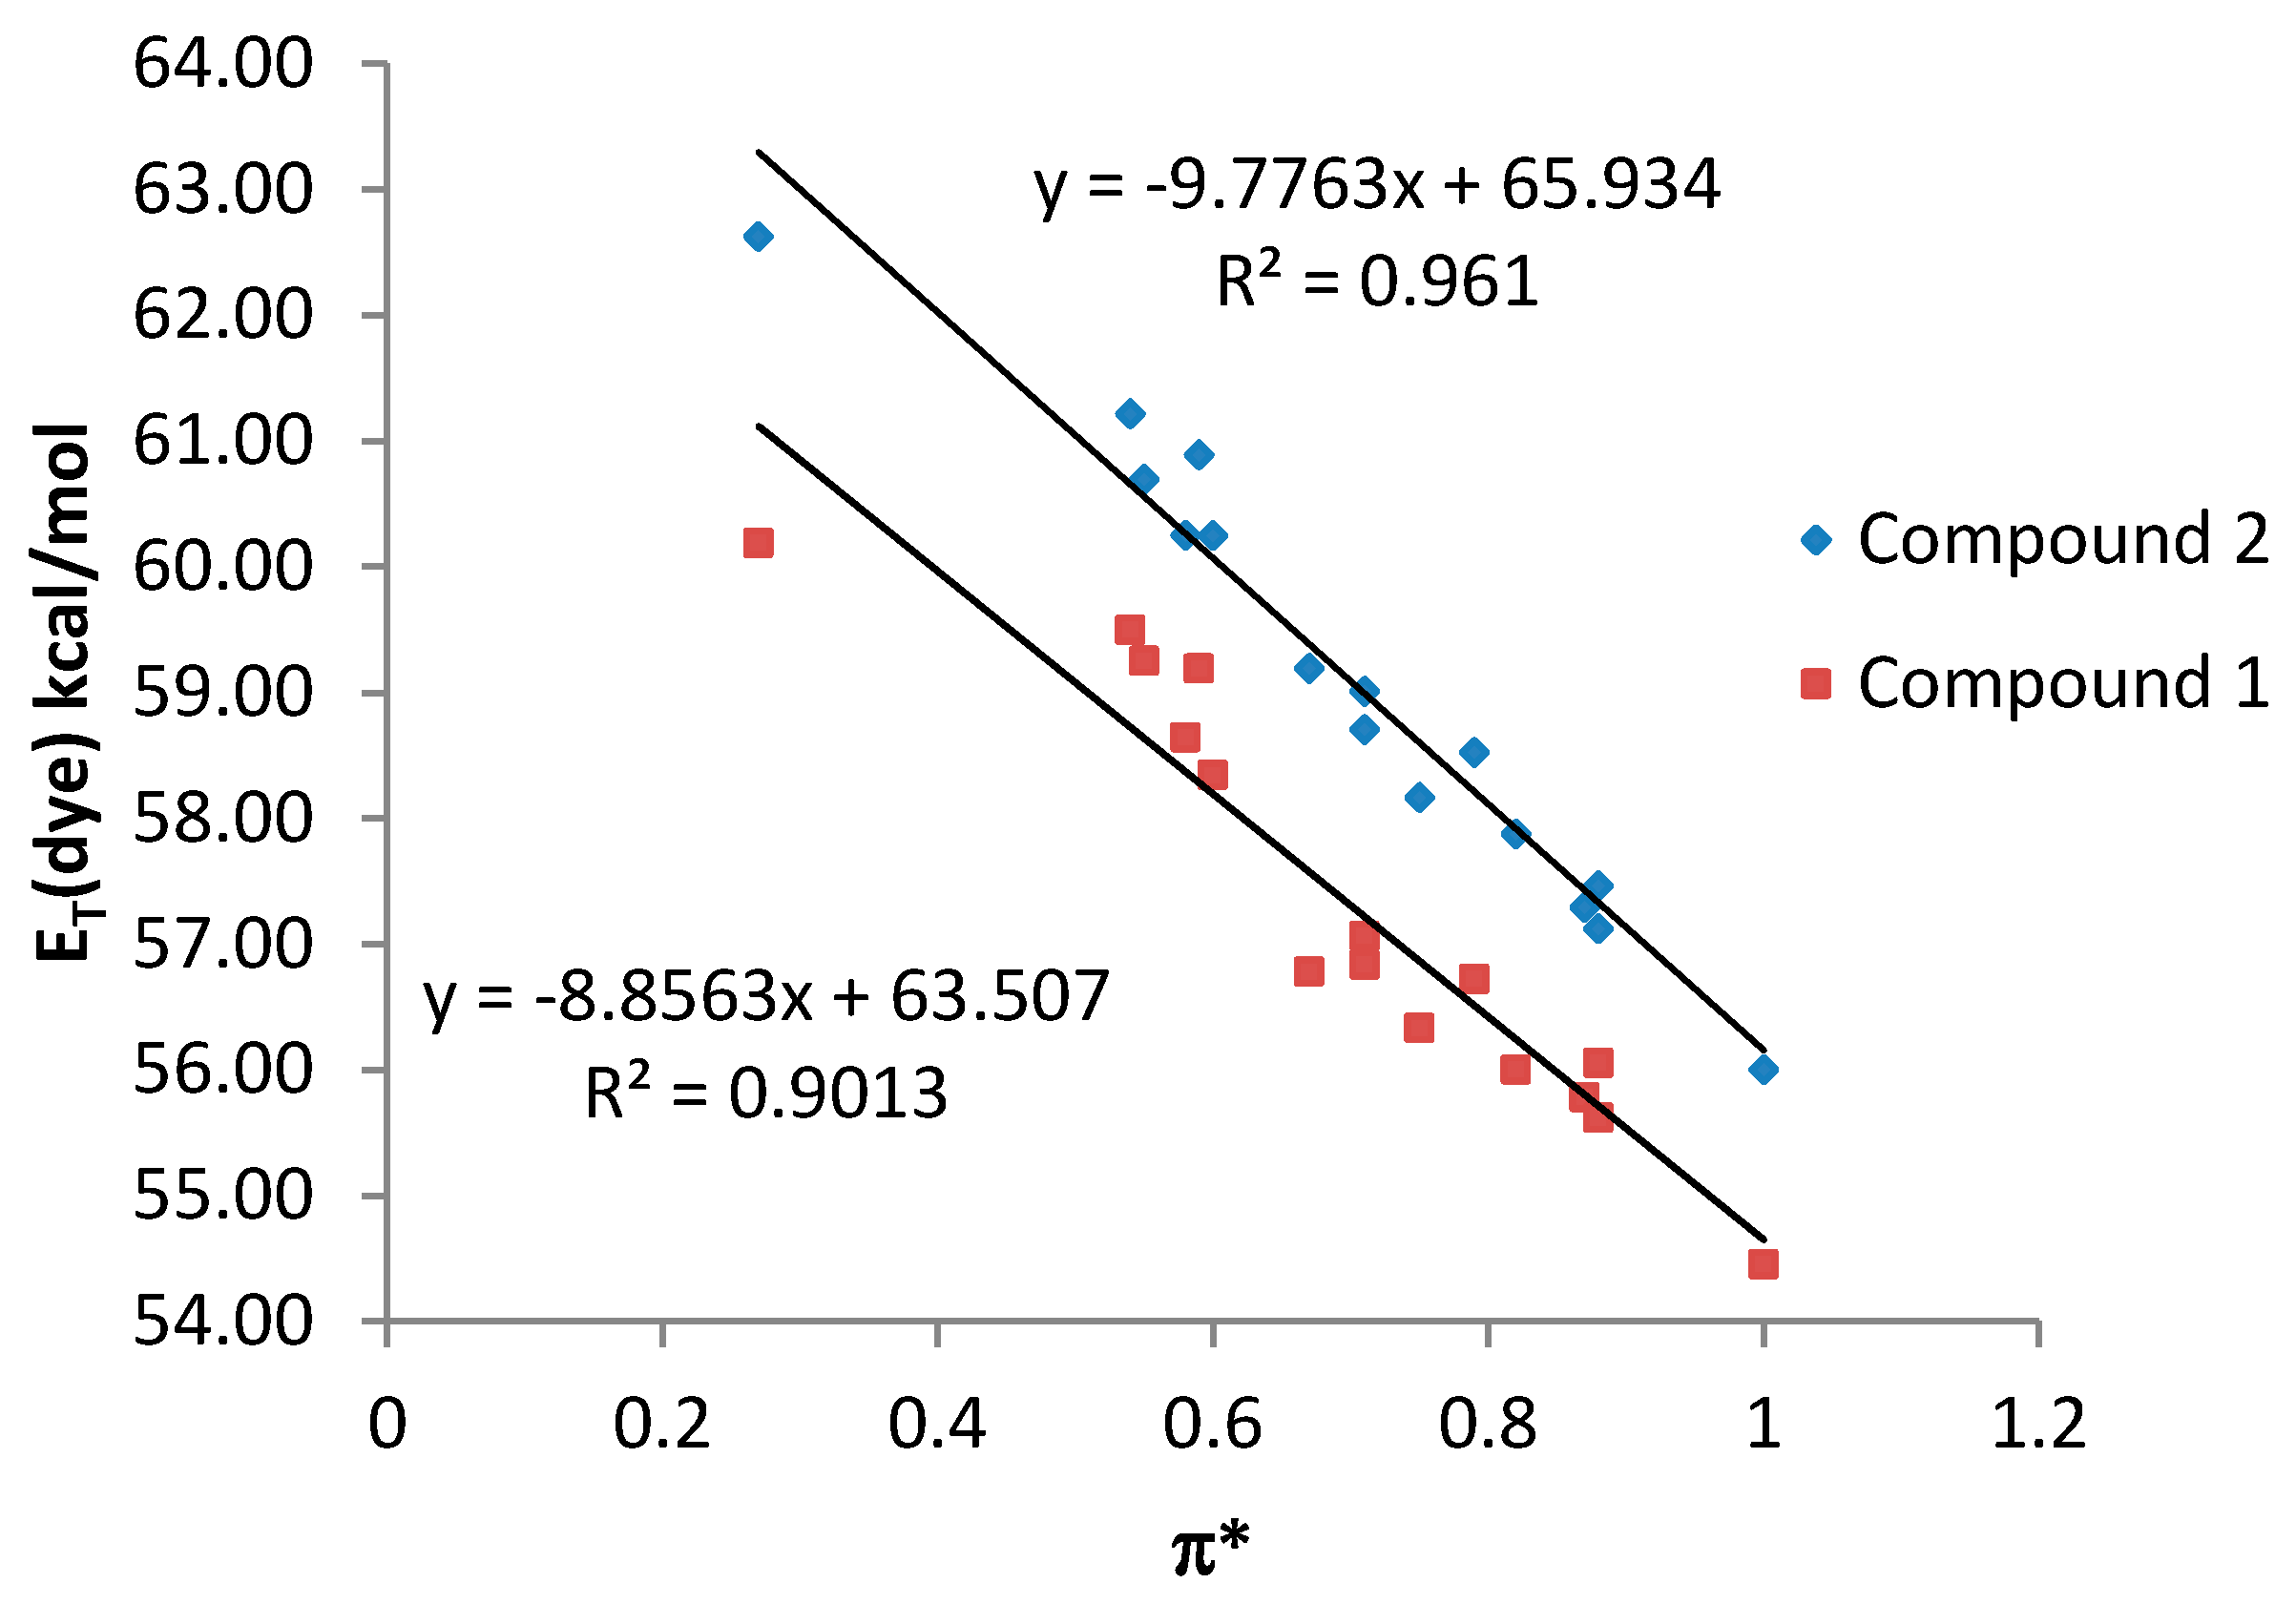
By contrast, a poor relationship between the
ET (dye) values and the π* scale was observed for both compound
1 and
2 when all the studied solvents were considered together (see
Supplementary Material). However, a good correlation with the π* parameter was observed when only NHB and HBA solvents are considered, being the results similar for both compounds
1 and
2 (
Figure 5).
Figure 5.
ET (dye) values (kcal·mol−1) for compounds 1 and 2 vs. π* values for NHB and HBA solvents.
Figure 5.
ET (dye) values (kcal·mol−1) for compounds 1 and 2 vs. π* values for NHB and HBA solvents.
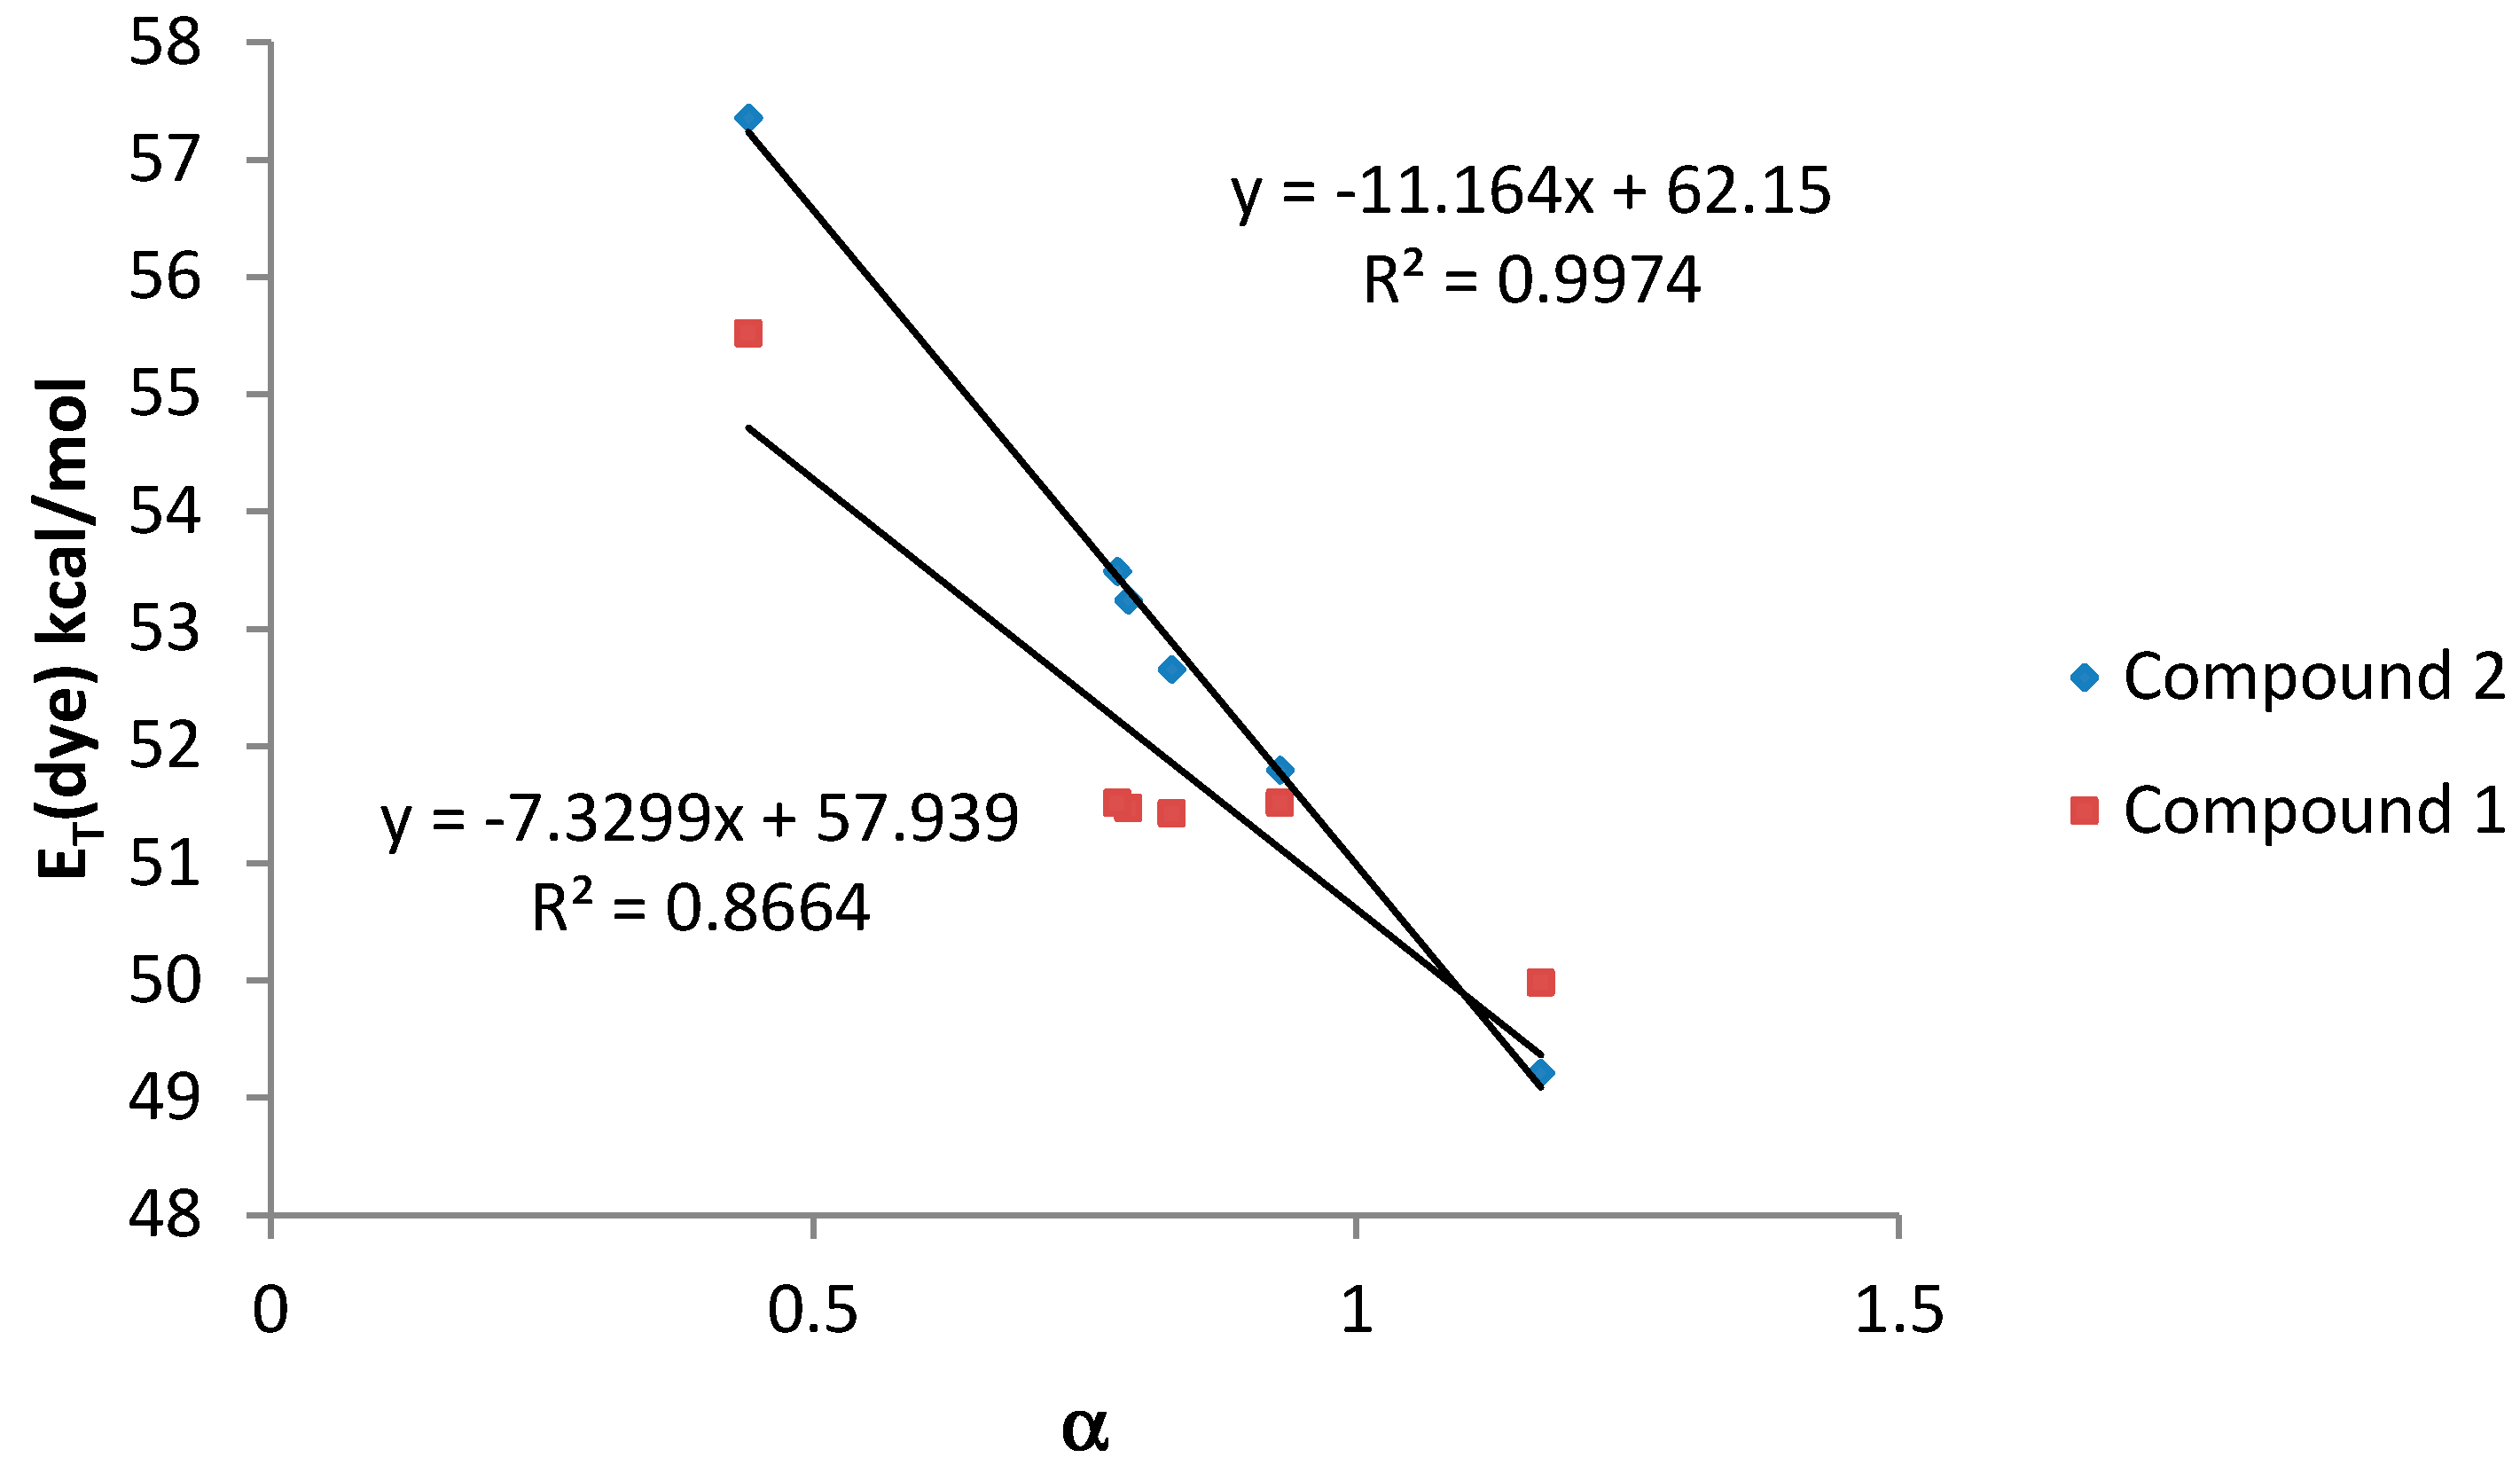
Finally, when the HBD acidity parameter of the solvent (α scale) was plotted against
ET (dye) values, a good correlation was also observed for both compounds (
Figure 6).
Figure 6.
ET (dye) values (kcal·mol−1) for compounds 1 and 2 vs. α values for amphiprotic (HBA-D) solvents.
Figure 6.
ET (dye) values (kcal·mol−1) for compounds 1 and 2 vs. α values for amphiprotic (HBA-D) solvents.
In general, compound 2, bearing only one dimethylamino group, shows a better correlation with the considered solvatochromic parameters than compound 1. On the other hand, for compound 2, the HBD ability of the solvents (parameter α) has a stronger effect on the solvatochromic shift than the nonspecific interactions (ET(30) and π*). In that sense, the lack of an amino group leads to a much larger solvent effect on the shift in the wavelength of the absorption band probably due to the larger change in the dipolar moment that can be induced in compound 2 after the light absorption. Probably, the presence of two amino groups in compound 1, lead to a split of the partial dipoles and their vector addition renders a lower dipolar moment. Due to this fact, solvents with high value of α would stabilize more the S1 than the S0 state and, as a consequence, the energy between both levels would decrease as it was observed.
Finally, a Multiple Linear Regression (MLR) was used in order to find a linear correlation between
ET (dye) values with the Kamlet-Abboud-Taft solvatochromic parameters (π*, α and β) (Equation (1)). The resulting data matrix contained three variables (
i.e., π*, α and β parameters) with 23 rows corresponding to solvents. The adjusted coefficients corresponded to the regression vector obtained (
i.e., adjusted coefficients for each compound).
Table 5 shows coefficients obtained (C
π*, C
α and C
β), RMSE (root mean squared error) and correlation coefficient (r) using MLR (see supporting information).
Table 5.
Adjusted coefficients (Cπ*, Cα and Cβ), root mean squared error (RMSE) and correlation coefficients (r) for the Multiple Linear Regression analysis of the absorption λmax of the compounds 1 and 2 with the solvent polarity/polarizability and the acid and base capacity using the Kamlet-Abboud-Taft (π*, α and β) scale.
| Compound | Cπ* | Cα | Cβ | RMSE | r |
|---|
| 1 | −2.177 | −6.282 | −1.763 | 0.9344 | 0.95 |
| 2 | −2.728 | −7.192 | −0.722 | 1.1094 | 0.95 |
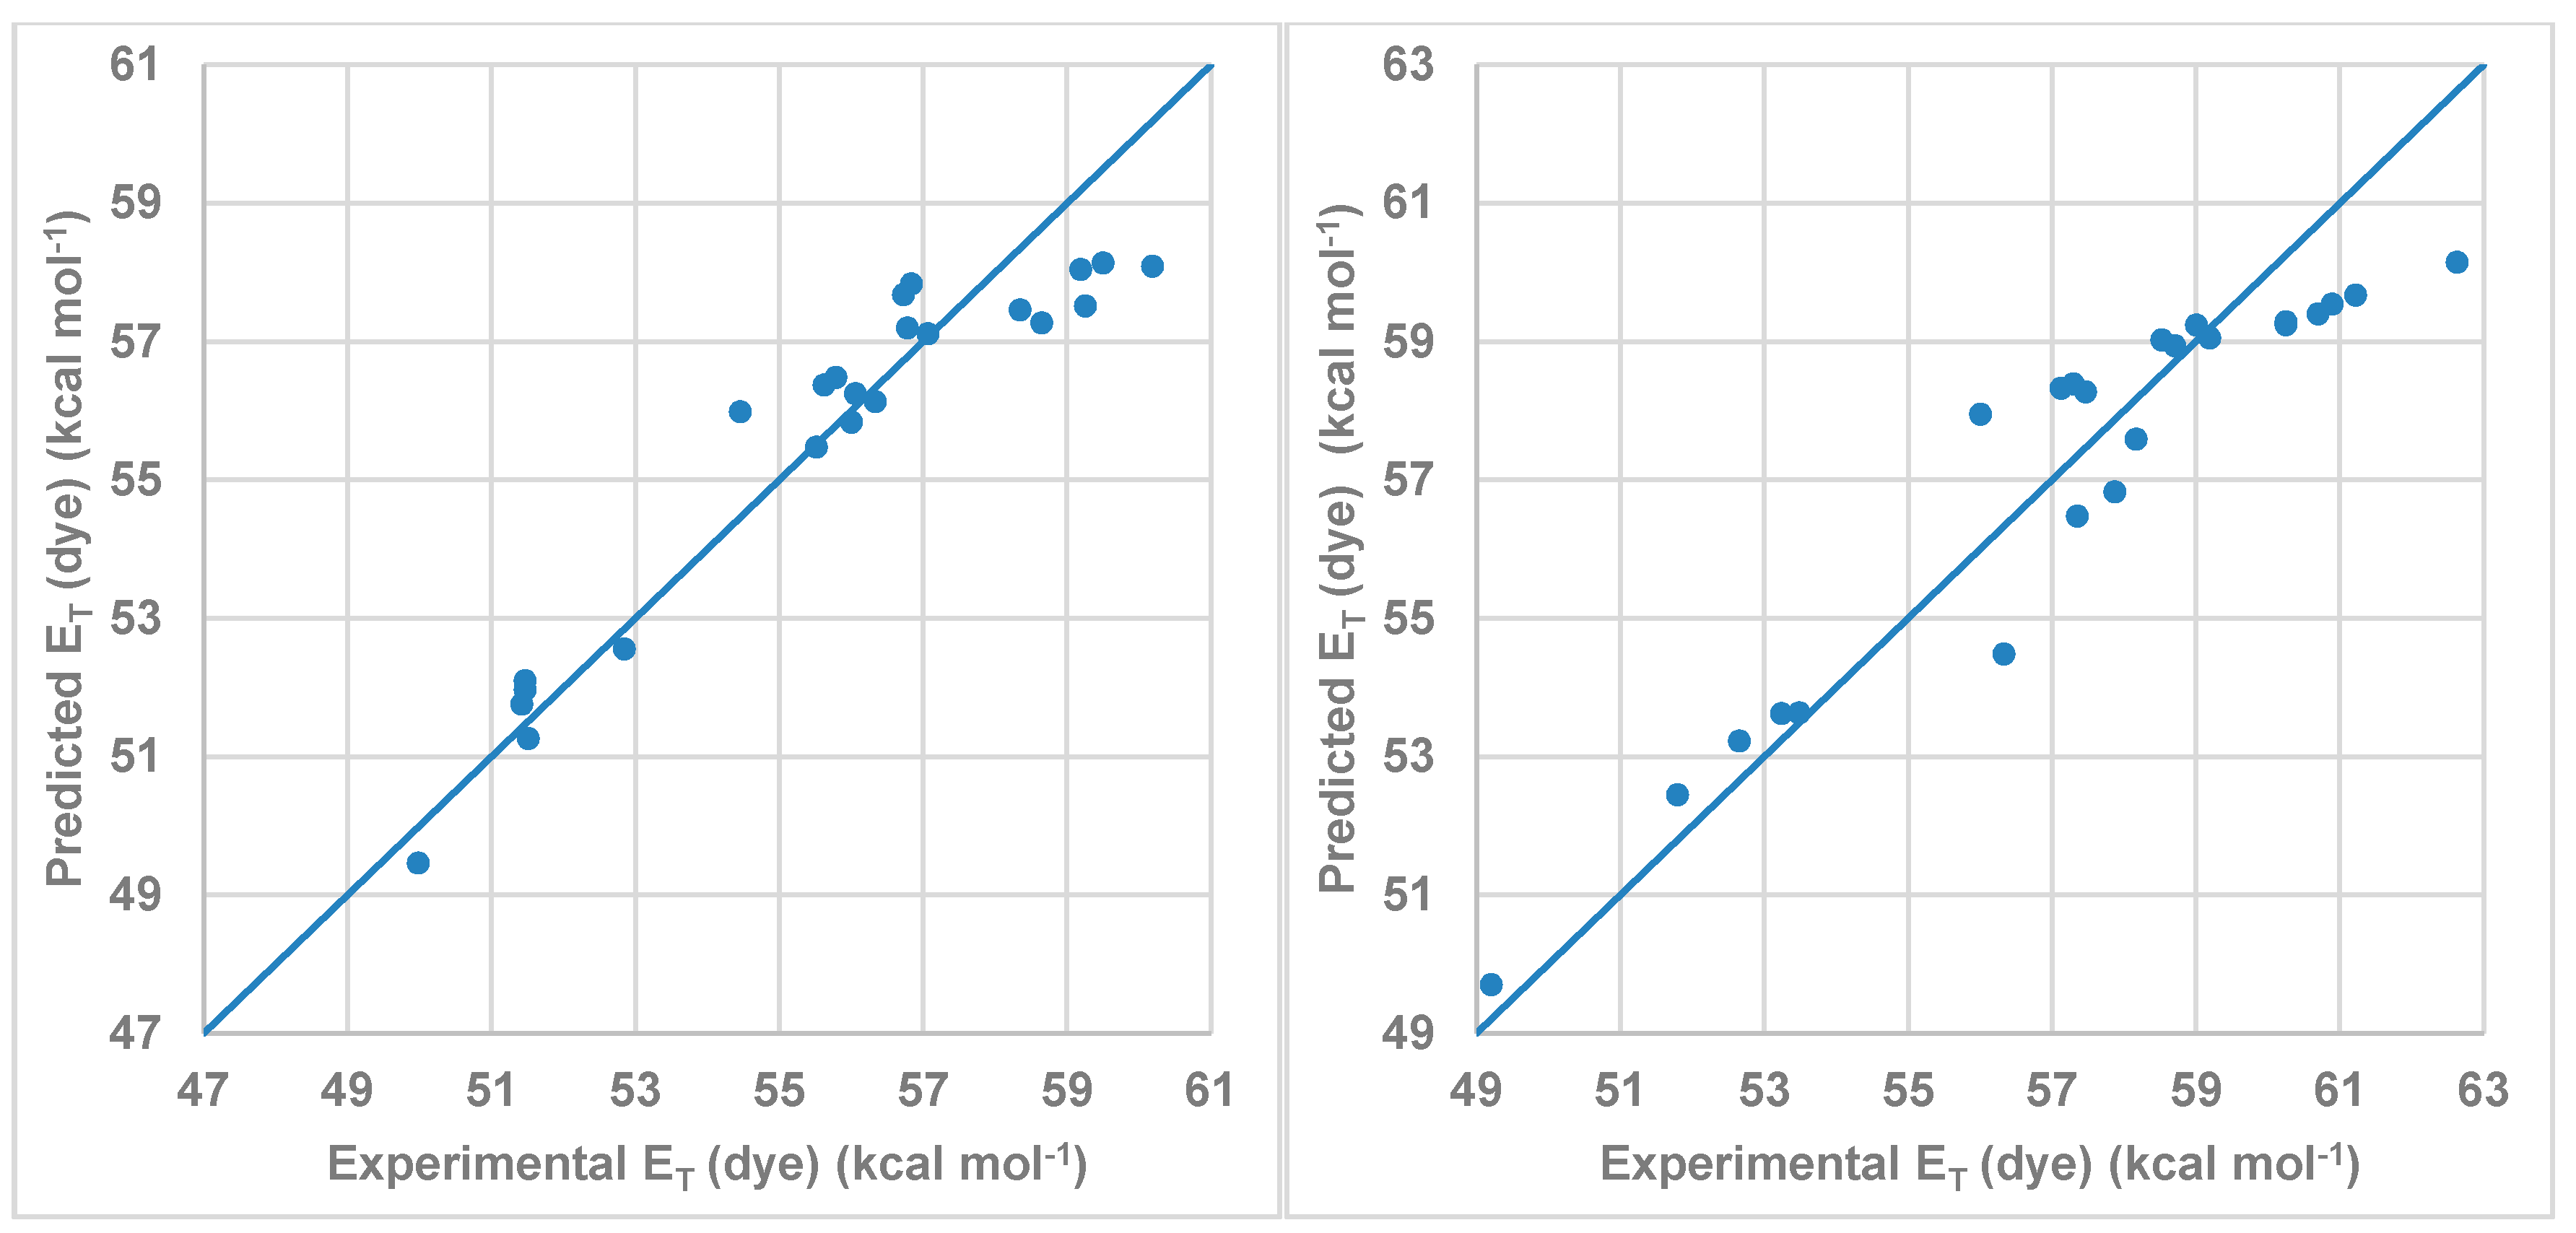
Figure 7 shows the correlation between the
ET (dye) values calculated by multi-component linear regression employing the Kamlet-Abboud-Taft-proposed parameters and the experimental values listed in
Table 4. As was expected, the dominant coefficient affecting the wavelength shift is that describing the HBD acidity parameter (α) of the solvent followed by the π* parameter. Due to the structure of the studied dye, the influence of the β parameter is small. On the other hand, the C
α value was higher for compound
2 than for compound
1 in agreement with the results showed in
Figure 6.
Figure 7.
Model obtained using MLR for the Kamlet-Abboud-Taft scale for (left) compound 1 and (right) for compound 2.
Figure 7.
Model obtained using MLR for the Kamlet-Abboud-Taft scale for (left) compound 1 and (right) for compound 2.


 ,
, 

