
Metabolic Profiling of Alpine and Ecuadorian Lichens

 , and
, and 
Abstract
:1. Introduction
2. Results and Discussion
2.1. Metabolic Fingerprinting of Lichens
2.1.1. Optimization of Extraction Protocols and Analytical Methods for the Non-Targeted Analysis of Lichens
2.1.2. Quality Control: Reproducibility of Metabolic Profiles in Extracts of Stereocaulon alpinum
2.2. Comparative Metabolic Profiling of Different Ecuadorian Lichens
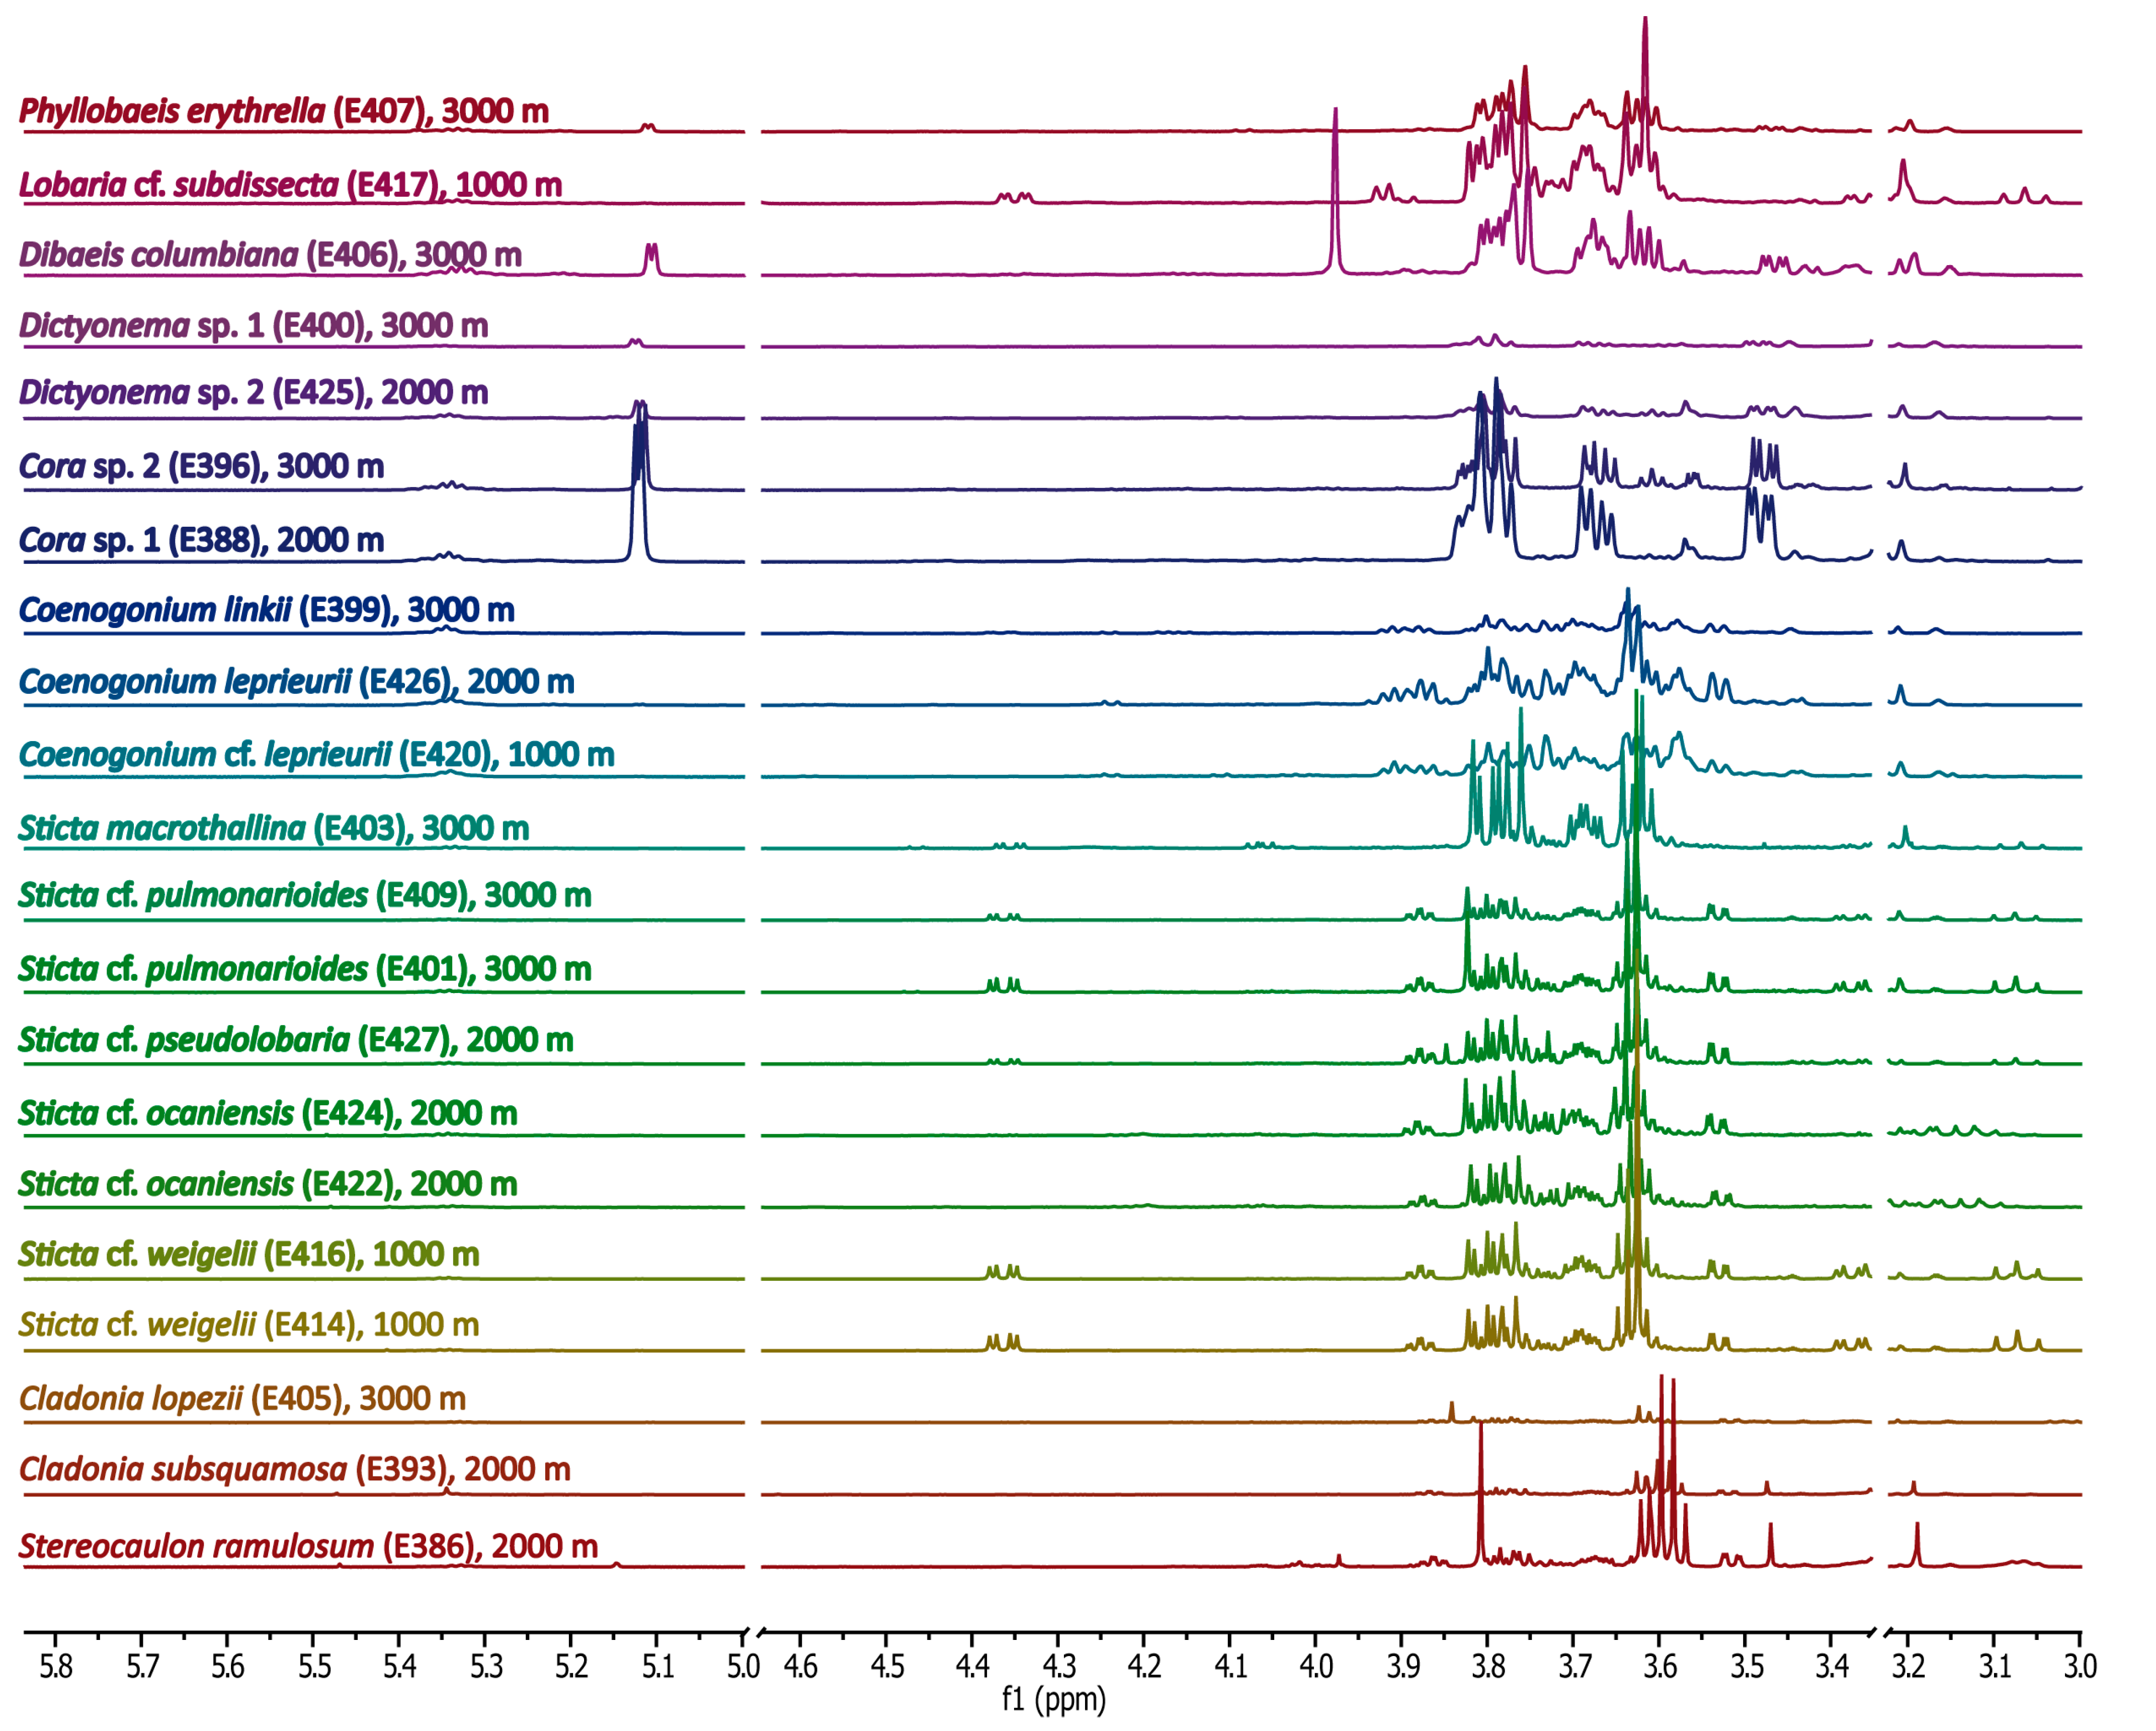
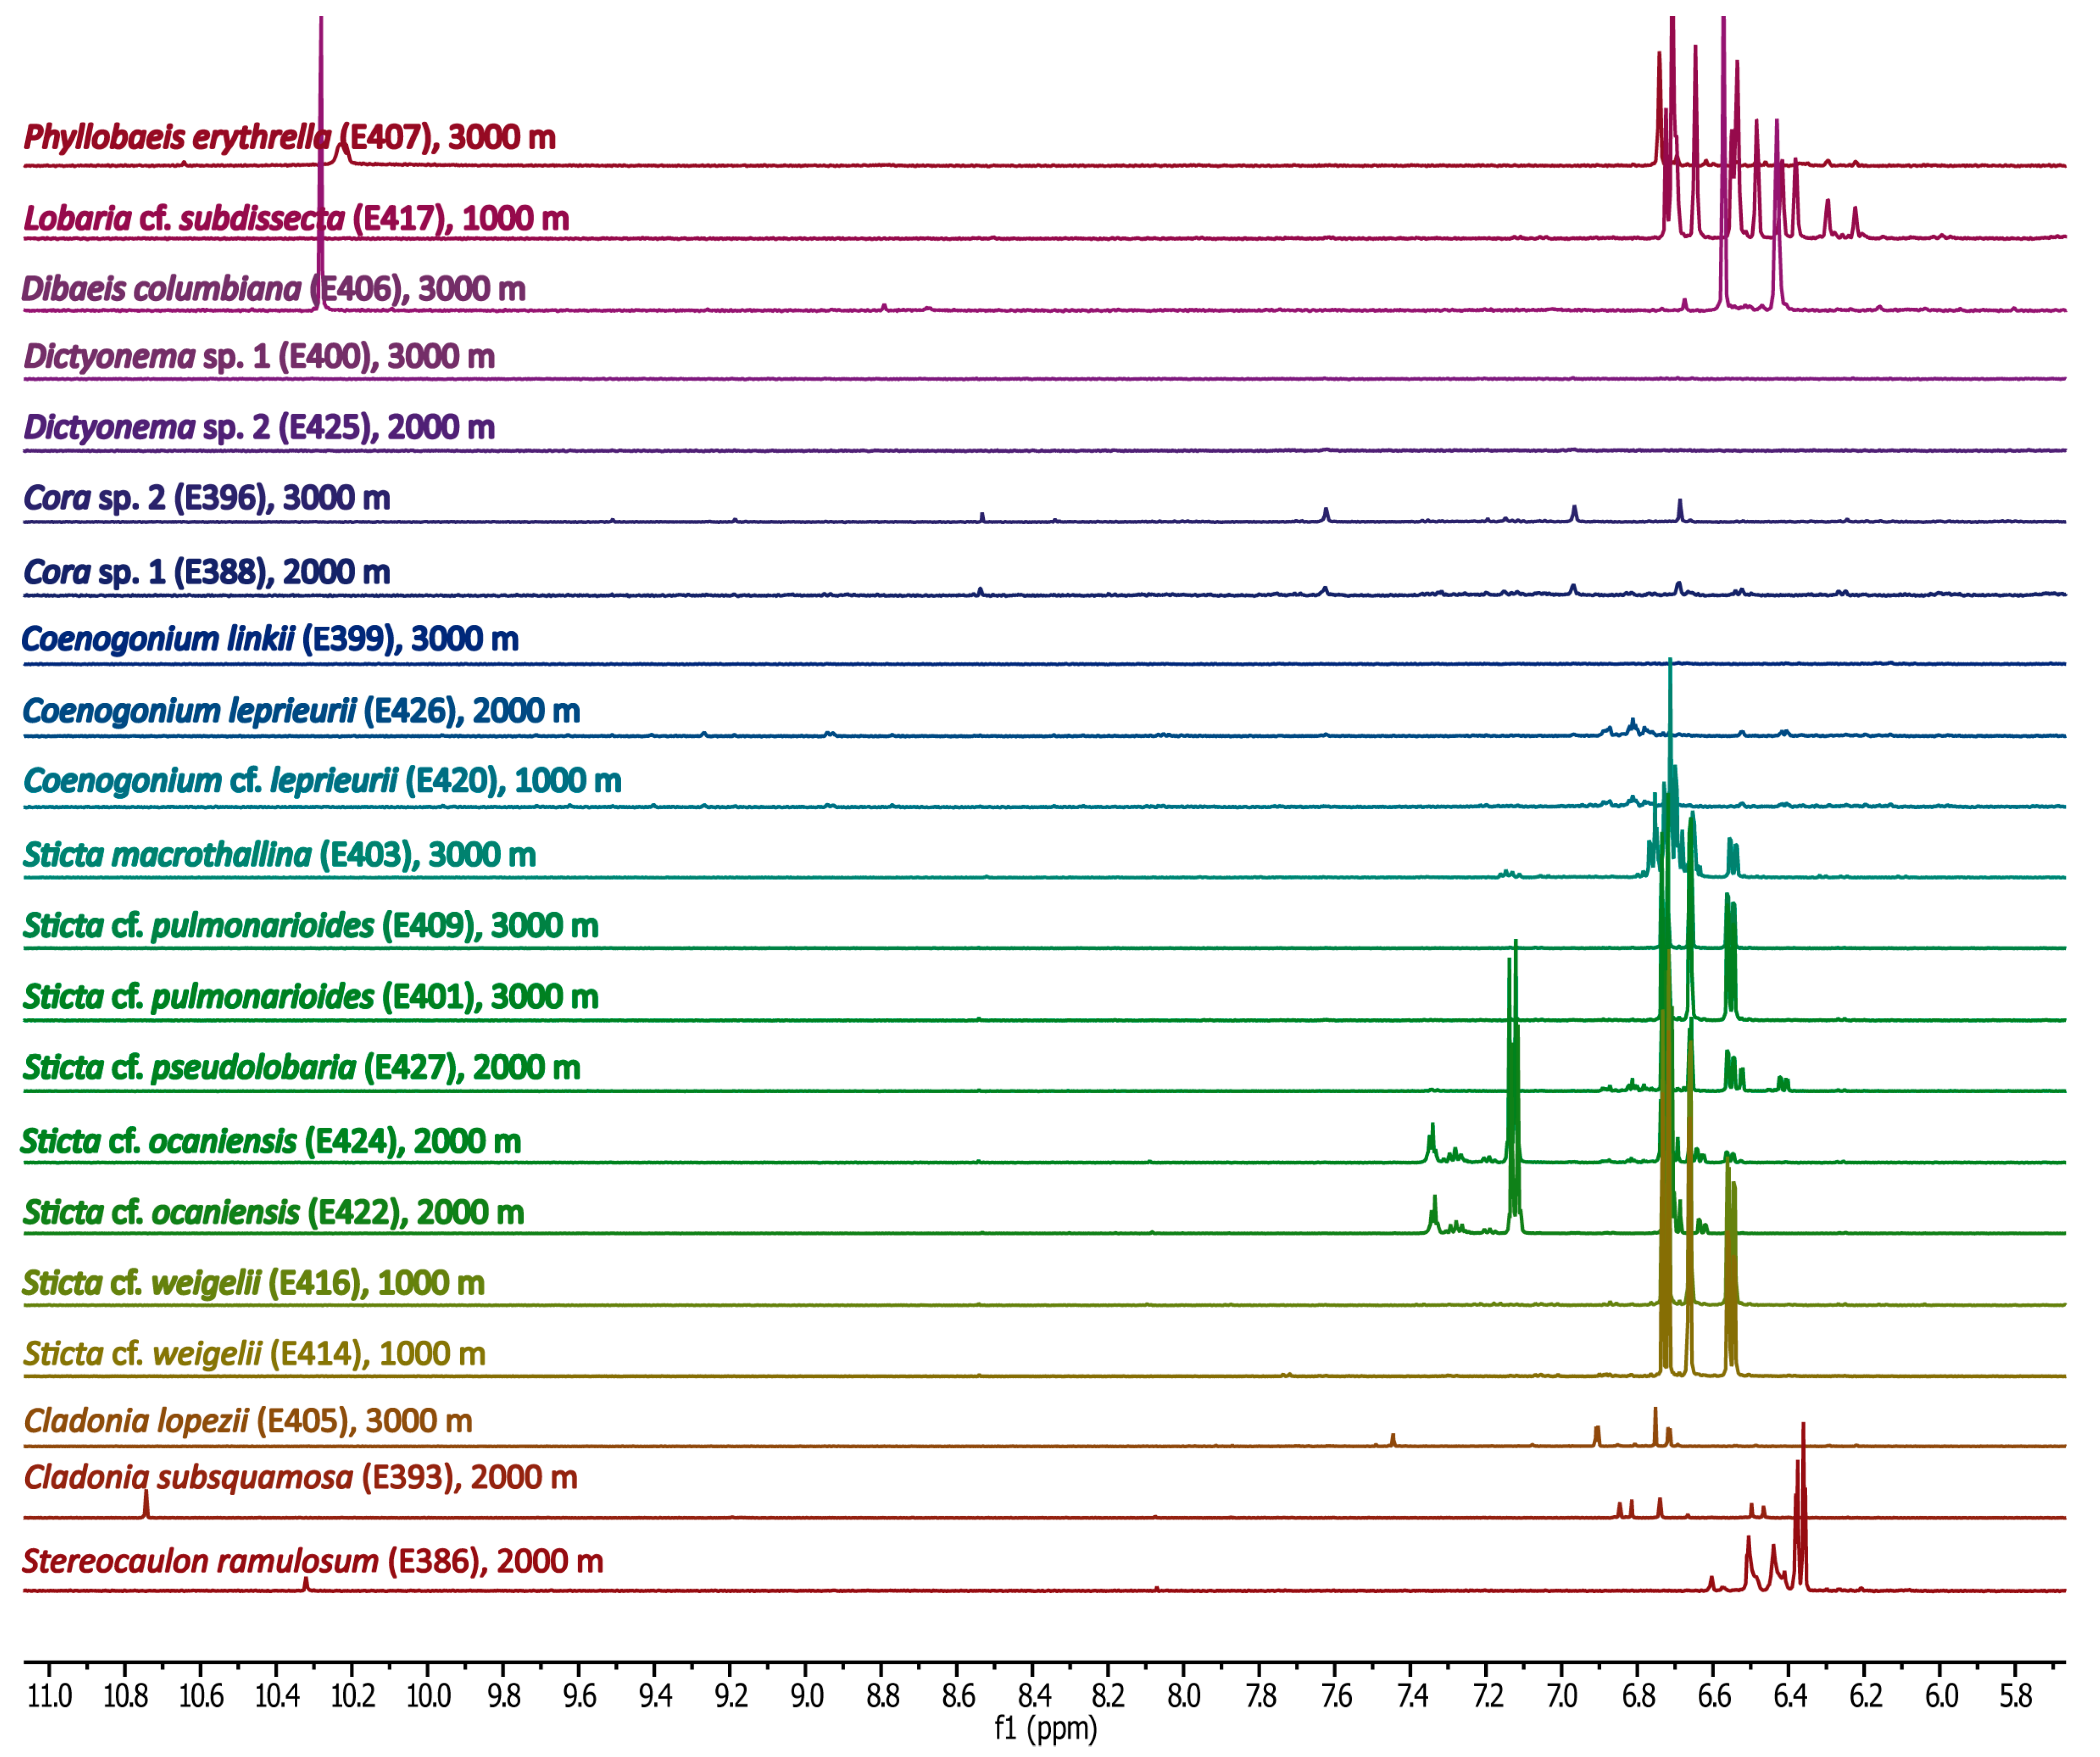
Metabolic Fingerprinting by 1H-NMR
Hexane Extracts
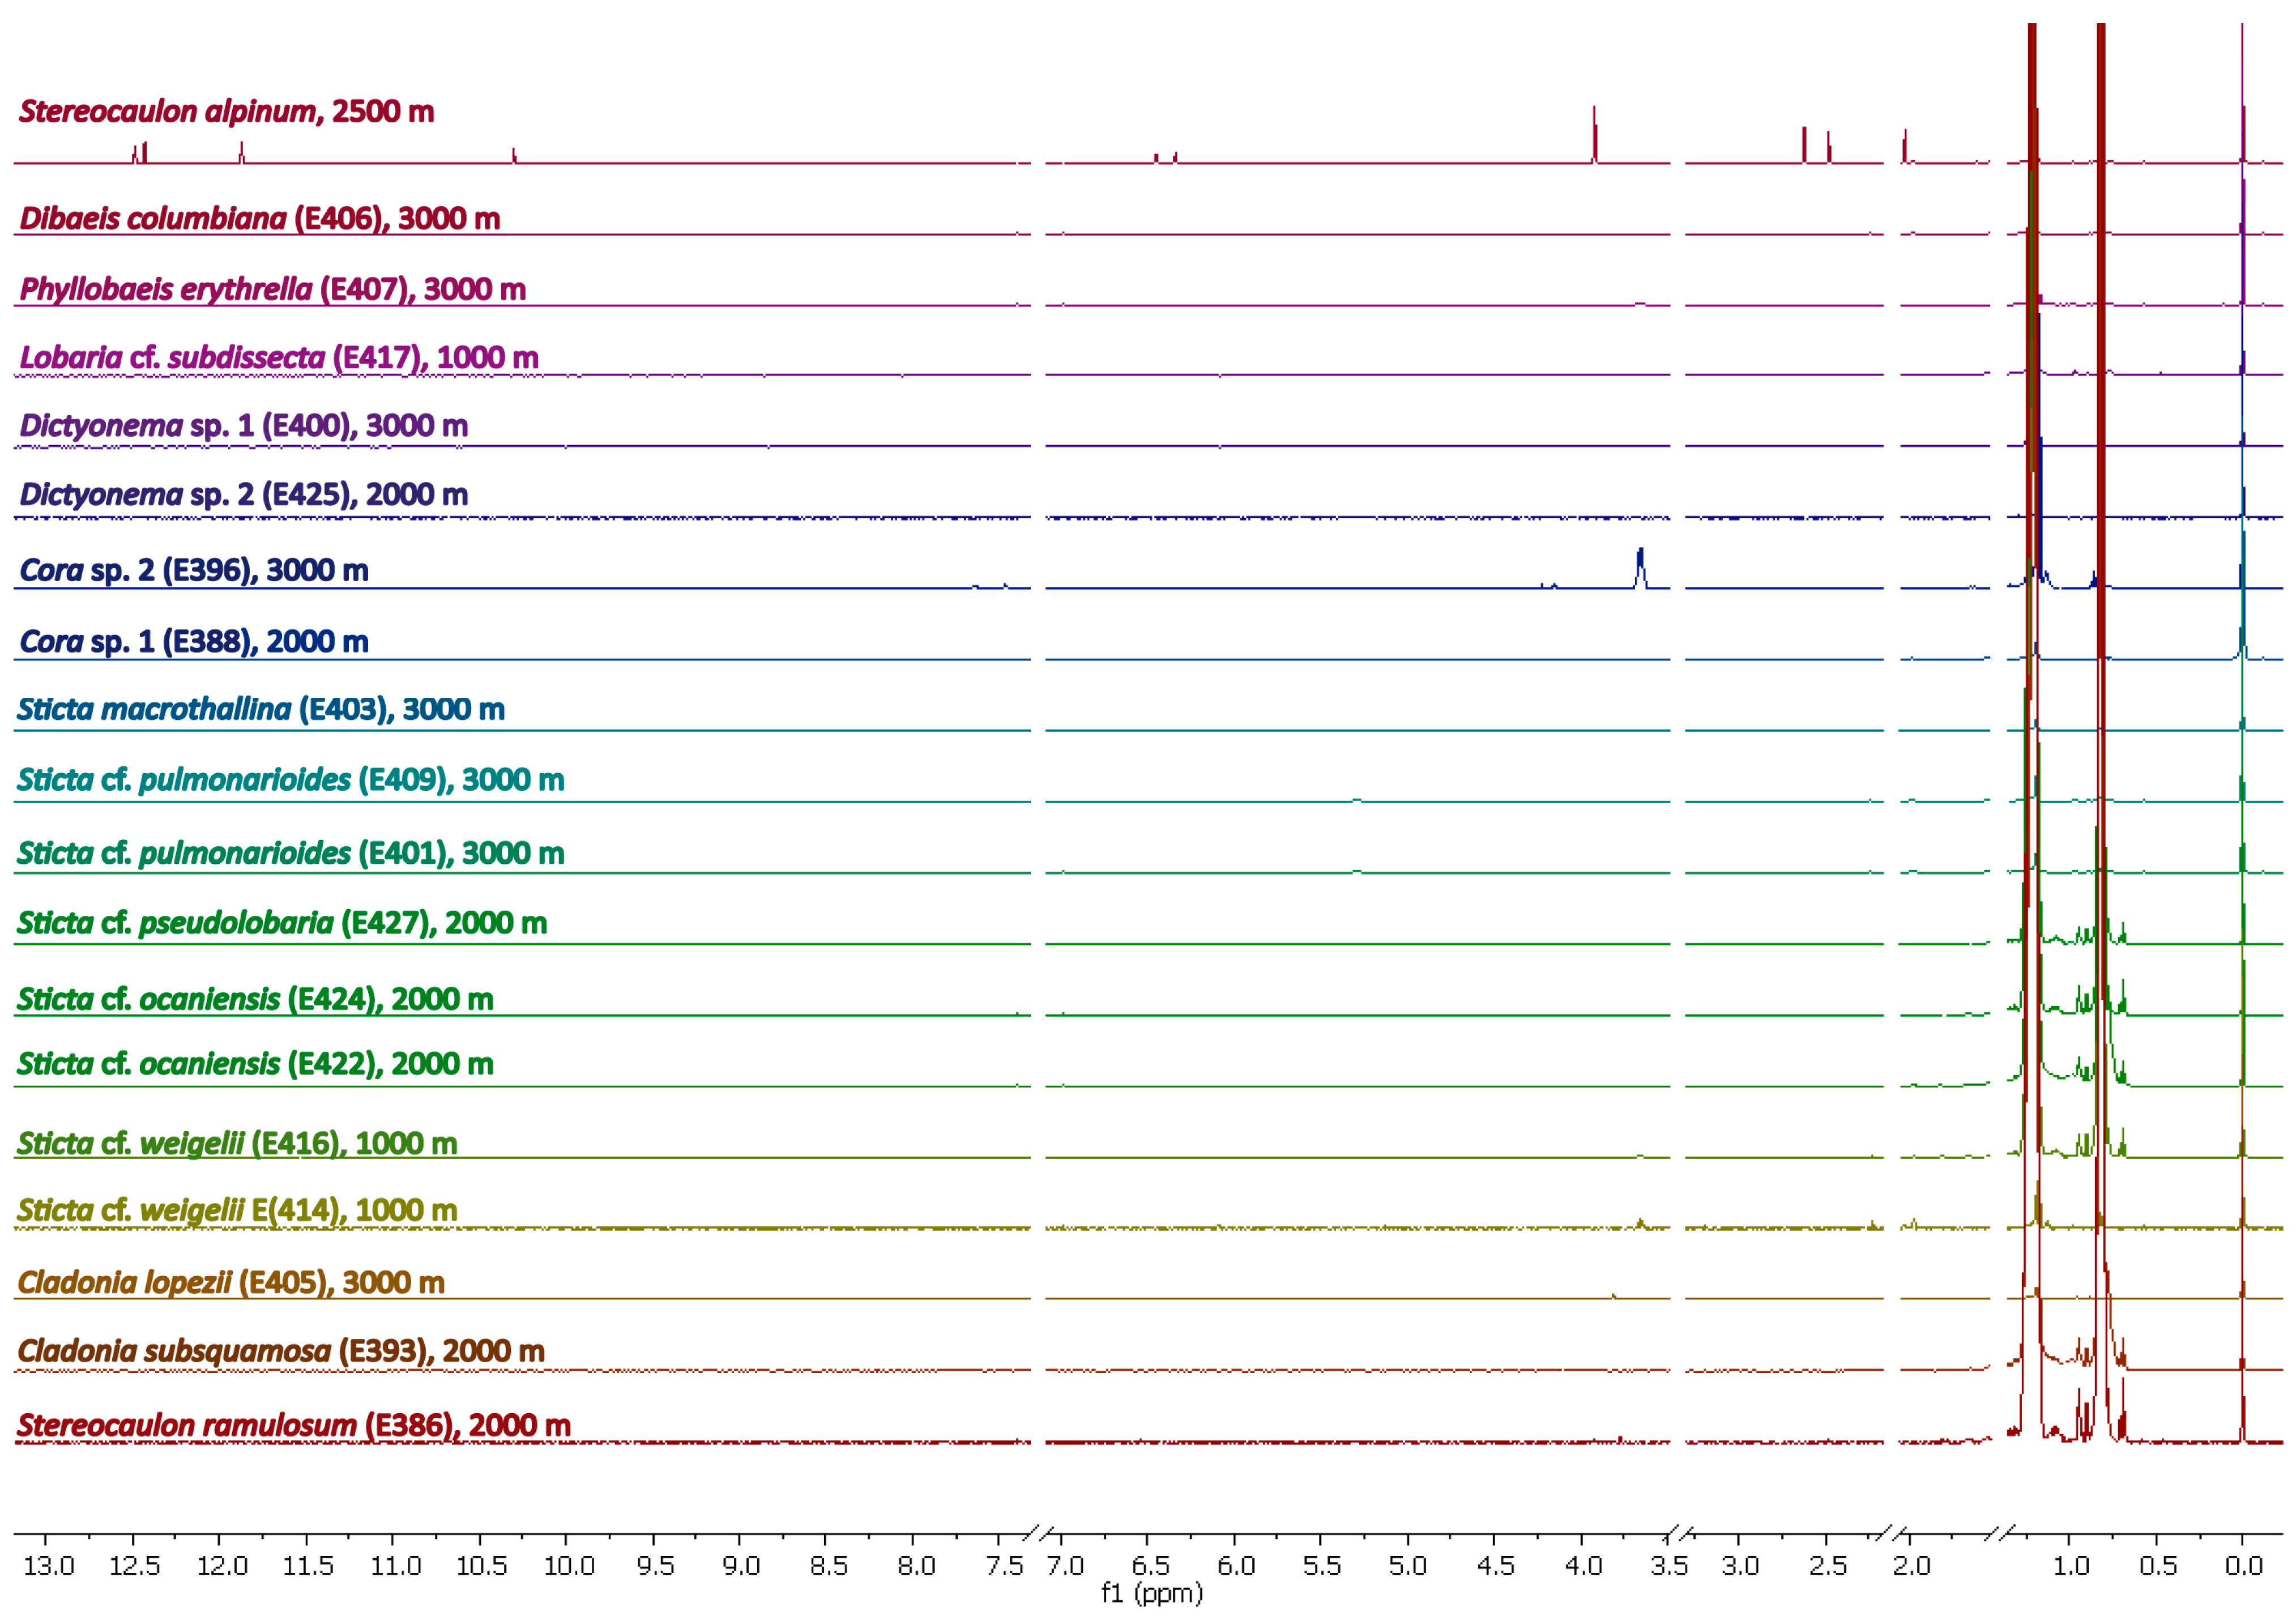
Methanolic Extracts
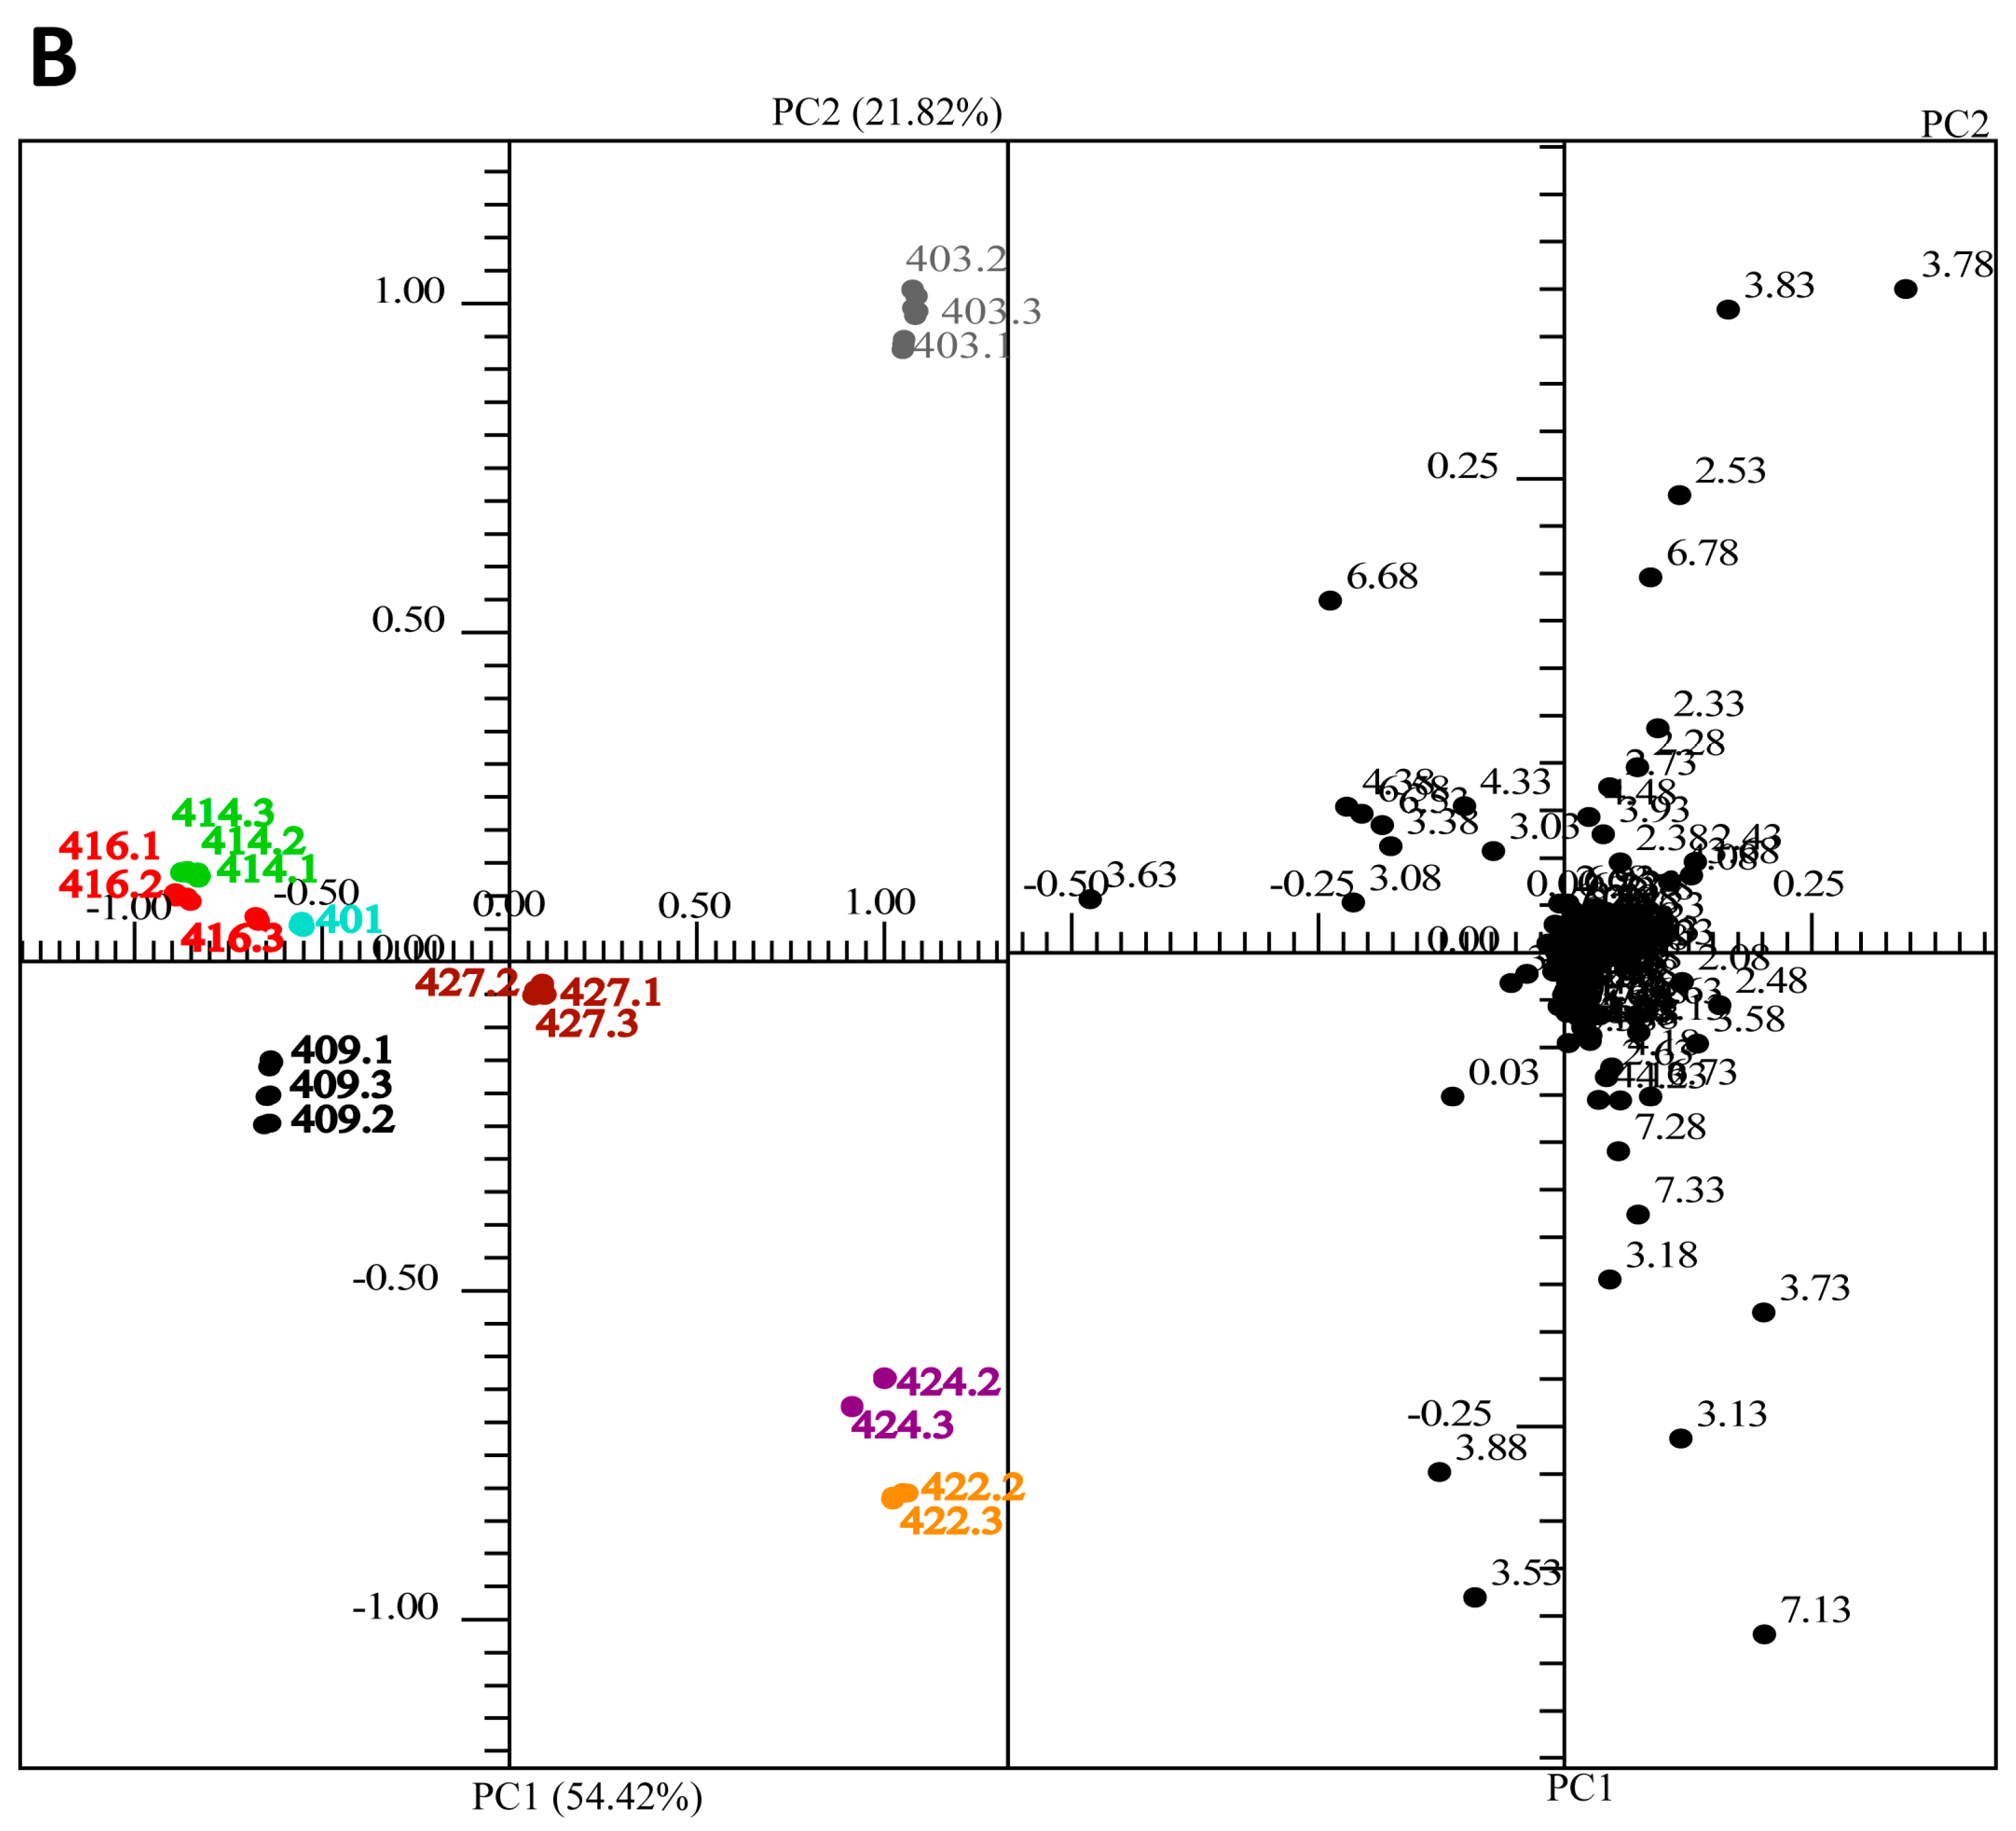
2.3. Multivariate Analysis: Comparison of Ecuadorian and Some Alpine Lichens by Principle Component Analysis

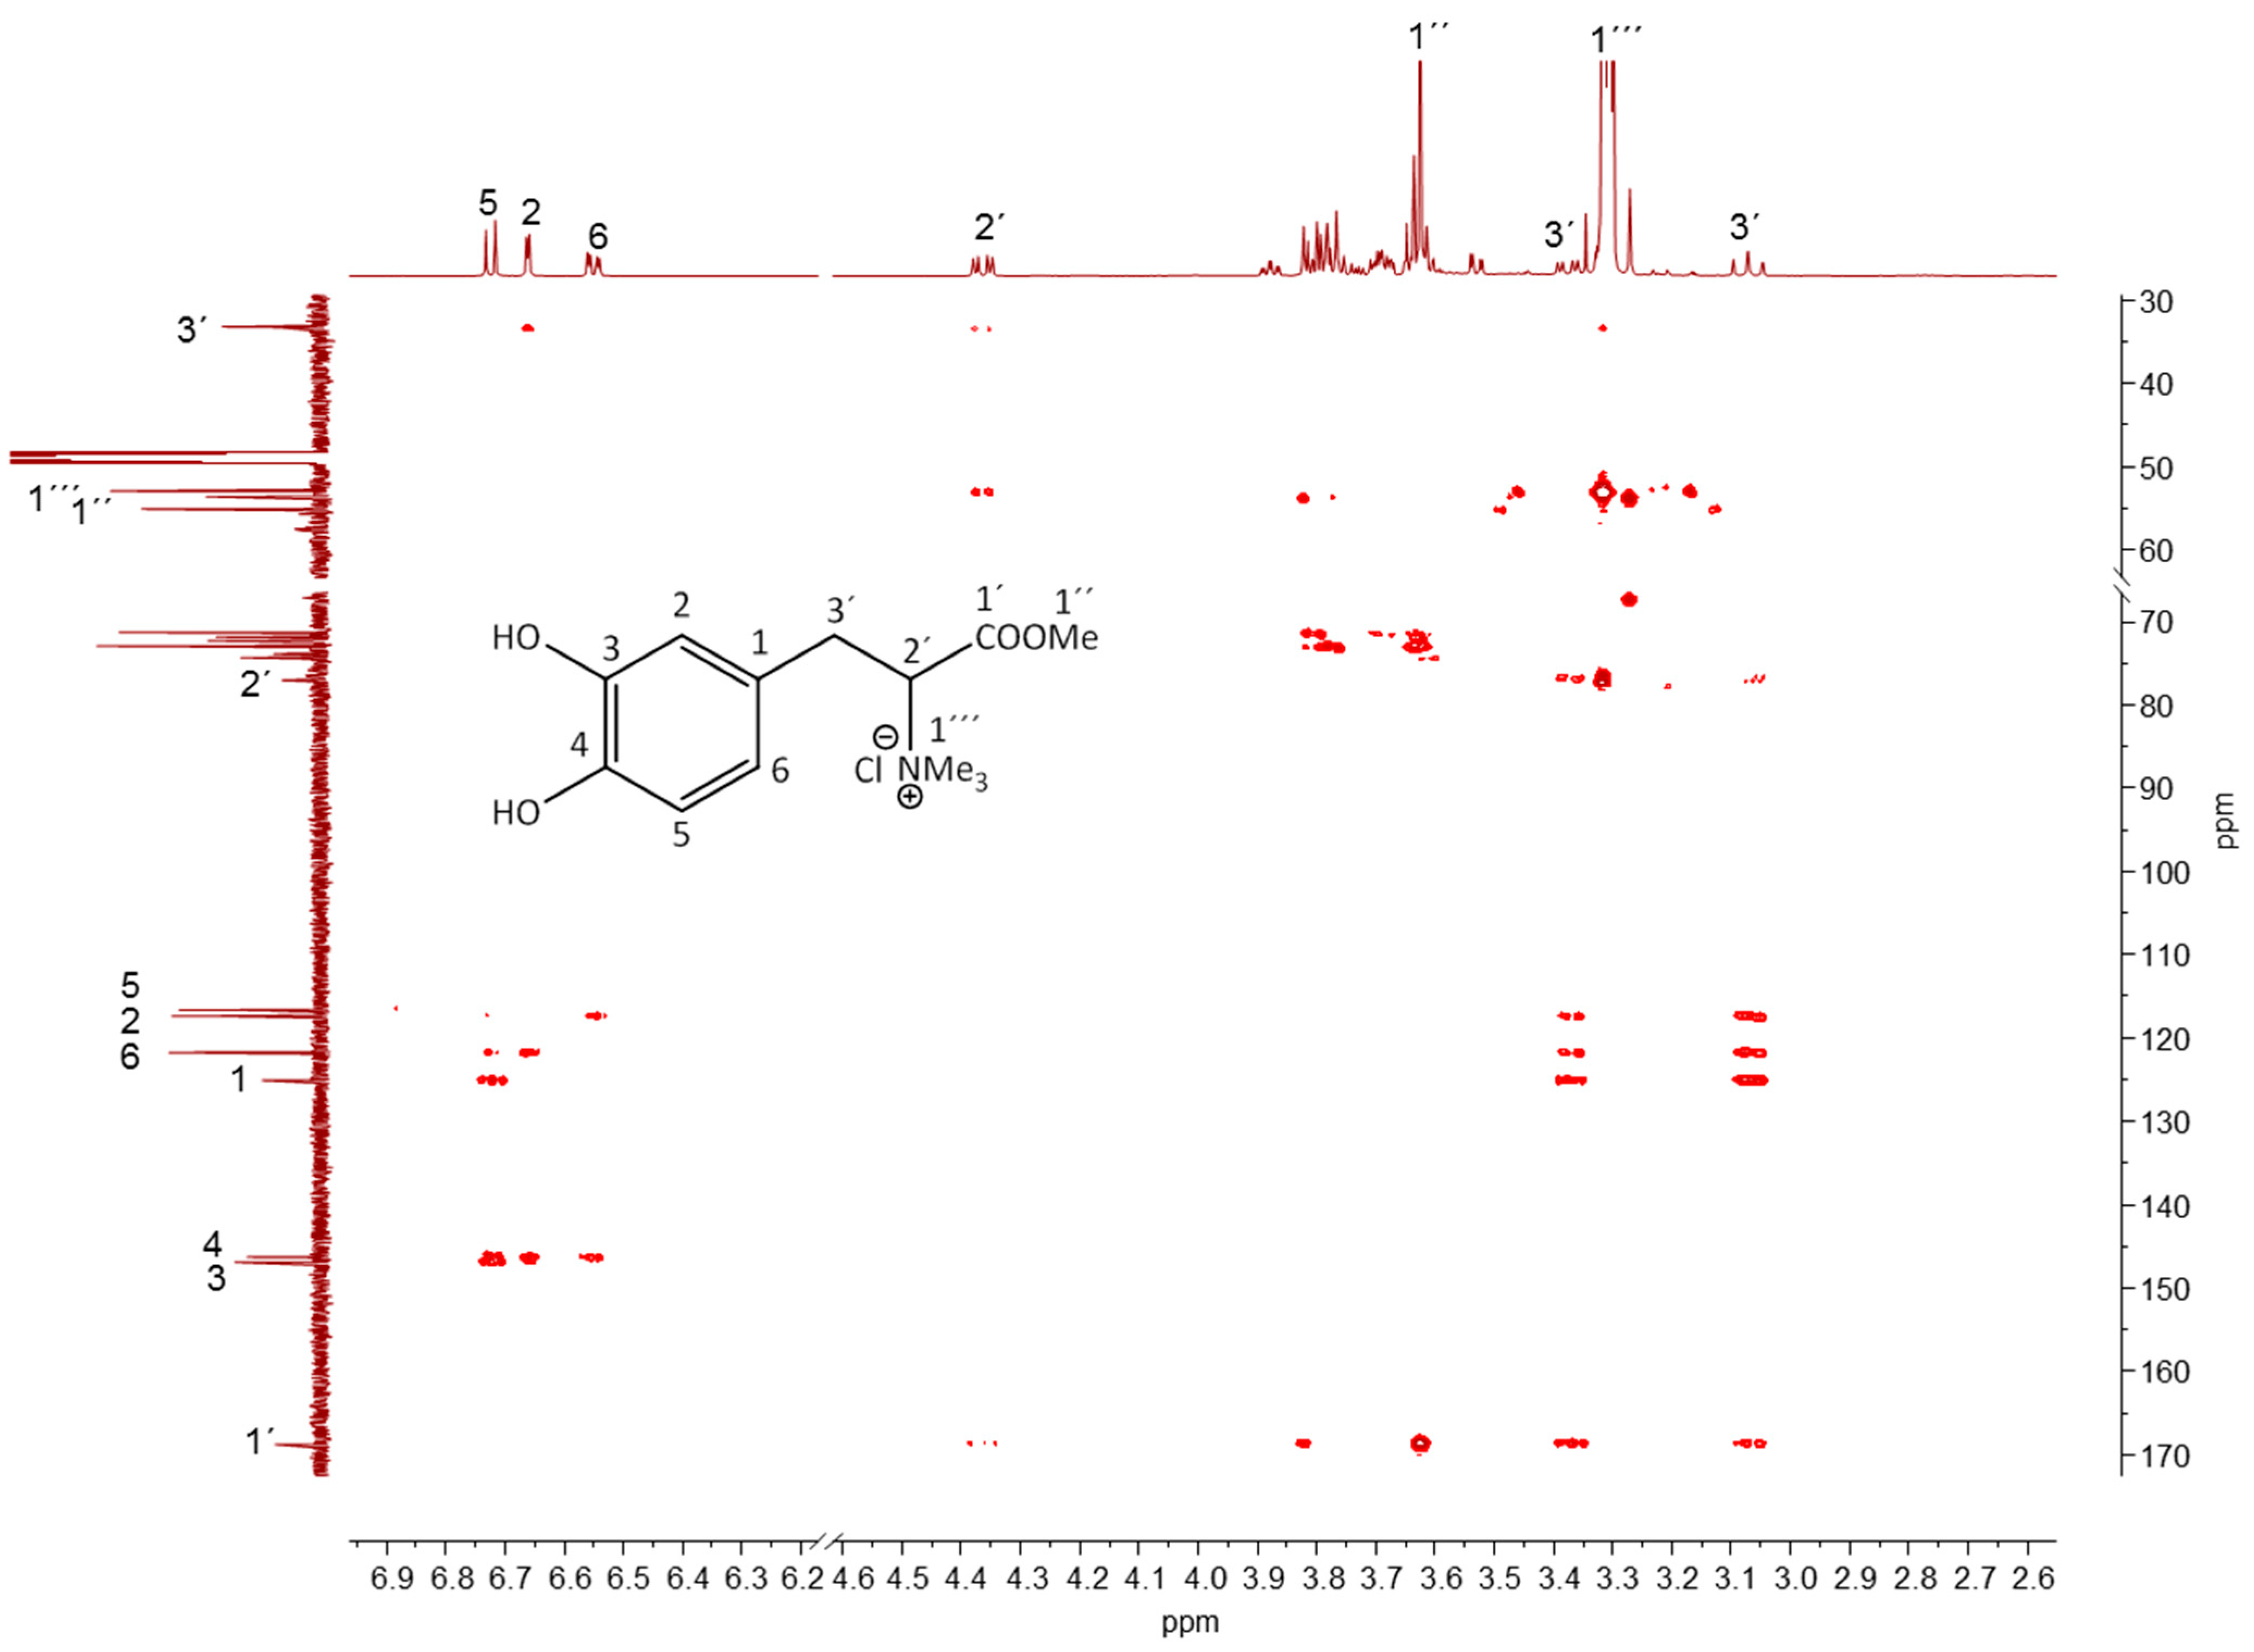
2.4. Identification of Marker Compounds by NMR
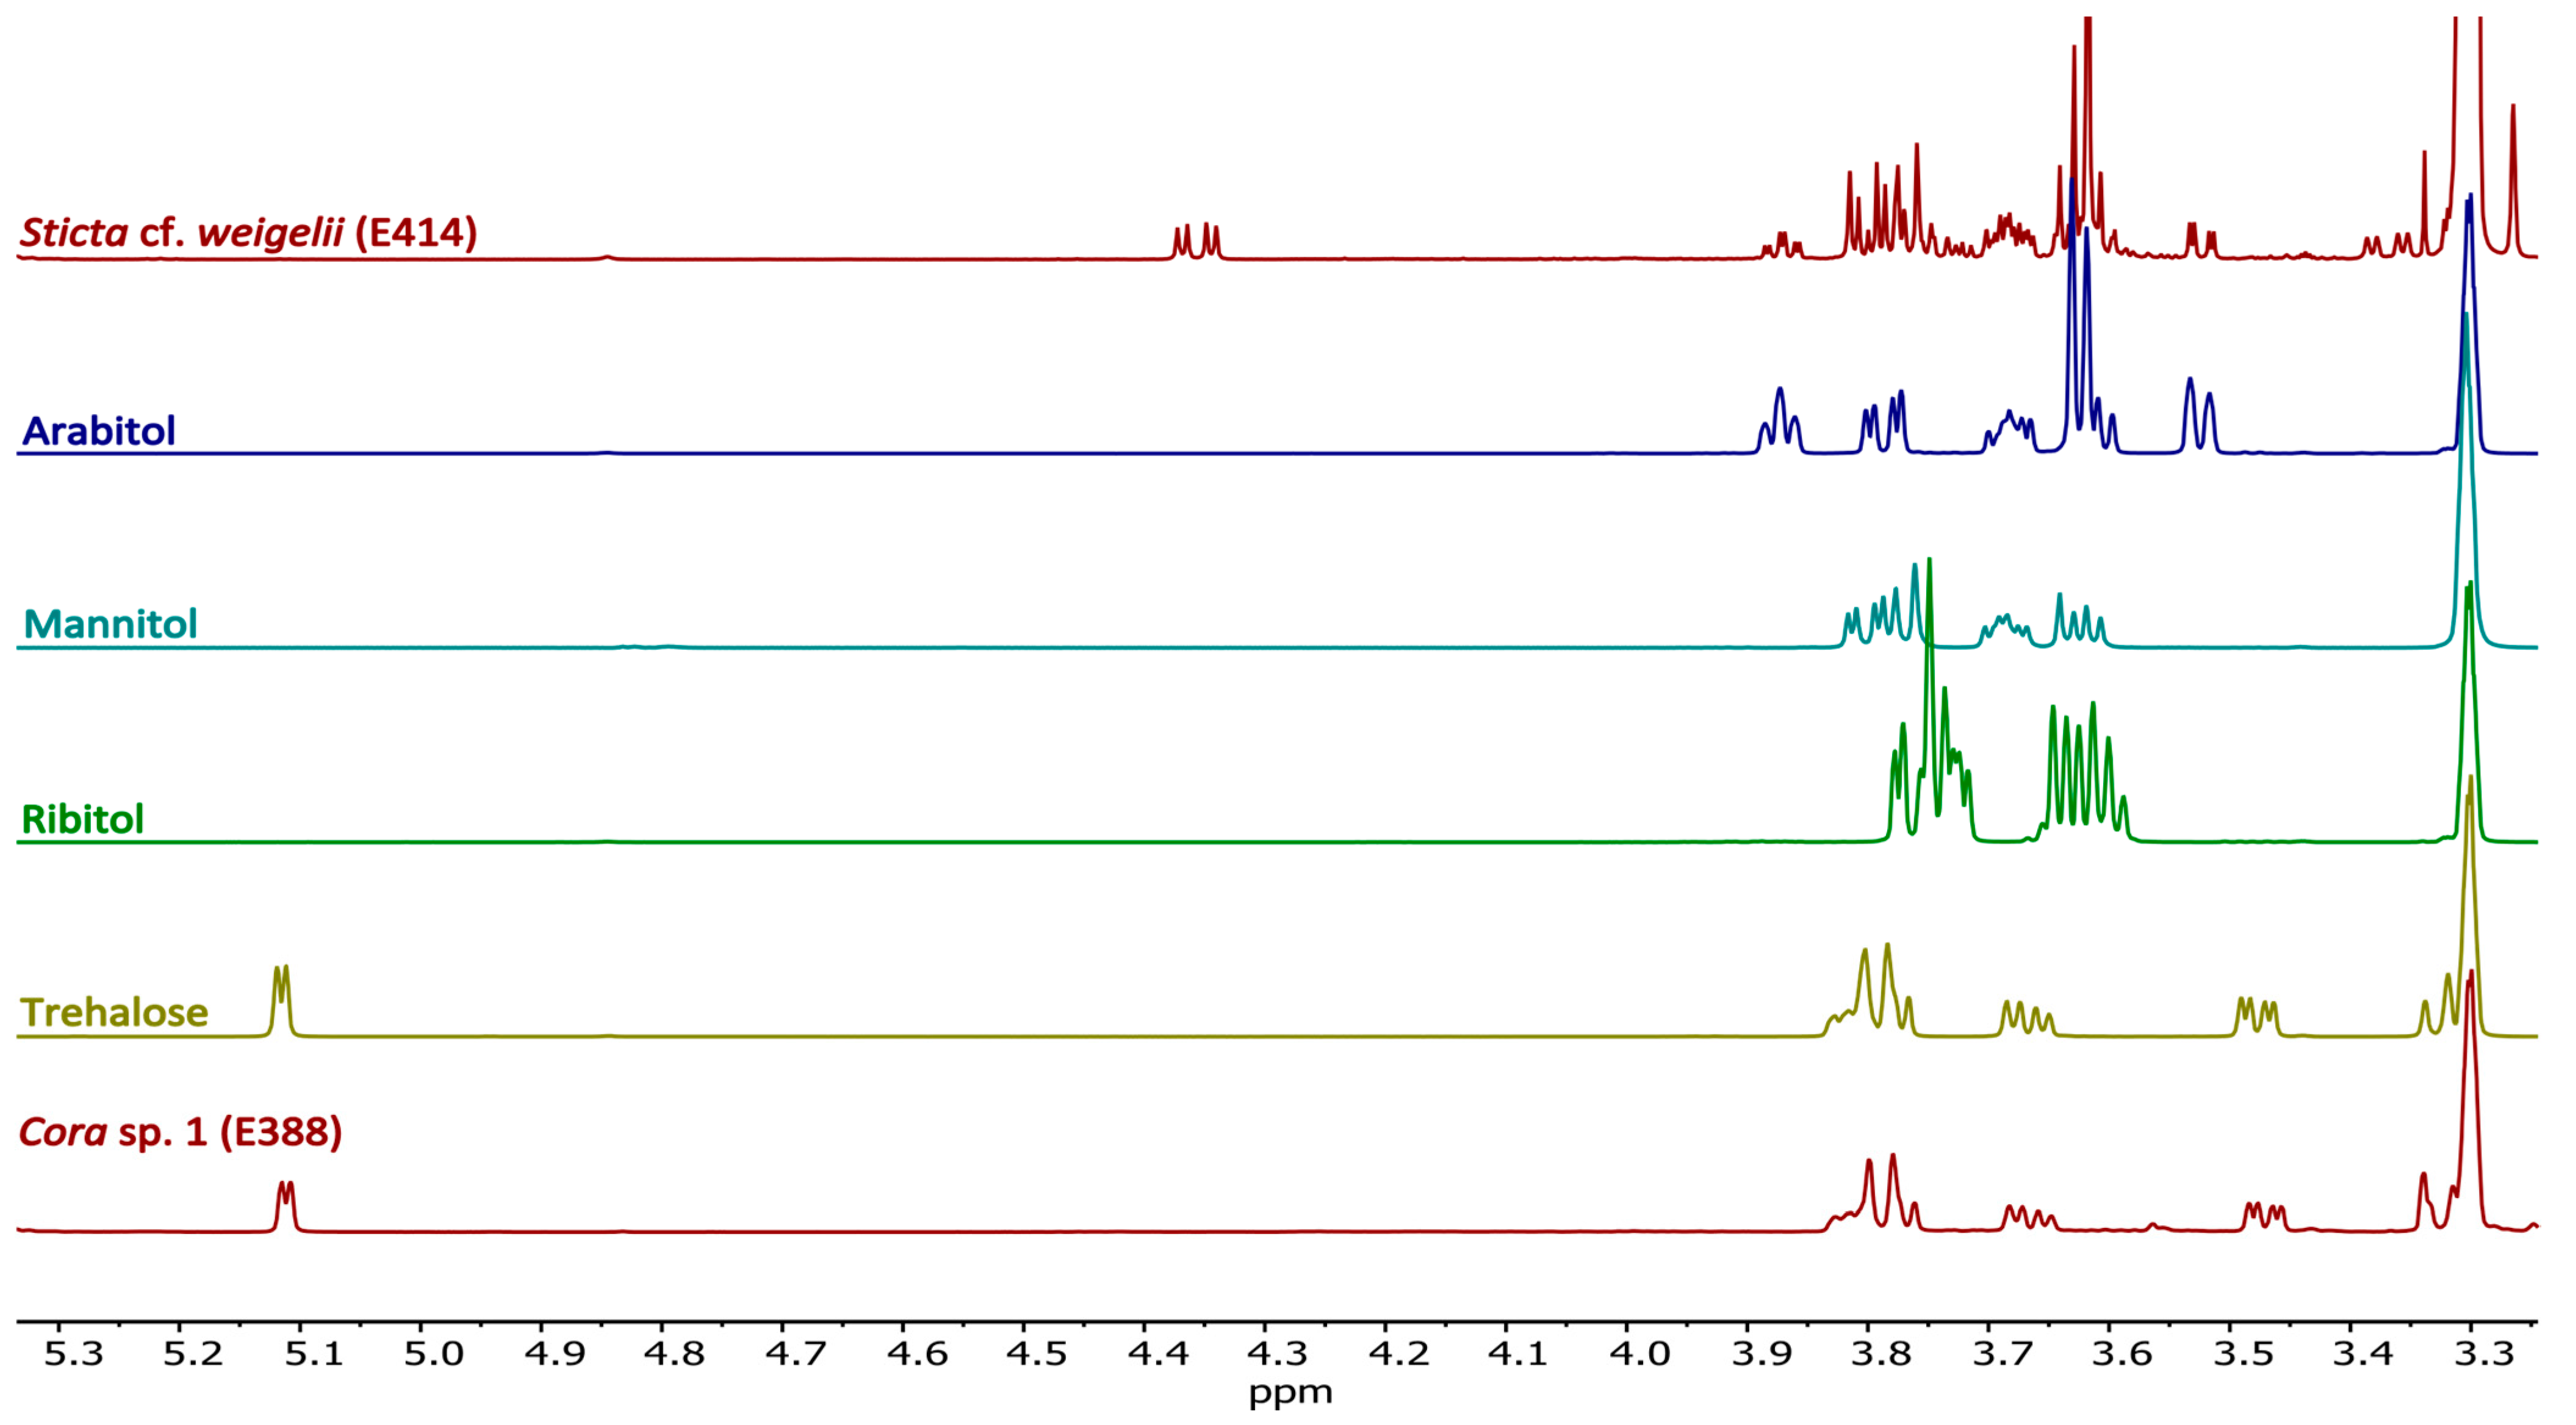
2.4.1. Sugars and Sugar Alcohols
2.4.2. Lichen-Specific Compounds

| Position | 1H (ppm) | Integral | Multiplicity | JH,H a (Hz) | 13C (ppm) | Correlations Observed | ||
|---|---|---|---|---|---|---|---|---|
| COSY | HMBC | NOESY | ||||||
| 5 | 6.72 | 1 | d | 8.1 (6) | 116.67 | H(6) | ||
| 2 | 6.66 | 1 | d | 2.1 (6) | 117.42 | H(3′), H(5), H(6) | H(3′) | |
| 6 | 6.55 | 1 | dd | 8.1 (5); 2.1 (2) | 121.79 | H(5) | H(3′), H(5), H(2) | H(3′) |
| 2′ | 4.36 | 1 | dd | 12.1 (3′); 4.1 (3′) | 77.06 | H(3′) | H(3′) | |
| 1″ | 3.63 | 1 | s | 53.56 | ||||
| 1′′′ | 3.32 | nd | s | 52.97 | H(2′) | |||
| 3′ | 3.38 | 1 | dd | 12.5 (3′); 4.1 (2′) | 33.35 | H(2′), H(3′) | H(2), H(2′), H(1′′′) | |
| 3′ | 3.07 | 1 | t | 12.1 (2′) | 33.35 | H(2′), H(3′) | H(2), H(2′), H(1′′′) | |
| 1′ | 164.74 | H(3′), H(2′), H(1″) | ||||||
| 3 | 146.88 | H(5), H(2) | ||||||
| 4 | 146.29 | H(5), H(2), H(6) | ||||||
| 1 | 125.05 | H(5), H(3′) | ||||||
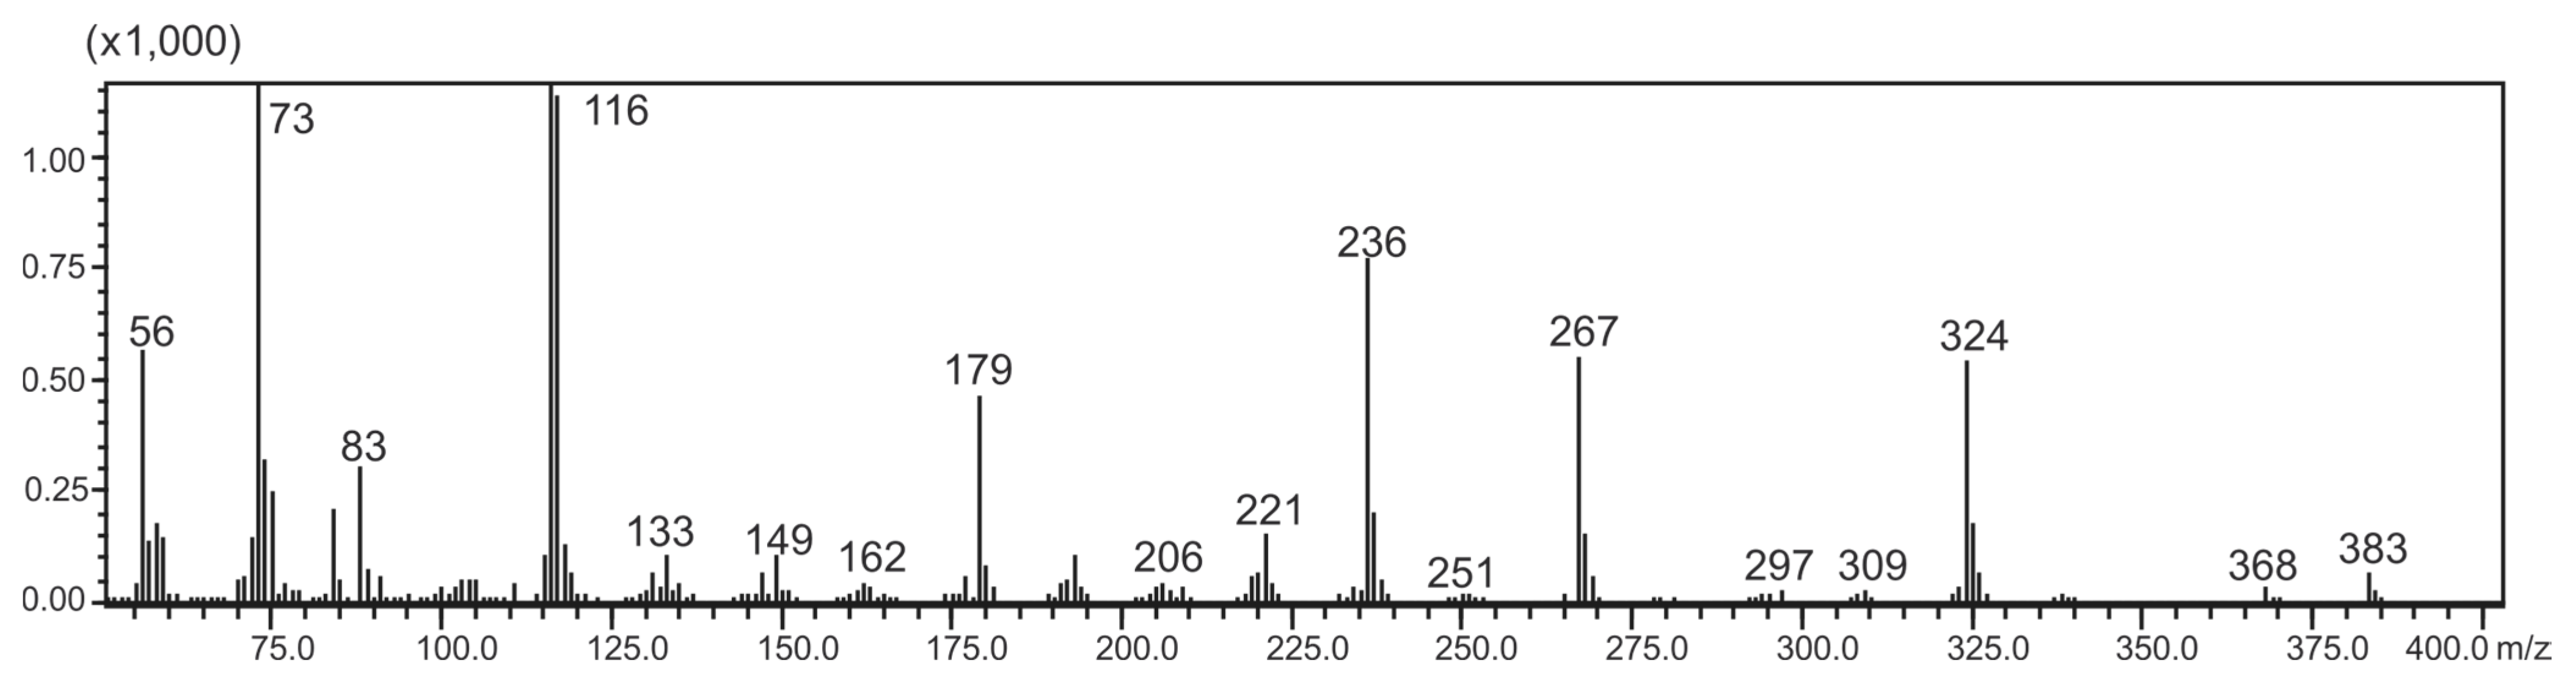
| Fragment Ion | m/z |
|---|---|
| Disilylated sticticin-CH3Cl [M]+ | 383 |
| [M − CH3]+ | 368 |
| [M − C(1′)OOCH3]+ | 324 |
| [M − C(1′)OOCH3C(2′)HN(CH3)2]+ | 267 |
| [C(1′)OOCH3C(2′)HN(CH3)2]+ | 116 |
| [Si(CH3)3]+ | 73 |
2.5. Identification of Marker Compounds by GC-MS

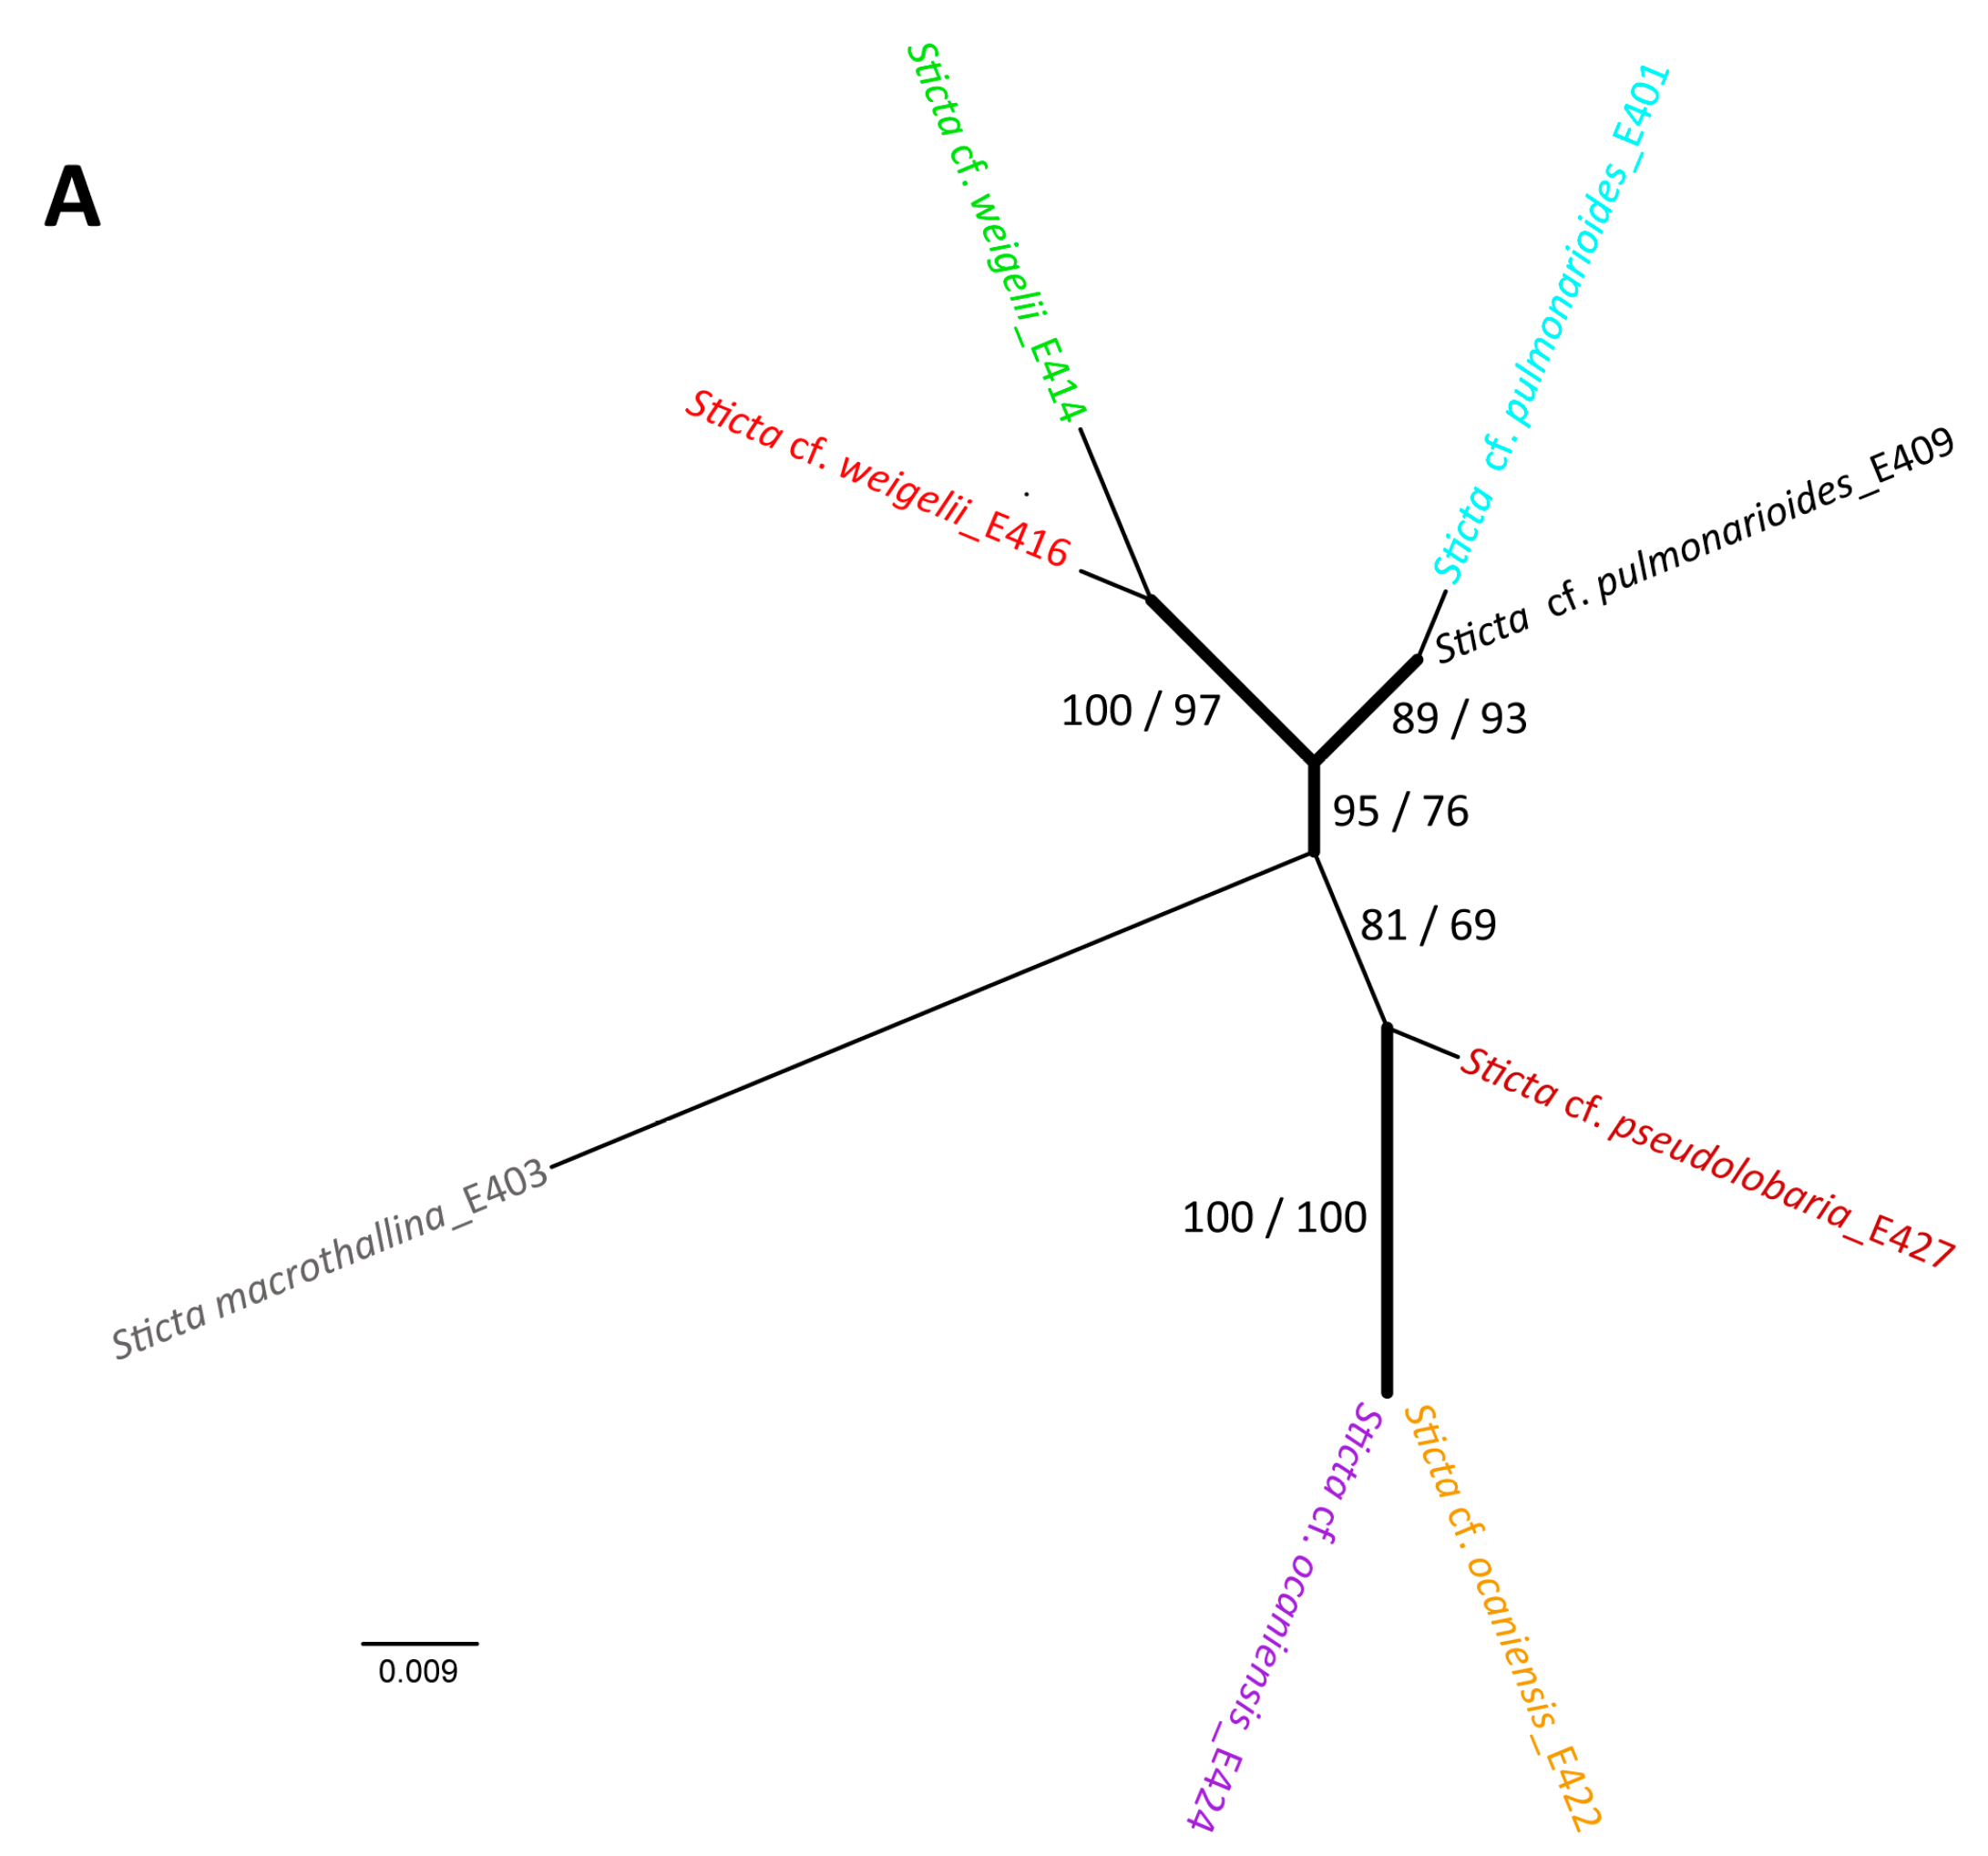
2.6. Taxon Analyses with Molecular Methods
3. Experimental Section
3.1. Chemicals
3.2. Lichen Collection and Storage
| Species | Col. Nr. | Locality | Col. Date |
|---|---|---|---|
| Cladonia lopezii | AB_E405 | Podocarpus National Park, Cajanuma; ca. 3000 m a.s.l. | 17 August.2012 |
| Cladonia rangiferina | Zirbenwald, Obergurgl, ca. 2.100 m a.s.l. | 15 September 2012 | |
| Cladonia subsquamosa | AB_E393 | Podocarpus National Park, San Francisco; ca. 2000 m a.s.l. | 16 August 2012 |
| Coenogonium cf. leprieurii | AB_E420 | Podocarpus National Park, Bombuscaro; ca. 1000 m a.s.l. | 20 August 2012 |
| Coenogonium leprieurii | AB_E426 | Podocarpus National Park, San Francisco; ca. 2000 m a.s.l. | 21 August 2012 |
| Coenogonium linkii | AB_E399 | Podocarpus National Park, Cajanuma; ca. 3000 m a.s.l. | 17 August 2012 |
| Dibaeis columbiana | AB_E406 | Podocarpus National Park, Cajanuma; ca. 3000 m a.s.l. | 17 August 2012 |
| Cora sp. 1 | AB_E388 | Podocarpus National Park, San Francisco; ca. 2000 m a.s.l. | 16 August 2012 |
| Cora sp. 2 | AB_E396 | Podocarpus National Park, Cajanuma; ca. 3000 m a.s.l. | 17 August 2012 |
| Dictyonema sp. 1 | AB_E400 | Podocarpus National Park, Cajanuma; ca. 3000 m a.s.l. | 17 August 2012 |
| Dictyonema sp. 2 | AB_E425 | Podocarpus National Park, San Francisco; ca. 2000 m a.s.l. | 21 August 2012 |
| Herpothallon sp. | AB_E139 | Podocarpus National Park, San Francisco; ca. 2000 m a.s.l. | 22 January 2011 |
| Lobaria cf. subdissecta | AB_E417 | Podocarpus National Park, Bombuscaro; ca. 1000 m a.s.l. | 20 August 2012 |
| Phyllobaeis erythrella | AB_E407 | Podocarpus National Park, Cajanuma; ca. 3000 m a.s.l. | 17 August 2012 |
| Rhizocarpon geographicum | Rotmoostal, Obergurgl, ca. 2300 m a.s.l. | 15 September 2012 | |
| Solorina crocea | Zirbenwald, Obergurgl, ca. 2100 m a.s.l. | 15 September 2012 | |
| Stereocaulon alpinum | Rotmoosferner, Obergurgl, ca. 2700 m a.s.l. | 15 September 2012 | |
| Stereocaulon ramulosum | AB_E386 | Podocarpus National Park, San Francisco; ca. 2000 m a.s.l. | 16 August 2012 |
| Sticta macrothallina | AB_E403 | Podocarpus National Park, Cajanuma; ca. 3000 m a.s.l. | 17 August 2012 |
| Sticta cf. ocaniensis | AB_E422 | Podocarpus National Park, San Francisco; ca. 2000 m a.s.l. | 21 August 2012 |
| Sticta cf. ocaniensis | AB_E424 | Podocarpus National Park, San Francisco; ca. 2000 m a.s.l. | 21 August 2012 |
| Sticta cf. pseudolobaria | AB_E427 | Podocarpus National Park, San Francisco; ca. 2000 m a.s.l. | 21 August 2012 |
| Sticta cf. pulmonarioides | AB_E401 | Podocarpus National Park, Cajanuma; ca. 3000 m a.s.l. | 17 August 2012 |
| Sticta cf. pulmonarioides | AB_E409 | Podocarpus National Park, Cajanuma; ca. 3000 m a.s.l. | 17 August 2012 |
| Sticta cf. weigelii | AB_E414 | Podocarpus National Park, Bombuscaro; ca. 1000 m a.s.l. | 19 August 2012 |
| Sticta cf. weigelii | AB_E416 | Podocarpus National Park, Bombuscaro; ca. 1000 m a.s.l. | 20 August 2012 |
| Thamnolia vermicularis | Rotmoosferner, Obergurgl, ca. 2700 m a.s.l. | 15 September 2012 | |
| Xanthoria elegans | Rotmoostal, Orbergurgl, ca. 1700 m a.s.l. | 15 September 2012 | |
| Xanthoria parietina | Rotmoostal, Orbergurgl, ca. 1500 m a.s.l. | 15 September 2012 |
3.3. Taxon Analyses
| Species | Col. Nr. | Genbank Nr. |
|---|---|---|
| Sticta macrothallina | AB_E403 | KT750878 |
| Sticta cf. ocaniensis | AB_E422 | KT750880 |
| Sticta cf. ocaniensis | AB_E424 | KT750881 |
| Sticta cf. pseudolobaria | AB_E427 | KT750879 |
| Sticta cf. pulmonarioides | AB_E401 | KT750876 |
| Sticta cf. pulmonarioides | AB_E409 | KT750877 |
| Sticta cf. weigelii | AB_E414 | KT750874 |
| Sticta cf. weigelii | AB_E416 | KT750875 |
3.4. Extraction Methods
3.4.1. Hexane Extraction
3.4.2. Methanol Extraction
3.5. NMR Spectroscopy
3.6. PCA
3.7. GC-MS
4. Conclusions
Acknowledgments
Author Contributions
Conflicts of Interests
References
- Wu, C.; Kim, H.K.; van Wezel, G.P.; Choi, Y.H. Metabolomics in the natural products field—A gateway to novel antibiotics. Drug Discov. Today 2015, 13, 11–17. [Google Scholar] [CrossRef] [PubMed]
- Zamboni, N.; Saghatelian, A.; Patti, G.J. Defining the metabolome: Size, flux, and regulation. Mol. Cell 2015, 58, 699–706. [Google Scholar] [CrossRef] [PubMed]
- Töpfer, N.; Kleessen, S.; Nikoloski, Z. Integration of metabolomics data into metabolic networks. Front. Plant Sci. 2015, 6. [Google Scholar] [CrossRef]
- Elix, J.A. Biochemistry and secondary metabolites. In Lichen Biology; Nash, T.H., III, Ed.; University Press: Cambridge, UK, 1996; pp. 154–180. [Google Scholar]
- Huneck, S.; Yoshimura, I. Identification of Lichen Substances; Springer: Berlin, Germany, 1996; pp. 1–494. [Google Scholar]
- Stocker-Wörgötter, E. Metabolic diversity of lichen forming ascomycetous fungi: Culturing, polyketide and shikimate metabolite production, and PKS genes. Nat. Prod. Rep. 2008, 25, 188–200. [Google Scholar] [CrossRef] [PubMed]
- Eisenreich, W.; Knispel, N.; Beck, A. Advanced methods for the study of the chemistry and the metabolism of lichens. Phytochem. Rev. 2011, 10, 445–456. [Google Scholar] [CrossRef]
- Rees, T.A.V.; Stewart, A.; Coddington, J.M. A 13C-NMR study of major soluble metabolites in New Zealand lichens. In Endocytobiology IV: 4th International Colloquium on Endocytobiology and Symbiosis; Nardon, P., Gianinazzi-Pearson, V., Grenier, A.M., Margulis, L., Smith, D.C., Eds.; Institute National de la Recherche Agronomique: Paris, France, 1990; pp. 169–174. [Google Scholar]
- Alcantara, G.B.; Honda, N.K.; Ferreira, M.M.C.; Ferreira, A.G. Chemometric analysis applied in 1H HR-MAS NMR and FT-IR data for chemotaxonomic distinction of intact lichen samples. Anal. Chim. Acta 2007, 595, 3–8. [Google Scholar] [CrossRef]
- König, G.M.; Wright, A.D. 1H- and 13C-NMR and biological activity investigations of four lichen-derived compounds. Phytochem. Anal. 1999, 10, 279–284. [Google Scholar] [CrossRef]
- Wishart, D.S.; Jewison, T.; Guo, A.C.; Wilson, M.; Knox, C.; Liu, Y.; Djoumbou, Y.; Mandal, R.; Aziat, F.; Dong, E.; et al. HMDB 3.0—The Human Metabolome Database in 2013. Nucleic Acids Res. 2013, 41, D801–D807. [Google Scholar]
- Bernard, T.; Joucla, M.; Goas, G.; Hamelin, J. Caractérisation de la sticticine chez le lichen Lobaria laetevirens. Phytochemistry 1980, 19, 1967–1969. [Google Scholar] [CrossRef]
- Sundholm, E.G.; Huneck, S. 13C-NMR-spectra of lichen depsides, depsidones and depsones. 2. Compounds of the β-orcinol series. Chem. Scr. 1981, 18, 233–236. [Google Scholar]
- Richardson, D.H.S.; Smith, D.C. Lichen physiology. IX. Carbohydrate movement from the Trebouxia symbiont of Xanthoria aureola to the fungus. New Phytol. 1968, 67, 61–68. [Google Scholar] [CrossRef]
- Armstrong, R.A.; Smith, S.N. The levels of ribitol, arabitol and mannitol in individual lobes of the lichen Parmelia conspersa (Ehrh. ex Ach.) Ach. Environ. Exp. Bot. 1994, 34, 253–260. [Google Scholar] [CrossRef]
- Jäger, H.J.; Weigel, H.J. Amino acid metabolism in lichens. Bryologist 1978, 81, 107–113. [Google Scholar] [CrossRef]
- Moncada, B.; Lücking, R.; Suárez, A. Molecular phylogeny of the genus Sticta (lichenized Ascomycota: Lobariaceae) in Colombia. Fungal Divers. 2014, 64, 205–231. [Google Scholar] [CrossRef]
- Bendix, J.; Rollenbeck, R.; Richter, M.; Fabian, P.; Emck, P. Climate. In Gradients in a Tropical Mountain Ecosystem of Ecuador; Beck, E., Bendix, J., Kottke, I., Makeschin, F., Mosandl, R., Eds.; Ecological Studies 198; Springer-Verlag: Berlin, Germany; Heidelberg, Germany, 2008; pp. 63–73. [Google Scholar]
- Beck, A.; Mayr, C. Nitrogen and carbon isotope variability in the green-algal lichen Xanthoria parietina and their implications on mycobiont-photobiont interactions. Ecol. Evol. 2012, 2, 3132–3144. [Google Scholar] [CrossRef] [PubMed]
- Staden Package. Available online: http://staden.sourceforge.net (accessed on 1 October 2015).
- Gendoc. Available online: http://www.nrbsc.org/downloads (accessed on 1 October 2015).
- Swofford, D.L. PAUP: Phylogenetic Analysis Using Parsimony (and Other Methods), Version 4; Sinauer Associates: Sunderland, MA, USA, 2000; pp. 1–128. [Google Scholar]
- Guindon, S.; Gascuel, O. A simple, fast and accurate method to estimate large phylogenies by maximum likelihood. Syst. Biol. 2003, 52, 696–704. [Google Scholar] [CrossRef] [PubMed]
- Darriba, D.; Taboada, G.L.; Doallo, R.; Posada, D. jModelTest 2: More models, new heuristics and parallel computing. Nat. Methods 2012, 9. [Google Scholar] [CrossRef] [PubMed]
- Felsenstein, J. Confidence-limits on phylogenies: An approach using the bootstrap. Evolution 1985, 39, 783–791. [Google Scholar] [CrossRef]
- Sample Availability: Samples of the compounds are available from the authors upon request.
© 2015 by the authors. Licensee MDPI, Basel, Switzerland. This article is an open access article distributed under the terms and conditions of the Creative Commons Attribution license ( http://creativecommons.org/licenses/by/4.0/).
Share and Cite
Mittermeier, V.K.; Schmitt, N.; Volk, L.P.M.; Suárez, J.P.; Beck, A.; Eisenreich, W. Metabolic Profiling of Alpine and Ecuadorian Lichens. Molecules 2015, 20, 18047-18065. https://doi.org/10.3390/molecules201018047
Mittermeier VK, Schmitt N, Volk LPM, Suárez JP, Beck A, Eisenreich W. Metabolic Profiling of Alpine and Ecuadorian Lichens. Molecules. 2015; 20(10):18047-18065. https://doi.org/10.3390/molecules201018047
Chicago/Turabian StyleMittermeier, Verena K., Nicola Schmitt, Lukas P. M. Volk, Juan Pablo Suárez, Andreas Beck, and Wolfgang Eisenreich. 2015. "Metabolic Profiling of Alpine and Ecuadorian Lichens" Molecules 20, no. 10: 18047-18065. https://doi.org/10.3390/molecules201018047