Hypoglycemic and Hypotensive Activity of a Root Extract of Smilax aristolochiifolia, Standardized on N-trans-Feruloyl-Tyramine


Abstract
:1. Introduction
2. Results and Discussion
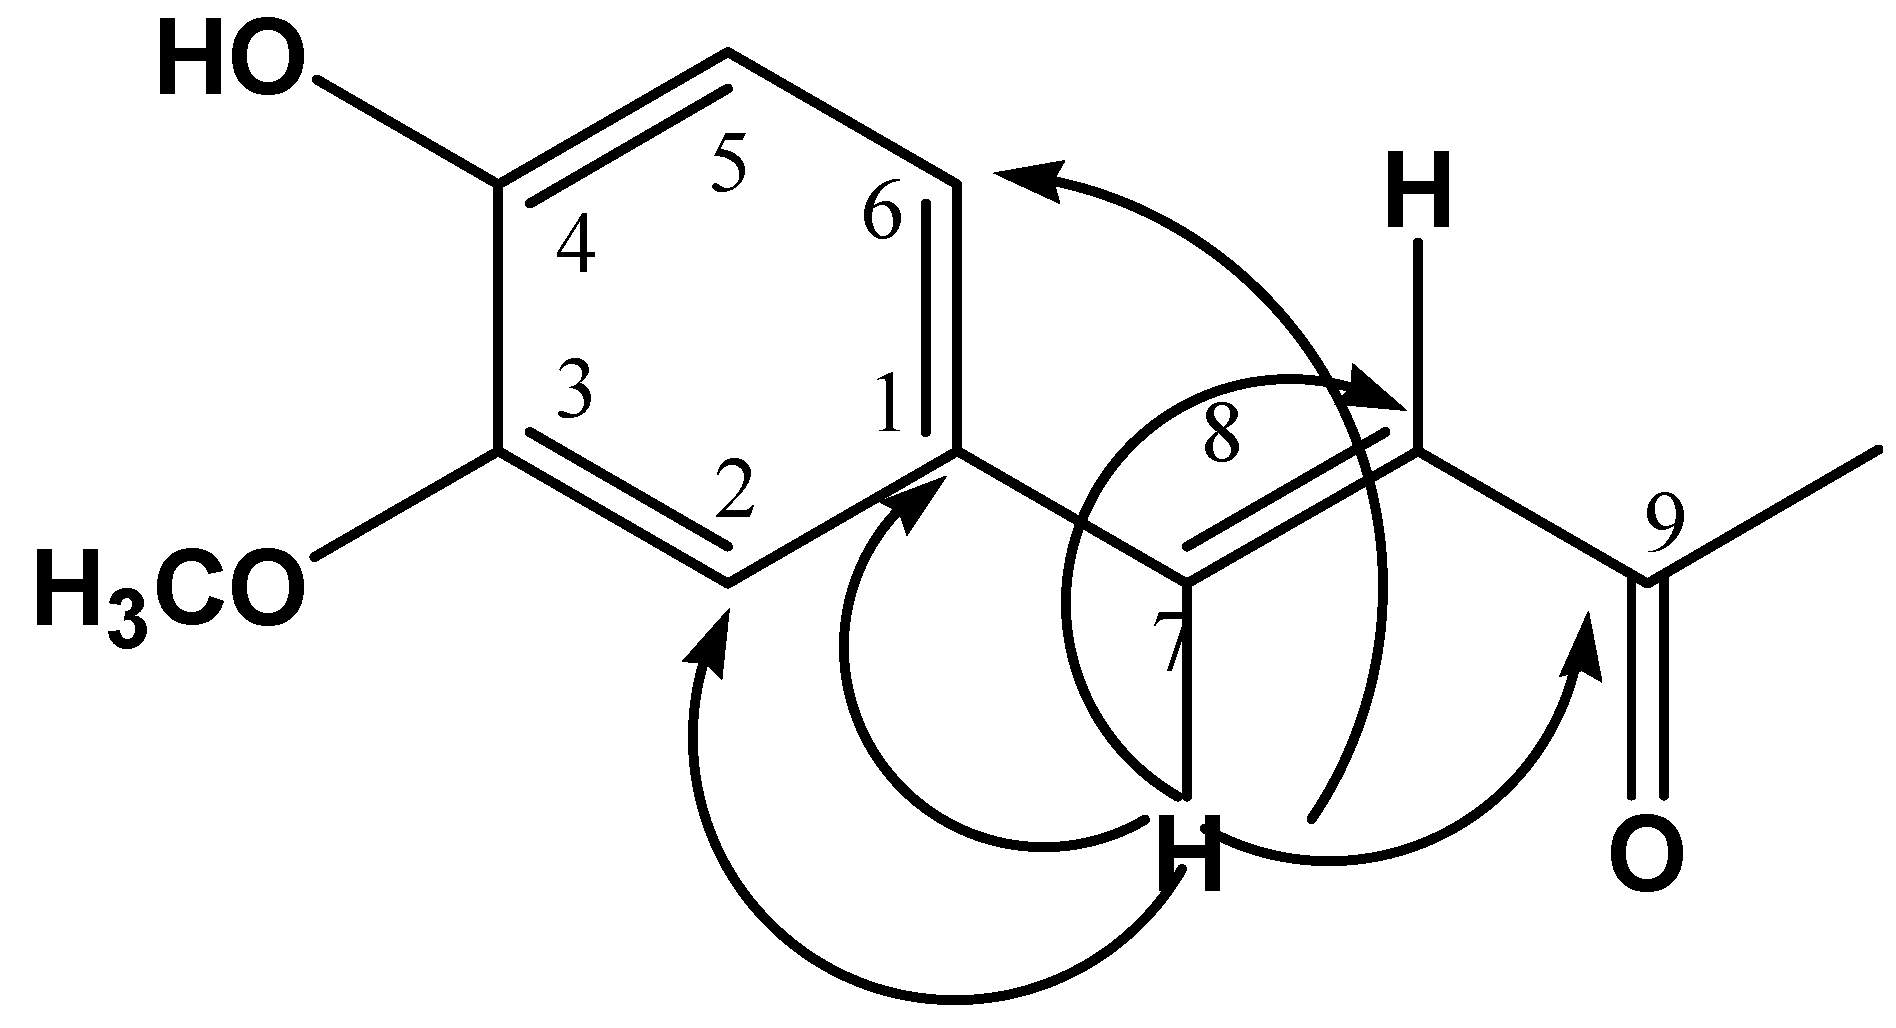
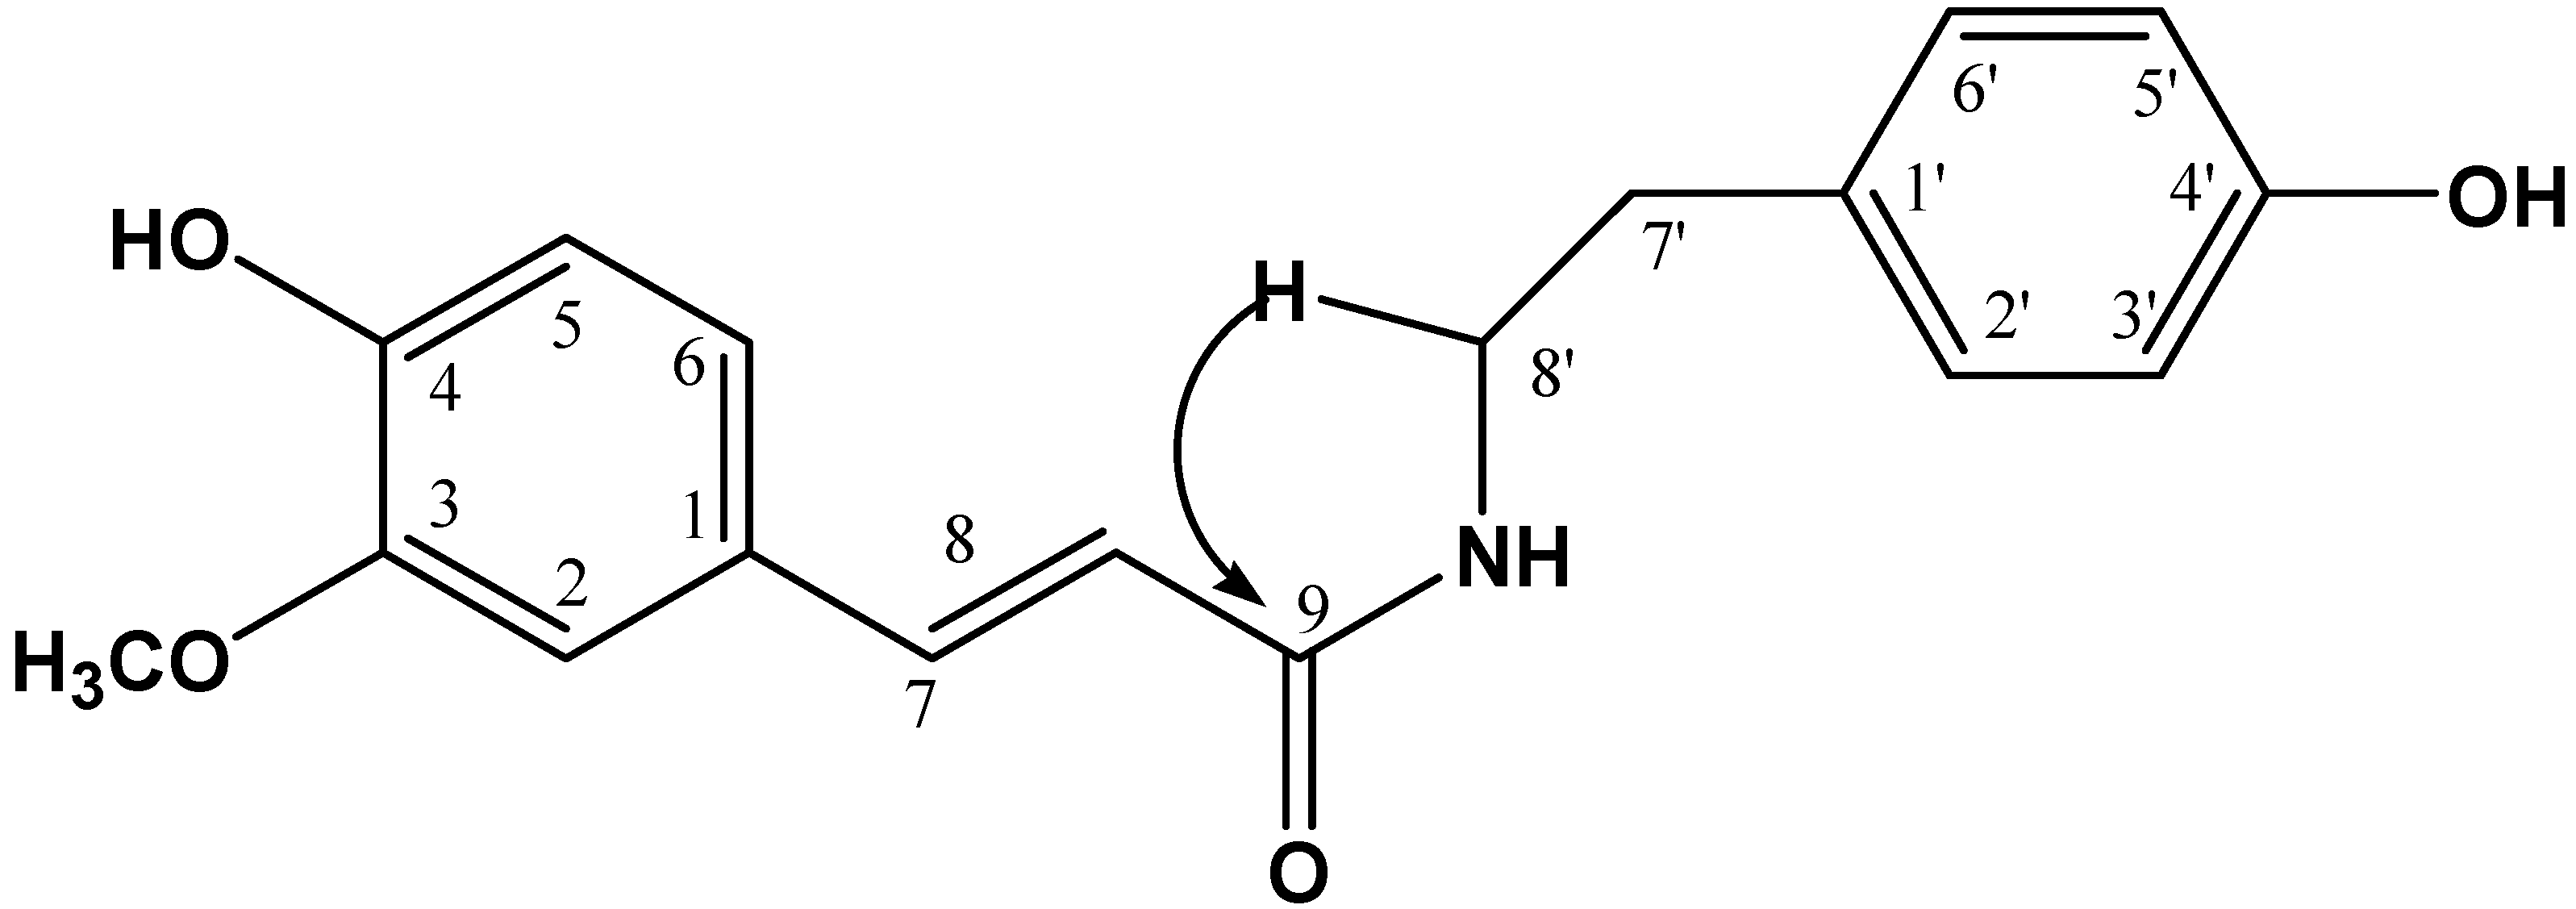
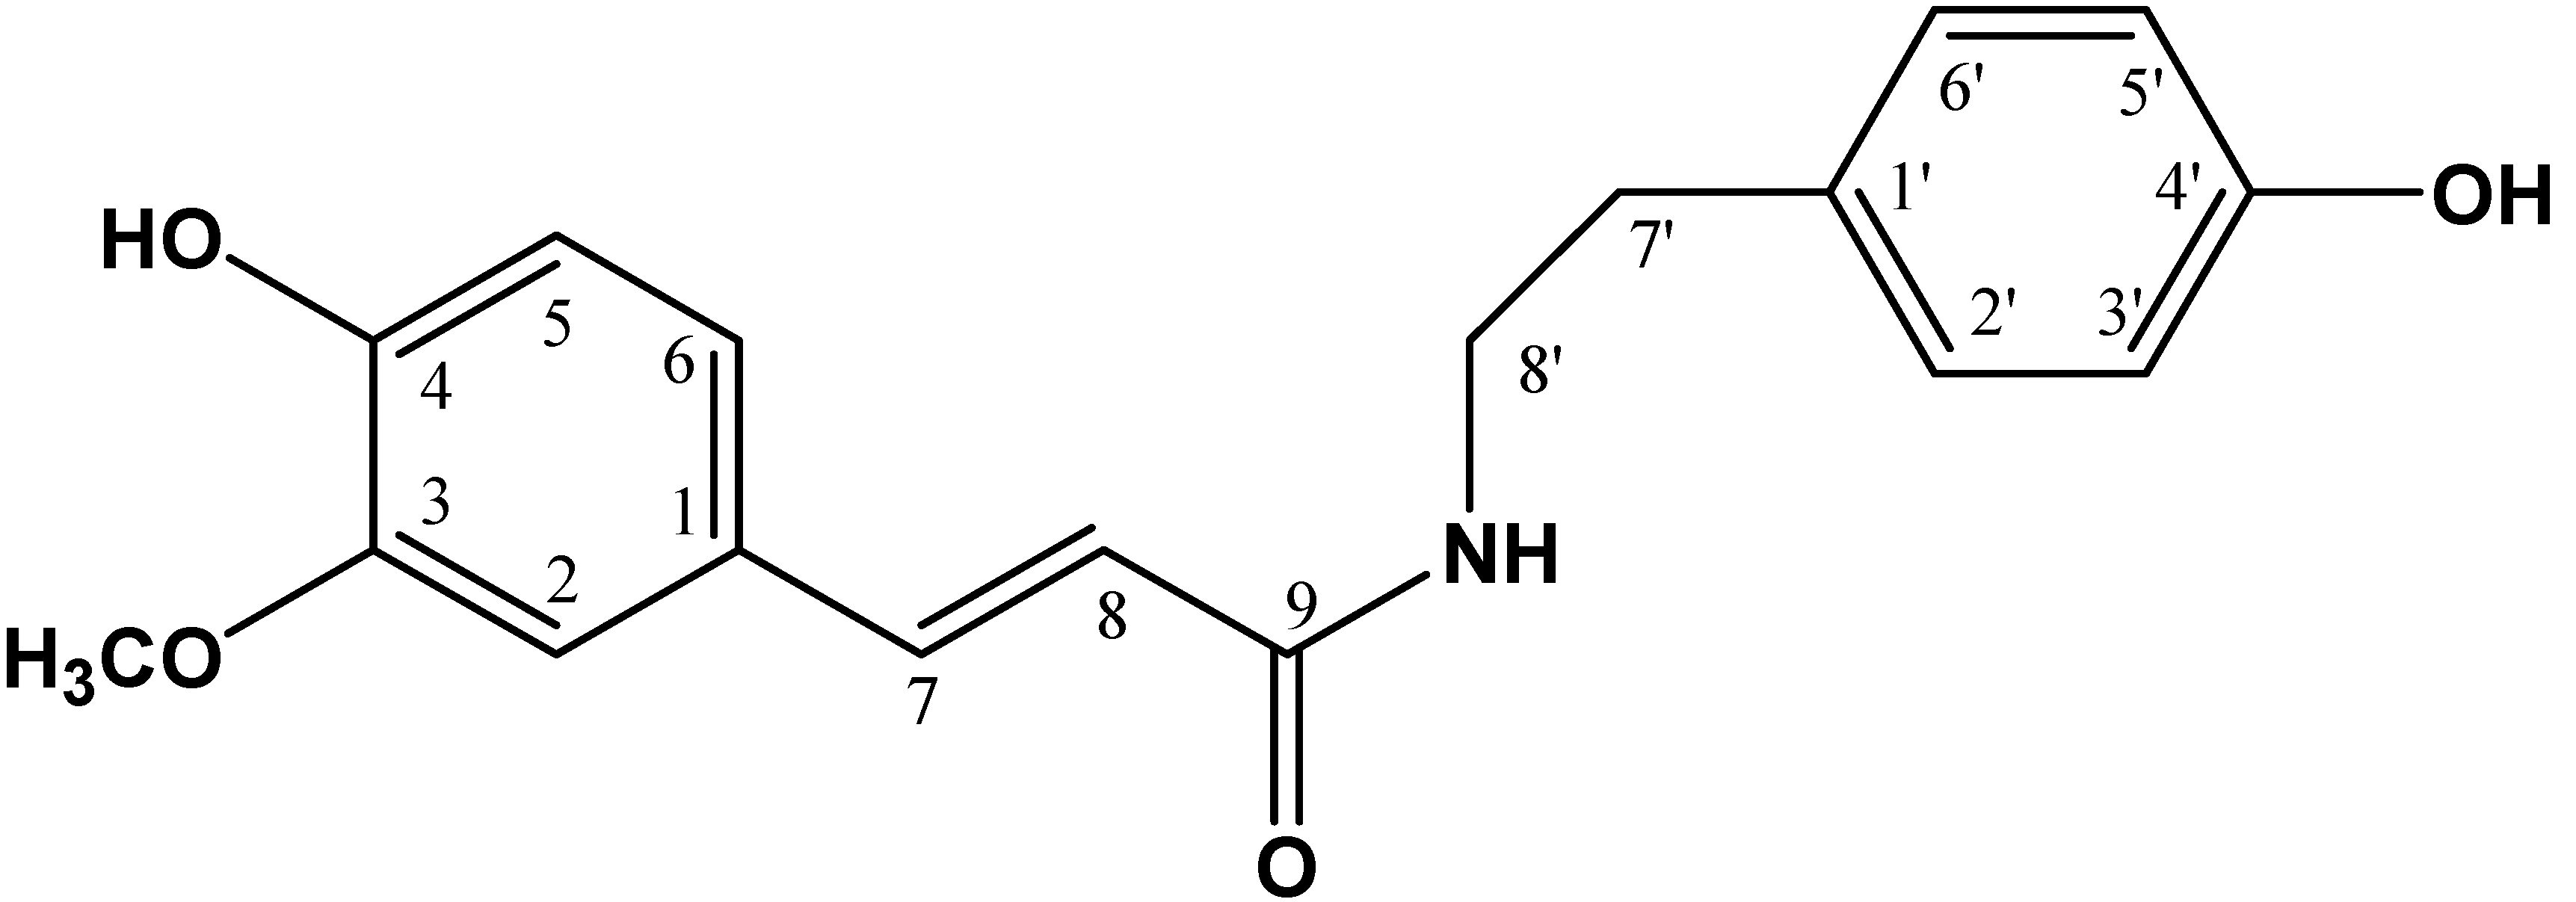
2.1. Chemical Characterization

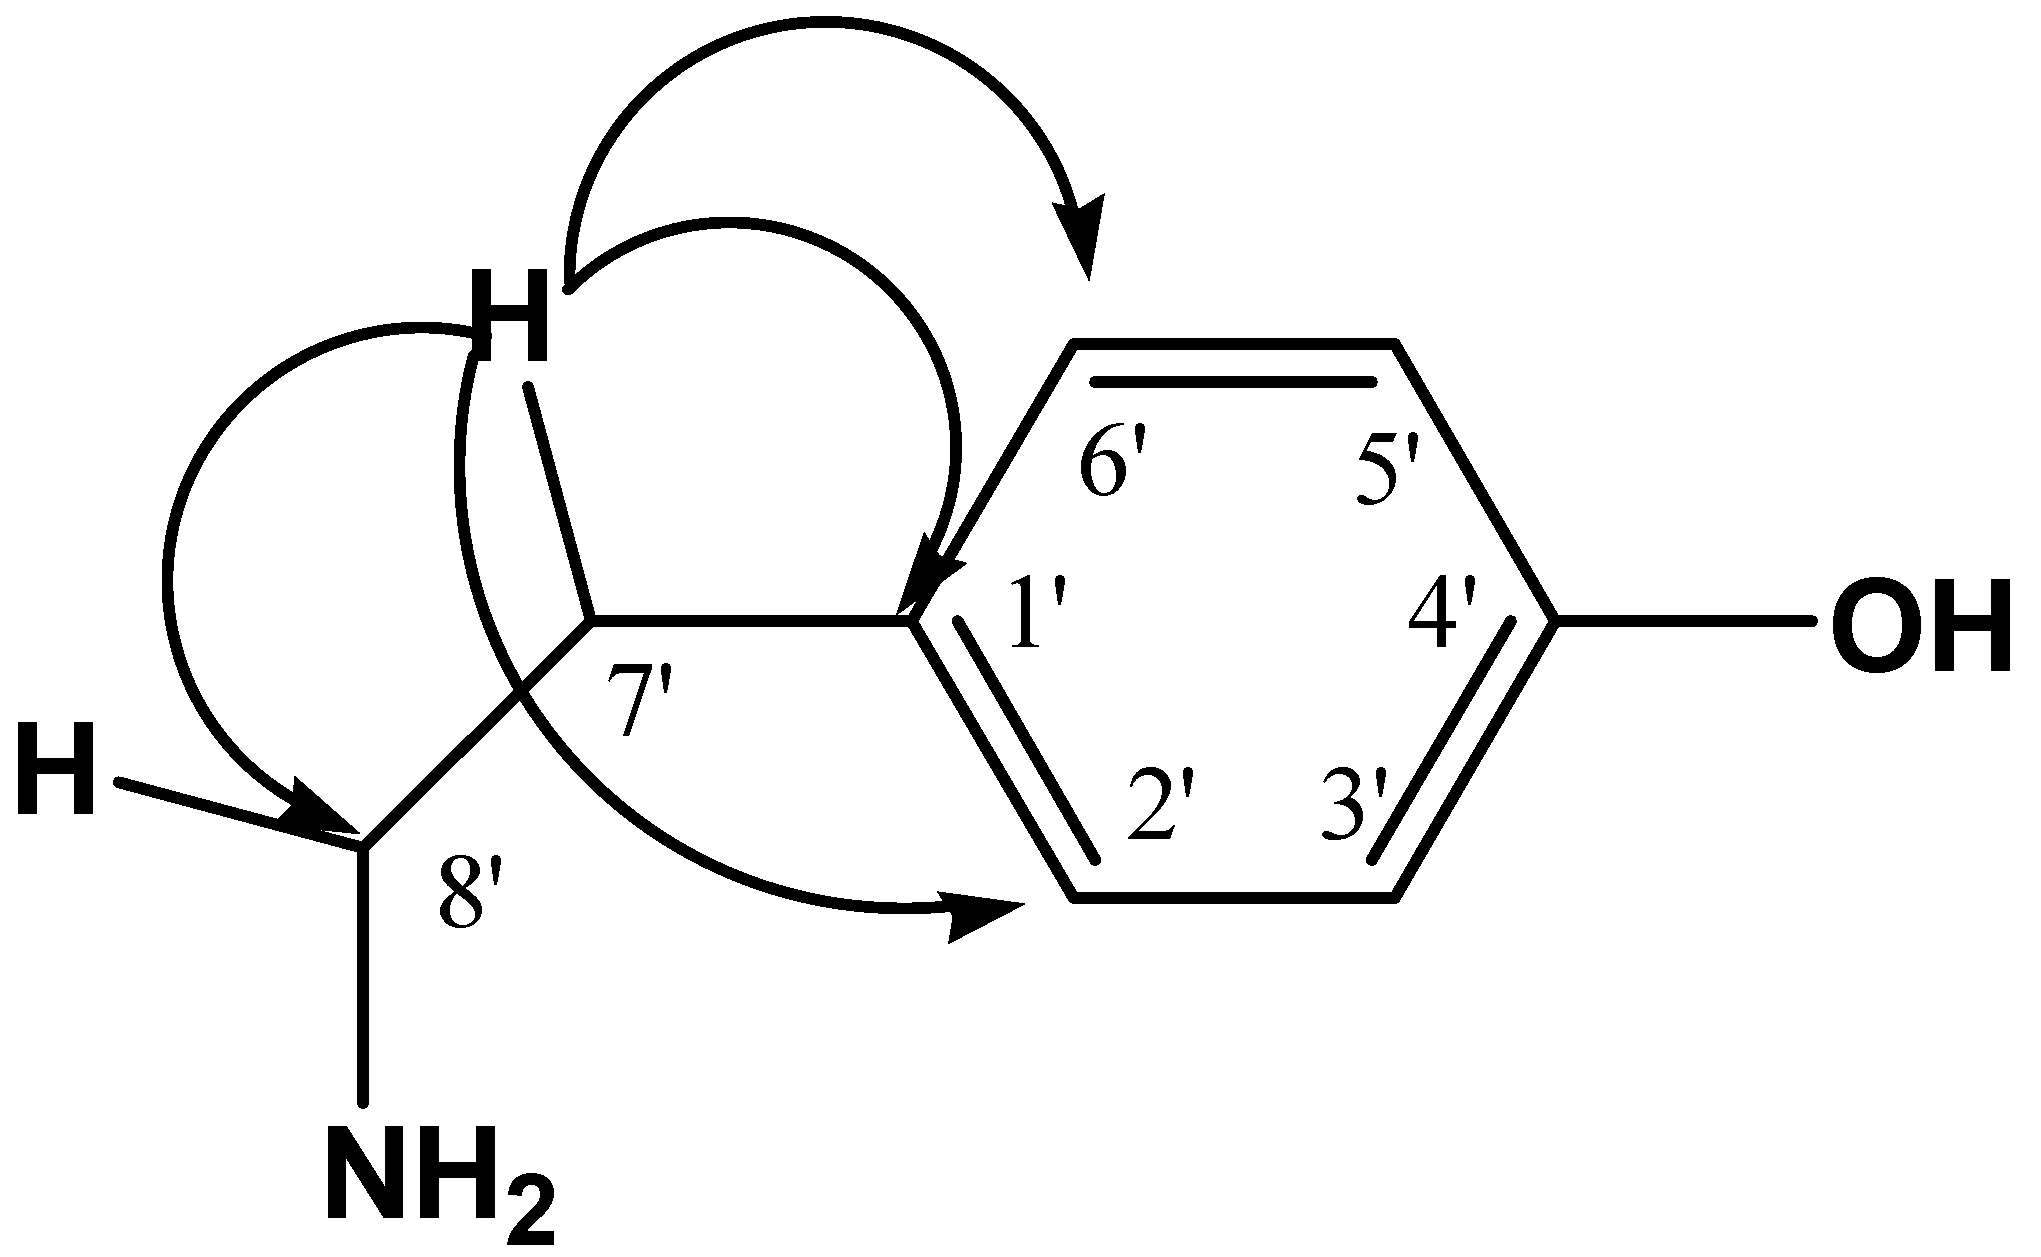

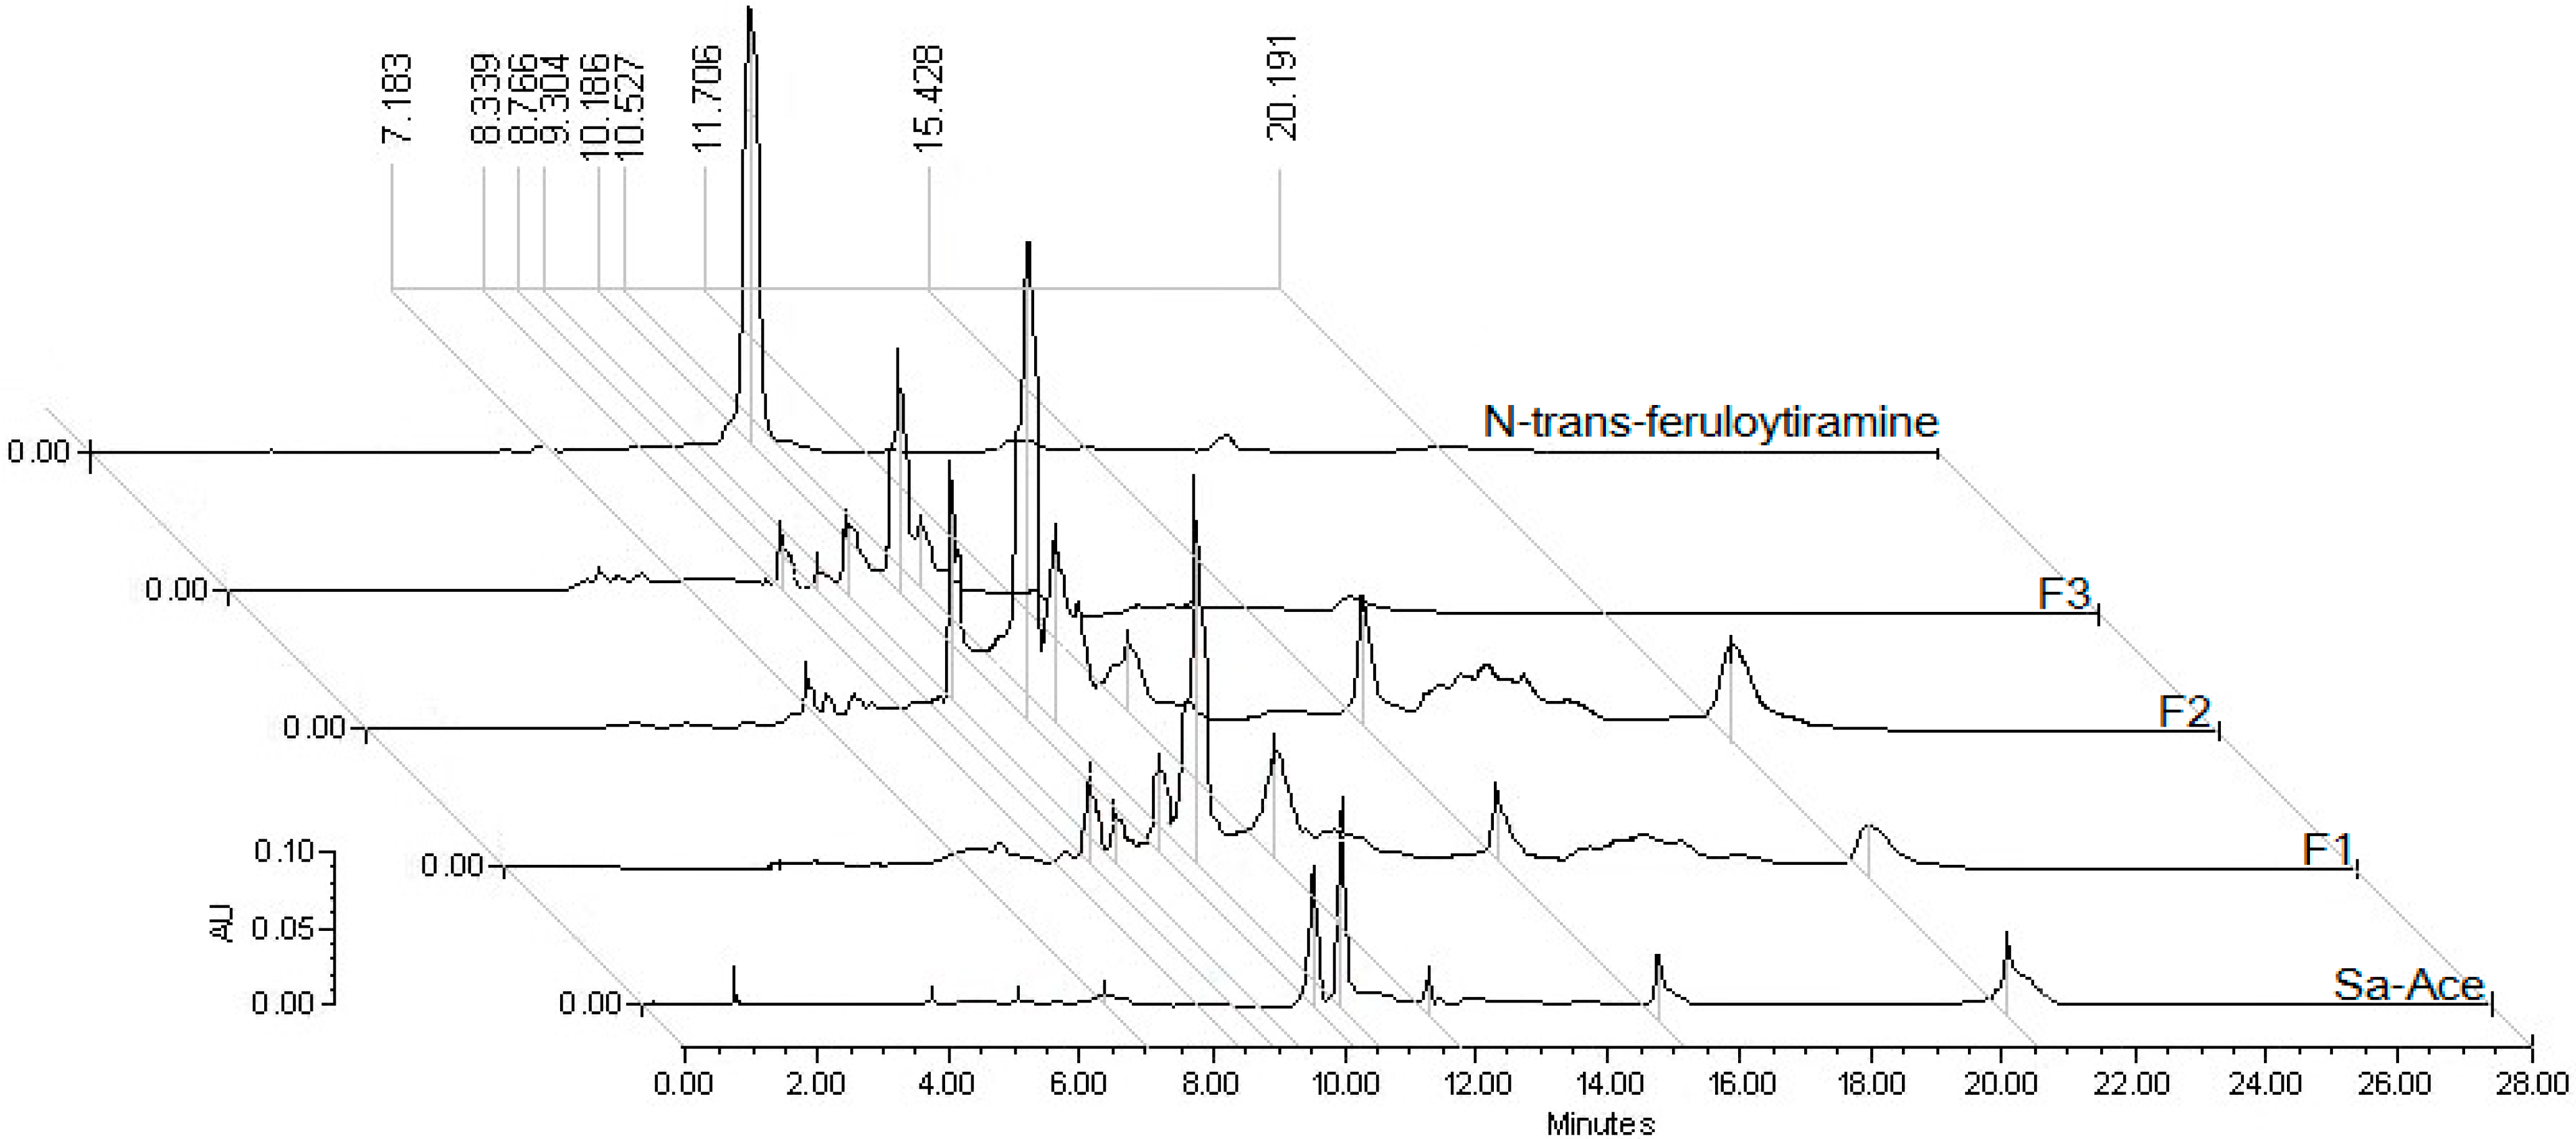
2.2. Chemical Analysis

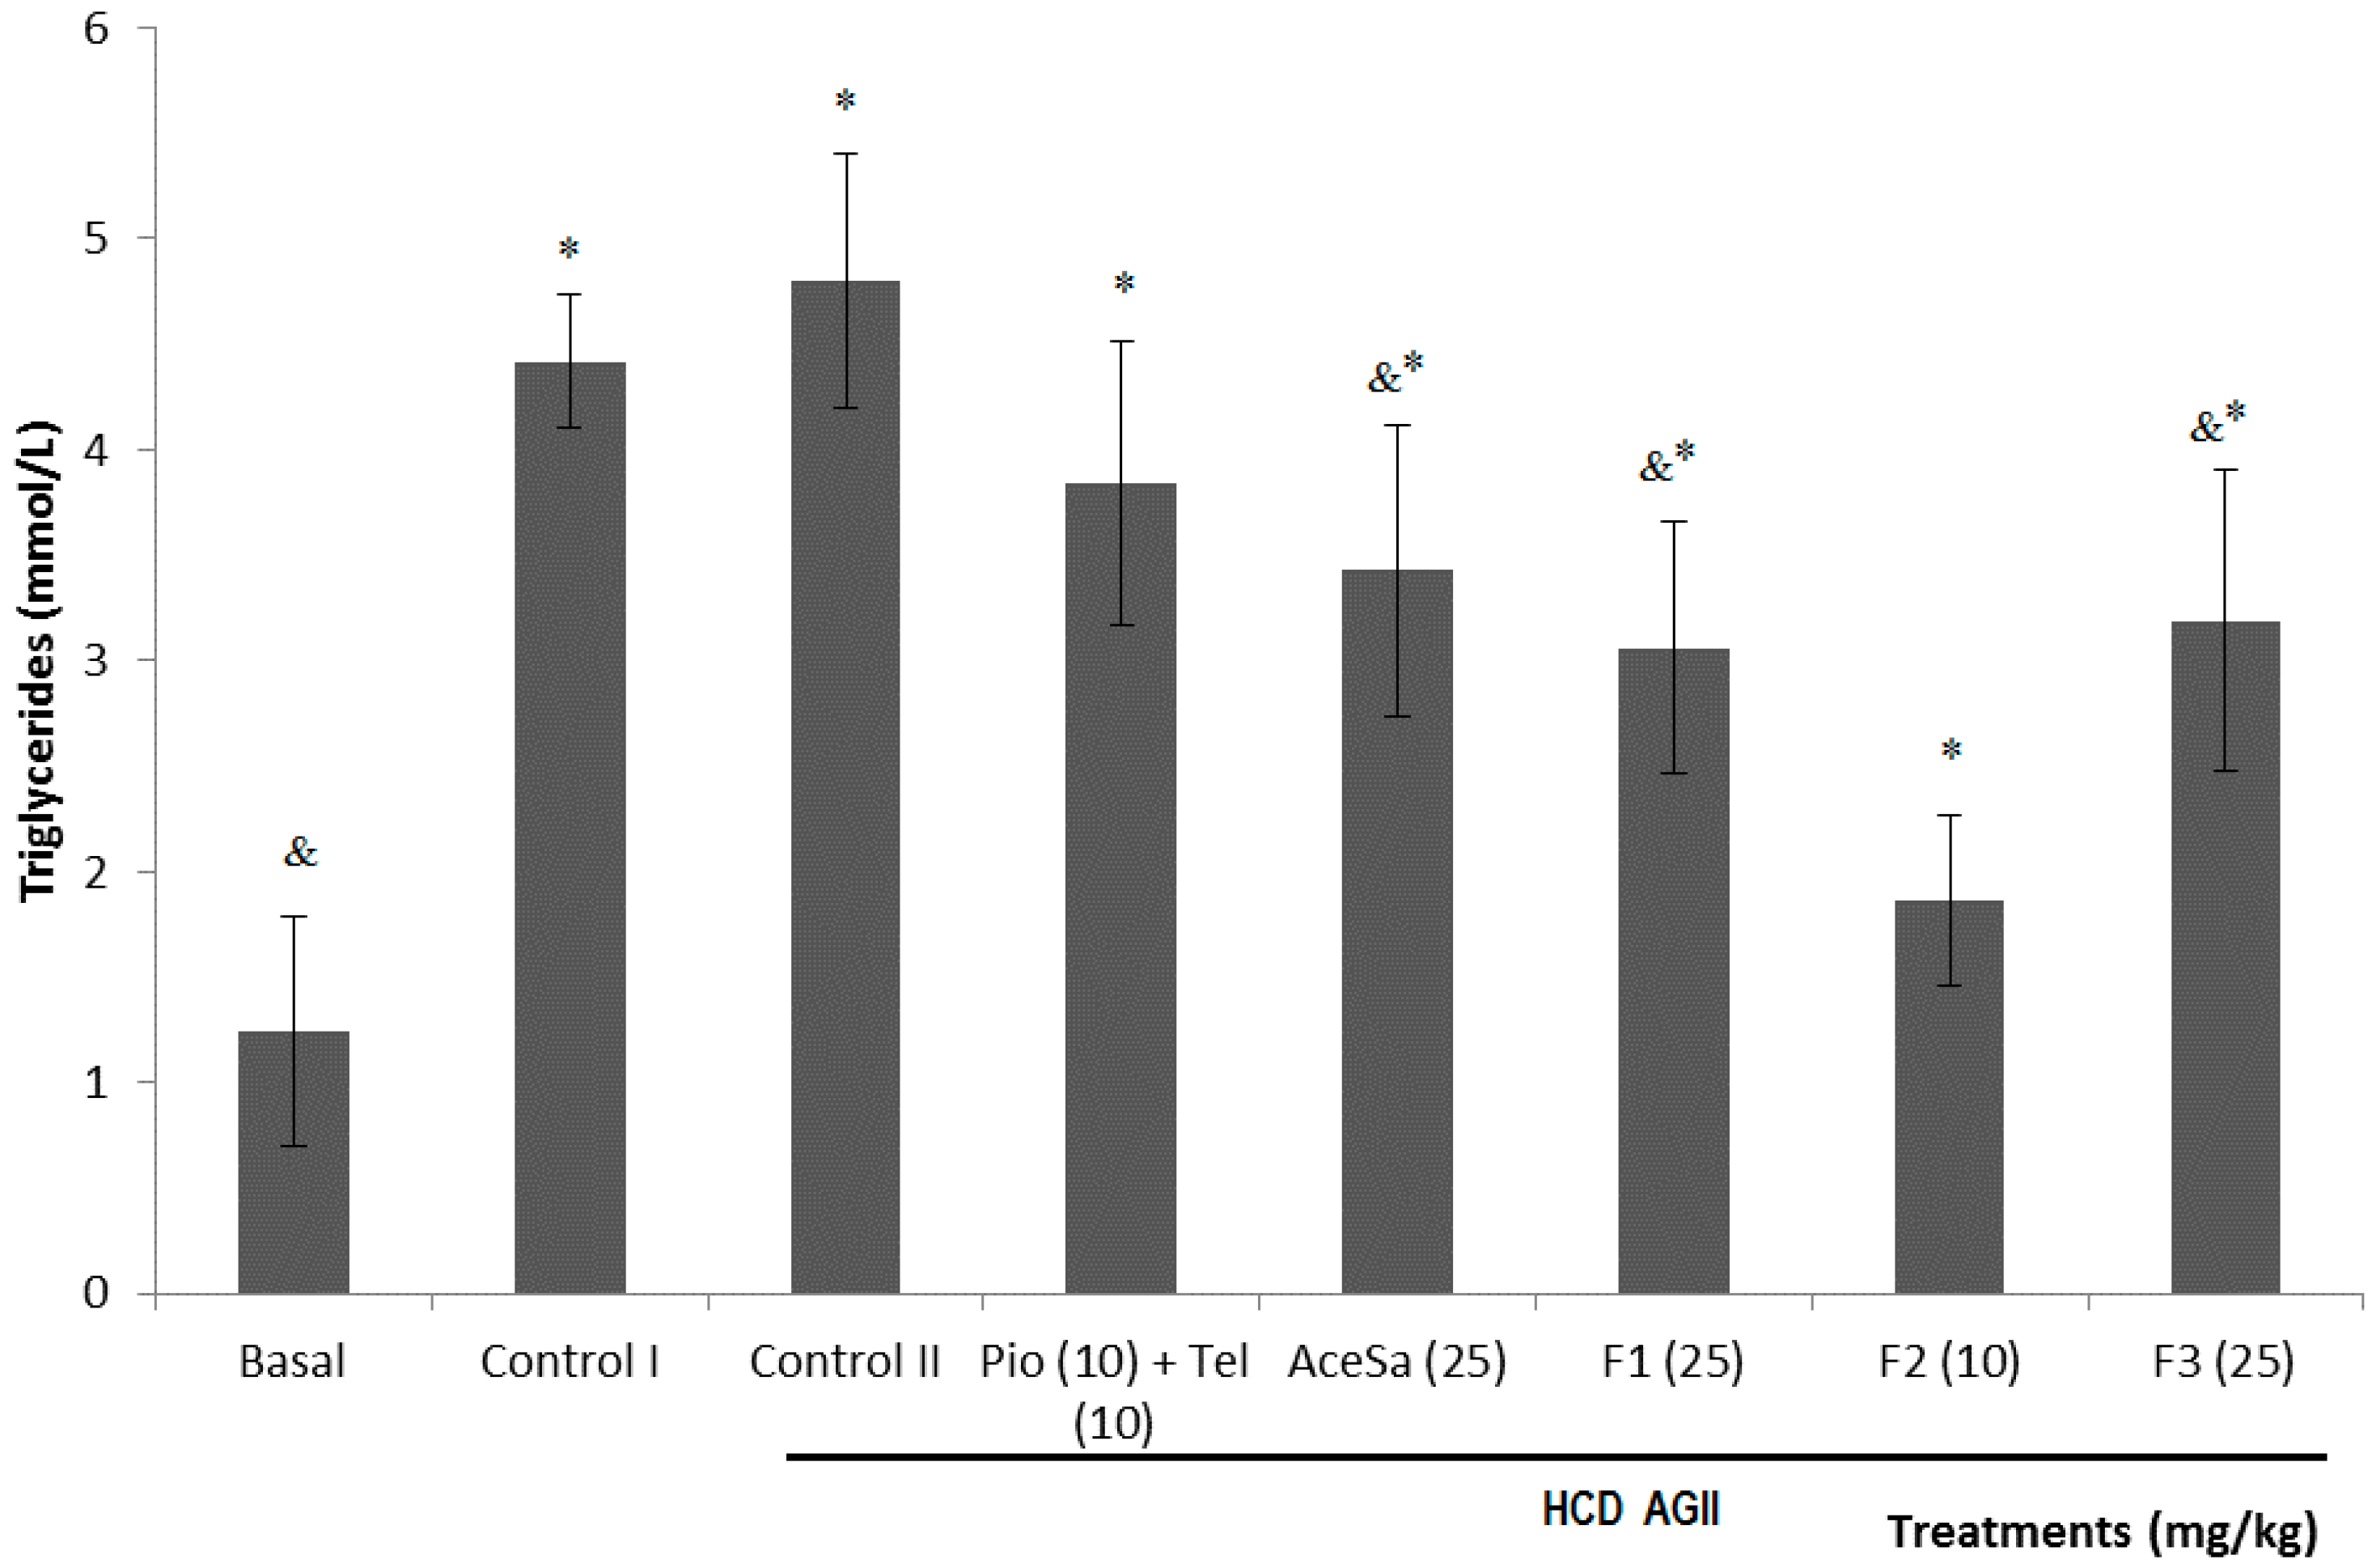
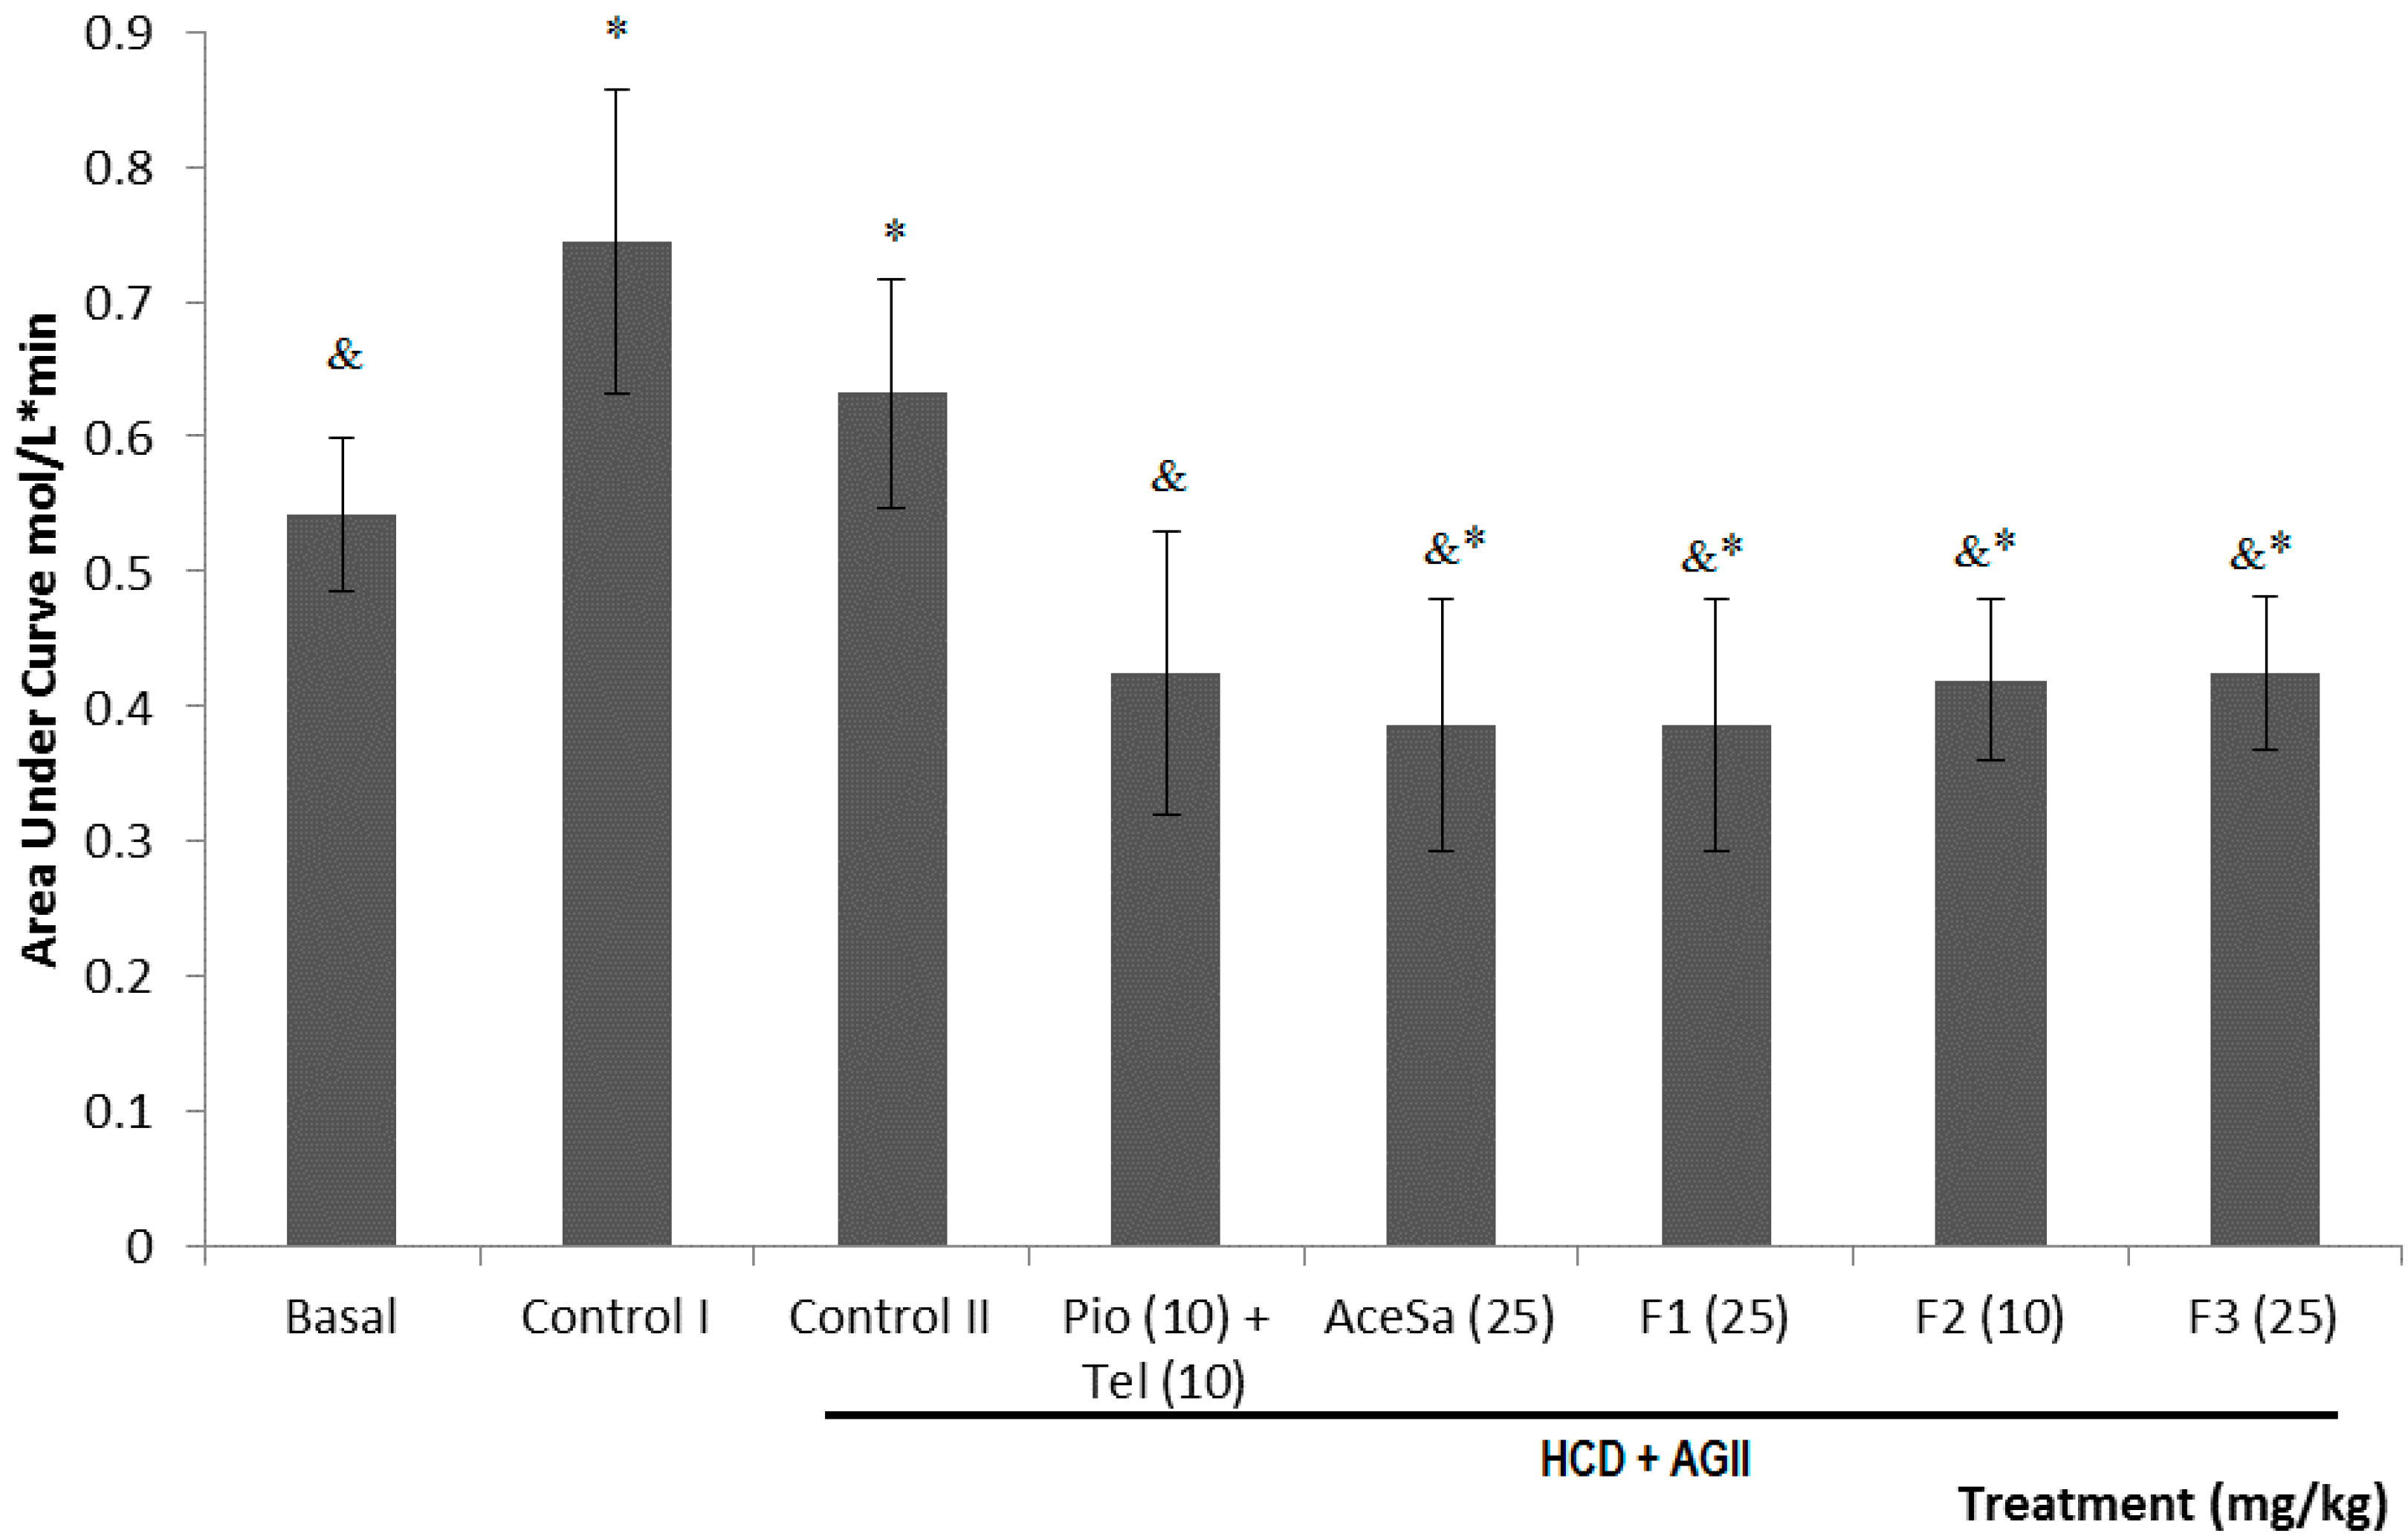
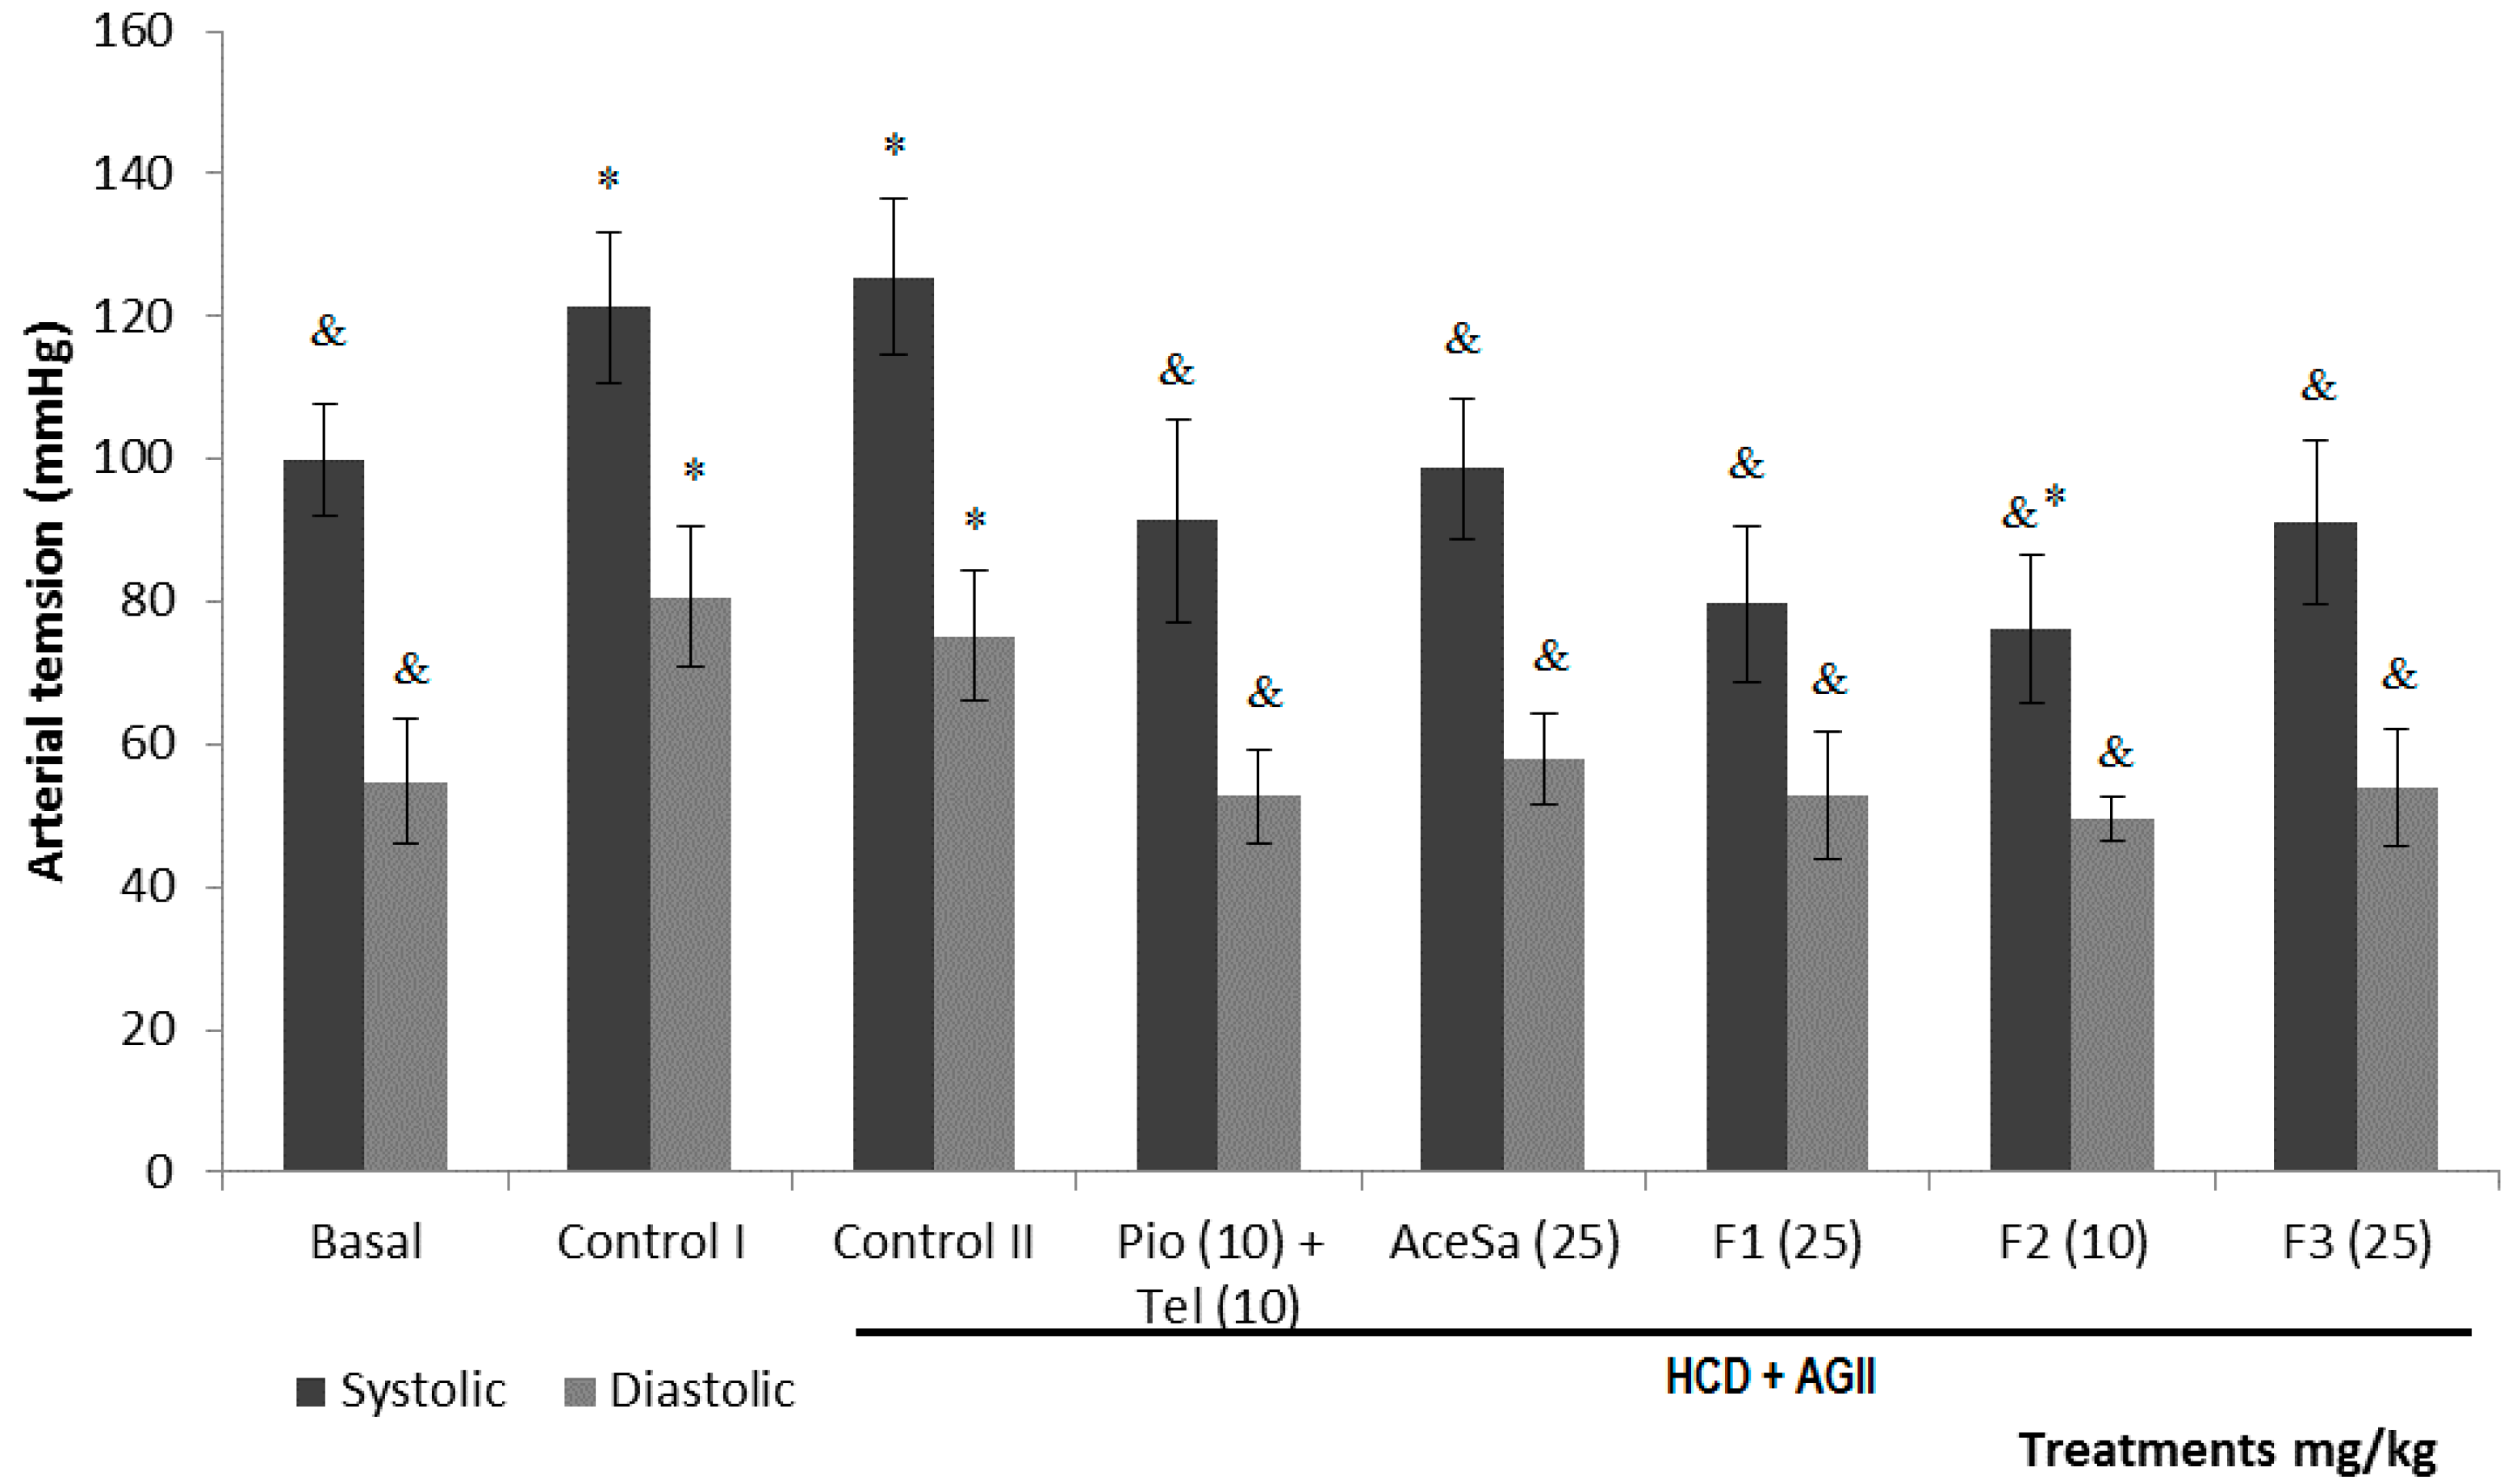
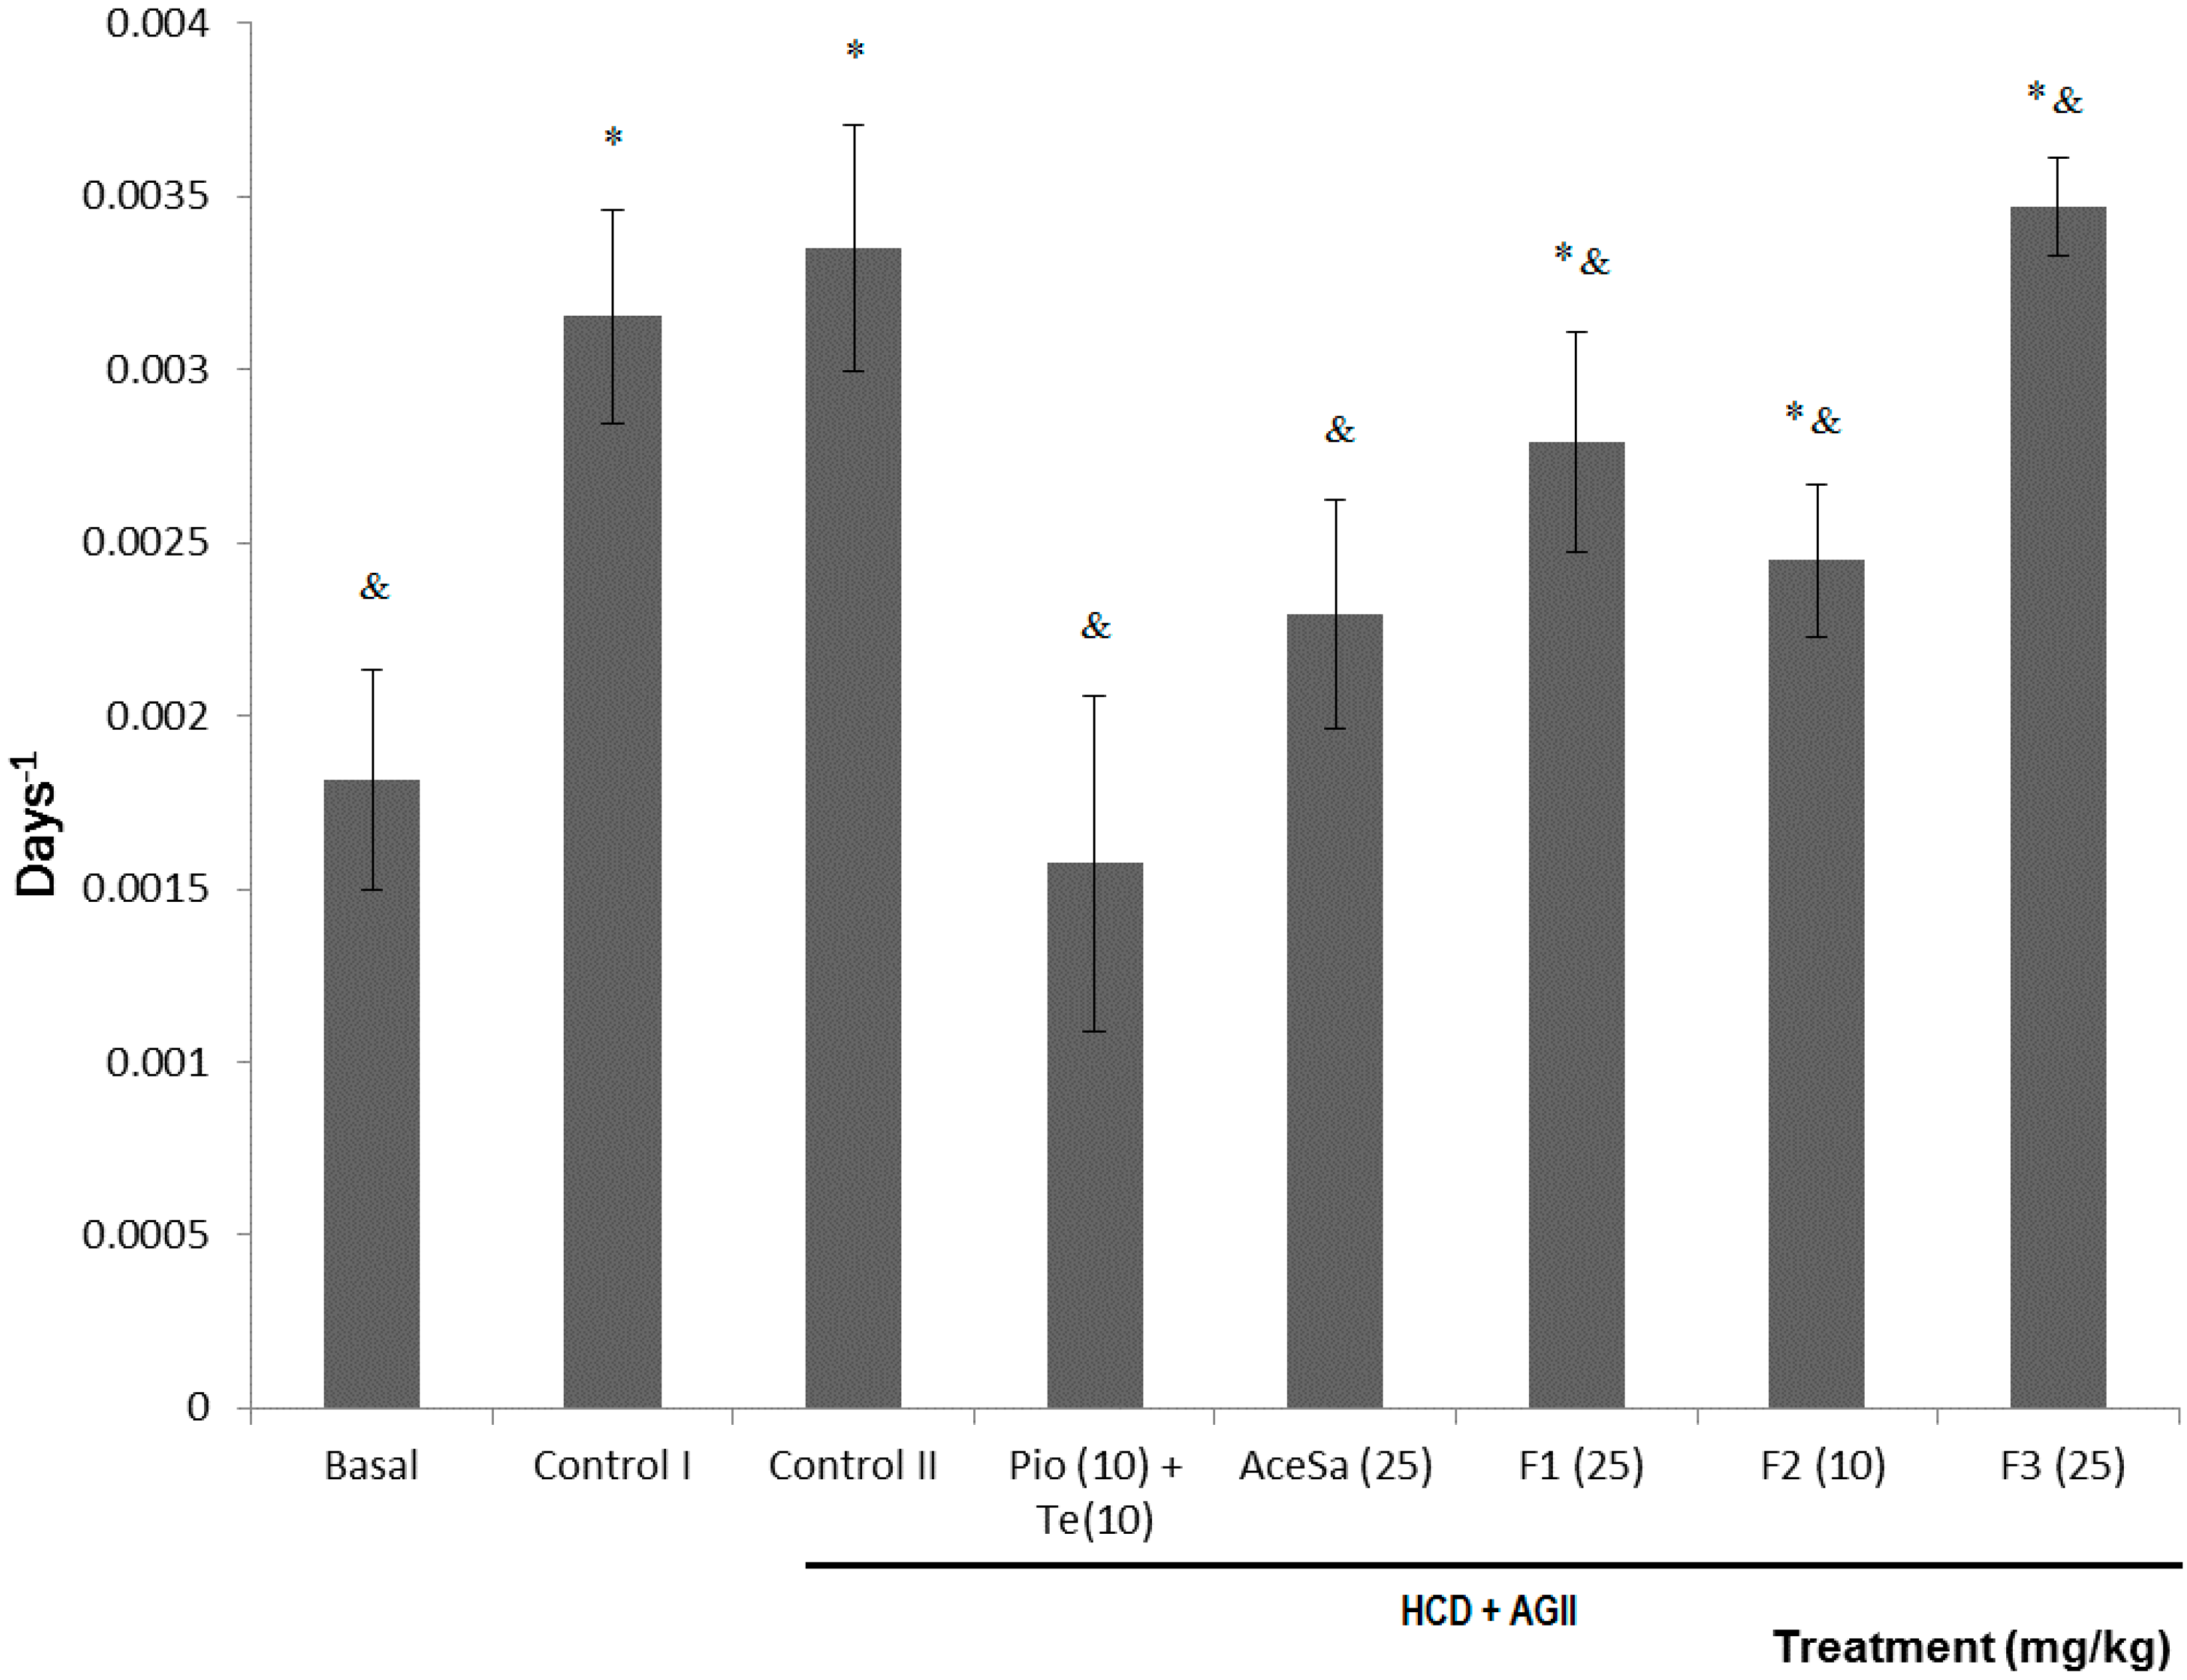
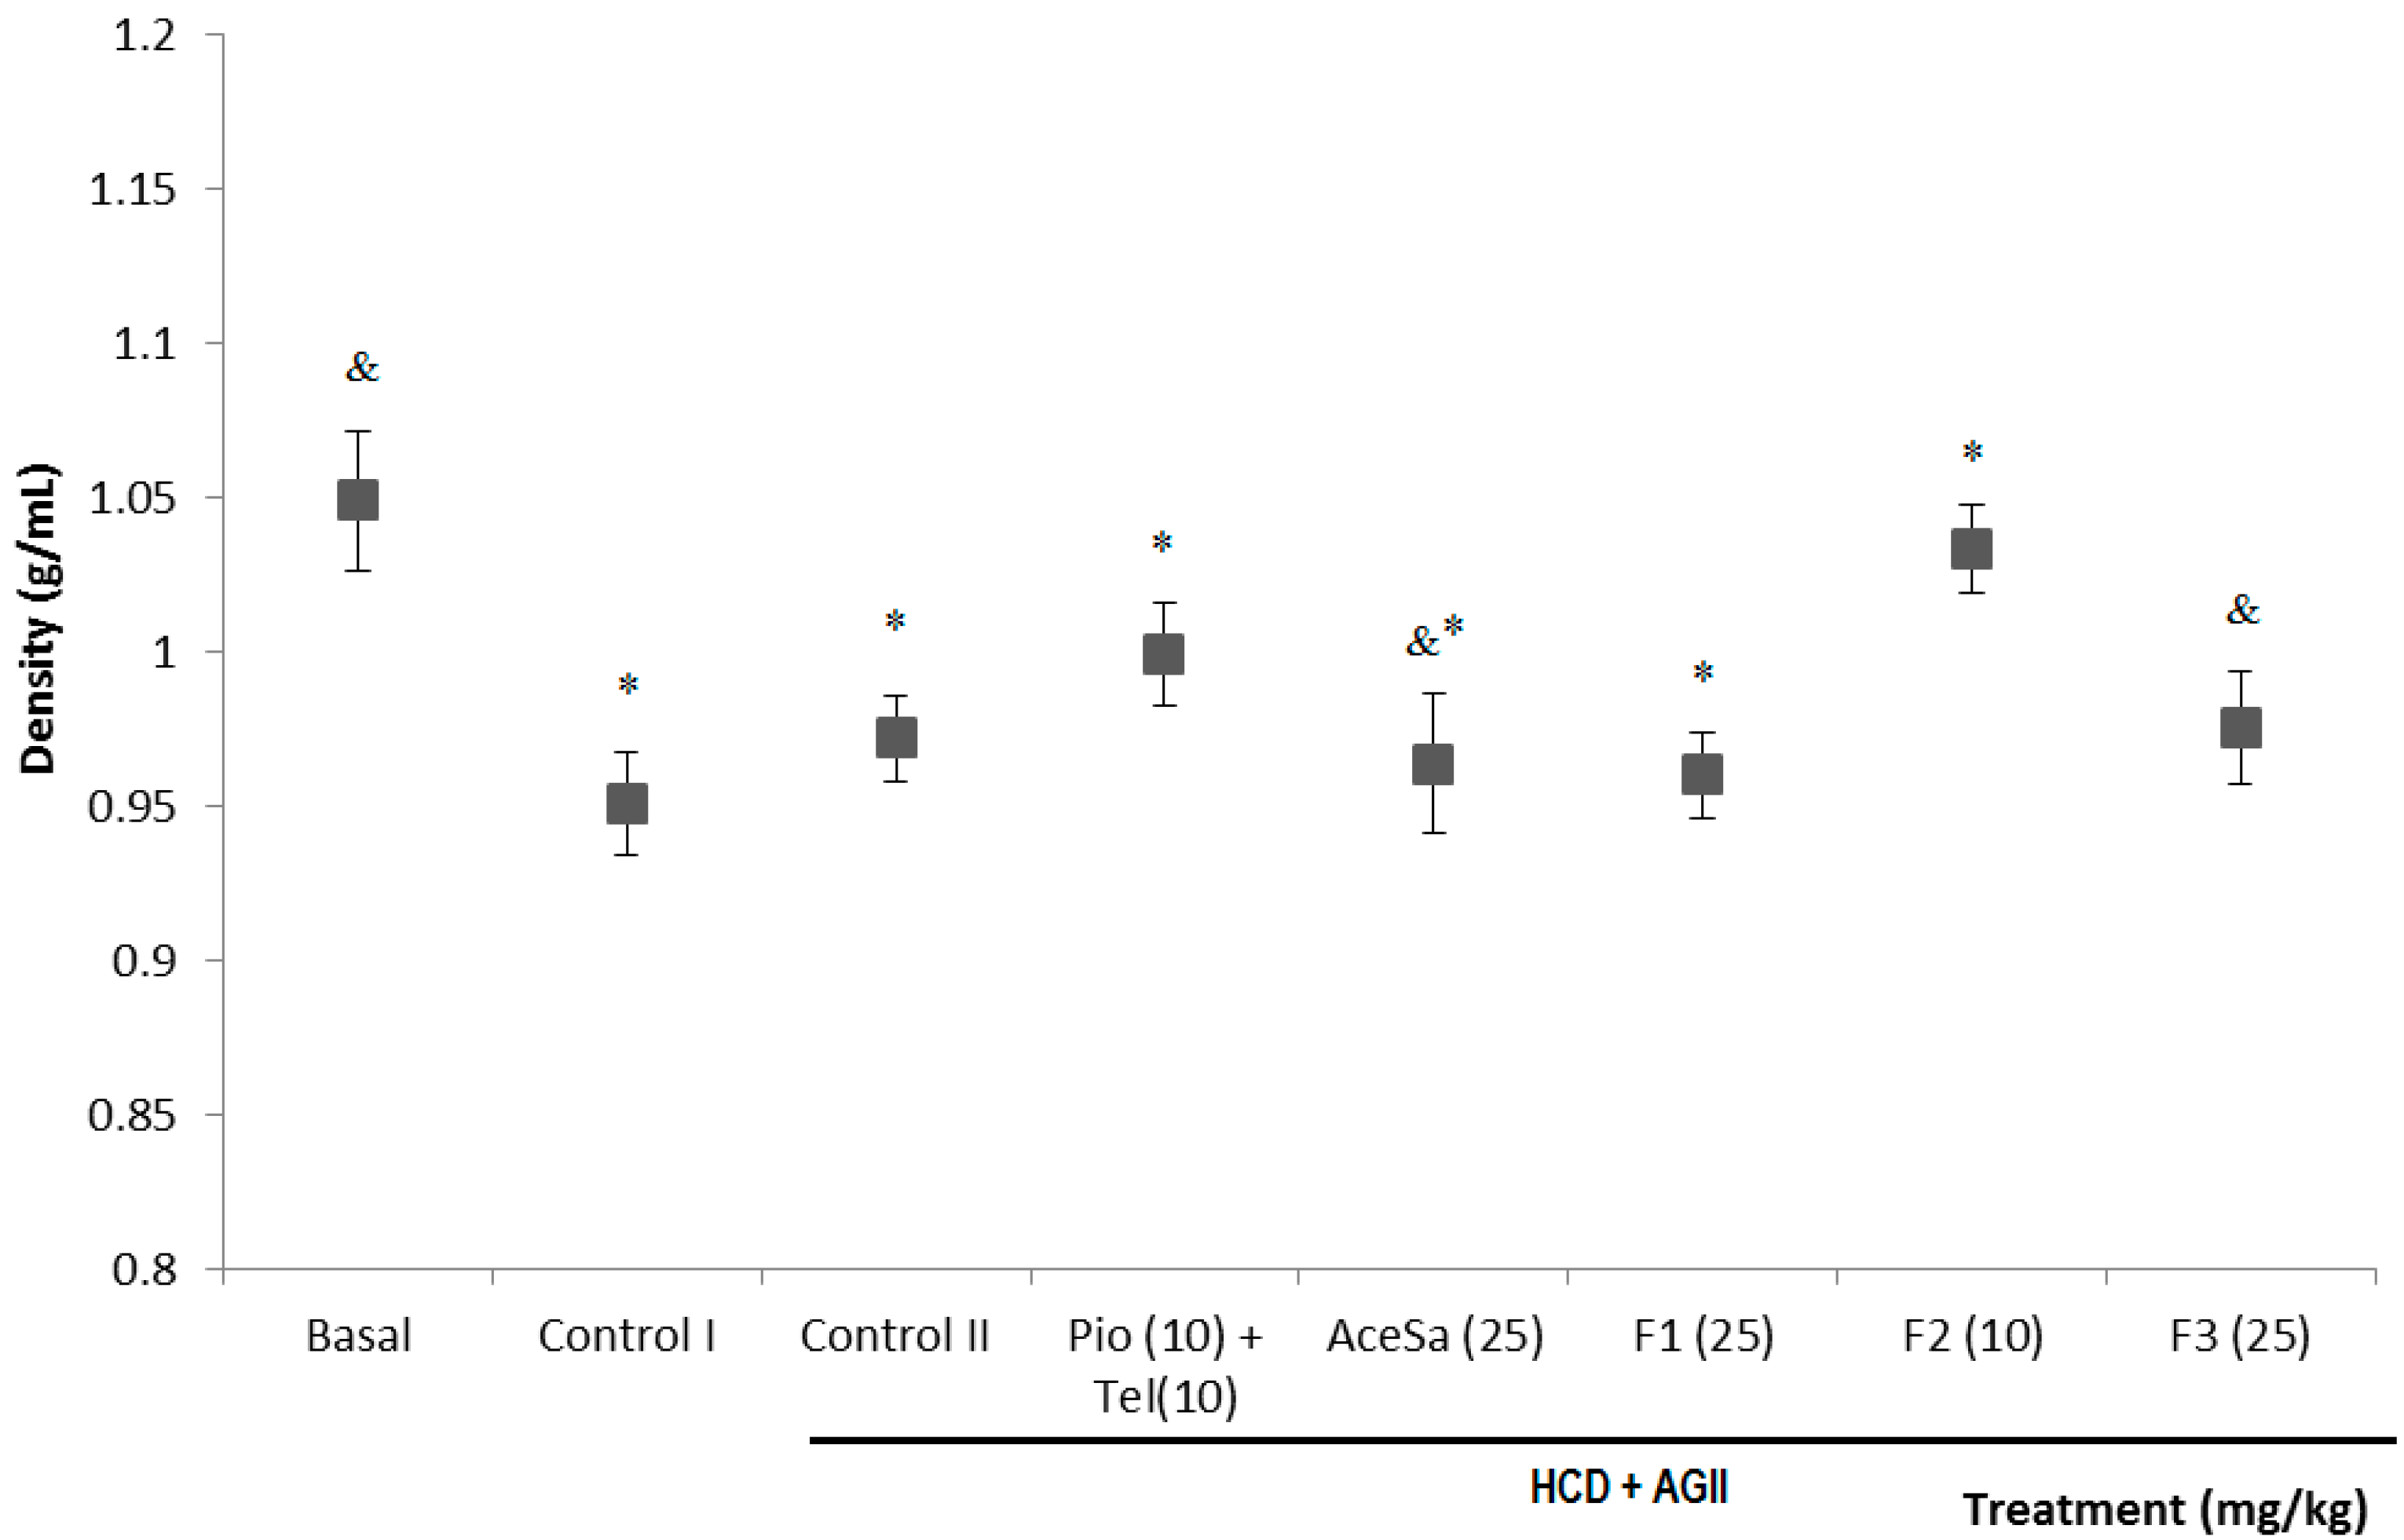
2.3. Pharmacological Characterization


3. Experimental Section
3.1. General Procedures
3.2. Plant Material
3.3. Extraction and Fractionation of the Root of Smilax aristolochiifolia
3.4. Standardization of Fractions with N-Trans-Feruloyltyramine by HPLC
3.5. Animals
3.6. Feeding the Mice with a High-Caloric Diet and a Normal Diet
3.7. Determination of Body Density
3.8. Determination of Fasting Glucose
3.9. Insulin Tolerance Curve
3.10. Determination of Plasmatic Triglycerides
3.11. Euthanasia
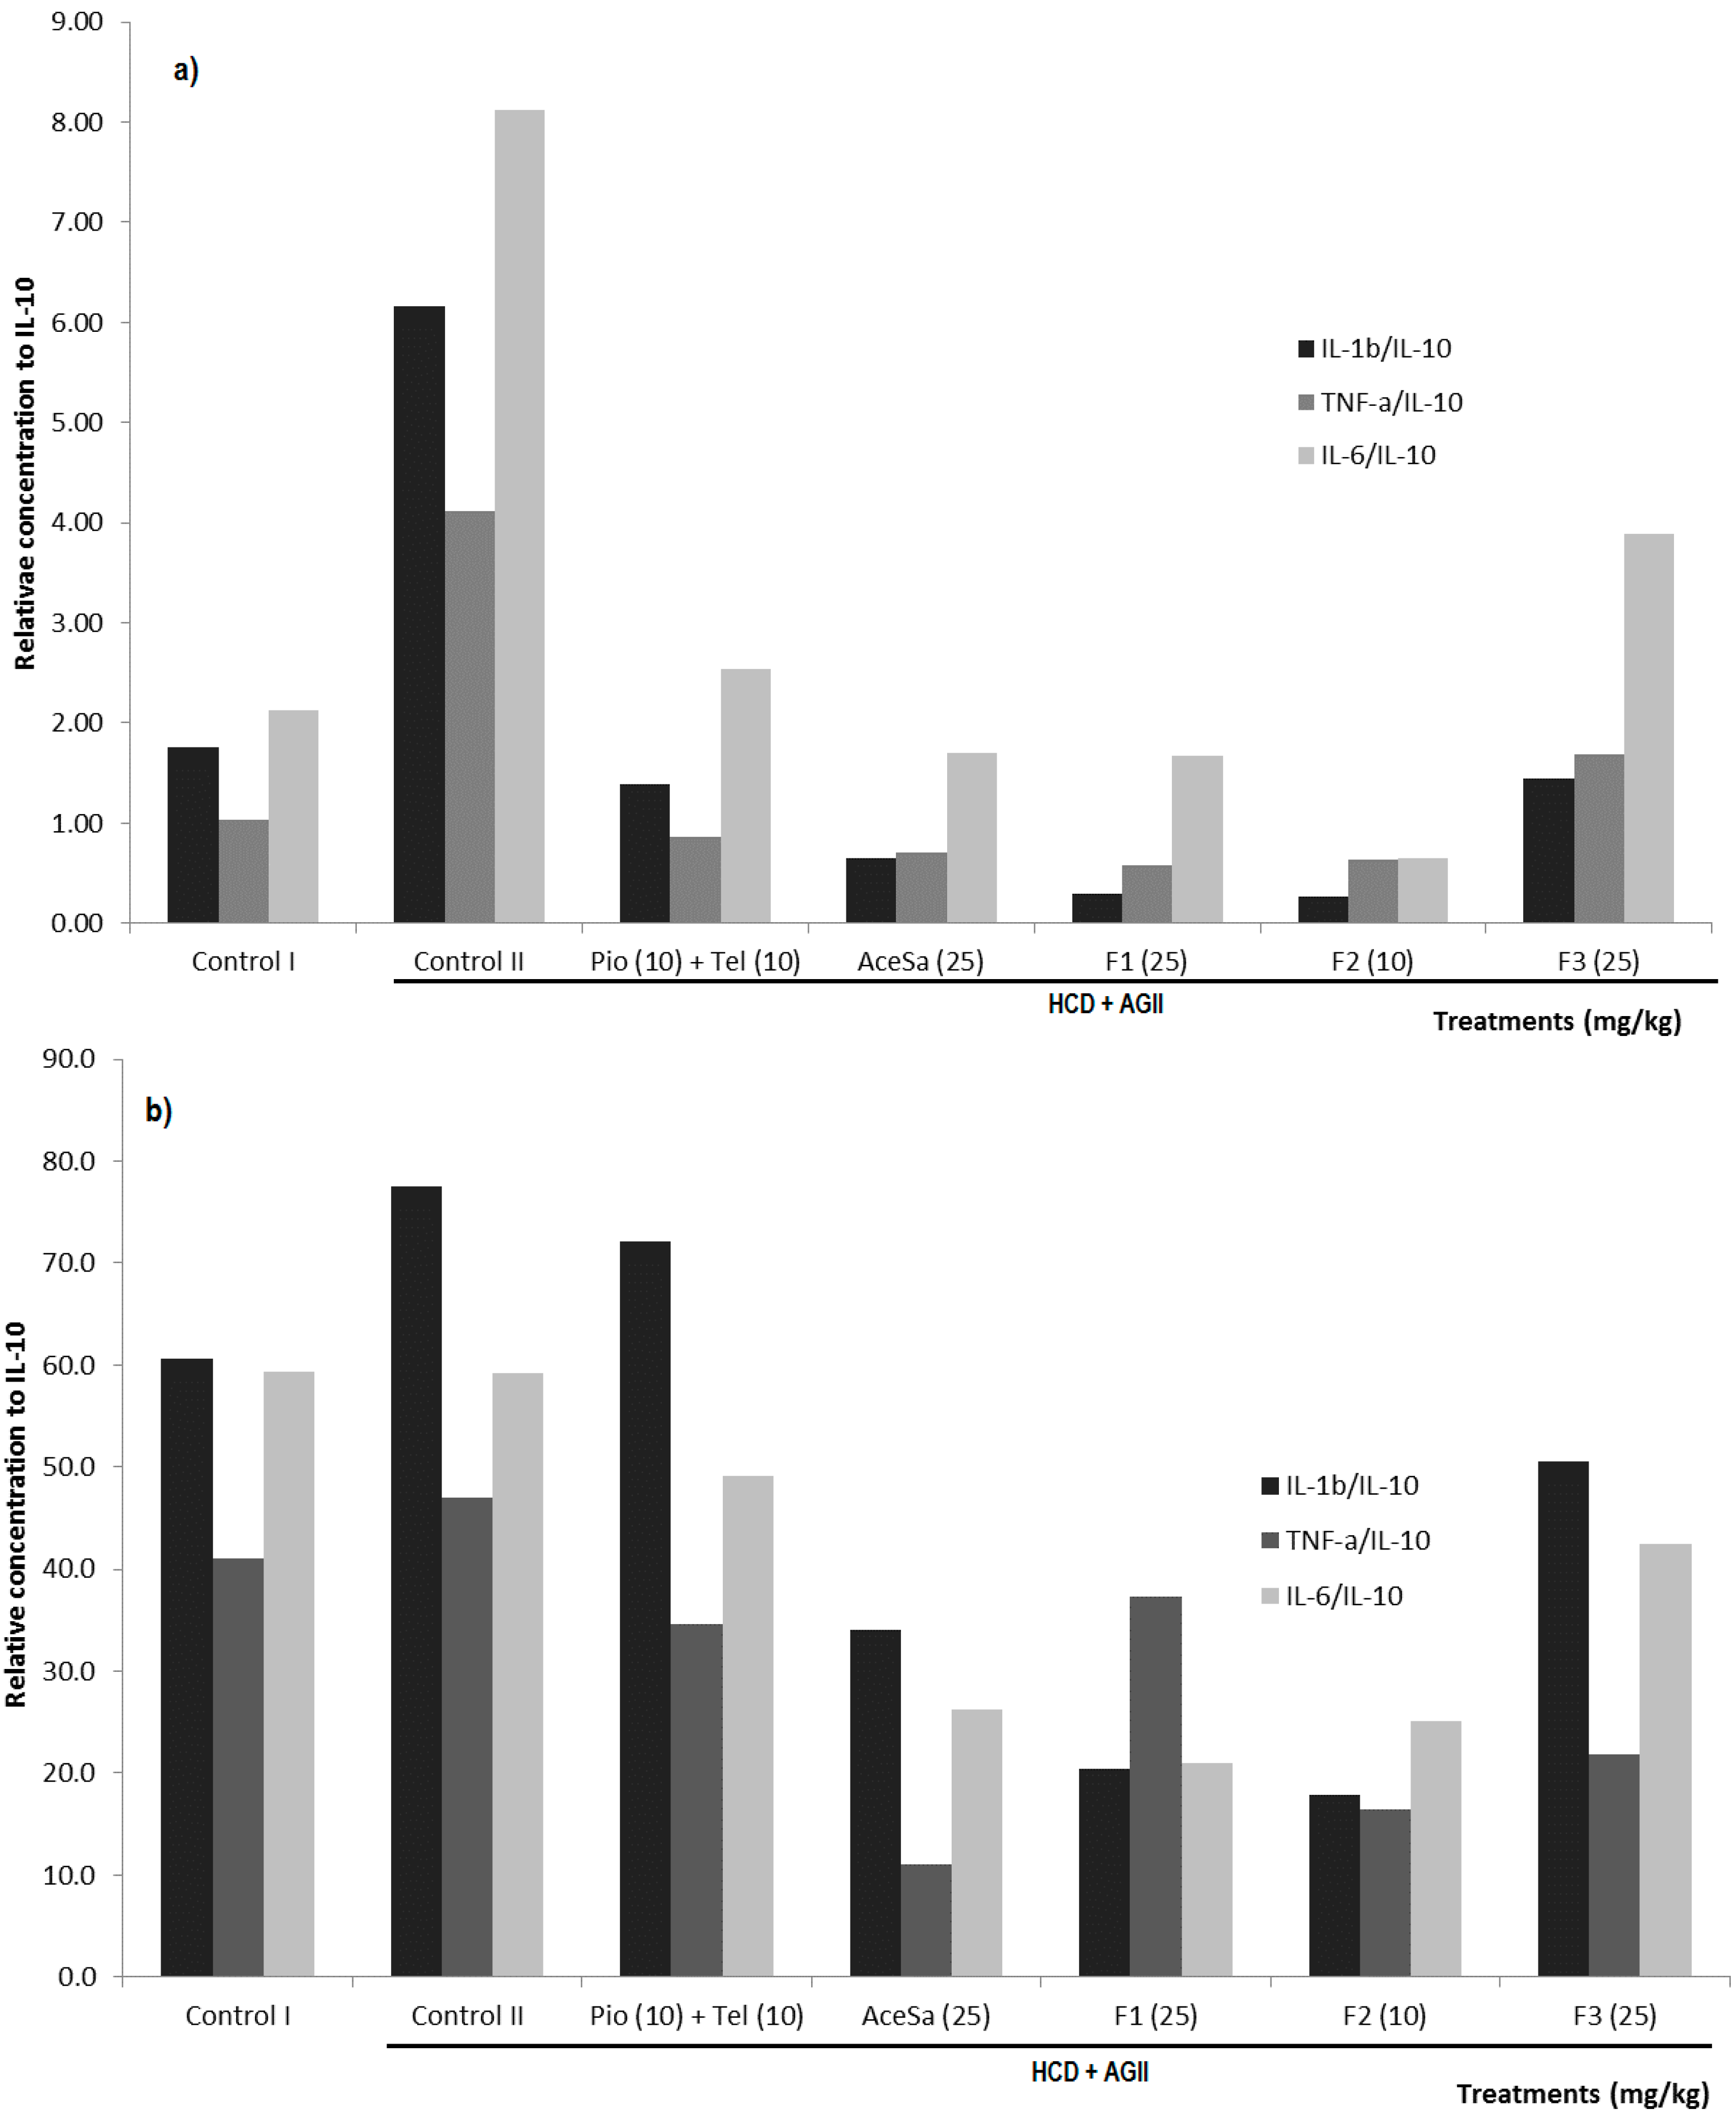
3.12. Quantification of Cytokines from Mouse Kidney and Adipose Tissue
3.13. Blood Pressure Measurement
3.14. Statistical Analyses
4. Conclusions
Supplementary Materials
Acknowledgments
Author Contributions
Conflicts of Interest
References and Notes
- Yun, J.E.; Won, S.; Sung, J.; Jee, S.H. Impact of metabolic syndrome independent of insulin resistance on the development of cardiovascular disease. Circ. J. 2012, 76, 2443–2448. [Google Scholar]
- Hutcheson, R.; Rocic, P. The metabolic syndrome, oxidative stress, environment, and cardiovascular disease: The great exploration. Exp. Diabetes Res. 2012, 2012, 271028. [Google Scholar]
- Rojas-Martínez, R.; Aguilar-Salinas, C.A.; Jiménez-Corona, A.; Gómez-Pérez, F.J.; Barquera, S.; Lazcano-Ponce, E. Prevalence of obesity and metabolic syndrome components in Mexican adults without type 2 diabetes or hypertension. Salud Pública Mexico 2012, 54, 7–12. [Google Scholar]
- Gómez-Dantés, O.; Sesma, S.; Becerril, V.M.; Knaul, F.M.; Arreola, H.; Frenk, J. Sistema de Salud de México (In Spanish). Salud Pública Mexico 2011, 53, S220–S232. [Google Scholar]
- Kalupahana, N.S.; Claycombe, K.J.; Moustaid-Moussa, N. (n-3) Fatty acids alleviate adipose tissue inflammation and insulin resistance: Mechanistic insights. Adv. Nutr. 2011, 2, 304–316. [Google Scholar] [CrossRef]
- Ferdinand, K.C. Improved Identification and Antihypertension Pharmacotherapy in Cardiorenal Metabolic Syndrome: Focus on Racial/Ethnic Minorities, Olmesartan Medoxomil, and Combination Therapy. Cardiorenal. Med. 2012, 2, 256–267. [Google Scholar] [CrossRef]
- Fraulob, J.C.; Ogg-Diamantino, R.; Fernandes-Santos, C.; Águila, M.B. A Mouse Model of Metabolic Syndrome: Insulin Resistance, Fatty Liver and Non-Alcoholic Fatty Pancreas Disease (NAFPD) in C57BL/6 Mice Fed a High Fat Diet. J. Clin. Biochem. Nutr. 2010, 46, 212–223. [Google Scholar] [CrossRef]
- Hotamisligil, G.S. Inflammation and metabolic disorders. Nature 2006, 444, 860–867. [Google Scholar] [CrossRef]
- Touyz, R.M. Intracellular mechanisms involved in vascular remodelling of resistance arteries in hypertension: Role of angiotensin II. Exp. Physiol. 2005, 90, 449–455. [Google Scholar] [CrossRef]
- Bo, S.; Hongzhu, G.; Yajun, C.; Min, Y.; Jian, H.; Dean, G. Steroidal saponins from Smilax china and their anti-inflammatory activities. Phytochemistry 2007, 68, 623–630. [Google Scholar] [CrossRef]
- Qing-Feng, Z.; Zhong-Rong, Z.; Hon-Yeung, C. Antioxidant activity of Rhizoma smilacis Glabrae extracts and its key constituent-astilbin. Food Chem. 2009, 115, 297–303. [Google Scholar] [CrossRef]
- Sautour, M.; Miyamoto, T.; Lacaille-Dubois, M.A. Bioactive Steroidal Saponins from Smilax medica. Planta Med. 2006, 72, 667–670. [Google Scholar] [CrossRef]
- Argueta, A.; Gallardo-Vazquez, M.C. Smilax/Atlas de las Plantas de la Medicina Tradicional Mexicana/Biblioteca Digital de la Medicina Tradicional Mexicana (in Spanish). Available online: http://www.medicinatradicionalmexicana.unam.mx/ (accessed on 3 August 2013).
- DellaGreca, M.; Cutillo, F.; D'Abrosca, B.; Fiorentino, A.; Pacifico, S.; Zarrelli, A. Antioxidant and radical scavenging properties of Malva sylvestris. Nat. Prod. Commun. 2009, 4, 893–896. [Google Scholar]
- Fan, P.; Terrier, L.; Hay, A.E.; Marston, A.; Hostettmann, K. Antioxidant and enzyme inhibition activities and chemical profiles of Polygonum sachalinensis F.Schmidt ex Maxim (Polygonaceae). Fitoterapia 2010, 81, 124–131. [Google Scholar] [CrossRef]
- Liu, X.; Luo, J.; Kong, L. Phenylethyl cinnamides as potential alpha-glucosidase inhibitors from the roots of Solanum melongena. Nat. Prod. Commun. 2011, 6, 851–853. [Google Scholar]
- Yusuf, I.; Yamaoka, K.; Otsuka, H.; Yamasaki, K.; Seyama, I. Block of sodium channels by tyramine and its analogue (N-feruloyl tyramine) in frog ventricular myocytes. Jpn. J. Physiol. 1992, 42, 179–191. [Google Scholar] [CrossRef]
- Faraci, F.M. Protecting against vascular disease in brain. Am. J. Physiol. HeartCirc. Physiol. 2011, 300, H1566–H1582. [Google Scholar] [CrossRef]
- Kovacic, J.C.; Moreno, P.; Nabel, E.G.; Hachinski, V.; Fuster, V. Cellular senescence, vascular disease, and aging: Clinical vascular disease in the elderly. Circulation 2011, 123, 1900–1910. [Google Scholar] [CrossRef]
- Najjar, S.S.; Scuteri, A.; Lakatta, E.G. Arterial aging: Is it an immutable cardiovascular risk factor? Hypertension 2005, 46, 454–462. [Google Scholar] [CrossRef]
- Yiannikouris, F.; Gupte, M.; Putnam, K.; Thatcher, S.; Charnigo, R.; Rateri, D.L.; Daugherty, A.; Cassis, L.A. Adipocyte deficiency of angiotensinogen prevents obesity-induced hypertension in male mice. Hypertension 2012, 60, 1524–1530. [Google Scholar] [CrossRef]
- Putnam, K.; Shoemaker, R.; Yiannikouris, F.; Cassis, L.A. The renin-angiotensin system: A target of and contributor to dyslipidemias, altered glucose homeostasis, and hypertension of the metabolic syndrome. Am. J. Physiol. HeartCirc. Physiol. 2012, 302, H1219–H1230. [Google Scholar] [CrossRef]
- Wright, J.W.; Mizutani, S.; Harding, J.W. Pathways involved in the transition from hypertension to hypertrophy to heart failure. Treatment strategies. Heart Fail. Rev. 2008, 13, 367–375. [Google Scholar]
- Ranilla, L.G.; Kwon, Y.I.; Apostolidis, E.; Shetty, K. Phenolic compounds, antioxidant activity and in vitro inhibitory potential against key enzymes relevant for hyperglycemia and hypertension of commonly used medicinal plants, herbs and spices in Latin America. Bioresour. Technol. 2010, 101, 4676–4689. [Google Scholar] [CrossRef]
- Abdala, S.; Martín-Herrera, D.; Benjumea, D.; Gutiérrez, S.D. Diuretic activity of some Smilax canariensis fractions. J. Ethnopharmacol. 2012, 140, 277–281. [Google Scholar] [CrossRef]
- Amira, S.; Dade, M.; Schinella, G.; Ríos, J.L. Anti-inflammatory, anti-oxidant, and apoptotic activities of four plant species used in folk medicine in the Mediterranean basin. Pak. J. Pharm. Sci. 2012, 25, 65–72. [Google Scholar]
- Khan, I.; Nisar, M.; Ebad, F.; Nadeem, S.; Saeed, M.; Khan, H.; Samiullah, K.; Khuda, F.; Karim, N.; Ahmad, Z. Anti-inflammatory activities of Sieboldogenin from Smilax china Linn.: Experimental and computational studies. J. Ethnopharmacol. 2009, 121, 175–177. [Google Scholar] [CrossRef]
- Zhang, L.; Liao, C.C.; Huang, H.C.; Shen, Y.C.; Yang, L.M.; Kuo, Y.H. Antioxidant phenylpropanoid glycosides from Smilax bracteata. Phytochemistry 2008, 69, 1398–1404. [Google Scholar] [CrossRef]
- Fukunaga, T.; Miura, T.; Furuta, K.; Kato, A. Hypoglycemic effect of the rhizomes of Smilax glabra in normal and diabetic mice. Biol. Pharm. Bull. 1997, 20, 44–46. [Google Scholar] [CrossRef]
- Kim, J.Y.; Park, S.J.; Yun, K.J.; Cho, Y.W.; Park, H.J.; Lee, K.T. Isoliquiritigenin isolated from the roots of Glycyrrhiza uralensis inhibits LPS-induced iNOS and COX-2 expression via the attenuation of NF-kappaB in RAW 264.7 macrophages. Eur. J. Pharmacol. 2008, 584, 175–184. [Google Scholar] [CrossRef]
- Kim, Y.J.; Cho, S.Y.; Yun, C.H.; Moon, Y.S.; Lee, T.R.; Kim, S.H. Transcriptional activation of Cidec by PPARgamma2 in adipocyte. Biochem. Biophys. Res. Commun. 2008, 377, 297–302. [Google Scholar] [CrossRef]
- Reaven, G.M. Insulin resistance, the insulin resistance syndrome, and cardiovascular disease. Panminerva Med. 2005, 47, 201–210. [Google Scholar]
- Hoffmann, B.R.; El-Mansy, M.F.; Sem, D.S.; Greene, A.S. Chemical proteomics-based analysis of off-target binding profiles for rosiglitazone and pioglitazone: Clues for assessing potential for cardiotoxicity. J. Med. Chem. 2012, 55, 8260–8271. [Google Scholar] [CrossRef]
- Fonseca, H.A.; Fonseca, F.A.; Monteiro, A.M.; Bianco, H.T.; Boschcov, P.; Brandão, S.A.; Jualiano, L.; Gidlund, M.; Izar, M.C. Obesity modulates the immune response to Oxidized LDL in hypertensive Patients. Cell Biochem. Biophys. 2013, 67, 1451–1460. [Google Scholar] [CrossRef]
- Zubcevic, J.; Waki, H.; Raizada, M.K.; Paton, J.F. Autonomic-immune-vascular interaciton: An emerging concept for neurogenic hypertension. Hypertension 2011, 57, 1026–1033. [Google Scholar] [CrossRef]
- Elmarakby, A.A.; Quigley, J.E.; Pollock, D.M.; Imig, J.D. Tumor necrosis factor alpha blockade increases renal Cyp2c23 expression and slows the progression of renal damage in salt-sensitive hypertension. Hypertension 2006, 47, 557–562. [Google Scholar] [CrossRef]
- Guzik, T.J.; Hoch, N.E.; Brown, K.A.; McCann, L.A.; Rahman, A.; Dikalov, S.; Goronzy, J.; Weyand, C.; Harrison, D.G. Role of the T cell in the genesis of angiotensin II induced hypertension and vascular dysfunction. J. Exp. Med. 2007, 204, 2449–2460. [Google Scholar] [CrossRef]
- Rahman, A.U.; Bhatti, M.K.; Akhtar, F.; Choudhary, M.I. Alkaloids of Fumaria Indica. Phytochemistry 1992, 31, 2869–2872. [Google Scholar] [CrossRef]
- Empower 2 Guía para el administrador del sistema; (In Spanish), 715081098ESWaters Corporation: Boston, MA, USA, 2008. Available online: http://www.waters.com/webassets/cms/ support/docs/wat053020tpr1.pdf (accessed on 3 July 2014).
- Stat Fax® 2100. Operator’s Manual; Revised 01/05. Doc 2100 Rev J. Awareness Technology Inc: Palm City, FL, USA, 1988. Available online: https://extranet.fisher.co.uk/webfiles/fr/Pjointes/Mdemploi/AWA002_EN%20 Operating%20manual%202100.pdf (accessed on 2 July 2014).
- AcqKnowledge 4 Software Guide; Data Acquisition and Analysis with BIOPAC Hardware System. BIOPAC Systems Inc: Goleta, CA, USA, 2012. Available online: http://www.biopac.com/Manuals/acqknowledge%204%20software%20guide.pdf (accessed on 2 July 2014).
- Sample Availability: Samples of the compounds N-trans-feruloyl tyramine are available from the authors.
© 2014 by the authors. Licensee MDPI, Basel, Switzerland. This article is an open access article distributed under the terms and conditions of the Creative Commons Attribution license ( http://creativecommons.org/licenses/by/3.0/).
Share and Cite
Amaro, C.A.B.; González-Cortazar, M.; Herrera-Ruiz, M.; Román-Ramos, R.; Aguilar-Santamaría, L.; Tortoriello, J.; Jiménez-Ferrer, E. Hypoglycemic and Hypotensive Activity of a Root Extract of Smilax aristolochiifolia, Standardized on N-trans-Feruloyl-Tyramine. Molecules 2014, 19, 11366-11384. https://doi.org/10.3390/molecules190811366
Amaro CAB, González-Cortazar M, Herrera-Ruiz M, Román-Ramos R, Aguilar-Santamaría L, Tortoriello J, Jiménez-Ferrer E. Hypoglycemic and Hypotensive Activity of a Root Extract of Smilax aristolochiifolia, Standardized on N-trans-Feruloyl-Tyramine. Molecules. 2014; 19(8):11366-11384. https://doi.org/10.3390/molecules190811366
Chicago/Turabian StyleAmaro, Carol Arely Botello, Manasés González-Cortazar, Maribel Herrera-Ruiz, Rubén Román-Ramos, Lucia Aguilar-Santamaría, Jaime Tortoriello, and Enrique Jiménez-Ferrer. 2014. "Hypoglycemic and Hypotensive Activity of a Root Extract of Smilax aristolochiifolia, Standardized on N-trans-Feruloyl-Tyramine" Molecules 19, no. 8: 11366-11384. https://doi.org/10.3390/molecules190811366