2.1. HPLC Analysis of Polyphenols
The quantitative determination was performed using the external standard method. The concentrations of identified polyphenolic compounds were organized in order of their retention times and are presented in
Table 1. The HPLC chromatograms of
L. barbarum and
L. chinense are presented in
Figure 1 and
Figure 2.
Table 1.
The polyphenolic compounds content in the studied species (μg/g plant material).
Table 1.
The polyphenolic compounds content in the studied species (μg/g plant material).
| Polyphenolic Compound | m/z | RT ± SD (min) | L. barbarum | L. chinense |
|---|
| Gentisic acid | 179 | 3.52 ± 0.04 | <0.02 | NF |
| Caffeic acid | 179 | 5.60 ± 0.04 | <0.02 | NF |
| Chlorogenic acid | 353 | 5.62 ± 0.05 | 5899.29 ± 4.46 | 12045.96 ± 9.25 |
| p-Coumaric acid | 163 | 9.48 ± 0.08 | 30.29 ± 0.23 | 54.97 ± 0.43 |
| Ferulic acid | 193 | 12.8 ± 0.10 | <0.02 | 112.25 ± 0.87 |
| Isoquercitrin | 463 | 19.60 ± 0.10 | 25.08 ± 0.72 | 20.46 ± 0.21 |
| Rutin | 609 | 20.20 ± 0.15 | 5646.66 ± 3.32 | 16205.28 ± 8.09 |
| Quercitrin | 447 | 23.64 ± 0.13 | 13.00 ± 0.12 | 5.52 ± 0.07 |
| Quercetin | 301 | 26.80 ± 0.15 | 5.59 ± 0.06 | 4.49 ± 0.05 |
| Kaempferol | 285 | 32.48 ± 0.17 | NF | 2.83 ± 0.03 |
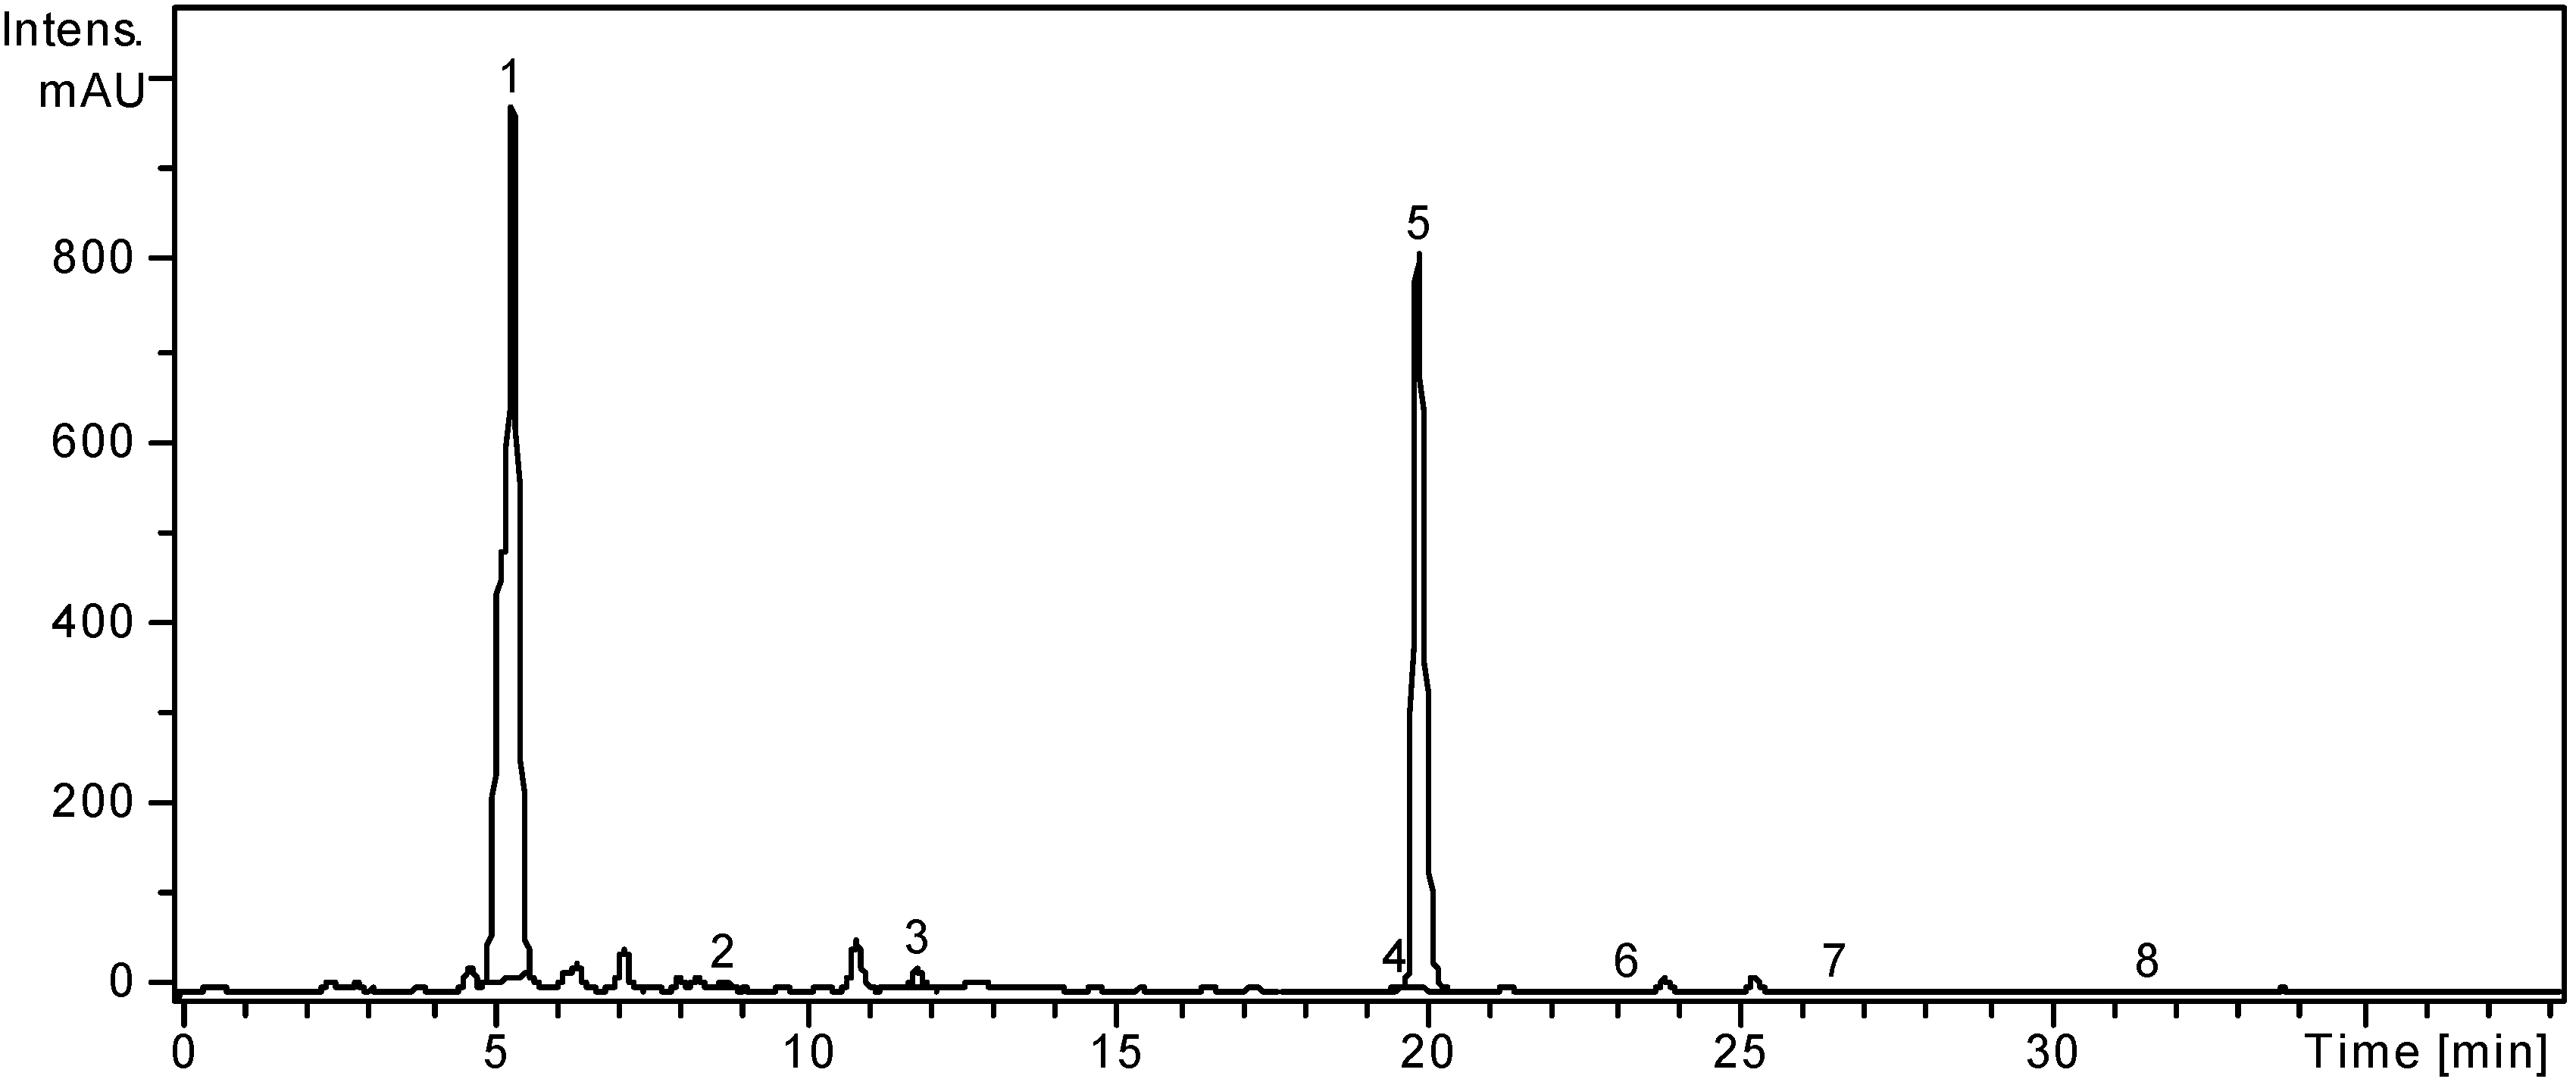
Figure 1.
HPLC chromatogram of L. barbarum sample.
Figure 1.
HPLC chromatogram of L. barbarum sample.
Notes: Chromatographic conditions as given in the
Experimental Section. Identified compounds: 1, Chlorogenic acid; 2,
p-Coumaric acid; 3, Isoquercitrin; 4, Rutin; 5, Quercitrin; 6, Quercetin.
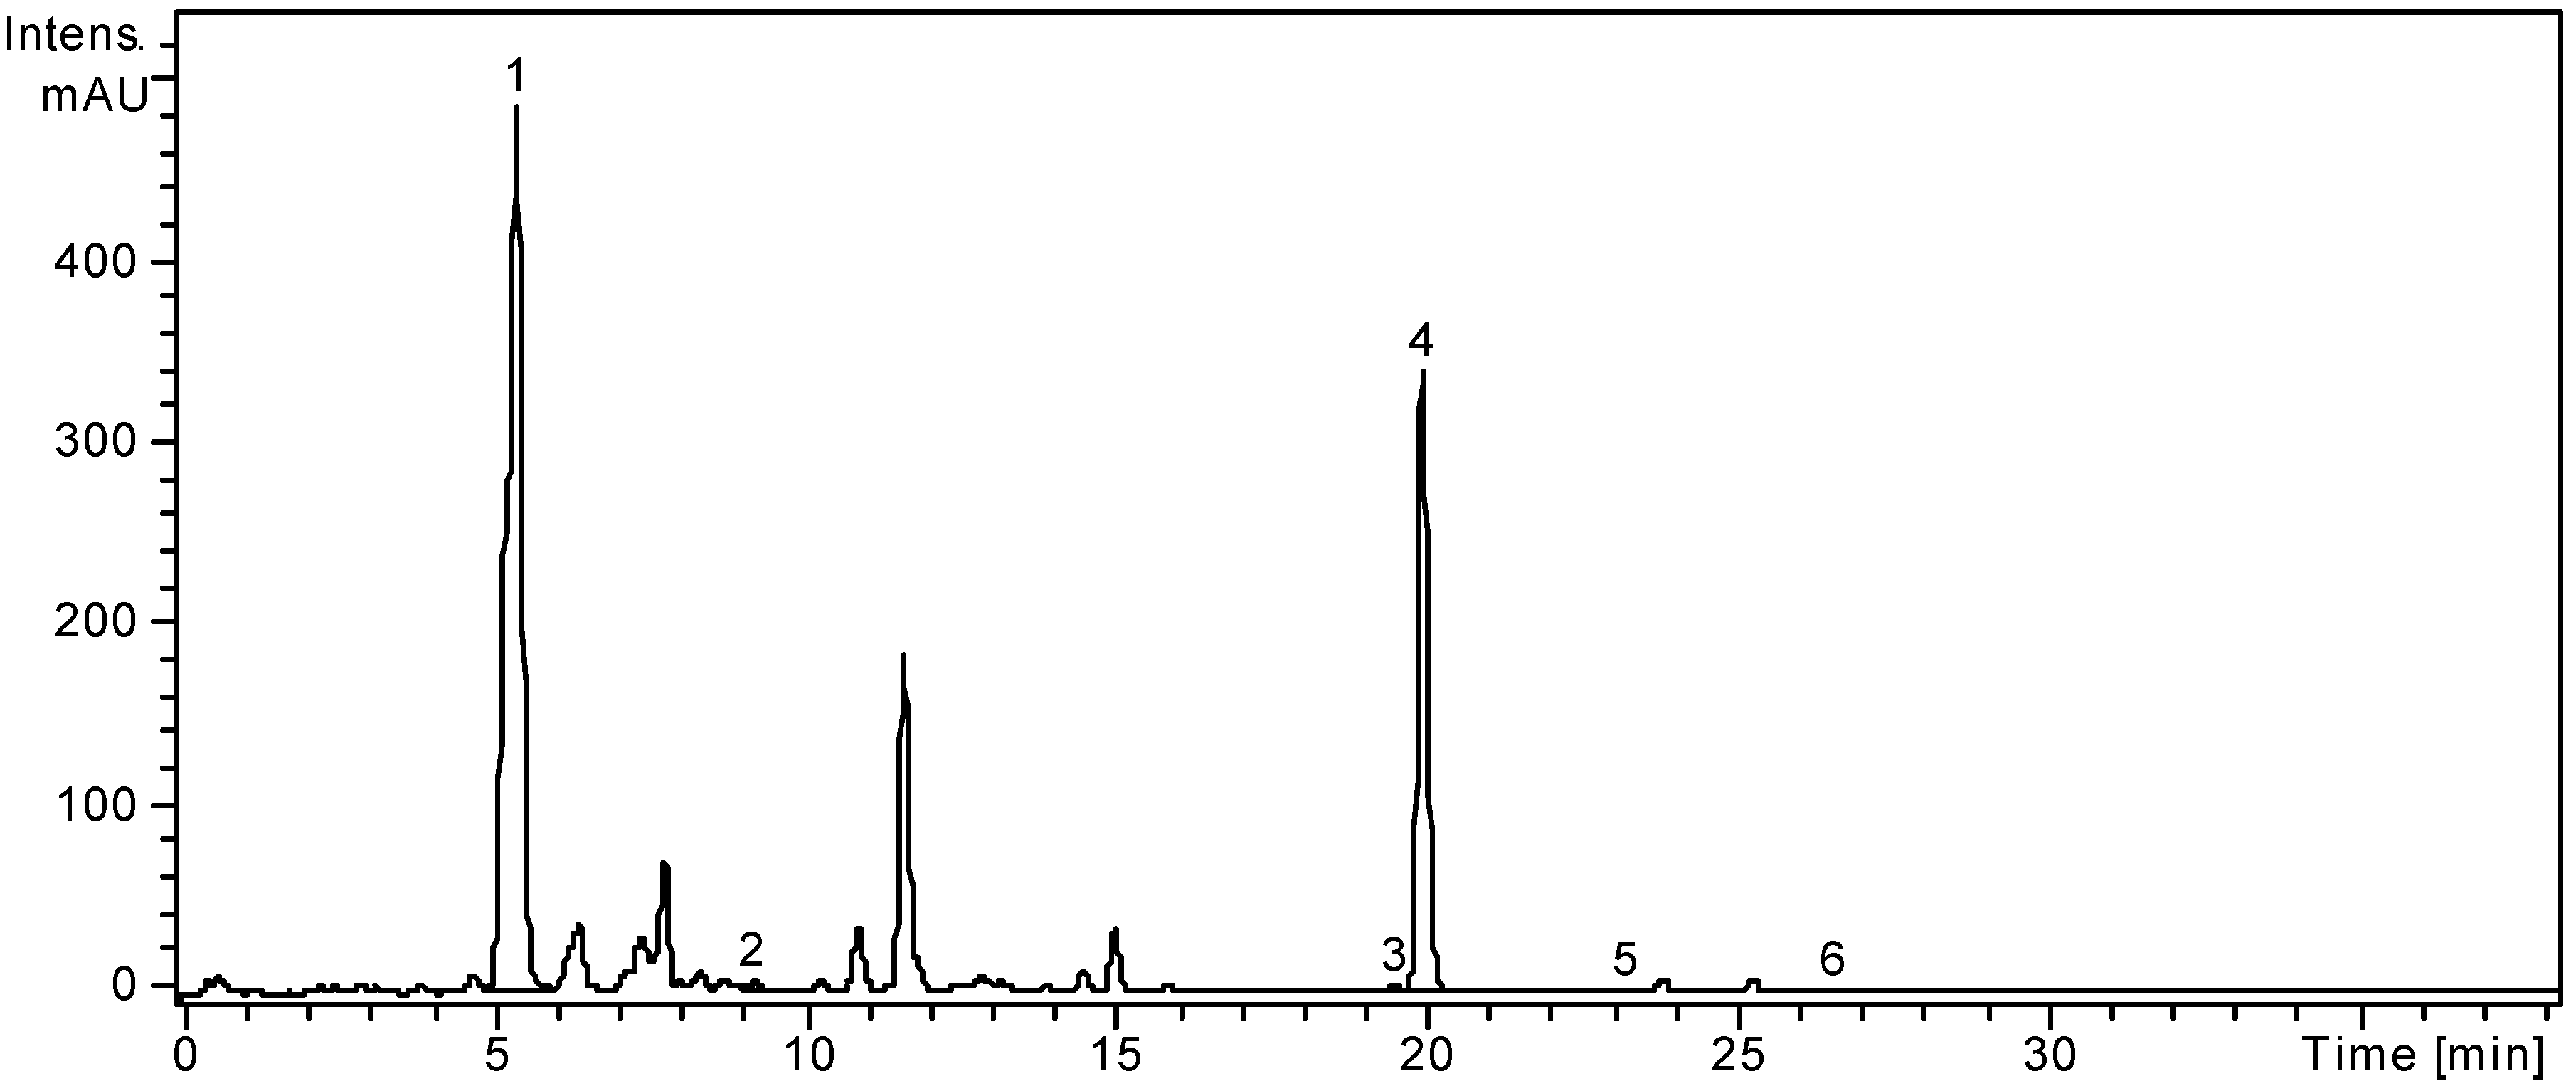
Figure 2.
HPLC chromatogram of L. chinense sample.
Figure 2.
HPLC chromatogram of L. chinense sample.
Notes: Chromatographic conditions as given in the
Experimental Section. Identified compounds: 1, Chlorogenic acid; 2,
p-Coumaric acid; 3, Ferulic acid; 4, Isoquercitrin; 5, Rutin; 6, Quercitrin; 7, Quercetin; 8, Kaempferol.
Gentisic, caffeic, chlorogenic,
p-coumaric, ferulic acids were identified in the ethanolic extract of
L. barbarum, and chlorogenic and
p-coumaric acids were quantified (5899.29 ± 4.46 μg/g, 30.29 ± 0.23 μg/g). Duan
et al., determined the amount of gentisic acid from
L. barbarum leave methanolic extracts by using a capillary electrophoresis method [
49]. Regarding the presence of caffeic, chlorogenic,
p-coumaric and ferulic acids, this is the first report that mentions the presence of caffeic and ferulic acids and quantifies chrologenic and
p-coumaric acids in
L. barbarum leaves. Among the identified flavonoid glycosides, rutin is the main flavonoid in
L. barbarum leaves (5646.66 ± 3.32 μg/g), as already reported by Dong
et al. [
20] and Duan
et al. [
49] and its amount is lower than those authors stated. One flavonoid aglycone, quercetin, could be quantified (5.59 ± 0.06 μg/g) and no previous data was found regarding its presence in
L. barbarum leaves.
In the ethanolic extract of
L. chinense, three hydroxicinnamic acid derivates, namely chlorogenic acid,
p-coumaric acid and ferulic acid were identified and quantified (
Table 1). The highest amount was determined for chlorogenic acid (12045.96 ± 9.25 μg/g). The presence of chlorogenic acid and rutin in the leaves of
L. chinense was also mentioned by Terauchi
et al. in 1997 and quantified by Qian
et al. in 2004 and their amounts are comparable with the results obtained by Qian
et al. [
14,
50].
p-Coumaric and ferulic acids were not mentioned before for
L.
chinense leaves. Protocatechuic acid was already determined by Qian
et al. in aqueous and ethanolic extracts of
L. chinense leaves. Three flavonoid glycosides, isoquercitrin (quercetin 3-glucoside), rutin (quercetin-3-
O-rutinoside) and quercitrin (quercetin 3-rhamnoside) could be identified and quantified as seen in
Table 1, with rutin being the predominant flavonoid (16205.28 ± 8.09 μg/g). Chinese authors also mention rutin as the dominant flavonoid but no previous data were found regarding the presence of isoquercitrin and quercitrin. Other flavonoids like hesperidin were identified and hyperoside, morin and quercetin were quantified by the same Chinese authors in
L. chinense leaves ethanolic extracts [
14]. Free flavonoid aglycones, quercetin and kaempferol were found in small quantities (4.49 ± 0.05, and 2.83 ± 0.03 μg/g, respectively). The presence of quercetin in small amounts was also signaled by Qian
et al. [
14], but no previous information was found regarding the free aglycone, kaempferol in
L. chinense leaves.
Considering the 19 standard compounds used in this study, some other peaks were not identified. The comparative study showed significant differences in the composition of the investigated species, especially quantitative ones, regarding the amounts of rutin and chlorogenic acid as polyphenols. A one-way ANOVA test applied on the concentrations values of the identified compounds listed in
Table 1 showed that there is a highly significant difference between these two extracts (
p < 0.001).
2.2. Determination of Phenolic Compounds Content
The results of the amount of total polyphenolic contents (TPC), flavonoids and caffeic acid derivatives in the two analyzed species are represented in
Table 2. Thus, the TPC values were expressed as gallic acid equivalents (mg GAE/g plant material). The calculation of total flavonoid content was carried out using the standard curve of rutin and presented as rutin equivalents (mg RE/g plant material) and the phenolic acids contents were expressed as caffeic acid equivalents (mg CAE/g plant material).
Table 2.
The content of total polyphenols, flavonoids and caffeic acid derivatives in the extracts.
Table 2.
The content of total polyphenols, flavonoids and caffeic acid derivatives in the extracts.
| Samples | TPC (mg GAE/g Plant Material) | Flavonoids (mg RE/g Plant Material) | Caffeic Acid Derivatives (mg CAE/g Plant Material) |
|---|
| L. barbarum | 61.59 ± 1.68 | 43.73 ± 1.43 | 16.95 ± 0.57 |
| L. chinense | 80.64 ± 2.02 | 61.65 ± 0.95 | 18.80 ± 0.61 |
The extract of
L. chinense contained the highest amount of polyphenols, flavonoidic compounds and caffeic acid derivatives (80.64 ± 2.02, 61.65 ± 0.95, and 18.80 ± 0.61 mg/g respectively). Lower quantities were measured for the
L. barbarum extract (61.59 ± 1.68, 43.73 ± 1.43, and 16.95 ± 0.57 mg/g respectively). As we can already notice, the flavonoids are the major polyphenolic compounds for both species. Comparing the result for
L. barbarum samples with Dong
et al. we can conclude that our samples were richer in flavonoids than what Chinese authors reported, but the amount of rutin, as main flavonoidic compound was lower [
20]. No previous data regarding the total amounts of polyphenols, flavonoids and caffeic acid derivatives in
L. chinense was found. The obtained results for this study suggest that both species can be considered as important source of flavonoids.
2.3. Antioxidant Activity
The antioxidant activity of the ethanolic extracts of
L. barbarum and
L. chinense leaves was evaluated using the DPPH bleaching assay, Trolox equivalent antioxidant capacity (TEAC) method, hemoglobin ascorbate peroxidase activity inhibition (HAPX) assay and by testing the inhibition of lipid peroxidation catalyzed by cytochrome
c, as shown in
Table 3 and
Figure 3.
Table 3.
Antioxidant capacity parameters obtained using several methods for studied samples.
Table 3.
Antioxidant capacity parameters obtained using several methods for studied samples.
| Samples | DPPH (µg QE/mg Plant Material) | TEAC (µg TE/mg Plant Material) | HAPX (%) |
|---|
| L. barbarum | 29.30 ± 4.34 | 35.72 ± 6.29 | 29.69 ± 2.21 |
| L. chinense | 36.80 ± 0.65 | 55.95 ± 0.88 | 40.86 ± 2.21 |
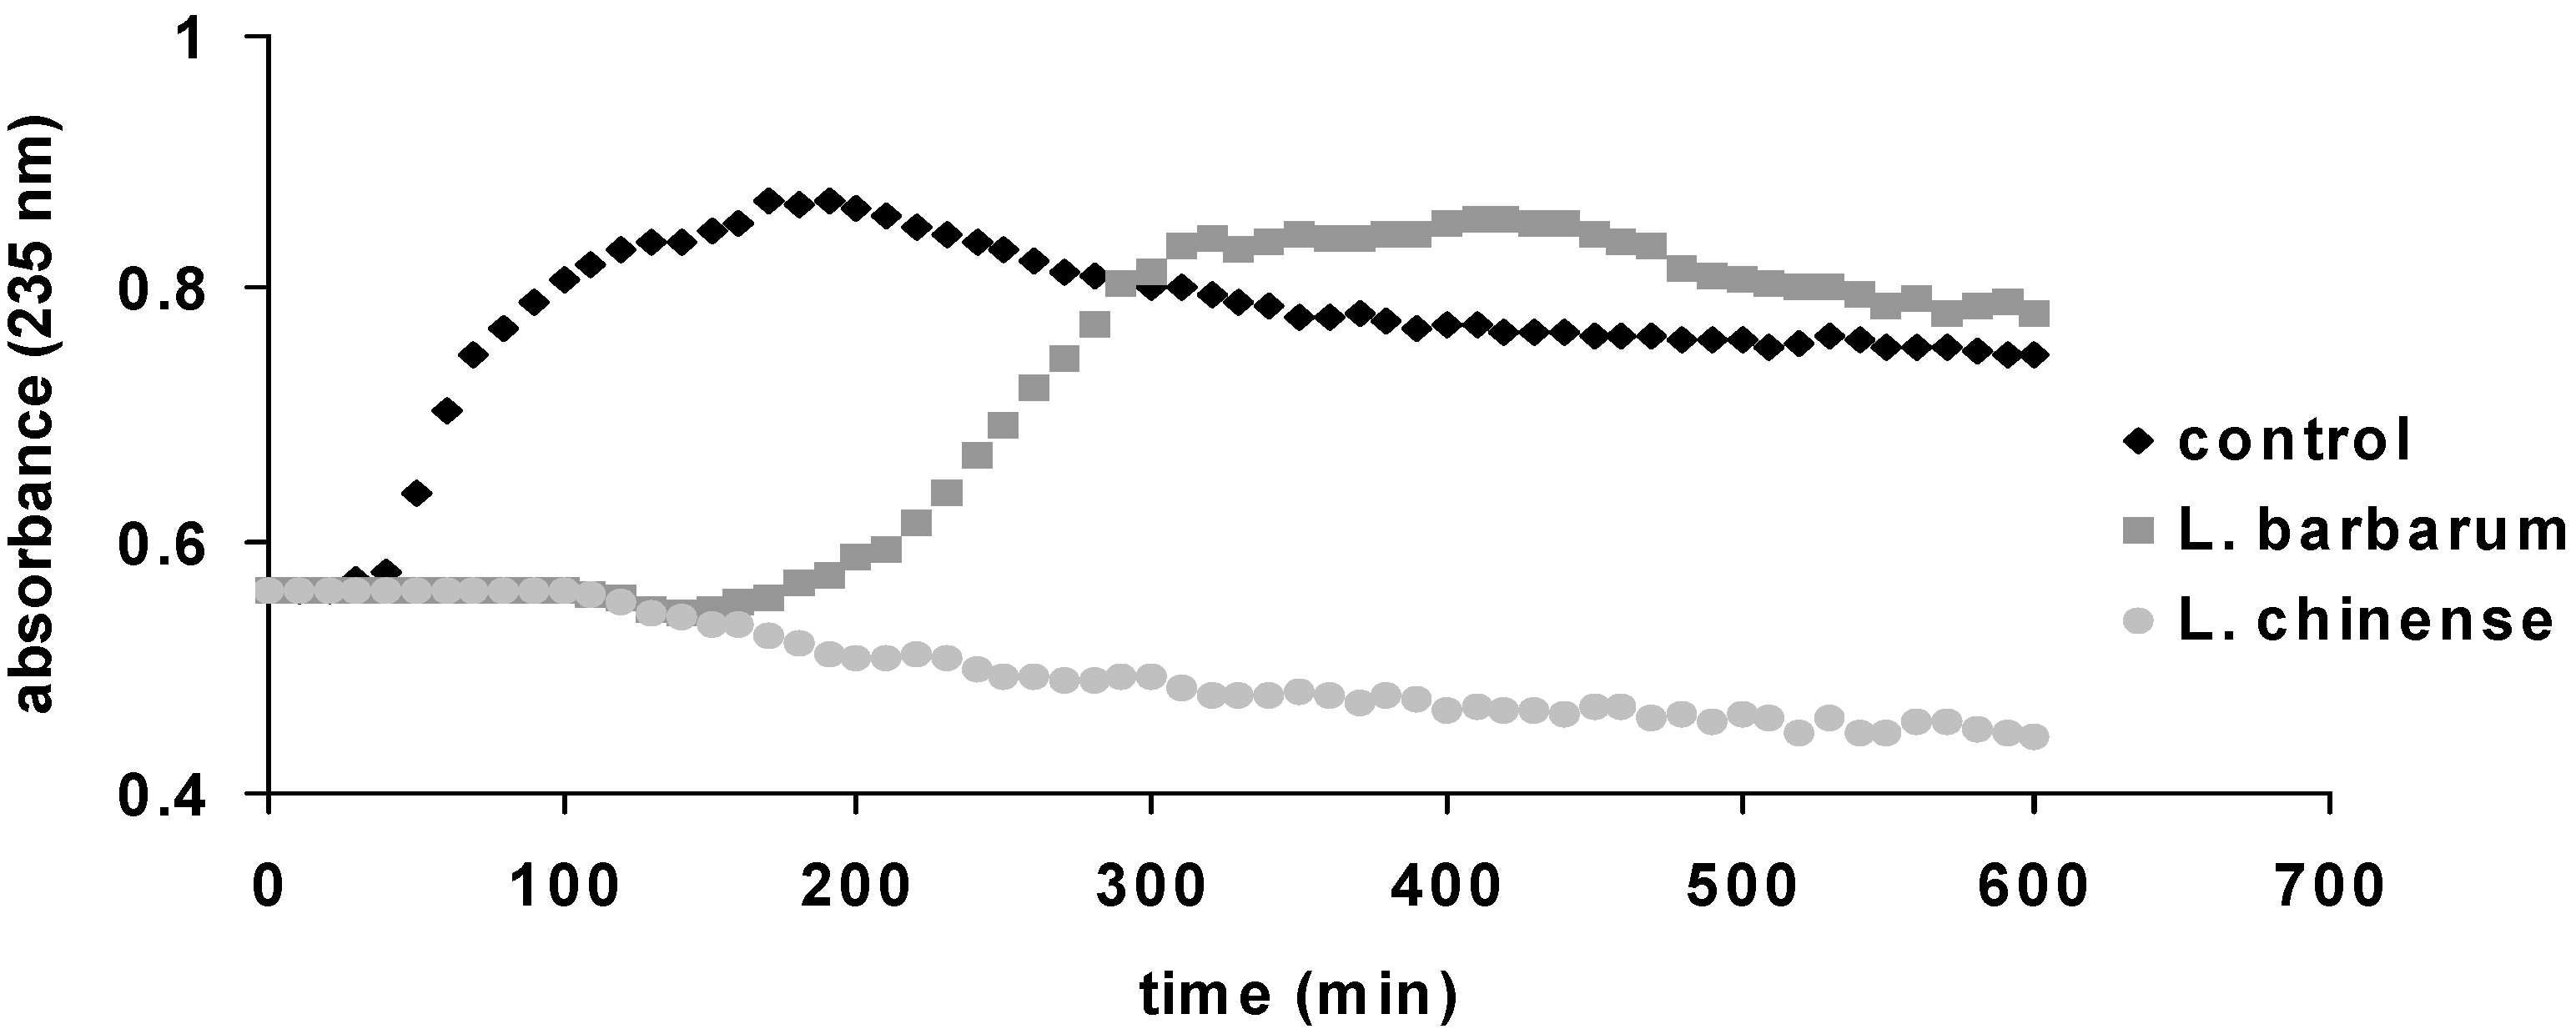
Figure 3.
Liposome oxidation by cytochrome c, in the presence of the tested samples.
Figure 3.
Liposome oxidation by cytochrome c, in the presence of the tested samples.
Note: Monitoring at 235 nm (specific for lipid oxidation).
The antioxidant activity of the two ethanol extracts was assessed by the DPPH radical bleaching method and the results were presented as quercetin equivalents (
Table 3). The highest radical scavenging activity was shown by
L. chinense (36.80 ± 0.65 µg QE/mg plant material), while the
L. barbarum extract exhibited a lower, but also important antioxidant activity. In this case, the percentage of DPPH consumption was converted to quercitin equivalents by using a calibration curve (
R2 = 0.99) with quercetin standard solutions of 0–12 µM. The higher the rate of DPPH consumption is, the more powerful the antioxidant capacity.
The TEAC results are in agreement with the DPPH values and are also correlated with HAPX results and with total polyphenols, flavonoids and caffeic acid derivatives. DPPH and TEAC assays are both based on the same principle (free radical scavenging by electron transfer mechanism) and use synthetic radicals which react directly with antioxidants to quantify the antioxidant capacity of the sample; the notable difference is that in case of TEAC and HAPX assays, the solution is aqueous rather than ethanolic.
The newly developed and more physiologically relevant enzymatic assay (HAPX method) measures the capability of the extract components to quench the damage inflicted by hydrogen peroxide upon hemoglobin. This contributes with additional valuable information since it implies the interaction of the antioxidants molecules with a protein,
i.e., the physiological-relevant ferryl hemoglobin species (resulted by the action of hydrogen peroxide upon ferric hemoglobin) [
53,
54].
Another complex and arguably more physiologically relevant method based on peroxidase activity of cytochrome
c was developed recently to evaluate the antioxidant capacity of the two ethanolic extracts. This process monitors the formation of lipid conjugated dienes at 235 nm. The antioxidant capacity of the tested extracts, reflected in the delay of the onset of lipid oxidation, is expected to be based on the same mechanism found in HAPX: the interaction of antioxidants with ferryl, generated in this case in cytochrome
c [
54,
55]. In the lipid oxidation experiments, both extracts also demonstrated an antioxidant capacity and a good correlation with the TEAC and DPPH results, by inhibition of lipid peroxidation catalyzed by cytochrome
c (
Figure 3). The
L. barbarum extract delays the oxidation of lipids about 100 min, while the
L. chinense extract completely blocks the oxidation during the time of the experiment (600 min). According to Yang
et al. the inhibition of lipid peroxidation is in direct correlation with increasing concentrations of rutin [
56]. Thus
L. chinense extract possesses a higher antioxidant activity.
The antioxidant activities of
L. barbarum and
L. chinense extracts were explored using four different tests, the simplest and traditionally TEAC and DPPH assays and two more complex and physiologically new relevant methods based on peroxidase activity of hemoglobin and cytocrome
c. The antioxidant activity of vegetal extracts is strongly related with their chemical composition. As a peculiarity,
L. chinense and
L. barbarum leaves contain important amounts of flavonoids, from which the major compound was rutin and chlorogenic acid. High concentrations of rutin and chlorogenic acid are reflected in significant scavenging properties [
56,
57]. Comparing with our extracts, same concentrations of standard rutin exhibit lower antioxidant properties [
56]. This is in line with the work of Terauchi
et al. and Qian
et al. and sustain that the antioxidant potential of these extracts is correlated with the amounts of rutin and chlorogenic acid and also influenced by the presence of other compounds as seen in
Table 1 [
14,
50]. Comparing with other medicinal representatives that subjected the same antioxidant assays,
L. chinense exhibits higher antioxidant activity than
Achillea distans subsp.
alpina and
Ocimum basilicum [
51,
52].
In conclusion, results show a good correlation between methods as well as with the content of the total polyphenols, flavonoids and caffeic acid derivatives, with a notable antioxidant activity in both extracts. The highest activity is seen for L. chinense. There was no significantly statistical difference between the analyzed extracts in the DPPH assay (p > 0.05), but significant differences in TEAC and HAPX methods (0.001 < p < 0.05).
2.4. Antimicrobial Activity
Plants are important source of potentially useful structures for the development of new chemotherapeutic agents. The first step towards this goal is the
in vitro antibacterial activity assay [
58]. The results of testing the
L. barbarum and
L. chinense extracts for antimicrobial activities against both Gram-positive and Gram-negative bacteria are summarized in
Table 4. Results obtained in the present study relieved that
L. chinense extract was found to be more active than
L. barbarum against both Gram-positive and Gram-negative bacterial strains. The best antibacterial activity was shown by
L. chinense extract against
Bacillus subtilis.
Table 4.
Antibacterial activity of L. barbarum and L. chinense extracts and antibiotic against bacterial species tested by disc diffusion assay.
Table 4.
Antibacterial activity of L. barbarum and L. chinense extracts and antibiotic against bacterial species tested by disc diffusion assay.
| Bacterial Strains | Standard Antibiotic | Inhibition Zone (mm) |
|---|
| | Gentamicin | L. barbarum | L. chinense |
|---|
| Staphylococcus aureus | 9.1 ± 0.9 | 13.1 ± 0.9 | 12.1 ± 0.9 |
| Bacillus subtilis | 17.2 ± 0.8 | 17.2 ± 0.6 | 24.2 ± 0.6 |
| Listeria monocytogenes | 12.3 ± 0.8 | 13.1 ± 0.3 | 21.6 ± 0.8 |
| Escherichia coli | 12.3 ± 0.9 | 12.3 ± 0.8 | 14.5 ± 0.4 |
| Salmonella typhimurium | 15.1 ± 0.8 | 12.4 ± 0.7 | 19.6 ± 0.3 |
The strains of
L. monocytogenes and
S. typhimurium are also sensitive to the
L. chinense extract with a zone of inhibition between 19–21 mm of diameter. The results obtained from the antimicrobial properties can make
L. chinense a source of antibiotic having inhibited microbial growth. This is in line with the work of Dahech
et al. [
1].
The MIC values obtained from antimicrobial tests ranged from 50 to >100 µg/mL (
Table 5). The results showed that the bacterial strains
S.
typhimurium was the most sensitive to both
L. barbarum and
L. chinense extracts with MIC value of 75 µg/mL and 50 µg/mL, respectively. Alternatively,
S. aureus and
L. monocytogenes were the least sensitive strains for both
Lycium sp. extracts with MIC value >100 µg/mL. According to Salvat
et al. plant extracts with MIC’s less than/or around 0.5 mg/mL indicate good antibacterial activity. Accordingly,
L. chinense and
L. barbarum extracts exhibited good antimicrobial activity against most of the tested microorganisms [
59].
Table 5.
Minimal Inhibitory Concentration (MIC) of both L. barbarum and L. chinense extracts.
Table 5.
Minimal Inhibitory Concentration (MIC) of both L. barbarum and L. chinense extracts.
| Bacterial Strains | MIC (µg/mL) |
|---|
| | L. barbarum | L. chinense |
|---|
| Staphylococcus aureus | >100 | >100 |
| Bacillus subtilis | 100 | 75 |
| Listeria monocytogenes | >100 | >100 |
| Escherichia coli | 100 | 75 |
| Salmonella typhimurium | 75 | 50 |

 ,
, 


