Three New Phenolics and Other Constituents from the Seeds of Lithocarpus pachylepis

Abstract
:1. Introduction
2. Results and Discussion
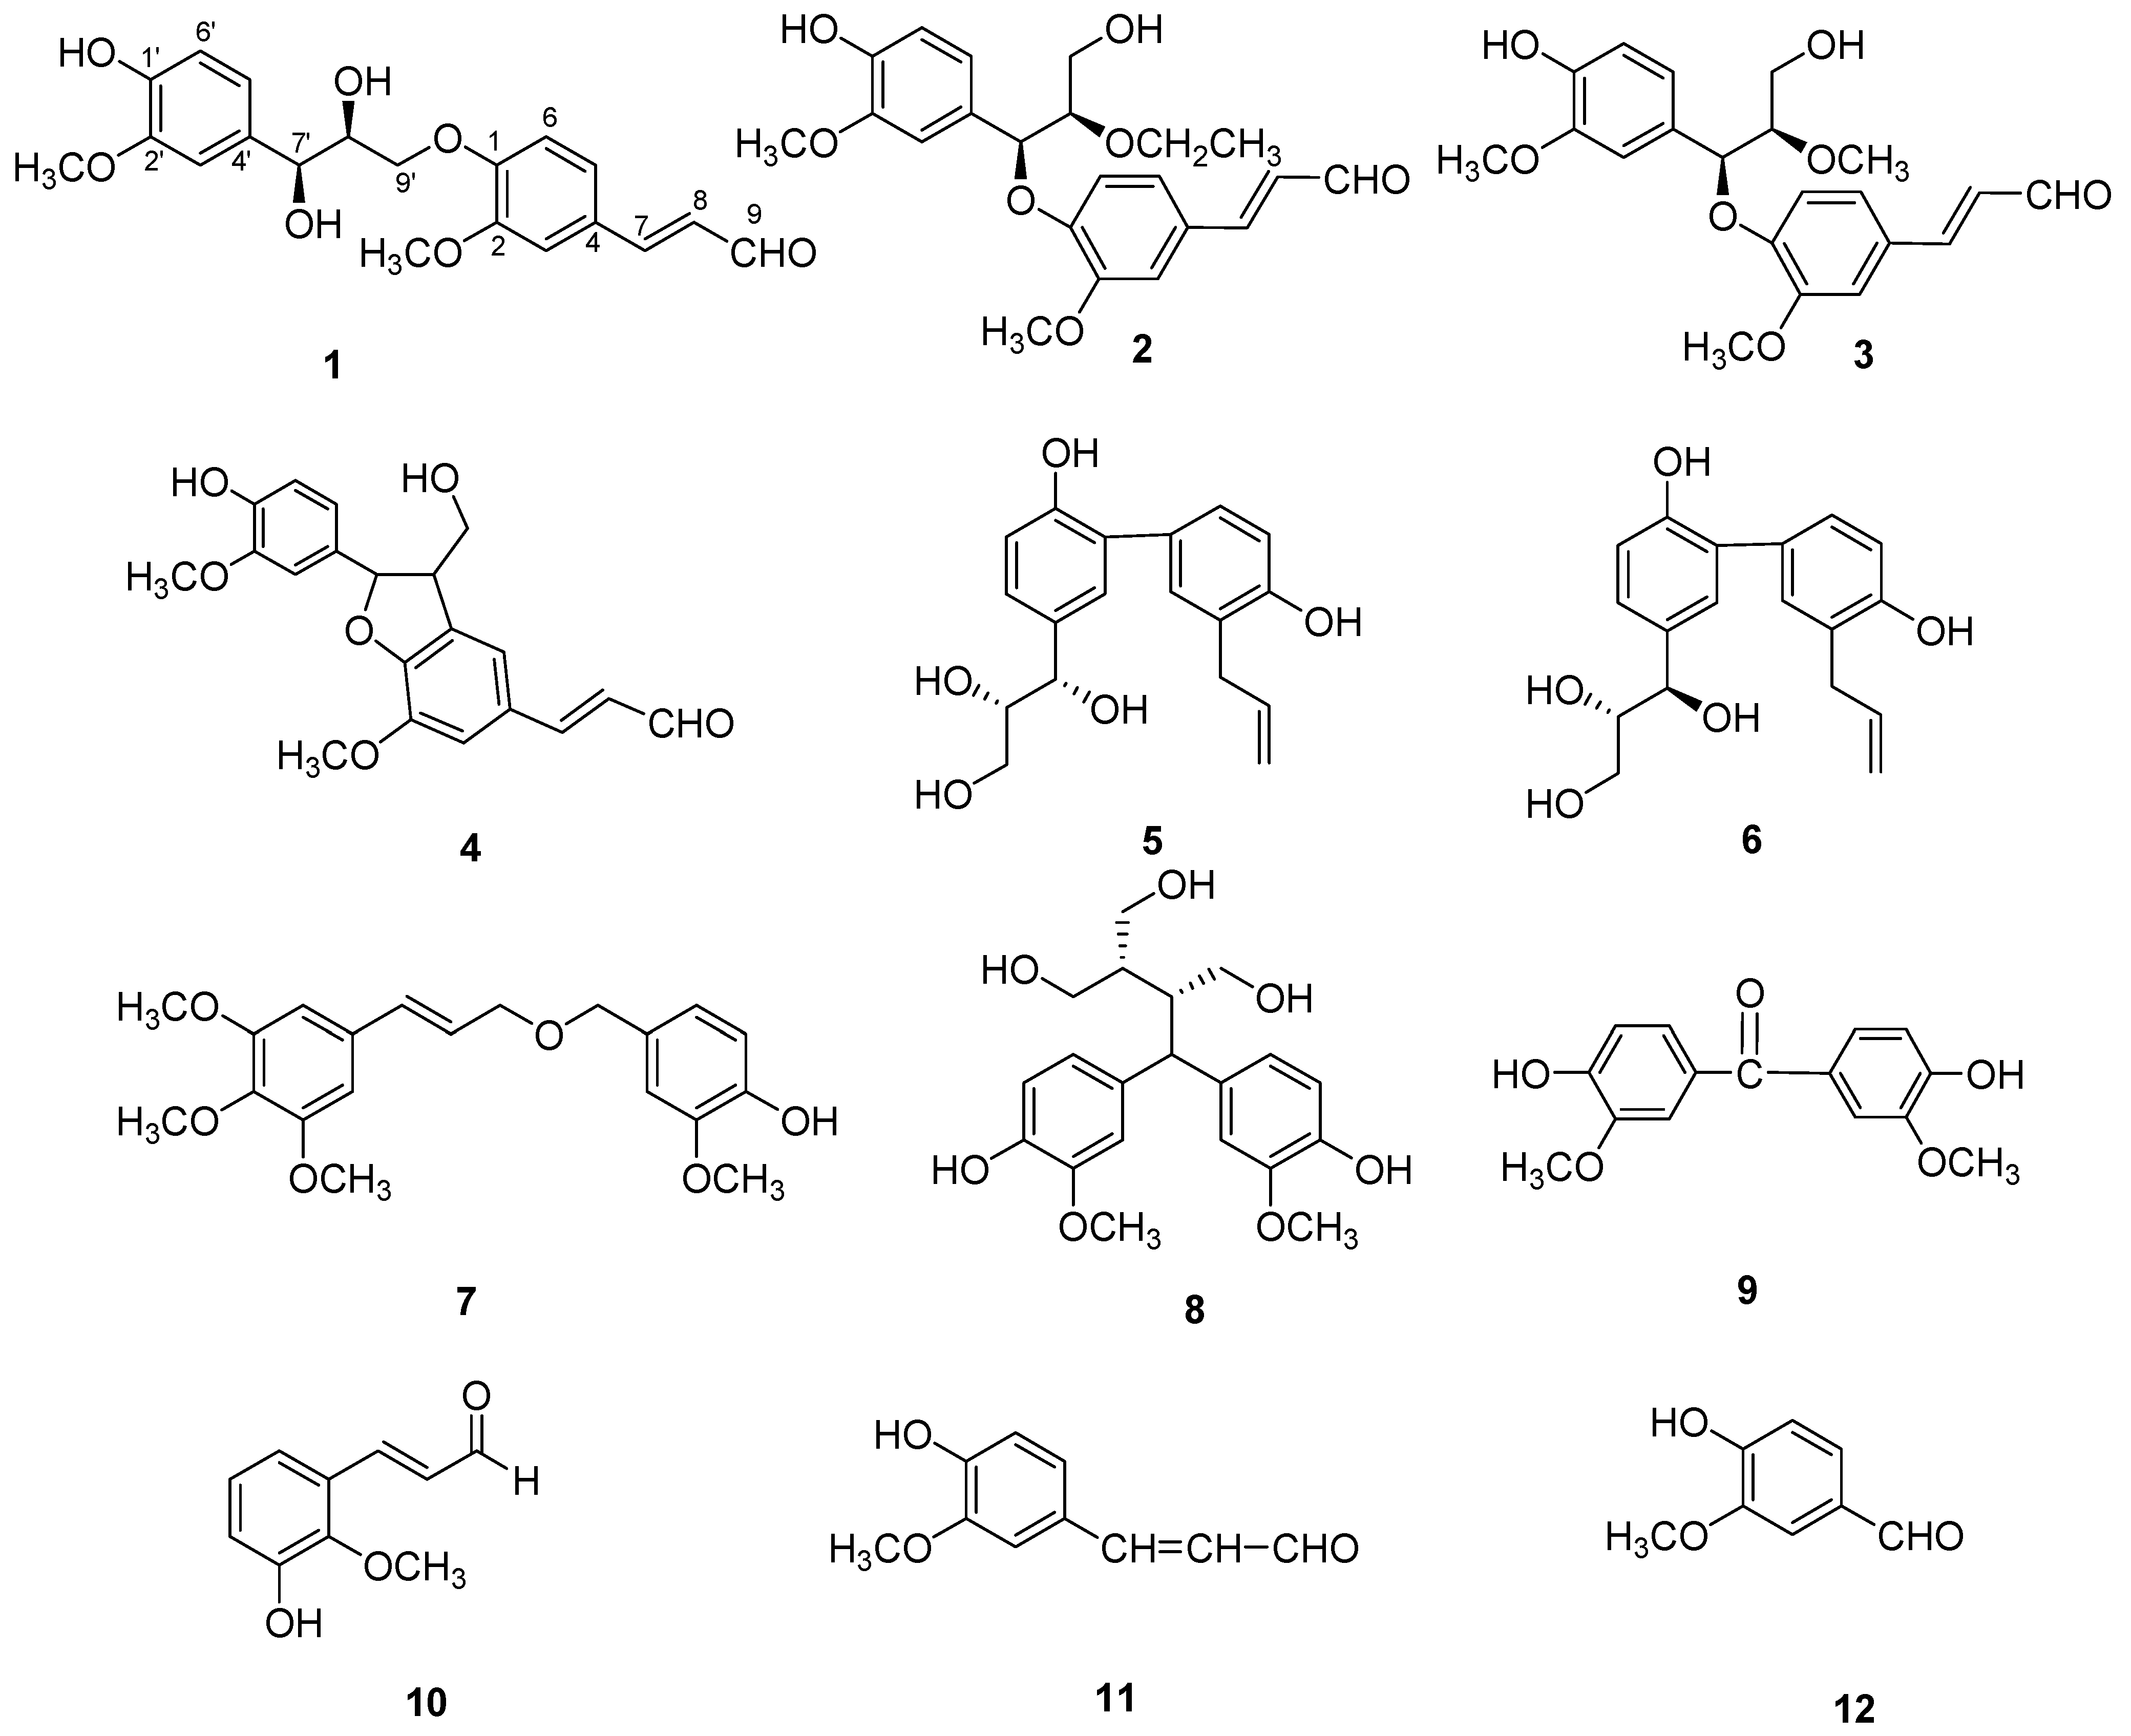
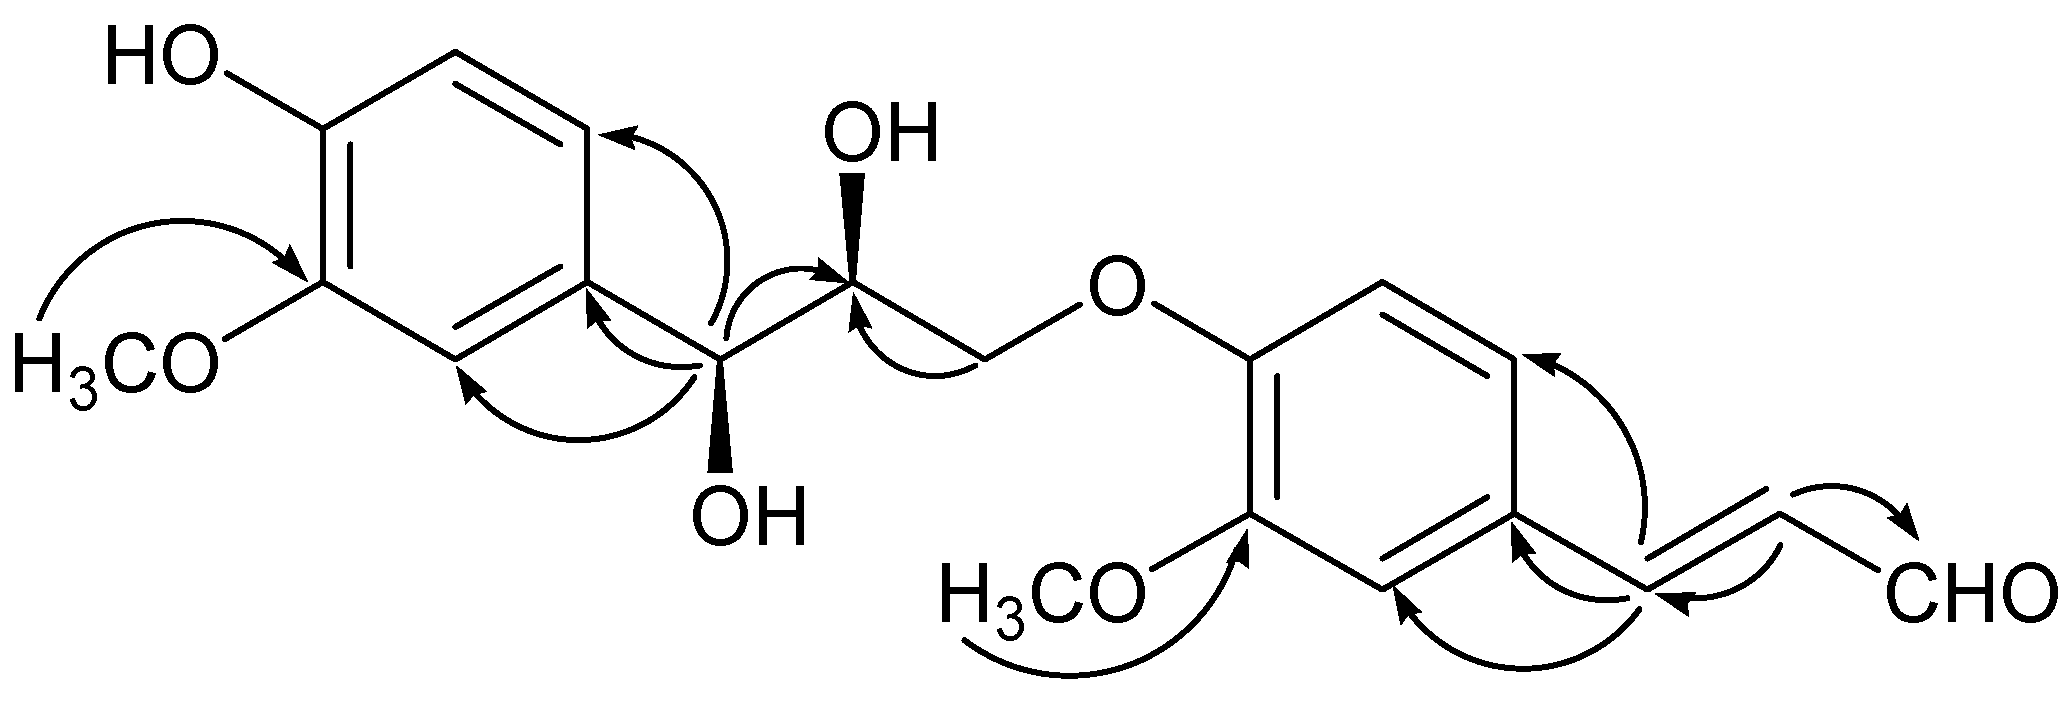
 −0.2 (c = 0.10, MeOH). It possessed the molecular formula C20H22O7, as revealed by its HR-ESI-MS (m/z: 397.1279 [M + Na]+, calcd: 397.1263). The IR spectrum showed a hydroxyl absorption at 3,518 cm−1 and an α,β-unsaturated CHO group at 1,670 cm−1. A bathochromic shift was observed upon addition of alkali, indicating that the presence of a phenolic benzenoid moiety [5]. The 1H-NMR spectrum of 1 (Table 1) showed the presence of two ABX system aromatic rings [δH 7.22 (d, J = 1.8), 7.16 (dd, J = 8.4, 1.8), 7.01 (d, J = 8.4); δH 7.04 (d, J = 1.8), 6.85 (dd, J = 8.4, 1.8), 6.71 (d, J = 8.4)], two methoxyl groups (δH: 3.78, 3.83), one trans-configuration double bond (δH: 7.58, d, J = 15.6; 6.65, dd, J = 15.6, 7.8) and one aldehyde group (δH: 9.58, d, J = 7.8).
| Position | 1 | 2 | 3 | |||
|---|---|---|---|---|---|---|
| δC | δH | δC | δH | δC | δH | |
| 1 | 152.9 | 153.0 | 153.2 | |||
| 2 | 152.0 | 152.1 | 152.1 | |||
| 3 | 113.1 | 7.22 (d, 1.8) | 113.1 | 7.21 (d, 1.8) | 113.0 | 7.21 (d, 1.8) |
| 4 | 129.5 | 129.4 | 129.6 | |||
| 5 | 124.6 | 7.16 (dd, 8.4, 1.8) | 124.5 | 7.14 (dd, 8.4, 1.8) | 124.2 | 7.16 (dd, 8.4,1.8) |
| 6 | 117.5 | 7.01 (d, 8.4) | 116.4 | 6.98 (d, 8.4) | 116.5 | 6.94 (d, 8.4) |
| 7 | 155.6 | 7.58 (d, 15.6) | 155.6 | 7.57 (d, 15.6) | 155.6 | 7.54 (d, 15.6) |
| 8 | 127.9 | 6.65 (dd, 15.6, 7.8) | 127.8 | 6.67 (dd, 15.6, 7.8) | 127.8 | 6.67 (dd, 15.6,7.8) |
| 9 | 196.3 | 9.58 (d, 7.8) | 196.2 | 9.59 (d, 7.8) | 196.4 | 9.60 (d, 7.8) |
| 1′ | 147.3 | 147.3 | 147.3 | |||
| 2′ | 148.9 | 149.1 | 149.0 | |||
| 3′ | 112.3 | 7.04 (d, 1.8) | 112.8 | 6.96 (d, 1.8) | 112.8 | 6.96 (d, 1.8) |
| 4′ | 134.2 | 131.6 | 131.2 | |||
| 5′ | 121.4 | 6.85 (dd, 8.4, 1.8) | 117.4 | 6.82 (dd, 7.8, 1.8) | 117.4 | 6.82 (dd, 7.8,1.8) |
| 6′ | 115.8 | 6.71 (d, 8.4) | 115.9 | 6.74 (d, 7.8) | 115.9 | 6.76 (d, 7.8) |
| 7′ | 74.4 | 4.82 (d, 3.6) | 76.0 | 4.50 (d, 3.6) | 79.5 | 4.55 (d, 3.6) |
| 8′ | 85.6 | 4.55 (m) | 84.9 | 4.61 (m) | 85.2 | 4.64 (m) |
| 9′ | 72.7 | 3.50 (dd, 12.0, 5.4) | 62.8 | 3.48 (m) | 62.6 | 3.47 (m) |
| 3.85 (dd, 12.0, 3.6) | 3.89 (m) | 3.86 (m) | ||||
| 2-OCH3 | 56.9 | 3.83 (s) | 56.8 | 3.83 (s) | 56.7 | 3.81 (s) |
| 2′-OCH3 | 56.6 | 3.78 (s) | 56.6 | 3.80 (s) | 56.6 | 3.79 (s) |
| 8′-OCH2CH3 | 65.2 | 3.42 (m); 3.85 (m) | ||||
| 8′-OCH2CH3 | 15.8 | 1.17 (t, 7.2) | ||||
| 8′-OCH3 | 51.9 | 3.15 (s) | ||||

| Compounds | IC50 (μM) |
|---|---|
| 1 | 16.4 ± 1.1 |
| 2 | 10.9 ± 0.6 |
| 3 | 11.8 ± 0.3 |
| 4 | 24.5 ± 2.5 |
| 5 | 34.7 ± 0.8 |
| 6 | 29.8 ± 1.7 |
| 7 | 27.1 ± 3.6 |
| 8 | 12.3 ± 1.2 |
| 9 | 21.5 ± 1.4 |
| Aminoguanidine a | 6.8 ± 0.4 |
3. Experimental
3.1. General
3.2. Plant Material
3.3. Extraction and Isolation
3.4. Spectral Data
−0.2 (c = 0.10, MeOH). UV λmax (MeOH) nm (log ε): 285 (3.15), 256 (3.78), 212 (4.16). IR (KBr) cm−1 3518, 1670. 1H and 13C-APT (CD3OD): See Table 1. HR-ESI-MS m/z: 397.1279 [M + Na]+ (Calcd for 397.1263). −0.38 (c = 0.09, MeOH). UV λmax (MeOH) nm (log ε): 285 (3.42), 256 (4.01), 212 (4.62). IR (KBr) cm−1 3524, 1674. 1H and 13C-APT (CD3OD): See Table 1. HR-ESI-MS m/z: 425.1564 [M + Na]+ (Calcd for 425.1576). −0.36 (c = 0.08, MeOH). UV λmax (MeOH) nm (log ε): 285 (3.23), 256 (3.61), 212 (4.04). IR (KBr) cm−1 3520, 1672. 1H and 13C-APT (CD3OD): See Table 1. HR-ESI-MS m/z: 411.1416 [M + Na]+ (Calcd for 411.1420).4. Conclusions
Acknowledgments
Conflicts of Interest
References
- Jiangsu New Medical College. Chinese Drug Dictionary; Shanghai Science and Technology Publishing: Shanghai, China, 1977; pp. 372–377. [Google Scholar]
- Sy, L.K.; Brown, G.D. Coniferaldehyde derivatives from tissue culture of Artemisia annua and Tanacetum parthenium. Phytochemistry 1999, 50, 781–785. [Google Scholar] [CrossRef]
- Chen, C.C.; Ni, C.L.; Chen, Y.C.; Huang, Y.L.; Kuo, C.H.; Wu, T.S.; Chen, C.C. Phenolic constituents from the stem bark of Magnolia officinalis. J. Nat. Prod. 2009, 72, 168–171. [Google Scholar] [CrossRef]
- Kumar, U.S.; Tiwar, A.K.; Reddy, S.V.; Aparna, P.; Rao, R.J.; Ali, A.Z.; Rao, J.M. Free-radical-scavenging and xanthine oxidase inhibitory constituents from Stereospermum personatum. J. Nat. Prod. 2005, 68, 1615–1621. [Google Scholar] [CrossRef]
- Liang, S.; Shen, Y.H.; Tian, J.M.; Wu, Z.J.; Jin, H.Z.; Zhang, W.D.; Yan, S.K. Phenylpropanoids from Daphne feddei and their inhibitory activities against NO production. J. Nat. Prod. 2008, 71, 1902–1905. [Google Scholar] [CrossRef]
- Chang, H.S.; Lee, S.J.; Yang, C.W.; Chen, I.S. Cytotoxic sesquiterpenes from Magnolia kachirachirai. Chem. Biodivers. 2010, 7, 2737–2747. [Google Scholar] [CrossRef]
- Ngoc, T.M.; Lee, I.; Ha, D.T.; Kim, H.J.; Min, B.S.; Bae, K. Tyrosinase-inhibitory constituents from the twigs of Cinnamomum cassia. J. Nat. Prod. 2009, 72, 1205–1208. [Google Scholar] [CrossRef]
- Suo, M.; Isao, H.; Kato, H.; Takano, F.; Ohta, T. Anti-inflammatory constituents from Tabebuia avellanedae. Fitoterapia. 2012, 83, 1484–1488. [Google Scholar] [CrossRef]
- Ma, G.X.; Wu, H.F.; Yuan, J.Q.; Wu, L.Z.; Zheng, Q.X.; Sun, Z.C.; Fan, X.R.; Wei, H.; Yang, J.S.; Xu, X.D. Phenylpropanoid constituents from the seeds of Lithocarpus pachylepis. Phyto. Lett. 2013, 6, 152–155. [Google Scholar] [CrossRef]
- Cho, J.Y.; Balk, K.U.; Yoo, E.S.; Yoshikawa, K.; Park, M.H. In vitro antiinflammatory effects of neolignan woorenosides from the rhizomes of Coptis Japonica. J. Nat. Prod. 2000, 63, 1205–1209. [Google Scholar] [CrossRef]
- Sample Availability: Samples of the compounds are available from the authors.
© 2013 by the authors; licensee MDPI, Basel, Switzerland. This article is an open access article distributed under the terms and conditions of the Creative Commons Attribution license (http://creativecommons.org/licenses/by/3.0/).
Share and Cite
Xie, Y.; Ma, G.; Wei, H.; Yuan, J.; Wu, H.; Zhou, X.; Yang, J.; Xu, X. Three New Phenolics and Other Constituents from the Seeds of Lithocarpus pachylepis. Molecules 2013, 18, 10397-10403. https://doi.org/10.3390/molecules180910397
Xie Y, Ma G, Wei H, Yuan J, Wu H, Zhou X, Yang J, Xu X. Three New Phenolics and Other Constituents from the Seeds of Lithocarpus pachylepis. Molecules. 2013; 18(9):10397-10403. https://doi.org/10.3390/molecules180910397
Chicago/Turabian StyleXie, Yong, Guoxu Ma, Hua Wei, Jingquan Yuan, Haifeng Wu, Xiaolei Zhou, Junshan Yang, and Xudong Xu. 2013. "Three New Phenolics and Other Constituents from the Seeds of Lithocarpus pachylepis" Molecules 18, no. 9: 10397-10403. https://doi.org/10.3390/molecules180910397