1. Introduction
Cordyceps, found distributed mostly in the Gansu, Qinghai, Sichuan, Tibet and Yunnan provinces of China [
1], has been widely used in Traditional Chinese Medicine (TCM) [
1].
Cordyceps extracts have been shown to exhibit multiple pharmacological activities, such as anti-inflammatory and humoral-immunity suppressive properties [
2,
3,
4]. Chemical studies have revealed that
Cordyceps contains various components such as nucleosides and their bases, carbohydrates and sterols [
5].Nucleosides and their bases are currently regarded as the bioactive components in
Cordyceps [
6,
7]. Recent studies have indicated that nucleosides and nucleobases are involved in the regulation and modulation of human physiological processes [
8,
9]. Nucleosides and nucleobases have also been shown to exhibit various bioactivities [
10,
11], such as anti-platelet aggregation as well as anti-arrhythmic and anti-seizure effects [
12,
13,
14]. Therefore, a specific and sensitive method to analyze these compounds is essential for the quality control of
Cordyceps.
Various methods have been developed to detect nucleosides and nucleobases in
Cordyceps, including reverse-phase high-performance liquid chromatography (RP–HPLC) [
15,
16], ultra-performance liquid chromatography (UPLC) [
17], ion-pair reverse-phase chromatography (IP-RPC) [
18,
19], liquid chromatography–mass spectrometry (LC-MS) [
20,
21], capillary electrophoresis (CE) [
22,
23] and capillary electrophoresis–mass spectrometry (CE-MS) [
24]. However, these methods have shown several disadvantages such as low separation efficiency for polar compounds, low sensitivity and uncertainty for non-target compounds without reference standards. Thus, these techniques cannot be used to characterize and quantitatively analyze multiple nucleosides and nucleobases in the extracts of
Cordyceps, which exhibit high polarity and have complex matrices.
The HILIC method for the separation of polar compounds was developed by Alpert in 1990 [
25]. In contrast to RP–HPLC, a hydrophilic polar stationary phase was used in HILIC, showing good reservation and separation efficiency for polar compounds. HILIC has been used in the analysis of several polar compounds in TCMs such as
Ligusticum chuanxiong [
26] and several medicinal marine organisms [
27]. However, the possibility of simultaneously separating the 15 nucleosides, nucleobases and other components in the
Cordyceps samples by using HILIC remains unknown.
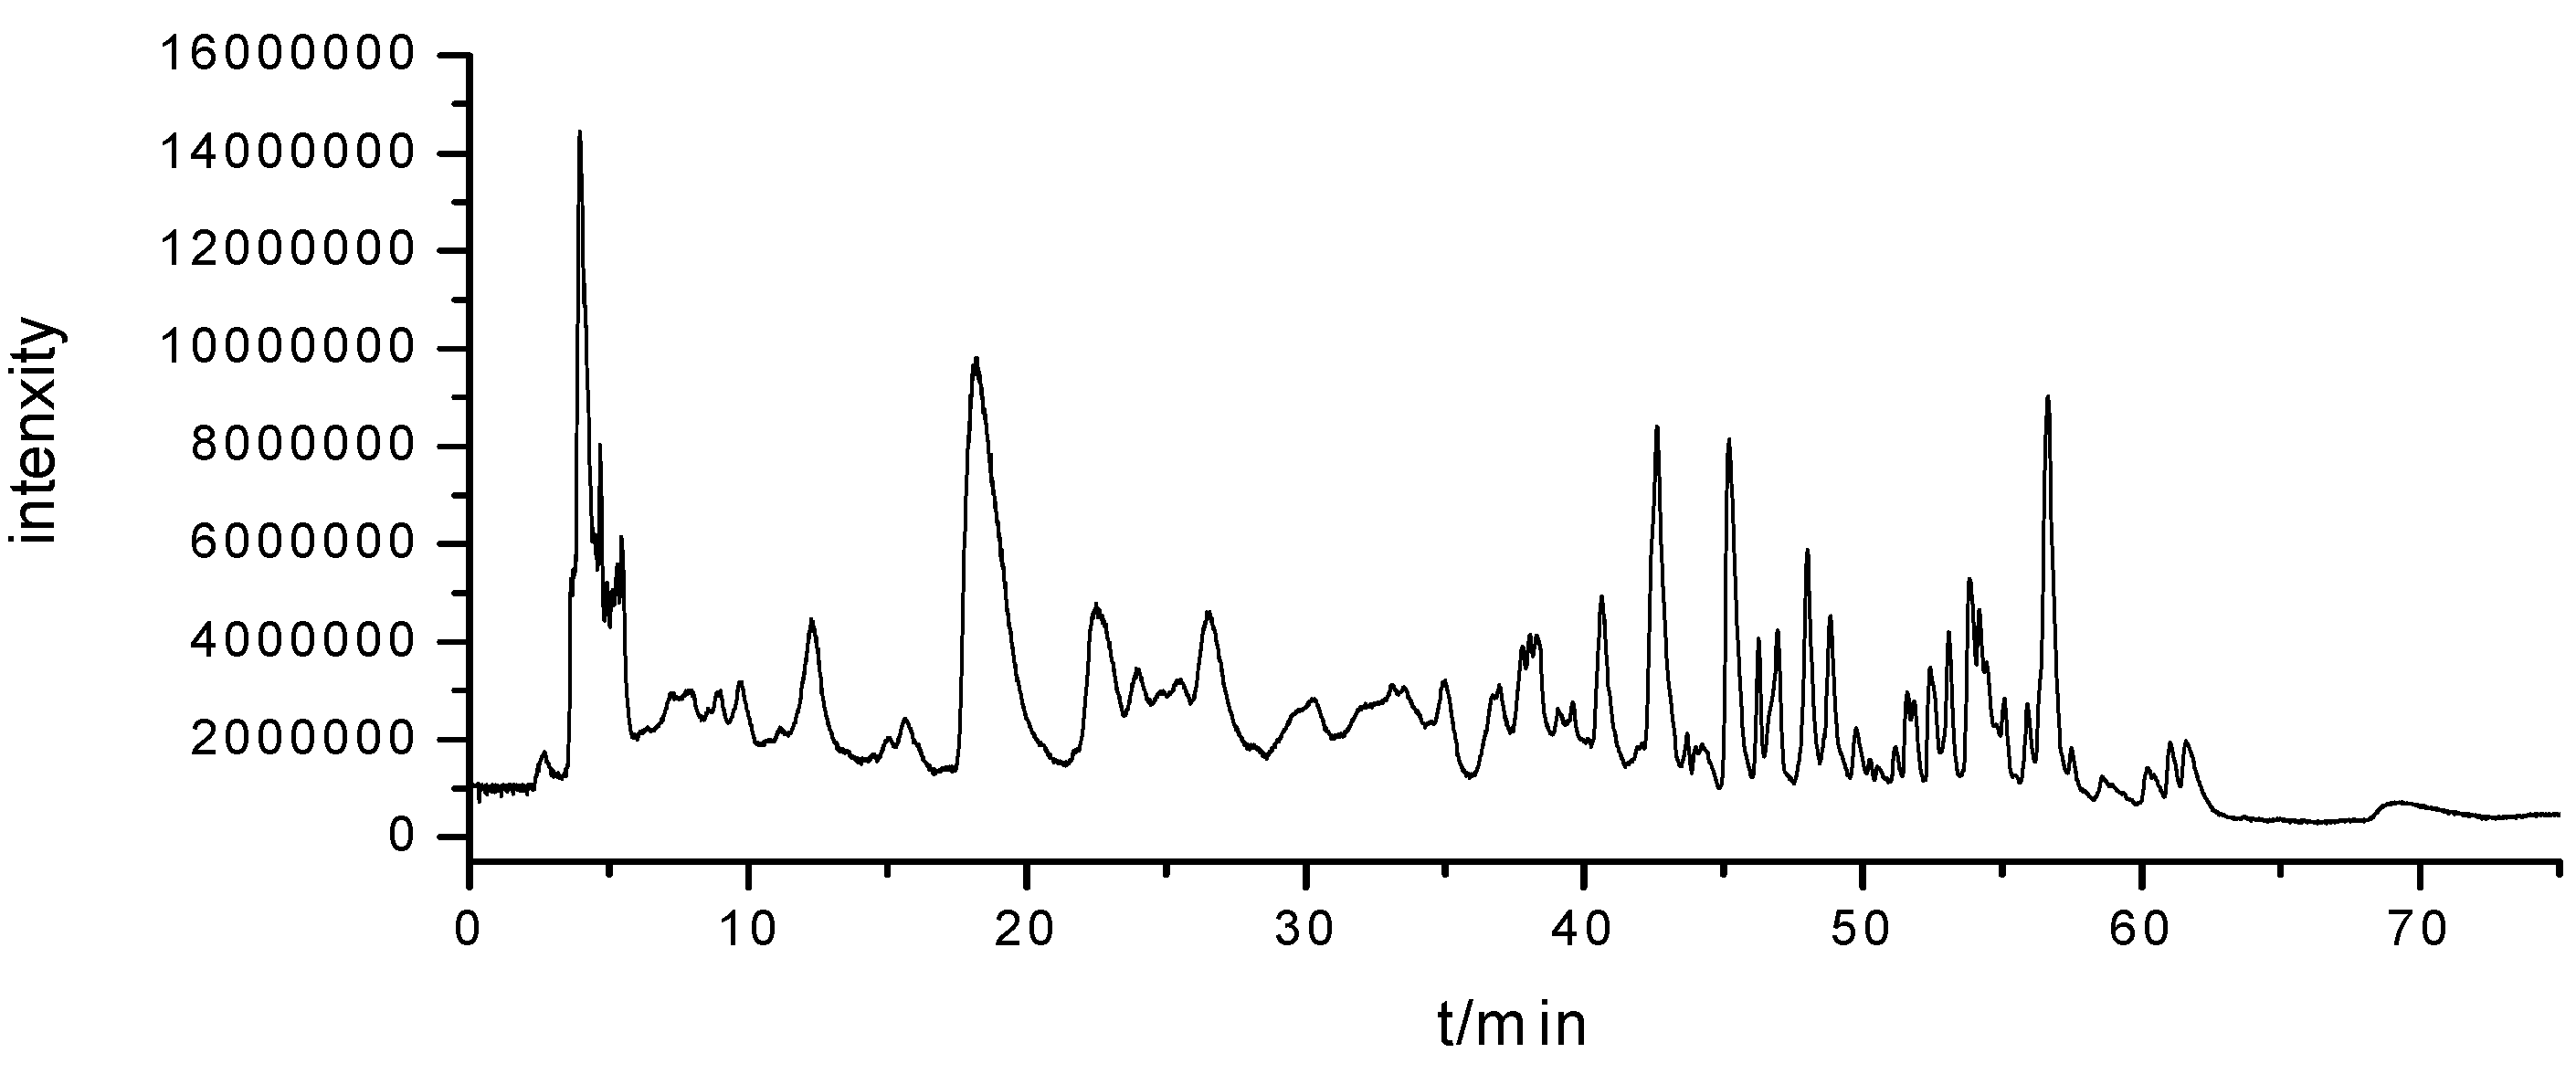
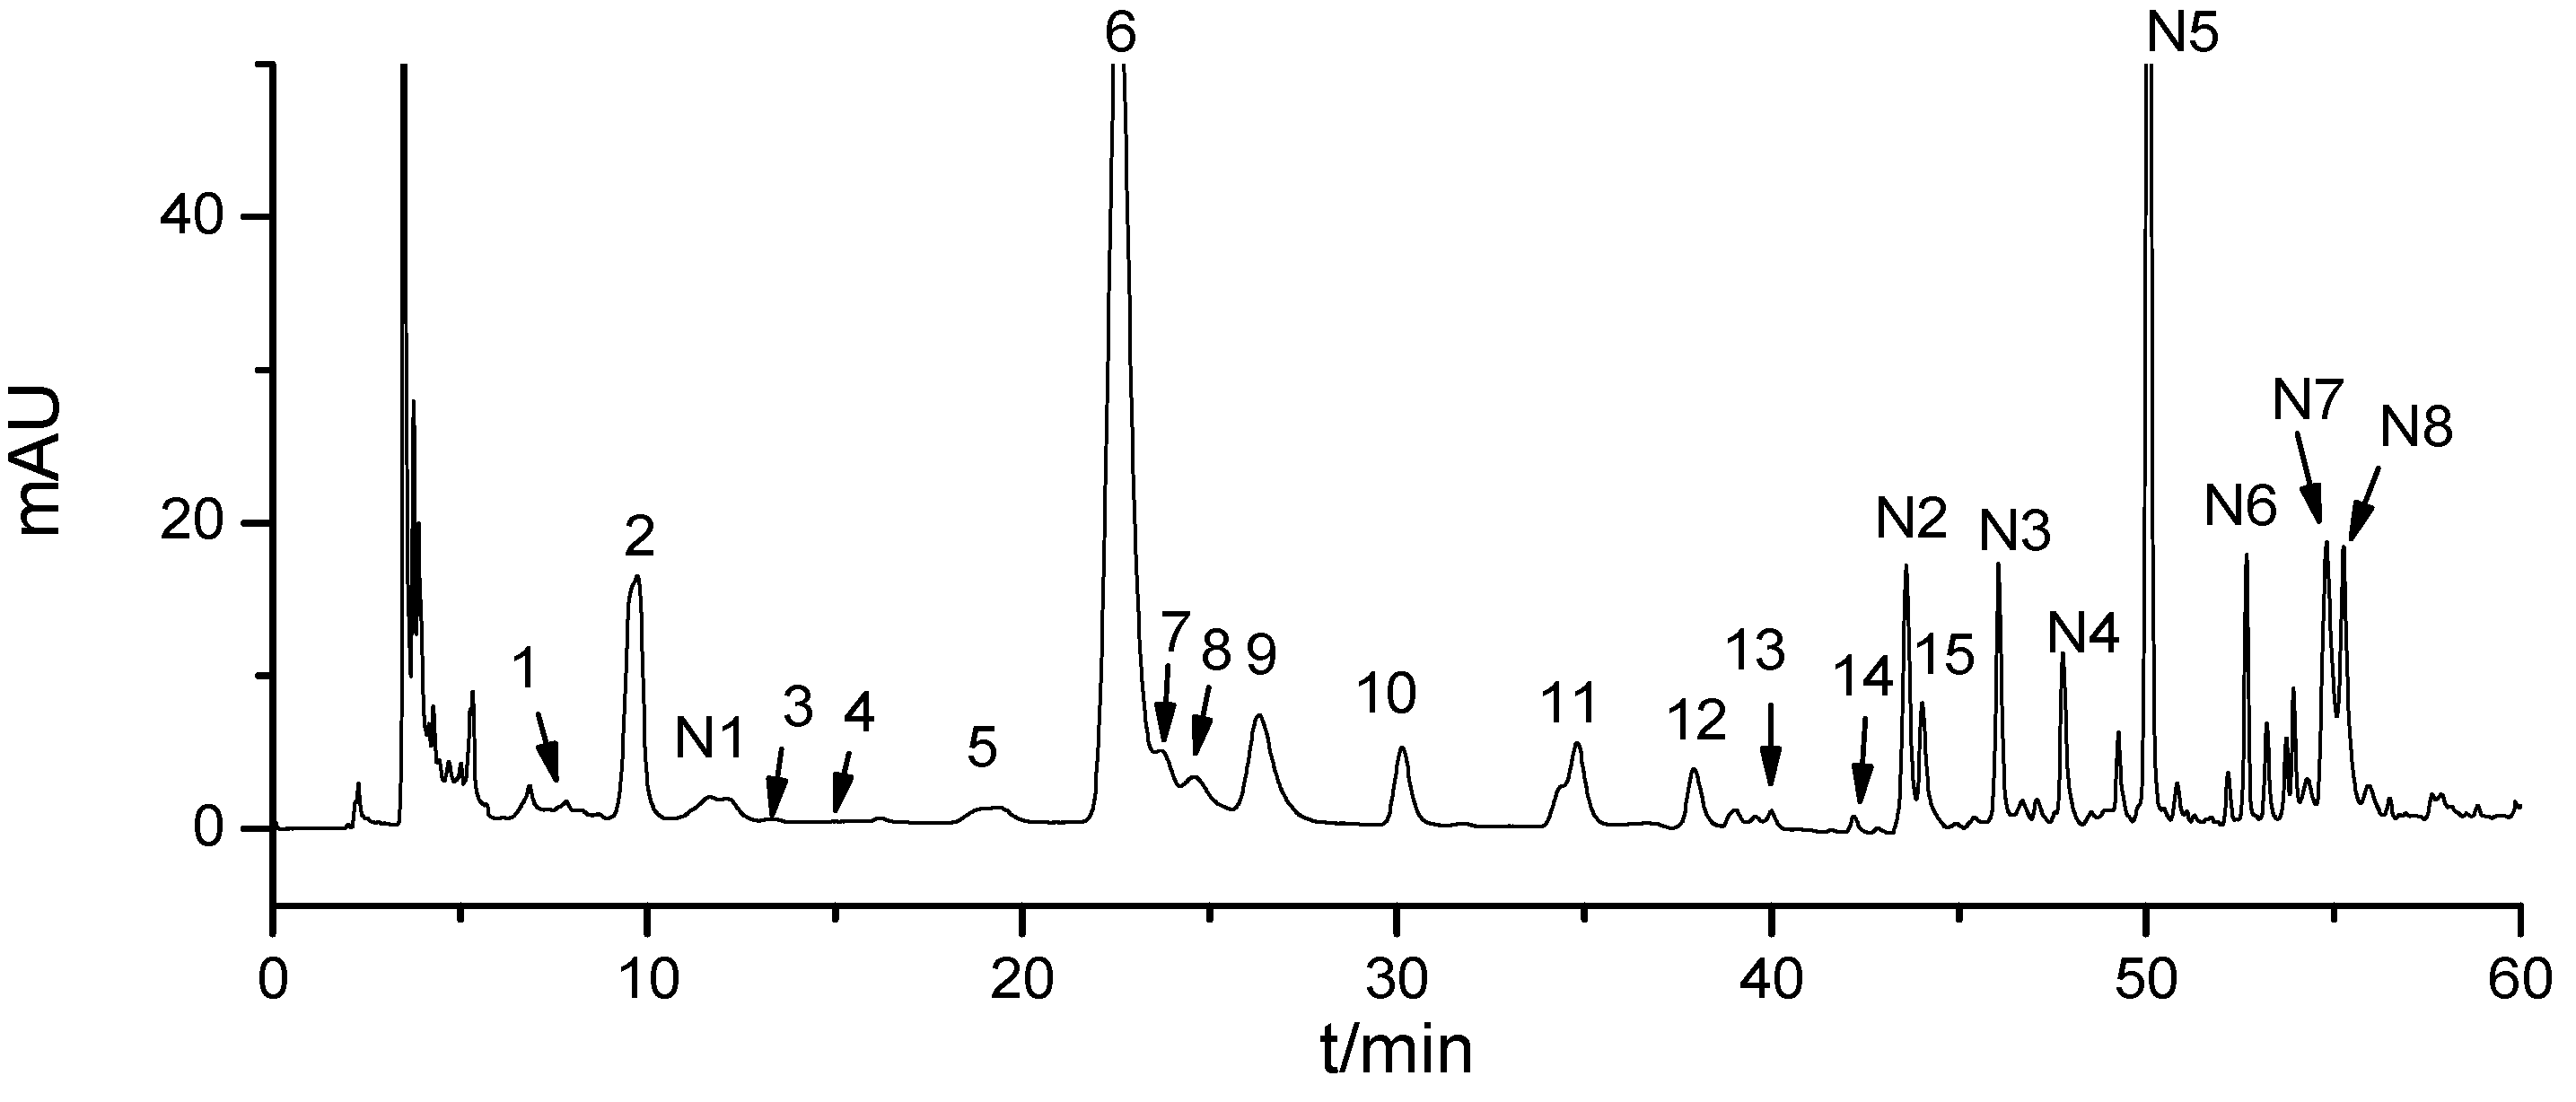
The present study is the first to use HILIC to separate the nucleosides and their bases in
Cordyceps samples. HILIC with diode-array detection and electrospray time-of-flight mass spectrometry was employed to confirm the target and the non-target compounds in the HILIC profile by comparing their UV spectrum and mass measurements with those of the reference standards or the literature. HILIC coupled with electrospray ionization tandem mass spectrometry (HILIC-ESI-MS/MS), which is more sensitive compared with routine HPLC [
28], was then used for the simultaneous determination of multiple nucleosides and nucleobases for 12 natural
Cordyceps samples from different cultivation regions.
3. Experimental
3.1. Materials and Standards
HPLC-grade acetonitrile was obtained from Merck (Darmstadt, Germany). Acetic acid and ammonium acetate were purchased from Fluka (Buchs, Switzerland). All other reagents such as methanol were of analytical grade (Tianjin Chemical Factory, Tianjin, China). Water was prepared using a Millipore Milli Q-Plus system (Millipore, Bedford, MA, USA).
Twelve batches of natural
Cordyceps samples were collected from different regions in China (
Table 6). The species of these natural
Cordyceps was identified by Prof. Luqi Huang (Institute of Chinese Material Medical, China Academy of Chinese Medical Sciences, Beijing, China).
Table 6.
Regions of the 12 batches of Cordyceps samples.
Table 6.
Regions of the 12 batches of Cordyceps samples.
| Sample | Region | Sample | Region |
|---|
| 1 | Dawu Town, Qinghai Province | 7 | Manzhang Town, Qinghai Province |
| 2 | Dawu Town, Qinghai Province | 8 | Duogongma Town, Qinghai Province |
| 3 | Xueshan Town, Qinghai Province | 9 | Baiyu Town, Qinghai Province |
| 4 | Xueshan Town, Qinghai Province | 10 | Suohumari Town, Qinghai Province |
| 5 | Xiamagong Town, Qinghai Province | 11 | Lajishankou, Qinghai province |
| 6 | Jianshe Town, Qinghai Province | 12 | Naqu, Tibet |
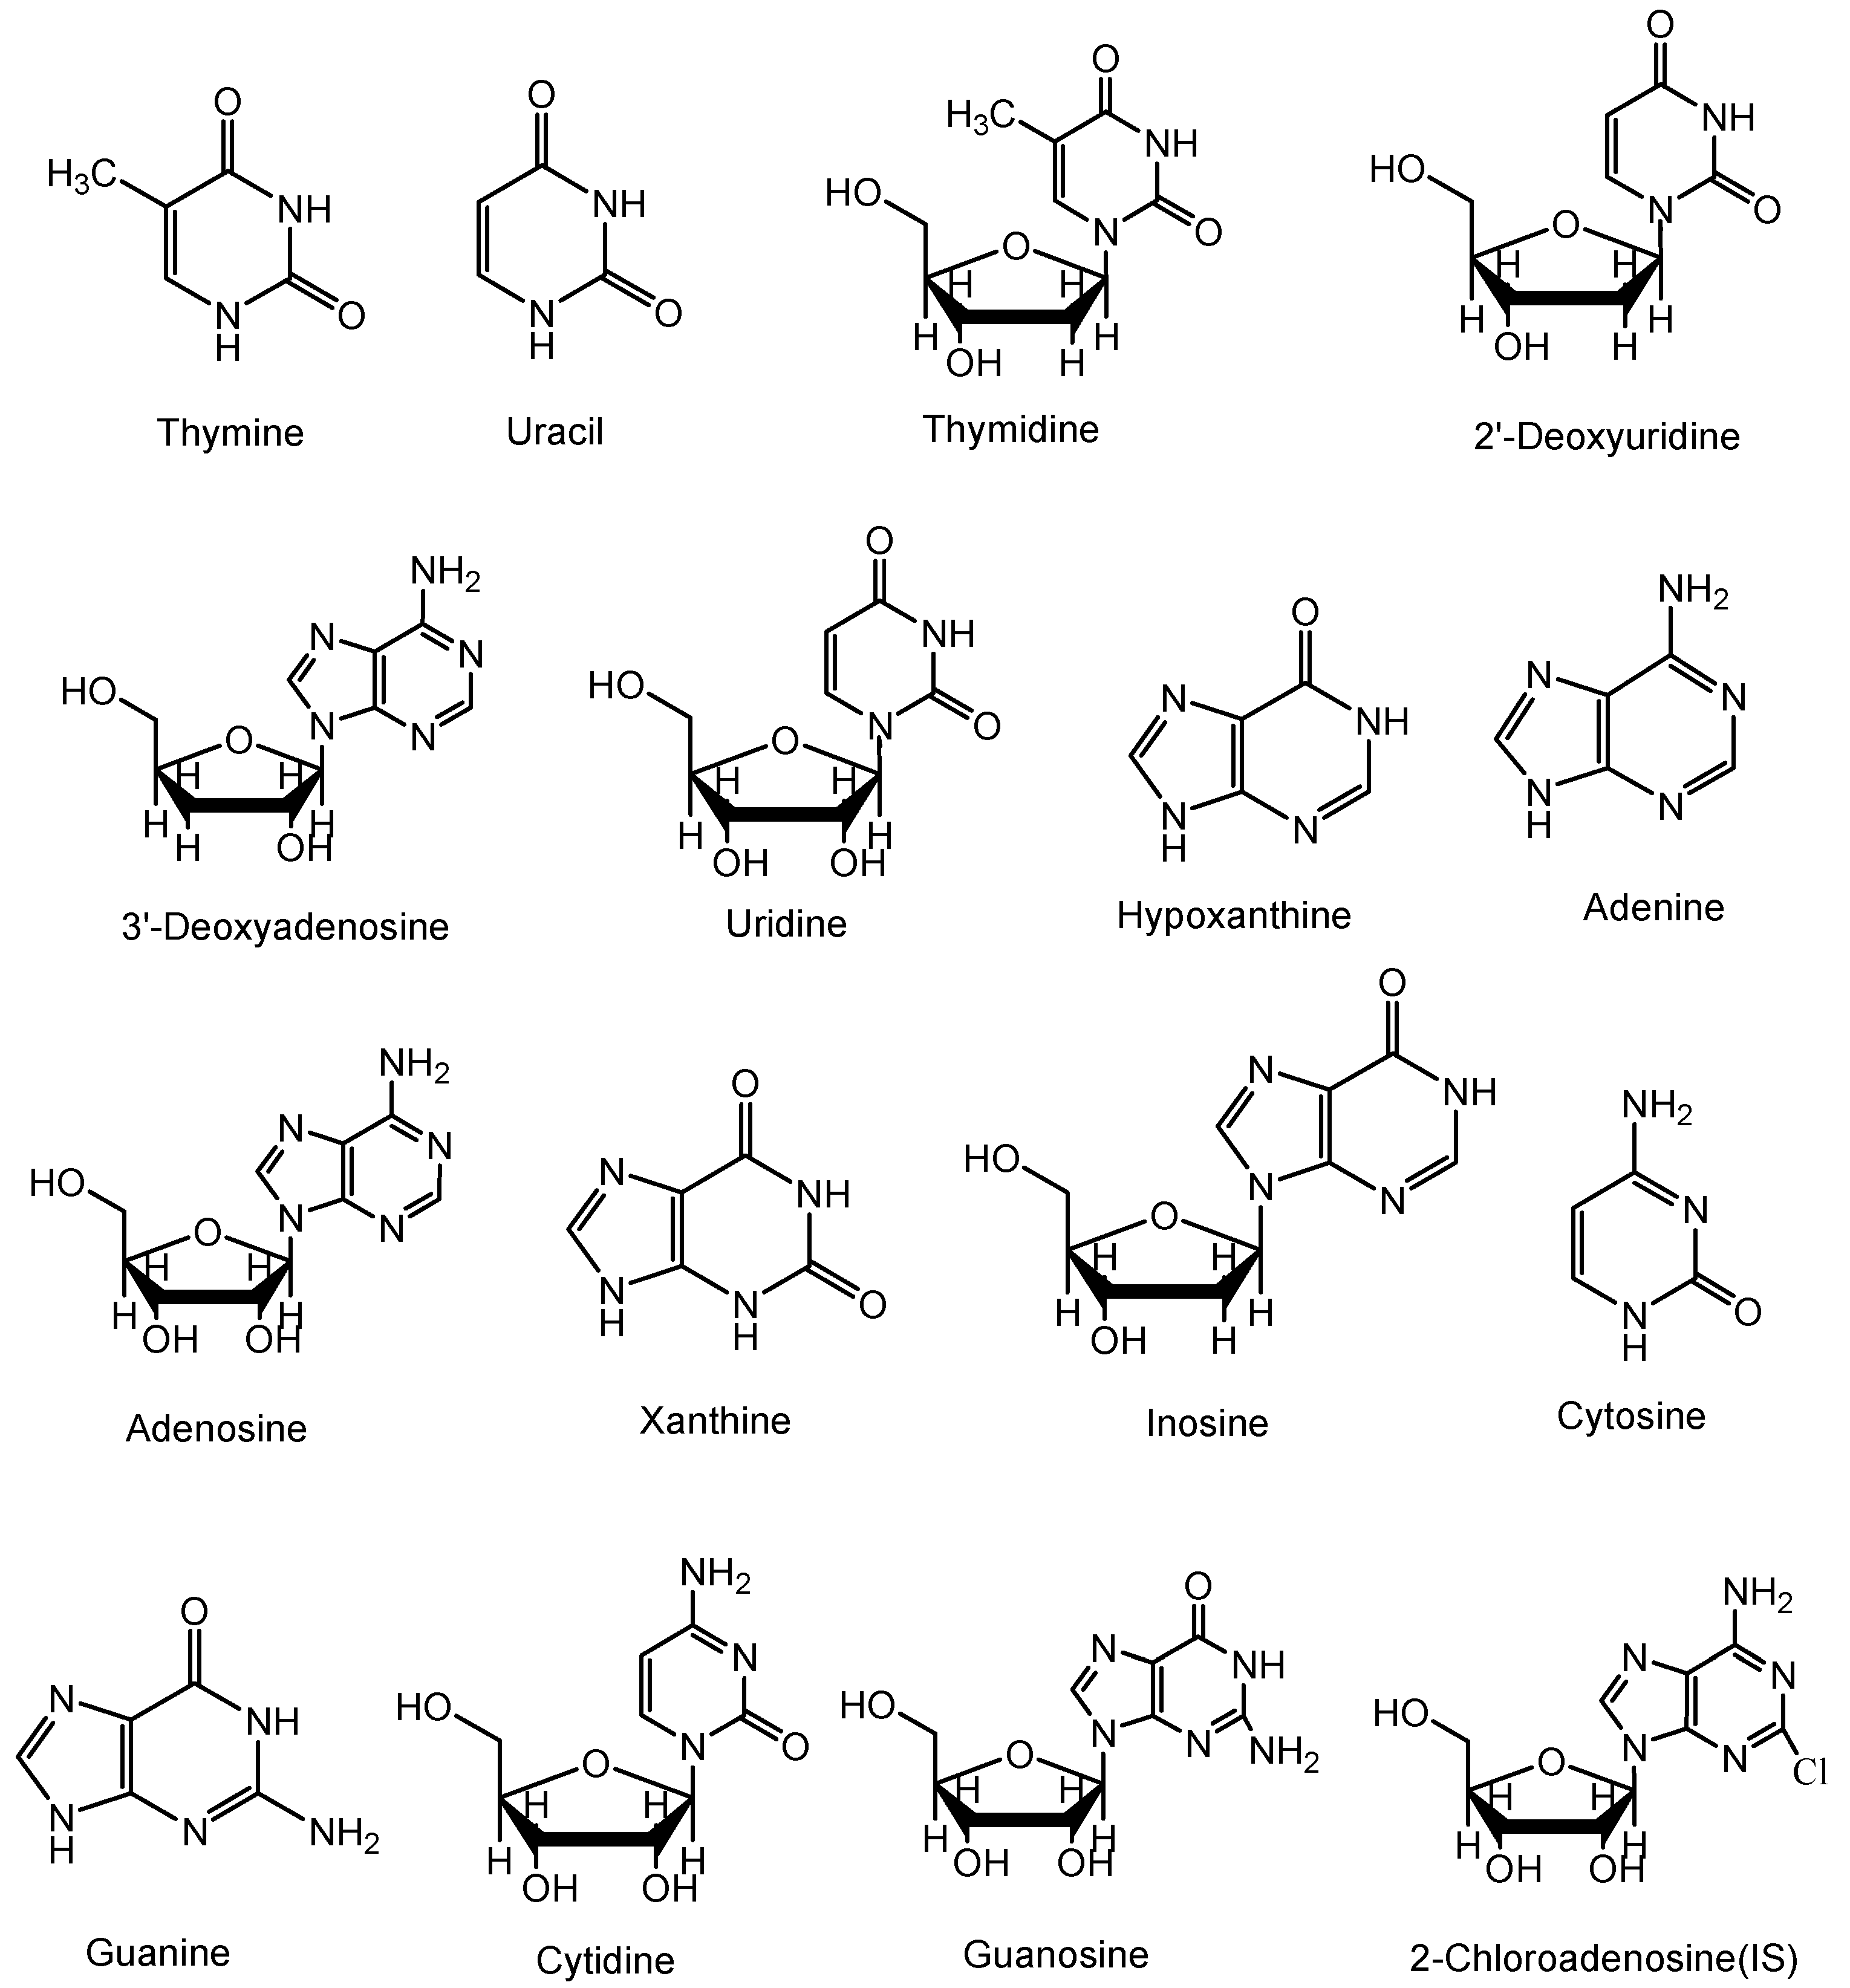
The standards of thymine, uracil, thymidine, 2'-deoxyuridine, cordycepin, uridine, hypoxanthine, adenine, adenosine, xanthine, inosine, cytosine, guanine, cytidine, guanosine and 2-chloroadenosine were purchased from Sigma-Aldrich (St. Louis, MO, USA).
Figure 4 shows the chemical structures of these reference compounds.
Figure 4.
Chemical structures of nucleosides and nucleobases identified in Cordyceps extracts.
Figure 4.
Chemical structures of nucleosides and nucleobases identified in Cordyceps extracts.
3.2. Sample Preparation
Cordyceps powder (0.3 g) was mixed with 60% (v/v) aqueous methanol (25 mL) in a glass tube with a stopper and then immersed in a conventional stainless steel ultrasonic cleaning bath. The average power used for extraction was 320 W. A single frequency of 40 kHz, as well as applied pulsed frequency, was used. Extraction was controlled at 20 °C. Samples were extracted in 15 min for three consecutive times. The extracts were combined and then filtered, and the filtrate was dried using a rotary evaporator at 55 °C. The residue was then dissolved in 5 mL of 90% (v/v) aqueous acetonitrile. The concentration of analytes was adjusted between linearity ranges according to the preliminary determination. 2-Chloroadenosine (1 µg/mL) was used as an internal standard for the quantitative determination of analytes by using a calibration curve. The solution was filtered through a 0.22 μm nylon filter membrane. A 20 μL aliquot of the filtrate was subsequently injected into the HPLC system.
3.3. HILIC-DAD
All separation processes were performed on an Agilent 1200 HPLC system (Agilent Technologies, Santa Clara, CA, USA) equipped with a quaternary solvent delivery system, a vacuum degasser, an autosampler, a column oven, and a diode-array detector connected to an Agilent ChemStation software program. A Waters Xbridge Amide column (250 × 4.6 mm I.D., 3.5 μm) was used. The mobile phase consists of A (0.2% acetic acid and 10 mM ammonium acetic) and B (acetonitrile), which are used in gradient elution: 0 min to 15 min, 95% to 95% B; 15 min to 30 min, 95% to 90% B; 30 min to 40 min, 90% to 80% B; 40 min to 45 min, 80% to 75% B. The flow rate of the mobile phase was 0.8 mL/min, and the injection volume was 20 μL. Elution was monitored at 260 nm by using a diode-array detector, and the column was maintained at 20 °C.
3.4. HILIC-ESI-TOF/MS Analysis
A G6520 Q-TOF mass spectrometer (Agilent Technologies) with an electrospray ion source was coupled with the Agilent 1200 HPLC system (Agilent Technologies) equipped with a Waters Xbridge Amide column (250 × 4.6 mm I.D., 3.5 μm) for the qualitative analysis of nucleosides and nucleobases in
Cordyceps. Data were processed using MassHunter software (A02.02) provided with the Agilent TOF/MS. The mobile phase and the gradient elution program described in
Section 3.3 were employed. The outlet of the flow cell was connected to a split valve to divert a flow of 0.4 mL/min to the ESI source. The mass spectrometer conditions were optimized for nucleosides and nucleobases detection, as follows: drying gas temperature, 350 °C; drying gas flow, 10.0 L/min; nebulizing gas pressure, 45 psi; fragmentor, 120 V; and capillary voltage, 4,500 V. The mass spectrometer was scanned from
m/
z 50 to
m/z 1000 in a full scan mode. Reference solution was used, and the ion with
m/
z 121.050873 was selected for mass calibration to eliminate system bias.
3.5. HILIC-ESI-MS/MS Analysis
Quantitative analyses of nucleosides and nucleobases were performed on an Agilent 1200 HPLC system (Agilent Technologies) equipped with a Waters Xbridge Amide column (250 × 4.6 mm I.D., 3.5 μm) and coupled to an Agilent G6420A mass spectrometer (Agilent Technologies) triple quadrupole instrument. The mobile phase and the gradient elution program described in
Section 2.3 were employed. The outlet of the flow cell was connected to a split valve to divert a flow of 0.4 mL·min
−1 to the ESI source via a short fused silica tubing. Peaks were detected by a positive-ion mode MS and MS/MS. Mass spectrometry was conducted in the scan mode from m/z 50 to m/z 600. Selective ion monitoring (SIM) or multiple reaction monitoring (MRM) mode was used for quantitative analysis. The ESI-MS conditions were as follows: drying gas temperature, 350 °C; drying gas flow, 11.0 L/min; nebulizing gas pressure, 45 psi; fragmentation voltage, 120 V; and capillary voltage, 4500 V.
3.6. Calibration Solutions
Standard stock solutions of all analytes, except for xanthine and guanine, were prepared by dissolving each compound in an aqueous methanol solution (20%, v/v) at 0.1 mg/mL and then stored at 4 °C. Xanthine and guanine (0.05 mg/mL) were prepared in aqueous acetic acid (2%, v/v) and then stored at 4 °C. The aforementioned standard solutions were prepared and diluted to appropriate concentrations with 90% (v/v) aqueous acetonitrile for the construction of calibration curves. Each calibration curve was generated by running samples at six different concentrations in triplicate. Relative peak areas were plotted against the concentrations of each analyte. The correlation coefficient was determined using a linear regression model.


