2.1. Determination of Total Flavonoid Content
The total flavonoid content of the plant extracts was determined using an optimized UV-derivative spectrophotometric method. According to our previous studies, luteolin and quercetin are the most abundant flavonoid aglycones present in
C. platycarpos [
4,
5]. Unfortunately, conventional UV spectrophotometric methods for determination of total flavonoid content are unsuitable for investigation of
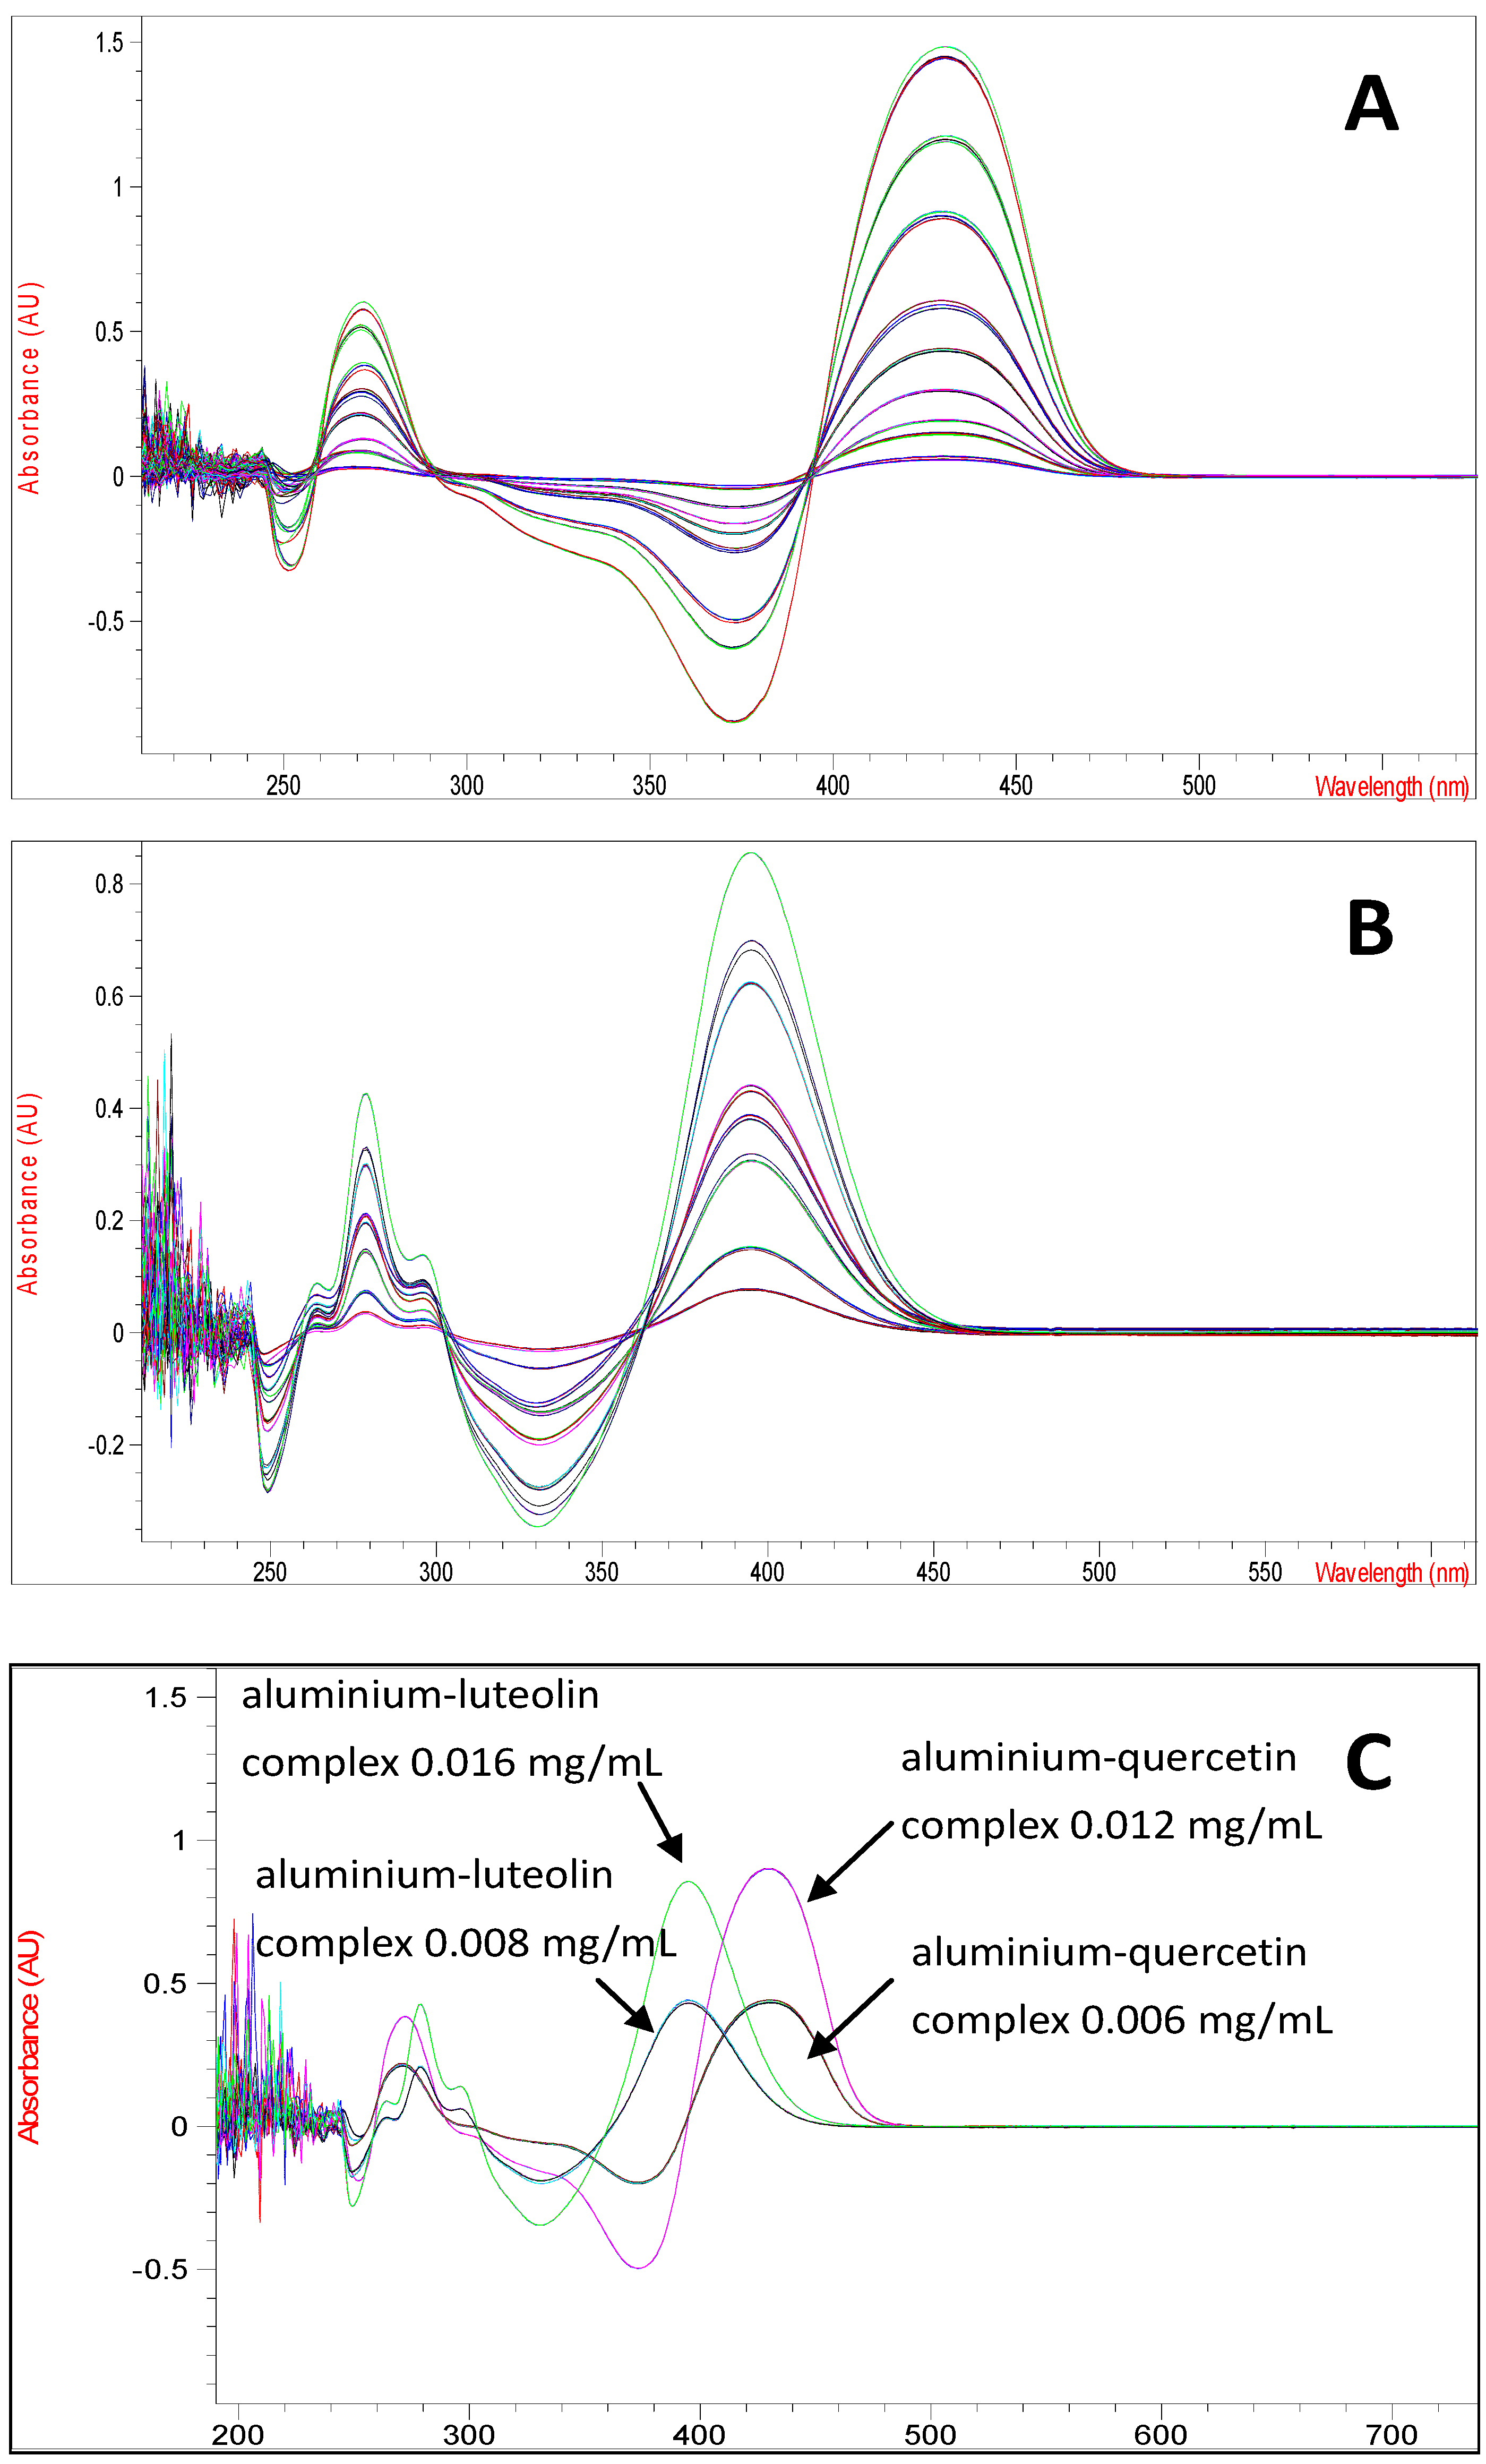
C. platycarpos extracts as the aluminium-luteolin and aluminium-quercetin complexes show partial spectra overlapping. The UV spectrum of aluminium-luteolin complex has a maximum absorption at 395 nm, while aluminium-quercetin complex has its maximum absorption at 430 nm (
Figure 1).
Figure 1.
(A) The UV spectrum of aluminium-quercetin complex at various concentrations (0.0004–0.02 mg/mL), (B) the UV spectrum of aluminium-luteolin complex at various concentrations (0.0016–0.016 mg/mL) and (C) the UV spectrum of aluminium-quercetin complex at concentrations of 0.006 and 0.012 mg/mL and aluminium-luteolin complex at concentrations of 0.008 and 0.016 mg/mL.
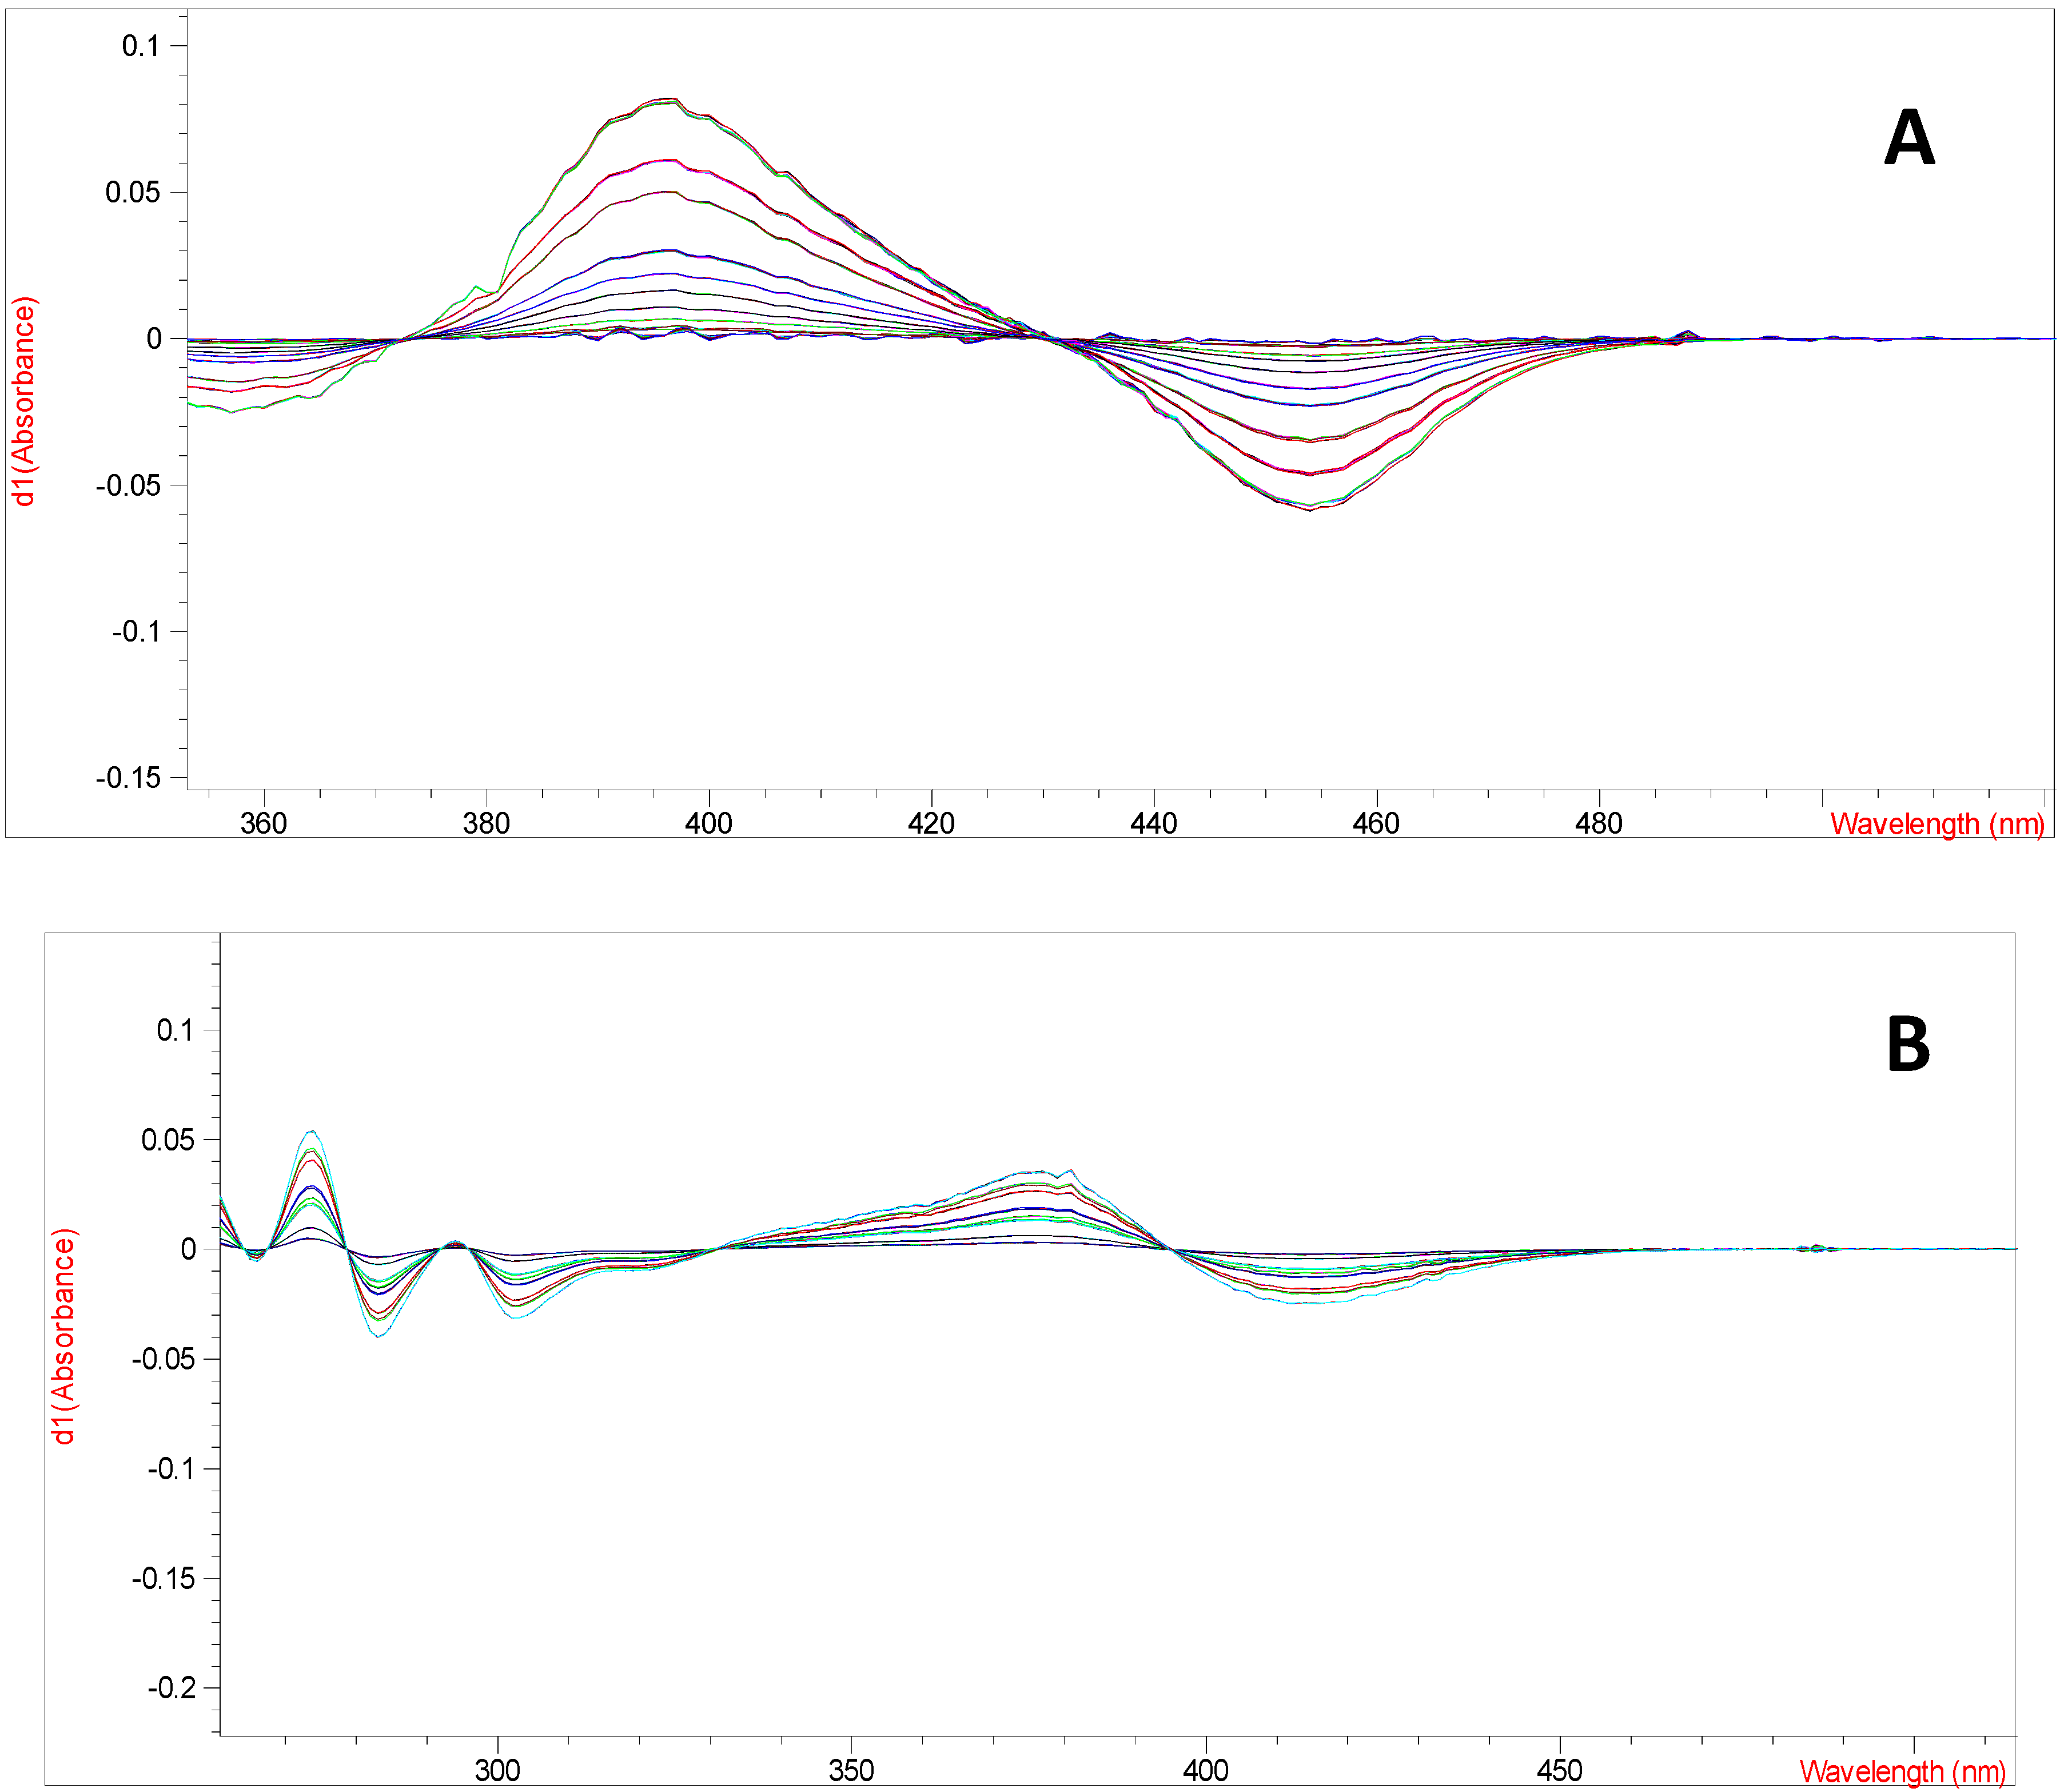
Derivative spectrophotometry is an analytical technique which consists in the differentiating of normal spectrum by mathematical transformation of spectral curve into a derivative (first-or higher derivatives). It is usually used to eliminate the influence of background or matrix and provides more defined fingerprints than traditional ordinary or direct absorbance spectra, since it enhances the detectability of minor spectral features [
6,
7]. Therefore, an optimized UV-derivative spectrophotometric method using first-derivative spectra of luteolin and quercetin obtained after complexation with aluminium ions was used. The first-derivative spectra of aluminium-luteolin and aluminium-quercetin complexes have the maximum absorption at 372.5 and 395.0 nm, respectively (
Figure 2).
Figure 2.
(A) The first-derivative spectra of aluminium-quercetin at various concentrations (0.0004–0.02 mg/mL), (B) and aluminium-luteolin complexes at various concentrations (0.0008–0.02 mg/mL).
Figure 2.
(A) The first-derivative spectra of aluminium-quercetin at various concentrations (0.0004–0.02 mg/mL), (B) and aluminium-luteolin complexes at various concentrations (0.0008–0.02 mg/mL).
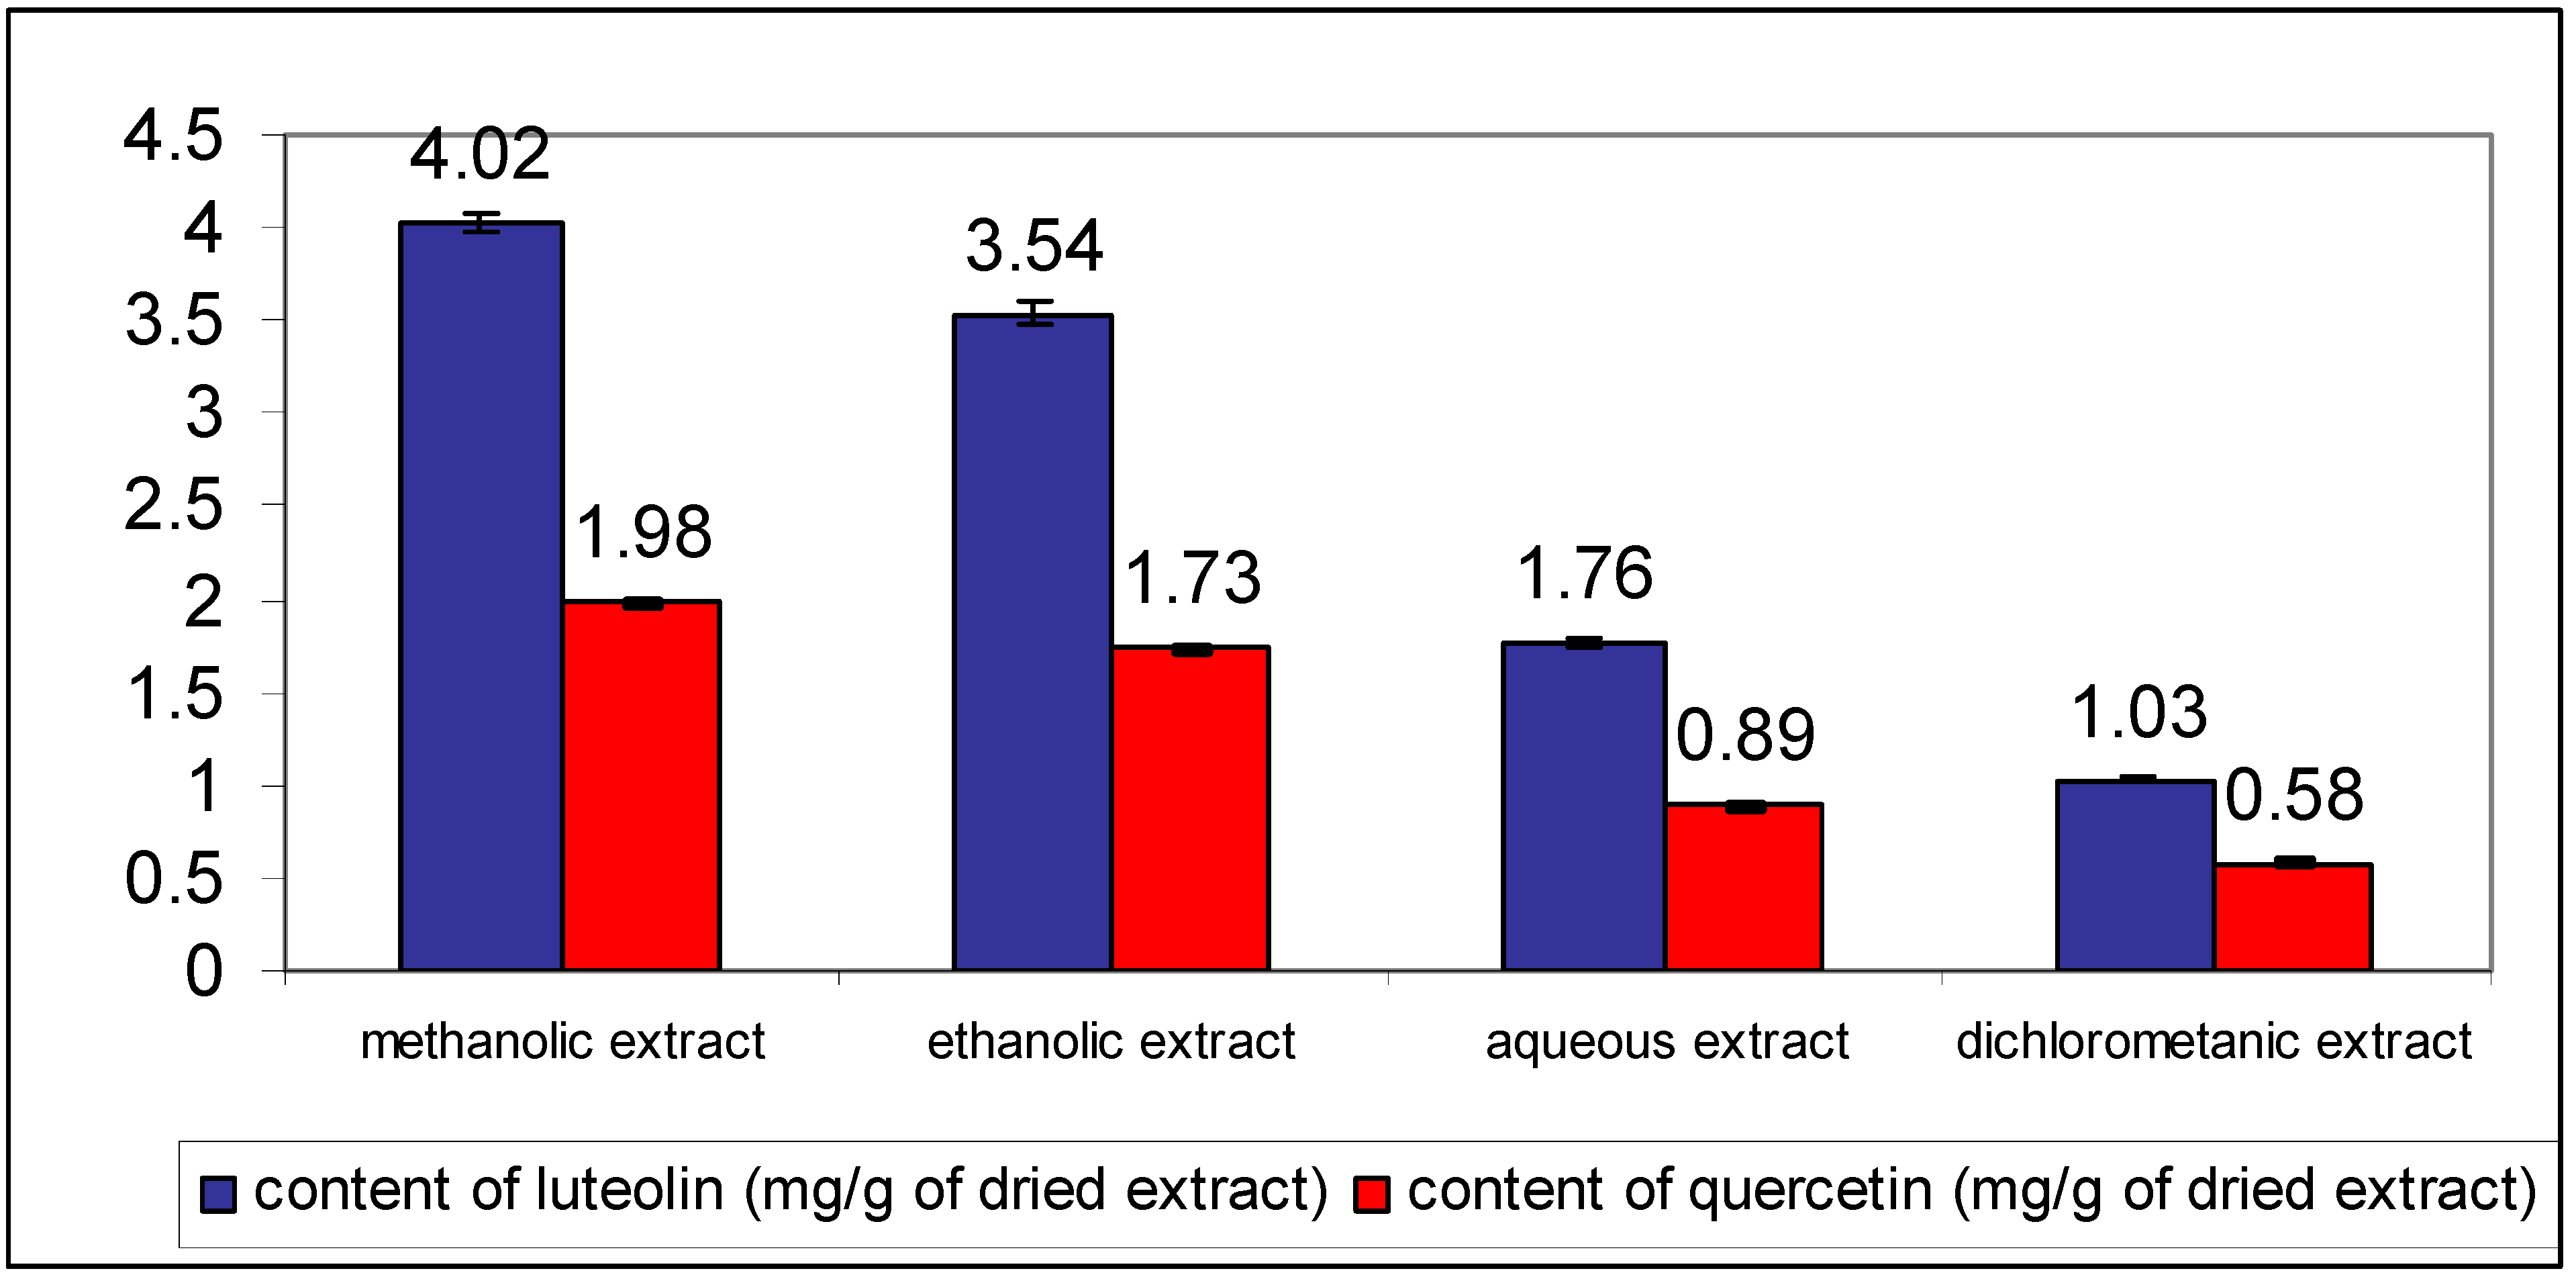
To optimize the extraction process organic solvents of different polarities and water were used. The volume of the extraction solvent was increased until the complete extraction of analytes was obtained. The best extraction efficacy was obtained using methanol as extraction solvent (
Figure 3). The total flavonoid content was expressed as luteolin and quercetin equivalents.
Figure 3.
Contents of luteolin and quercetin in different C. platycarpos extracts. Each value is the mean ± standard deviation of six independent measurements.
Figure 3.
Contents of luteolin and quercetin in different C. platycarpos extracts. Each value is the mean ± standard deviation of six independent measurements.
The performance characteristics of the method were evaluated with respect to linearity, precision and accuracy. The linearity of the method for determination of luteolin and quercetin was tested in the range from 0.8 to 20 μg/mL. At least, seven concentration levels were used in both calibration curves. The calibration curves were obtained at 372.5 nm and 395.0 nm for luteolin and quercetin, respectively. The obtained correlation coefficients were higher than 0.997 indicating satisfactory linearity of developed method. The detection (LOD) and the quantification (LOQ) limits were established from the calibration curve as LOD = 3 s/b and LOQ = 10 s/b, where s is the residual standard deviation of the calibration curve and b is the slope of the calibration curve. The LOD of luteolin was found to be 0.35 μg/mL, while the LOQ was 1.05 μg/mL. The LOD and LOQ values of quercetin were a slightly lower, 0.26 and 0.77 μg/mL, respectively. The precision of the method was investigated using three different concentrations of luteolin (1.4, 6.4 and 12.0 μg/mL) and quercetin (2.0, 6.2 and 12.4 μg/mL). Each concentration level was analyzed individually five times. The inter-day precision was assessed by three replicate analyses on three consecutive days. The results of precision measurements, expressed as relative standard deviations (RSDs), are summarized in
Table 1. The RSD values for intra- and inter-day precision were lower than 1.95 and 2.87%, respectively. Furthermore, the accuracy of the method was investigated using three different known concentrations of luteolin (1.6, 3.2 and 8.0 μg/mL) and quercetin (2.0, 4.0 and 8.0 μg/mL). The results of accuracy measurements, expressed as recoveries, are listed in
Table 1. The recoveries of both analytes were in range from 92.37 to 98.33%. These results indicate the satisfactory accuracy of the method.
Table 1.
Validation data of total flavonoids determination.
Table 1.
Validation data of total flavonoids determination.
| Validation parameter | Luteolin | Quercetin |
|---|
| Linearity range (μg/mL) | 0.8–20 | 0.8–20 |
| Equation | y = 0.090 − 0.001 | y = 0.161 − 0.001 |
| Calibration coefficient (r2) | 0.997 | 0.999 |
| Limit of detection (μg/mL) | 0.35 | 0.26 |
| Limit of quantitation (μg/mL) | 1.05 | 0.77 |
| Precision (RSD, %) | | |
| Intra-day | | |
| Low | 1.79 | 1.37 |
| Medium | 0.88 | 1.35 |
| High | 1.95 | 1.34 |
| Inter-day | | |
| Low | 2.60 | 1.75 |
| Medium | 2.87 | 2.36 |
| High | 1.86 | 2.08 |
| Accuracy (Recovery, %) | | |
| Low | 92.37 | 94.83 |
| Medium | 94.07 | 94.01 |
| High | 98.33 | 97.08 |
2.2. Determination of Total Phenolic Acids Content
The total phenolic acid content was determined using a UV spectrophotometric technique. According to our previous studies, the most abundant phenolic acid after hydrolysis of phenolic acid esters in
C. platycarpos extracts was chlorogenic acid [
4,
5]. Therefore, the method optimization and validation was performed using chlorogenic acid as well as the total phenolic acid content was expressed as chlorogenic acid equivalents.
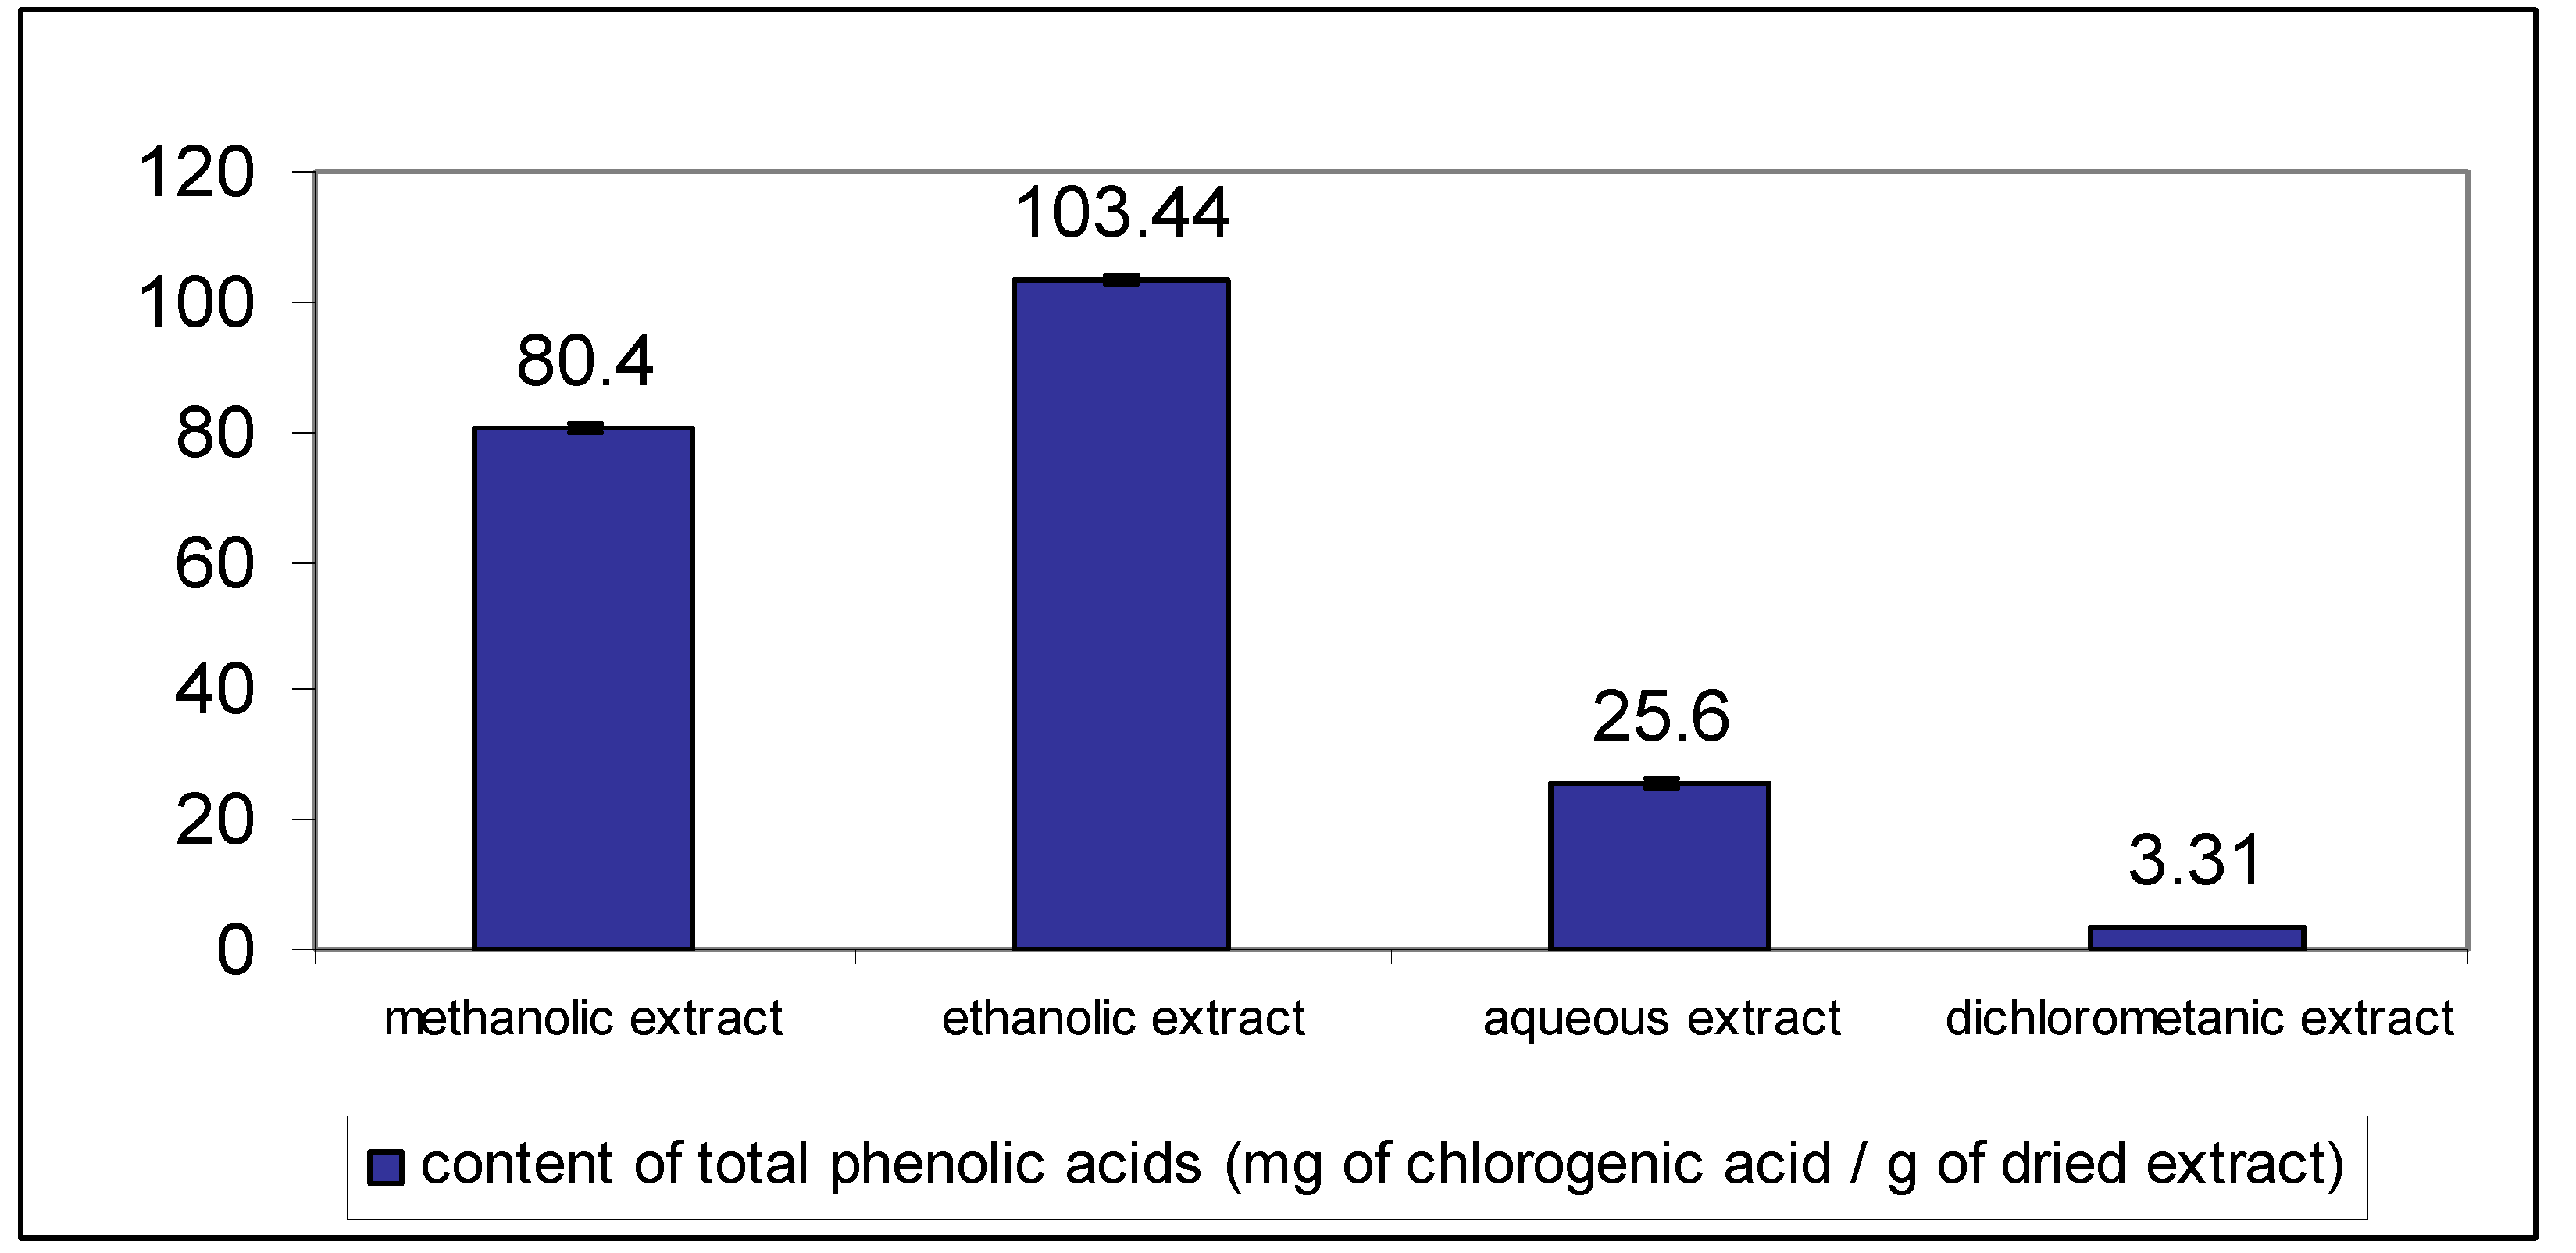
To optimize the extraction process organic solvents of different polarities and water were used. The extracts contained from 3.31 to 103.44 mg/g phenolic acids expressed as chlorogenic acid equivalents. The best extraction efficacy was obtained using ethanol (
v/v) (
Figure 4).
The validation of the method was performed and following parameters were tested: linearity, precision and accuracy. The linearity of the method for determination of chlorogenic acid was tested in the range from 0.01 to 0.50 mg/mL. The calibration curve was linear over concentration range studied (
r2 = 0.999) and the slope of the equation was 1.5818 while the intercept was 0.0125. The LOD and LOQ values, established from the calibration curve, were 0.003 and 0.010 mg/mL. The precision of the method was investigated using three different concentrations of luteolin (0.05, 0.10 and 0.40 mg/mL). The procedure was repeated five times within the same day to obtain the intra-day precision while the inter-day precision was assessed by replicate analysis on three continual days. The results of precision measurements, expressed as RSDs, are reported in
Table 2.
The RSD values of intra- and inter-day precision were less than 1.69%, indicating excellent precision of the method. Furthermore, the accuracy of the method was investigated using three different known concentrations of chlorogenic acid (0.05, 0.10 and 0.30 mg/mL). The accuracy of measurements was expressed in terms of recovery (
Table 2).
Figure 4.
Contents of total phenolic acids expressed as milligrams of chlorogenic acid per gram of dried extract in different C. platycarpos extracts. Each value is the mean ± standard deviation of six independent measurements.
Figure 4.
Contents of total phenolic acids expressed as milligrams of chlorogenic acid per gram of dried extract in different C. platycarpos extracts. Each value is the mean ± standard deviation of six independent measurements.
Table 2.
Validation data of total phenolic acids determination.
Table 2.
Validation data of total phenolic acids determination.
| Validation parameter | Chlorogenic acid |
|---|
| Linearity range (mg/mL) | 0.010–0.500 |
| Equation | y = 1.582x + 0.013 |
| Calibration coefficient (r2) | 0.999 |
| Limit of detection (mg/mL) | 0.003 |
| Limit of quantitation (mg/mL) | 0.010 |
| Precision (RSD, %) | |
| Intra-day | |
| Low | 1.61 |
| Medium | 1.57 |
| High | 0.94 |
| Inter-day | |
| Low | 1.69 |
| Medium | 1.67 |
| High | 1.47 |
| Accuracy (Recovery, %) | |
| Low | 99.00 |
| Medium | 100.97 |
| High | 98.27 |
2.3. Determination of Antioxidative Activity
In the last few decades the antioxidant activity of plant samples has been the subject of numerous
in vitro and
in vivo studies. Antioxidative activity has become the one of the most interesting biological properties of naturally occurring substances present in higher plants. Beneficial health effects of an array of herbal preparations have been ascribed to the antioxidant activity of plants, and in such way as to prevent in the development of various diseases, including tumors [
8,
9,
10,
11,
12].
To the best of our knowledge, there are no literature data concerning the antioxidant properties of C. platycarpos extracts. Therefore, the antioxidant properties of plant were evaluated in order to find a new natural source of antioxidants. Since the antioxidant compounds found in plants have different polarities, different solvents were used to isolate antioxidants. Methanol, ethanol, dichloromethane and water are the most commonly used solvents in extraction processes. The antioxidant activity of the extract and yield depends strongly on the used solvent. In order to get a better insight in the antioxidant activity of C. platycarpos extracts different assays were tested.
Firstly, the free-radical-scavenging activity of different plant extracts was tested using the DPPH method. The DPPH radical is a commonly used substrate for fast evaluation of antioxidant activity because of its stability in the radical form and simplicity of the assay. The principle behind this assay is the color change of DPPH solution from purple to yellow as the radical quenched by an antioxidant. The results, expressed as IC
50 values, are presented in
Table 3. and it should be pointed out that a lower IC
50 value indicates a greater antioxidant activity. The IC
50 values obtained by the DPPH method for different plant extracts ranged from 42.6 to 2,690 μg/mL. The obtained results indicate that most of free radical-scavenging molecules were extracted using methanol as extraction solvent.
The inhibitory effect on lipid peroxidation of plant extracts were evaluated using bovine brain phospholipid liposomes as model membranes. Protection against free radical-induced lipid peroxidation by the
C. platycarpos extracts may be of great importance for plant traditional use against inflammatory diseases, many of which are associated with membrane damage and tissue injury. Lipid peroxidation was stimulated with ascorbic acid, well known antioxidant. Still, ascorbic acid at concentrations up to 10
−3 M shows prooxidant properties. Fe
3+ and, to a lesser extent Co
2+, act synergistically with ascorbic acid. Moreover, the prooxidant effect increases with metal concentration. The results, expressed as IC
50 values, are summarized in
Table 3. The IC
50 values obtained for different
C. platycarpos extracts ranged from 0.47 to 2.50 mg/mL. The obtained results indicate that the highest amounts of compounds, inhibitors of membrane lipid peroxidation, are present in methanolic and ethanolic extracts.
The antioxidant activity of prepared plant extracts was also evaluated using the deoxyribose assay. Hydroxyl radicals, generated by reaction of an iron-EDTA complex with H
2O
2 in the presence of ascorbic acid, attack deoxyribose to form products that, upon heating with thiobarbituric acid, yield a pink chromogen. Added hydroxyl radical “scavengers” compete with deoxyribose for the hydroxyl radicals produced and diminish chromogen formation. The results, expressed as IC
50 values, are reported in
Table 3. The highest antioxidative activity was obtained for ethanolic extract. Slightly higher IC
50 values were obtained for methanolic and aqueous extracts.
As it was found that some polyphenolic compounds show an inhibitory effect on xantine oxidase, inhibition of xantine oxidase activity by different C. platycarpos extracts was investigated. Xanthine oxidase is a form of xanthine oxidoreductase, an enzyme that catalyzes the oxidation of hypoxanthine to xanthine and can further catalyze the oxidation of xanthine to uric acid. During the oxidation process hydrogen peroxide and superoxide anion are produced. These active oxygen species have been proposed to cause oxidative injury to tissues, cell death as well as DNA damage which causes mutation and chromosomal damage. Xanthine oxidase activity was determined by quantifying the amount of uric acid produced from xanthine in the raection mixture by spectrophotometry. Unfortunately, C. platycarpos extract did not show significant effect on xantine oxidase activity.
Superoxide dismutase (SOD) is one of the most important antioxidative enzymes which catalyzes the dismutation of the superoxide anion into hydrogen peroxide and molecular oxygen. Several direct and indirect methods have been developed to determine SOD activity. An indirect method using nitrotetrazolium blue is often used because of its convenience. Still, there are several disadvantages to this method, such as poor water solubility of the formazan dye and its reaction with the reduced form of xanthine oxidase. Therefore, a SOD Assay Kit-WST was employed. This method allowed a very convenient and highly sensitive determination of SOD activity by utilizing highly water-soluble tetrazolium salt, WST-1, which produces a water-soluble formazan dye upon reduction with a superoxide anion. The rate of WST-1 reduction by superoxide anion is linearly related to the xanthine oxidase activity and is inhibited by SOD. The scavenging effect of the
C. platycarpos extracts on superoxide anion radical, expressed as IC
50 values are presented in
Table 3. While the significant scavenging effect was obtained by methanolic, ethanolic and aqueous extracts, extract prepared with dichloromethane showed little or no scavenging effect on the free radicals.
Table 3.
Comparative overview of antioxidant activity of C. platycarpos extracts obtained by various assays.
Table 3.
Comparative overview of antioxidant activity of C. platycarpos extracts obtained by various assays.
| Sample | Methanolic extract | Ethanolic extract | Aqueous extract | Dichloromethanic extract | Positive control |
|---|
| DPPH scavenging activity (μg/mL) | 42.6 ± 8.9 | 61.9 ± 3.5 | 95.9 ± 12.7 | 2690 ± 130 | 2.4 ± 0.3 |
| Inhibition of membrane lipid peroxidation (μg/mL) | 470 ± 30 | 530 ± 30 | 2240 ± 290 | 2500 ± 250 | 4.6 ± 0.2 |
| OH˙ scavenging activity (μg/mL) | 10.2 ± 0.8 | 5.2 ± 1.3 | 12.1 ± 1.1 | 23.3 ± 3.0 | 0.4 ± 0.1 |
| Inhibition of xantine oxidase | nd | nd | nd | nd | nd |
| Superoxideanion radical scavenging activity (μg/mL) | 320 ± 20 | 280 ± 20 | 500 ± 30 | nd | nt |
| Reducing power (μmol/g) | 108.3 ± 9.0 | 146.6 ± 7.6 | 82.4 ± 6.0 | 31.7 ± 1.0 | 5.68 ± 0.20 |
| Ion chelating activity (μg/mL) | 370 ± 60 | 400 ± 60 | 1240 ± 80 | nd | 185.0 ± 2.0 |
Reducing power is associated with antioxidant activity, therefore may serve as a significant reflection of the antioxidant activity of compound as well as plant extract. Compounds with reducing power indicate that they are electron donors and can reduce the oxidized intermediates of lipid peroxidation processes, so that they can act as primary and secondary antioxidants. In this assay, the yellow color of the test solutions changed to various shades of green and blue depending on the reducing power of each sample. Presence of reducers caused the conversion of the ferricyanide complex to the ferrous form. By measuring formation of Pearl’s Prussian blue at 700 nm, it is possible to determine the concentration of Fe
+3 ions. All investigated plant extracts have shown high reducing power (
Table 3). Still, the highest reducing power was found for ethanolic extract. Furthermore, the increased reducing power with increased concentration was observed for all extracts. High reducing power of investigated extracts suggested remarkable potency of plant constituents to donate electrons to reactive free radicals, thus converting them into more stable non-reactive species and finally terminate the free radical chain reaction.
The antioxidant activity of
C. platycarpos extracts are also attributed to the ability of its constituents to chelate transition metal ions, such as iron, which has been proposed as the catalyst for the initial formation of reactive oxygen species. Furthermore, iron(II) ion is known as a potent inducer of lipid peroxidation as it accelerates lipid oxidation by breaking down hydrogen and lipid peroxides to reactive free radicals via the Fenton-type reaction. Ferrozine can quantitatively form complexes with iron(II) ions. This complex formation can be disrupted in the presence of chelating agents resulting in a decrease in the red color of the complex. The metal chelating activity of chelator can be successfully evaluated by measuring the color intensity reduction at the 562 nm wavelength. Methanolic, ethanolic and aqueous
C. platycarpos extracts demonstrated an ability to chelate iron(II) ions (
Table 3). No distinctive difference between the IC
50 values of methanolic and ethanolic extracts was obtained, while value obtained for aqueous extract was significantly higher. As mentioned above, EDTA was used as a positive control as it is one of the most powerful metal chelator ever known. Unfortunately, it should be pointed out that the chelating abilities of all
C. platycarpos extracts were much lower than EDTA.
Finally, the influence of total flavonid and phenolic acids content on antioxidant activities of C. platycarpos extracts was evaluated. The results showed very positive correlation between amounts of flavonoids and phenolic acids and antioxidative activities determined in following assays: inhibition of membrane lipid peroxidation (r = 0.9700 − 0.9871), superoxide dismutase activity (r = 0.9216 − 0.9936) and metal ion chelating (r = 0.9471 − 0.9856). Furthermore, good correlation was obtained between amounts of phenolic acids and antioxidative activities determined in the deoxyribose and reducing power assays (r = 0.8970 − 0.9587). No significant correlation between amounts of flavonoids and phenolic acids and antioxidative activities determined was in DPPH assays.


