Article

Prediction of Acute Mammalian Toxicity Using QSAR Methods: A Case Study of Sulfur Mustard and Its Breakdown Products

by
Patricia Ruiz
1,*,
Gino Begluitti
2,
Terry Tincher
2,
John Wheeler
1 and
Moiz Mumtaz
1
1
Computational Toxicology and Methods Development Lab, Division of Toxicology and Human Health Sciences, Agency for Toxic Substances and Disease Registry, Atlanta, GA 30333, USA
2
Environmental Public Health Readiness Branch, National Center for Environmental Health, Atlanta, GA 30333, USA
*
Author to whom correspondence should be addressed.
Molecules 2012, 17(8), 8982-9001; https://doi.org/10.3390/molecules17088982
Submission received: 6 June 2012 / Revised: 19 July 2012 / Accepted: 23 July 2012 / Published: 27 July 2012
(This article belongs to the Special Issue QSAR and Its Applications)

Abstract

:
Predicting toxicity quantitatively, using Quantitative Structure Activity Relationships (QSAR), has matured over recent years to the point that the predictions can be used to help identify missing comparison values in a substance’s database. In this manuscript we investigate using the lethal dose that kills fifty percent of a test population (the LD50) for determining relative toxicity of a number of substances. In general, the smaller the LD50 value, the more toxic the chemical, and the larger the LD50 value, the lower the toxicity. When systemic toxicity and other specific toxicity data are unavailable for the chemical(s) of interest, during emergency responses, LD50 values may be employed to determine the relative toxicity of a series of chemicals. In the present study, a group of chemical warfare agents and their breakdown products have been evaluated using four available rat oral QSAR LD50 models. The QSAR analysis shows that the breakdown products of Sulfur Mustard (HD) are predicted to be less toxic than the parent compound as well as other known breakdown products that have known toxicities. The QSAR estimated break down products LD50 values ranged from 299 mg/kg to 5,764 mg/kg. This evaluation allows for the ranking and toxicity estimation of compounds for which little toxicity information existed; thus leading to better risk decision making in the field.

1. Introduction

From World War I to 1968, the United States produced chemical weapons and warfare agents as a deterrent against use of similar weapons by other countries. Sulfur mustard (HD, Figure 1), a vesicant and alkylating chemical, is one such agent [1,2] Although never used during warfare by the United States, these chemicals are still abundant and are now deteriorating with age. In 1985, the U.S. Congress mandated that the Department of Defense be responsible for establishing a Chemical and Biological Defense (CBD) program, U.S. Code Title 50, Sections 1521 through 153, and provide for chemical weapons disposal and destruction. In accordance with this congressional mandate the Center for Disease Control and Prevention’s (CDC), Environmental Public Health Readiness Branch (EPHRB), Chemical Weapons Elimination section has been tasked with overseeing the Army’s destruction of chemical weapons to ensure that the general population, worker population and environment are protected.
Figure 1. Bis-(2-chloroethyl) sulfide.
Molecules 17 08982 g001
The Pueblo Chemical Agent Pilot Plant (PCAPP) plans to utilize neutralization processes to destroy the HD stored at the Pueblo Chemical Army Depot (PCAD). This process creates several breakdown products during and after the neutralization. The majority of these breakdown products do not have sufficient toxicity data to properly assess the human health impacts related to their exposure or to select appropriate personnel protective equipment (PPE) which will ensure the safety of the personnel. Thus, various stakeholders, viz., state, local, territorial, and tribal public health departments have stated concerns that only are the toxicity databases weak even indicators of overt mammalian toxicity like the lethal dose values that kill fifty percent of test population (LD50) are not available for such chemicals. The LD50 value is the lethal dose of a substance that will kill 50% of the test animals/organisms within 24 hours of exposure to a chemical [3,4]. LD50 values have been used to express the relative hazards associated with the acute toxicity of chemicals and are often used for the initial evaluation of toxicity. Computer-assisted Structure Activity Relationship (SAR) and Quantitative Structure Activity Relationship (QSAR) models, are being increasingly used to fill the data gaps in chemical (pharmaceutical, agrochemical, food additives and other industrial) toxicity databases. These in silico tools thus provide a means of assessing toxicity of chemicals that lack appropriate experimental test data [5,6,7,8,9,10,11,12,13].
Most in silico prediction systems used to estimate qualitative and quantitative toxicity are either SAR or QSAR models [14,15,16,17,18]. An SAR model, and/or an expert system, establishes qualitative association between a chemical’s substructures and its potential toxicity [19,20]. The confidence in the predictions of a new chemical is based on whether such identified structural alerts are present in the structure of a chemical of interest. Because expert systems are based on qualitative SARs, they usually do not make a quantitative prediction of toxic effect; predictions are expressed in a binary fashion i.e., toxic, indeterminate, or non-toxic. A QSAR model, on the other hand, is a mathematical relationship between the chemical’s quantitative molecular descriptors and its toxicological, biological, and physicochemical activities [9,13,21,22,23]. Molecular descriptors derived from atomic or molecular properties that encode physicochemical, topological, and surface properties of molecules are typically used as the backbone of a predictive QSAR model [21,24,25]. These descriptors are then correlated with a toxicological response of interest through a suitable statistical approach such as linear multiple regression, nearest neighbor, clustering, random forest, discriminant analysis, recursive partitioning, artificial neural networks, etc. [26,27,28,29,30,31,32,33,34,35]. Unlike an expert system, a QSAR model provides discrete quantitative predicted values given just the values of the molecular descriptors finally selected in the QSAR model. Choosing the appropriate SAR or QSAR model(s) is a challenge for federal agencies because several such models are available that predict a wide array of endpoints including the LD50 values. Additionally, acute oral mammalian toxicity (LD50) is one of the more complex toxicological endpoints to predict using QSAR methods. Presence of a gamut of biological and molecular events that lead to variable biological mechanisms and a lack of accurate and true understanding of the mechanism of toxicity contribute to this complexity [8,36].

2. Results

A total of 22 chemicals including the parent chemical HD, and its potential breakdown products, experimentally tested or untested, were evaluated using TOPKAT [37], ADMET Predictor [38], and T.E.S.T. [39] (Table 1). Experimental rat oral LD50 data for this study was available from two sources, ChemIDplus and Registry of Toxic Effects of Chemical Substances databases.
Table 1. Chemical name, structures and experimental LD50 of HD and its breakdown products.
Chemical NameChemical StructureExperimental LD50 (mg/kg)
Bis (2-chloroethyl) sulfide (HD) Molecules 17 08982 i00117
Bis [2-(2-chloroethylthioethyl) ether] (T) Molecules 17 08982 i002na
1,2-bis(2-chloroethylthio)ethane (Q) Molecules 17 08982 i003na
Bis (2-chloroethyl) disulfide Molecules 17 08982 i004na
Thiodiglycol (TDG) Molecules 17 08982 i0056,610
Thiodiglycol sulfoxide Molecules 17 08982 i006na
1,4-Dithiane Molecules 17 08982 i0072,768
1,4-Oxathiane Molecules 17 08982 i0082,830
Bis-[2-(2-hydroxyethylthioethyl)]ether (TOH) Molecules 17 08982 i009na
Ethanol, 2,2'-[1,2-ethanediylbis(thio)]-bis- (QOH) Molecules 17 08982 i010na
1-(2-hydroxyethylthio)-2-(2-vinylthioethoxy)ethane Molecules 17 08982 i011na
1-(2-hydroxyethylthio)-2-(2-vinylthio)ethane Molecules 17 08982 i012na
2-Hydroxyethyl vinyl sulfide Molecules 17 08982 i013na
2-Methylnaphthalene Molecules 17 08982 i0141,630
Bis-(2-chloroethyl) ether Molecules 17 08982 i01575
Bis-(2-ethylexyl)phthalate Molecules 17 08982 i01630,600
Propanal Molecules 17 08982 i0171,410
Ethylene Glycol Molecules 17 08982 i0184,700
Ethylene dichloride Molecules 17 08982 i019670
Bis-(2-Chloroethyl) sulfoxide Molecules 17 08982 i020na
Bis-(2-Chloroethyl) sulfone Molecules 17 08982 i021na
Thiodiglycol sulfone Molecules 17 08982 i022na
na: not available.

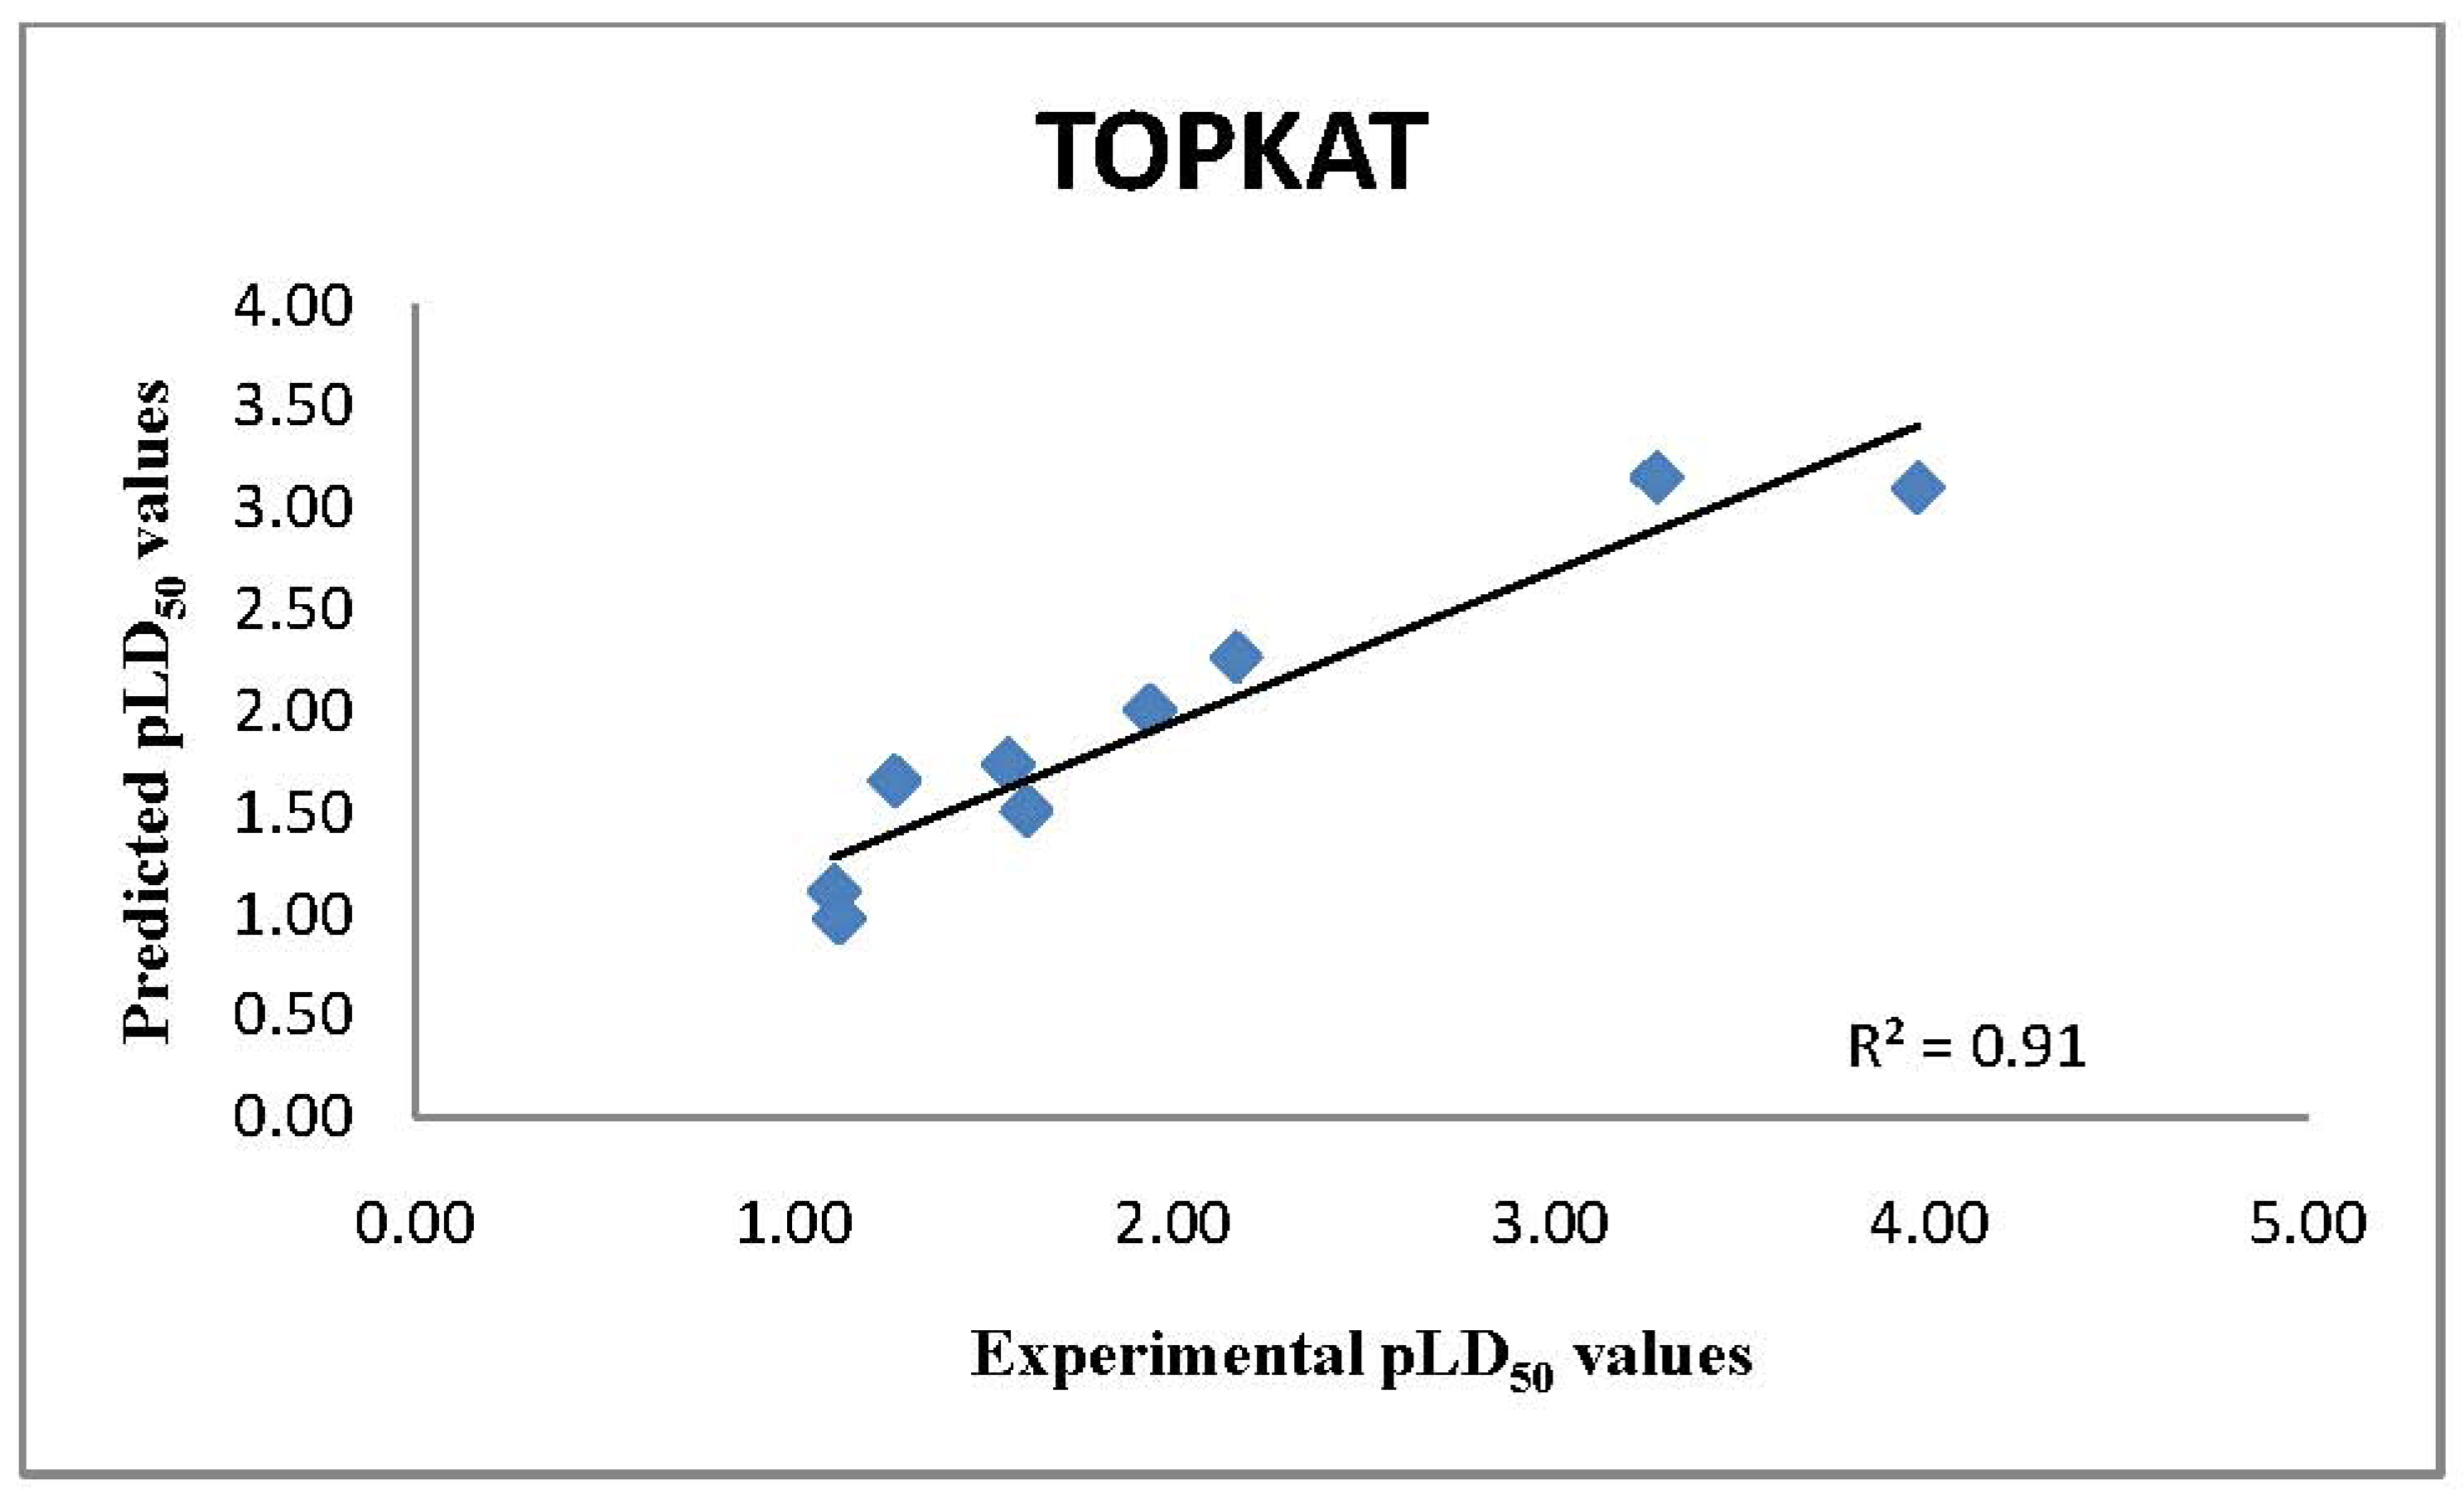
2.1. TOPKAT Predictions of LD50 Values

Of the 22 chemicals queried, eight chemicals [thiodiglycol (TDG), 1,4-oxathiane, 2-methylnaphthalene, bis-(2-chloroethyl) ether, bis-(2-ethylhexyl)phthalate, propanal, ethylene glycol, and ethylene dichloride] were found in the database associated with the TOPKAT LD50 model. Seven of the 22 chemicals were outside OPS of the model. Three of these seven were deemed acceptable estimates because the chemicals were outside the OPS in only one dimension. The remaining four were unacceptable estimates because they were outside the OPS in at least two dimensions.
The 15 remaining chemicals were very well represented in the LD50 model database as assessed by the univariate analysis. The multivariate analysis also showed that these chemicals were within the OPS of the model. The similarity analysis showed that there are several chemicals in the database that have a very close similarity distance. Hence, the confidence in the assessment of LD50 values for these chemicals is high. The estimated LD50 value of the break down products were within a factor of 4 (Figure 2) of the experimental values as shown in Table 2. This is well within a default factor of 10 often used in traditional risk assessment of environmental chemicals to compensate for uncertainties [40].
Figure 2. Comparison of Experimental pLD50 values with TOPKAT QSAR pLD50 model predictions.
Molecules 17 08982 g002
Table 2. Comparison of the estimated LD50 values using TOPKAT, 2D and 3D ADMET predictor, and the T.E.S.T model for chemicals with available experimental data.
Chemical NameExperimental LD50*TOPKATADMET 2DADMET 3DT.E.S.T Consensus
Bis (2-chloroethyl) sulfide 17125.9536.84349.3238.69
Thiodiglycol (TDG)6,608.562,7001,651.931,407.245,426.53
1,4-Dithiane2,767.71OPS502.47762.791,602.59
1,4-Oxathiane2,830.261,900791.981,185.751,834.75
2-Methylnaphthalene1,629.31,4001,884.91,864.481,391.74
Bis-(2-chloroethyl) ether75100.8215.35130.5744.72
Bis-(2-ethylhexyl)phthalate30,600>10,0008,781.916,791.8237,293.36
Propanal1,409.621,800404.01427.17353.02
Ethylene glycol4,7006,5002,705.282,034.172,587.11
Ethylene dichloride670537.5298.37297.55811.49
LD50* = mg/kg unit; OPS: outside of optimum prediction space.

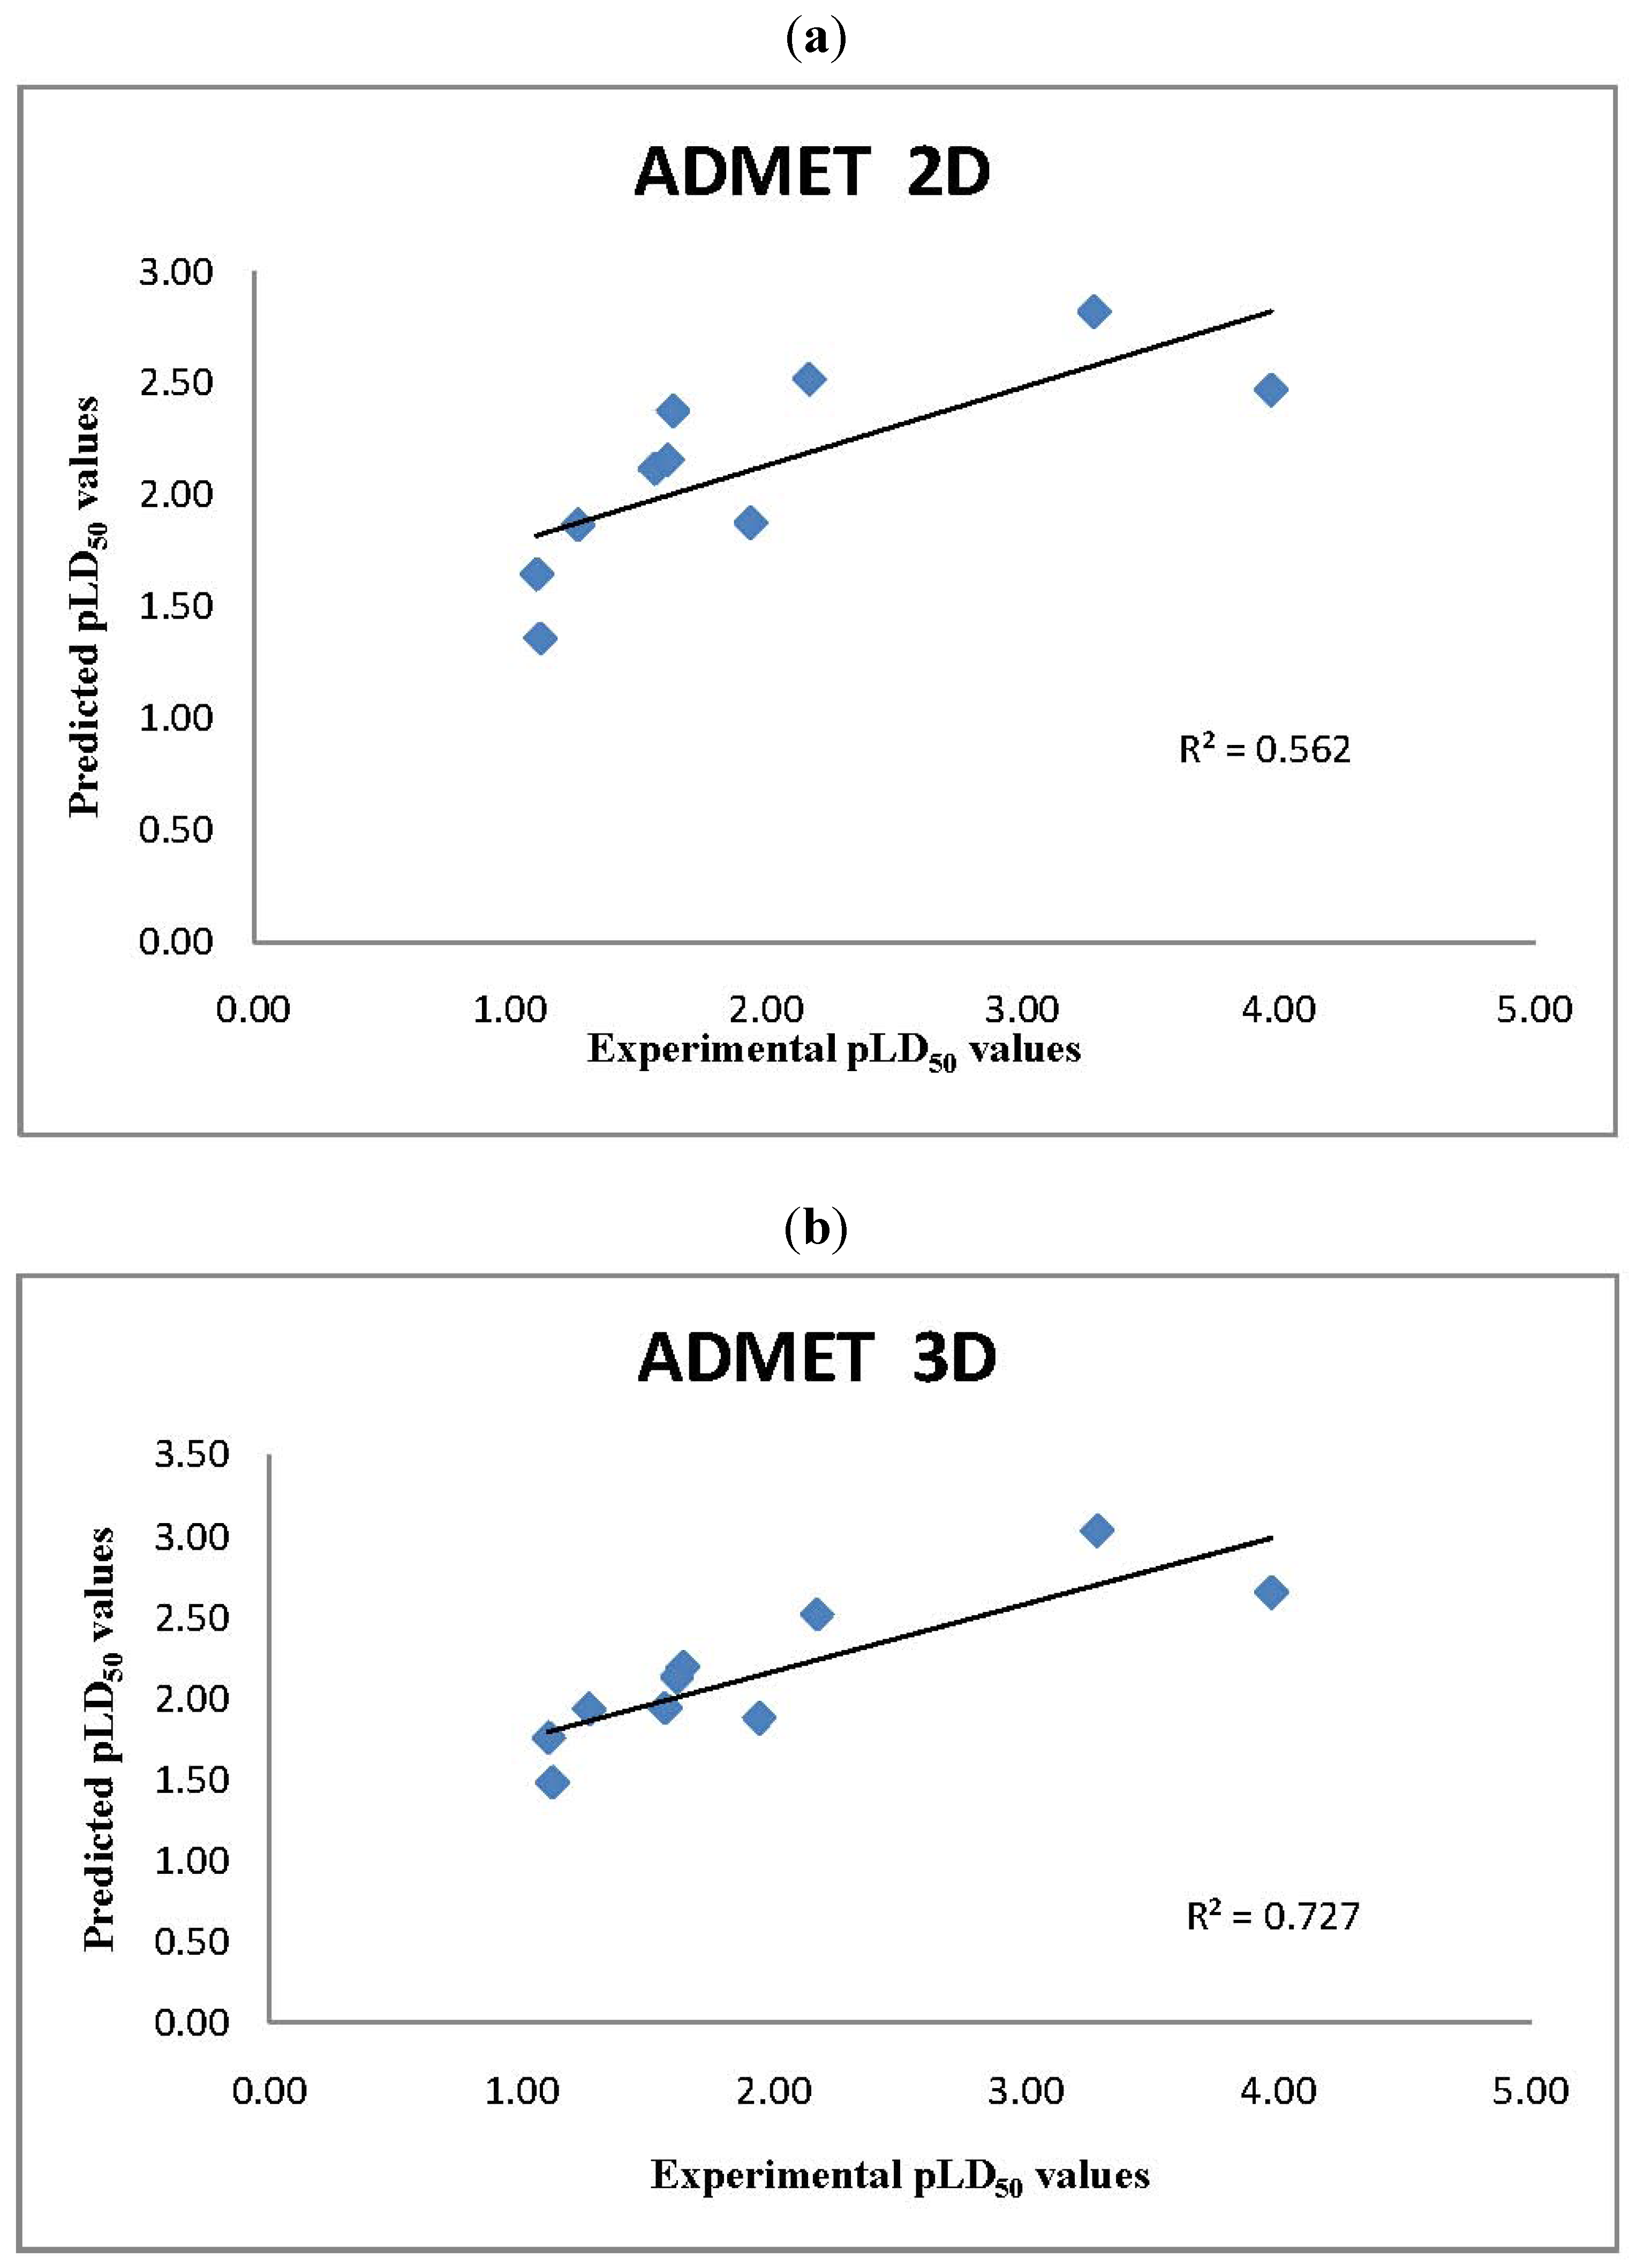
2.2. ADMET Predictor LD50 Values

Of the 22 chemicals queried, 10 chemicals [bis(2-chloroethyl) sulfide, thiodiglycol, 1,4-dithiane, 1,4-oxathiane, 2-methylnaphthalene, bis-(2-chloroethyl) ether, bis-(2-ethylhexyl)phthalate, propanal, ethylene glycol and ethylene dichloride) were found in the database associated with the ADMET 2D and 3D Predictor LD50 model as shown in Table 2. All the chemicals were within the applicability domain of the models, and met the requirements of constraints, hence the confidence in all the predicted LD50 values is high Figure 3a,b. The predicted LD50 values of HD and its breakdown products were within a factor of five, much smaller than a default factor of 10 often used in chemical risk assessments to compensate for uncertainties (Table 2).
Figure 3. (a) Comparison of Experimental pLD50 values with 2D ADMET predictor QSAR pLD50 model predictions; (b) Comparison of Experimental pLD50 values with 3D ADMET predictor QSAR pLD50 model predictions.
Molecules 17 08982 g003

2.3. T.E.S.T. Predictions of LD50 Values

Of the 22 chemicals queried, seven chemicals [bis(2-chloroethyl) sulfide, 1,4-oxathiane, 2-methyl-naphthalene, bis-(2-chloroethyl) ether, ethylene glycol, propanal and ethylene dichloride) were found in the model database associated with the consensus T.E.S.T LD50 model, and two (1,4-dithiane and thiodiglycol) were used in the external test set. All 22 chemicals were inside the applicability domain of the model. The 13 remaining chemicals were very well represented in the model database as assessed by the statistical analysis. The similarity analysis showed that there are several chemicals in the database that have very close similarity distance. Hence, the confidence in the assessment of LD50 values for these chemicals is high (Figure 4).
Figure 4. Comparison of Experimental pLD50 values with T.E.S.T QSAR pLD50 consensus model predictions.
Molecules 17 08982 g004
The estimated LD50 value of HD and its breakdown products were within a factor of less than two (Table 2). This is well within a default factor of 10 often used in risk assessment of environmental chemicals to compensate for uncertainties. The estimated LD50 values for the breakdown products that lack experimental data are shown on Table 3. Six chemicals [1,2-bis(2-chloroethylthio)ethane, bis-[2-(2-hydroxyethylthioethyl)]ether, ethanol, 2,2'-[1,2-ethanediylbis(thio)]-bis-, 1-(2-hydroxyethylthio)-2-(2-vinylthioethoxy)ethane, 1-(2-hydroxyethylthio)-2-(2-vinylthio)ethane, 2-hydroxyethyl vinyl sulfide) were found outside of the optimum prediction space for the TOPKAT model. However, ADMET Predictor and T.E.S.T. (consensus) LD50 model could estimate the LD50 values of these chemicals.
Table 3. Comparison of the estimated LD50 values using TOPKAT, 2D, 3D ADMET predictor and the T.E.S.T. model for chemicals that lack experimental data.
Chemical NameTOPKATADMET 2DADMET 3DT.E.S.T (consensus)
Bis [2-(2-chloroethylthioethyl) ether] (T)816.1197.18110.7166.96
1,2-Bis(2-chloroethylthio)ethane (Q)OPS630.39369.3993.02
Bis (2-chloroethyl) disulfide 153.6512.3443.37351.90
Thiodiglycol sulfoxide1,4003,524.732,912.394,094.75
Bis-[2-(2-hydroxyethylthioethyl)]ether (TOH)OPS1,355.551,665.4514,272.34
Ethanol, 2,2'-[1,2-ethanediylbis(thio)]-bis- (QOH)OPS1,014.261,045.923,506.17
1-(2-Hydroxyethylthio)-2-(2-vinylthioethoxy)-ethaneOPS574.96649.362,730.21
1-(2-Hydroxyethylthio)-2-(2-vinylthio)ethaneOPS391.583991,339.93
2-Hydroxyethyl vinyl sulfideOPS474.79448.1979.11
Bis-(2-chloroethyl) sulfoxide67.9449.01265.64577.05
Bis-(2-chloroethyl) sulfone227462.07260.21249.89
Thiodiglycol sulfone2,8002,715.911,805.2412,190.02
OPS: outside of l optimum prediction space.

3. Discussion

Sulfur mustard neutralization breakdown products are a diverse group of chemicals that either have no or minimal test data available regarding their toxicological effects [1]. Some members of this group and their breakdown products even lack LD50 values. Hence a 2-step in silico approach was adopted wherein a QSAR analysis was performed. In the first step we estimated LD50 values using four different QSAR LD50 models. Each one of the models is internally and externally validated, robust, and has good applicability domains. The LD50 predicted values were compared with the available experimental values when available, and were found to be within acceptable ranges (10 fold) used in chemical risk assessment. Analyses were performed to evaluate the use of these chemicals in the training set used for the model development, if they were part of the external validation set, or they were not used in the model development. Through this process we could evaluate which of the chemicals in this assessment were used to develop each of the models, thus we can identify the applicability domain of each model.
In the second step, using the above models, we determined the LD50 values for breakdown products that lack experimental data (Table 3). The key application of QSAR is to fill the data gaps for chemical toxicity. We achieved this through considerations of the strengths and weaknesses of each model, knowing that none of them is a perfect model. If the strength and advantage of a model is clearly known, the output of such a model can be used easily. TOPKAT model is well known and used by regulatory community, particularly federal agencies. The applicability domain of the model for this particular data set of chemicals was poor, i.e., seven of the twenty two chemical were outside the optimum prediction space (OPS). On the contrary, ADMET predictor and T.E.S.T. had high chemical applicability domain for this data set. These models use both internal and external validated compared with TOPKAT that uses only one validation method. These models not only showed a high chemical applicability domain but also broad activity ranges in this applicability domain for this data set. However, the T.E.S.T model had superior performance compared to ADMET predictor.
Taking an average of estimates when using multiple models could compensate the limitations of the individual models that use different descriptors and statistical methods to model different aspects of the toxicological affects. Thus, the use of a consensus model is always more beneficial than an individual.
When using multiple models with varying modeling techniques (molecular descriptors, statistical methods and validation), it is a bigger challenge to judge the model output if their performances are comparable but slightly different [30,41,42,43,44]. In such cases, the conventional wisdom is to use an arithmetic averaging scheme which was also used in our study (Table 4), or use the most conservative values estimated by the models. For example, as shown in Table 3, the estimated LD50 values of bis-[2-(2-hydroxyethylthioethyl)] ether (TOH) and thiodiglycol sulfone are less toxic by the T.E.S.T. model (much higher LD50 values) compared to the other models, in such case, the T.ES.T model estimate could be excluded using a more safe approach.
Table 4. Average estimated LD50 values and the classification of HD breakdown products that lack of experimental LD50 values.
Chemical NameQSAR estimated LD50 (average of TOPKAT, 2D, 3D ADMET predictor and T.E.S.T.)Toxicity Class *
Bis [2-(2-chloroethylthioethyl) ether] (T)322.74Very Toxic
1,2-Bis(2-chloroethylthio)ethane (Q)364.27Very Toxic
Bis (2-chloroethyl) disulfide 365.29Very Toxic
Thiodiglycol sulfoxide2,982.97Moderately Toxic
Bis-[2-(2-hydroxyethylthioethyl)]ether (TOH)5,764.45Slightly Toxic
Ethanol, 2,2'-[1,2-ethanediylbis(thio)]-bis- (QOH)1,855.45Moderately Toxic
1-(2-hydroxyethylthio)-2-(2-vinylthioethoxy)-ethane1,318.18Moderately Toxic
1-(2-Hydroxyethylthio)-2-(2-vinylthio)ethane710.17Moderately Toxic
2-Hydroxyethyl vinyl sulfide634.00Moderately Toxic
Bis-(2-Chloroethyl) sulfoxide339.90Very Toxic
Bis-(2-Chloroethyl) sulfone299.79Very Toxic
Thiodiglycol sulfone4,877.79Moderately Toxic
* Super toxic (<5 mg/kg), extremely toxic (5–50 mg/kg), very toxic (50–500 mg/kg), moderately toxic (500–5,000 mg/kg), slightly toxic (5,000–15,000 mg/kg) and practically non-toxic (>15,000 mg/kg).
With an increase in the number of QSAR models available, commercially or open source, that are developed using a variety of approaches, the final interpretation and application will depend on the user confidence and the transparency of the model [44,45,46,47] The LD50 values, experimental or QSAR, are used to determine the relative toxicity of a series of chemicals in which the LD50 value of a given chemical is compared with the LD50 values of other chemicals [4]. Using acceptable toxicity scales, the chemicals are assigned to various groups. One of the most common scales used is the Gosselin, Smith and Hodge scale. Super toxic (<5 mg/kg), extremely toxic (5–50 mg/kg), very toxic (50–500 mg/kg), moderately toxic (500–5,000 mg/kg), slightly toxic (5,000–15,000 mg/kg) and practically non-toxic (>15,000 mg/kg) [48].
Using this scale, the QSAR estimates enabled the ranking of these chemicals on the basis of potential toxicities, in a rapid manner. The breakdown products of sulfur mustard (HD) hydrolysis reaction, thiodiglycol (TDG), 1,4-dithiane, 1,4-oxathiane and 2-hydroxyethyl vinyl sulfide (Scheme 1) were estimated to have moderate LD50 values (>500 mg/kg), when compared with HD, the parent compound.
Scheme 1. Hydrolysis of bis-(2-chloroethyl) sulfide.
Molecules 17 08982 g006
The dissolution of HD in presence of water leads to the formation of the intermediate sulfonium ion which in turn reacts with another molecule of HD to form 1,2-bis-(2-chloroethylthio) ethane (Q) and 1,2-dichloroethane (Scheme 2). The estimated LD50 values of 1, 2-bis-(2-chloroethylthio) ethane is <500 mg/kg which is very toxic, but less than HD.
Scheme 2. Dissolution of Bis-(2-Chloroethyl) sulfide.
Molecules 17 08982 g007
HD and its hydrolysis product TDG are oxidized to give the sulfoxide and sulfone analogs of HD and TDG (Scheme 3). The sulfoxide and sulfone analogs of HD are less toxic than HD; the estimated LD50 values were between 339.90 and 299.79 mg/kg, respectively. TDG and its sulfoxide and sulfone analogs are slightly and moderately toxic, respectively, when compared to the extremely toxic parent compound, HD.
The estimated LD50 values of HD, O-mustard (T) and sesquimustard (Q) and their hydroxylated analogs TDG, TOH and QOH show that these analogs are much less toxic (Figure 8). However, when compared with their vinyl analogs, TDG, TOH and QOH are shown to have a higher potential toxicity, but less than HD, T and Q (Figure 5).
Scheme 3. Oxidation of Bis-(2-Chloroethyl) sulfide.
Molecules 17 08982 g008
Figure 5. Sulfur mustard (HD), O-mustard (T) and sesquimustard (Q), and their hydroxylated and vinyl analogs.
Molecules 17 08982 g005
The QSAR estimated LD50 values for the breakdown products ranged from 299.79 mg/kg to 5,764.45 mg/kg. These data indicate that five breakdown products fall under very toxic class (50–500 mg/kg) while seven fall under moderately toxic (LD50 values 0.5–5 g/kg) class. None of the chemicals fall under the extremely toxic or super toxic categories (Table 4). Thus, the experimentally untested breakdown products are potentially less toxic than those chemicals that were experimentally tested (range from 17 mg/kg to 30,600 mg/kg). The experimentally tested chemicals including the parent chemical fall under the extremely toxic class (5–50 mg/kg) and a breakdown product falls under the very toxic (50–500 mg/kg) class. Six of the breakdown products fall under moderately toxic (LD50 values 500–5,000 mg/kg), while one each falls under slightly toxic (5,000–15,000 mg/kg) and practically non toxic (>15,000 mg/kg) class. None fall under super toxic class (less than 5 mg/Kg). Thus, overall the potential toxicity of QSAR estimated breakdown products is potentially lower than the parent compound. The QSAR LD50 models estimates not only are within a factor of 10 of the experimental available data [except for bis(2-chloroethyl) sulfide], but also have shown an overall degree of conservatism, except for the HD, which was predicted as very toxic by TOPKAT, ADMET 2D and 3D models, compared to extremely toxic experimental value. This information will be useful to stakeholders involved in HD neutralization processes to assess risk associated with these breakdown products.
Mammalian toxicity, particularly LD50 values are much more challenging because the mechanism of acute lethal toxicity is complex, and is not fully understood because of complex interactions between the organism and pharmacokinetic and pharmaco-dynamics of the chemicals. However, a growing number of in silico tools and QSAR models continue to be developed because of demand for such estimates due to resource limitations and timely needs, apart from ethical reasons [49]. Gaining knowledge from these kinds of activities should help in vitro to in vivo extrapolations, especially since large in vitro data generating efforts are ongoing at the National Academy of Science and the EPA [50,51,52]. Through these efforts, meaningful structural features can be identified that will lead to the development of robust predictive models, and specific selection criteria for use of such models. A thoughtful application and prudent use of such models can help estimate the toxicity of chemicals that lack experimental data, and prioritize chemicals for screening and subsequent toxicity testing while saving cost and time, thus minimizing experimental animal testing while optimizing overall use of resources. Recent laws are pushing the acceptance of these methods and their use by the regulatory and public health communities in the mitigation of potential hazardous exposures that could compromise the quality of human health and environment [53,54,55]. In silico tools can play a pivotal role for assessing the health risk of environmental and pharmaceutical chemicals, especially when the only characteristic known is the structure of a chemical.

4. Materials and Methods

The chemical and biological defense program of the Department of Defense uses multiple chemical reactions such as dissolution, hydrolysis, oxidation, and neutralization (see discussion section) to dispose, decontaminate and destroy chemicals weapons such as sulfur mustard (HD) that have been stored for a long time with varies type of stabilizers.
For the present work, we used the following three QSAR modeling packages to estimate the LD50 values of HD [bis-(2-chloroethyl) sulfide (Figure 1)] and its breakdown products: TOPKAT® (Toxicity Prediction by Komputer Assisted Technology, Version 6.2, Accelrys, Inc.) and ADMET Predictor 5.0 (Simulation Plus Inc.) and Toxicity Estimation Software Tool (T.E.S.T. US EPA) [37,38,39].

4.1. Toxicity Prediction by Komputer Assisted Technology (TOPKAT)

QSAR software package TOPKAT® 6.2, is a tool for structure-based activity assessment, which correlates activity with structural attributes (descriptors). The software encompasses a set of QSAR models, each concerning a different type of activity. TOPKAT QSAR models have been used for the estimation of potential toxicity such as carcinogenicity, mutagenicity, developmental toxicity, LD50, LOAELs and skin sensitization. The TOPKAT QSARs models utilize a computer-based method to assess the activity of a chemical solely based on its molecular attributes [37].

TOPKAT Rat Oral LD50 Model

The LD50 QSAR model of the TOPKAT package comprises 19 statistically significant and cross-validated QSAR sub-models, and the data from which these models are derived. These models are derived from experimental LD50 values of approximately 4,000 chemicals from open literature. Each QSAR model assesses the rat oral acute median lethal dose (LD50) for a specific class of chemicals. Molecular structure is the only input required to conduct an LD50 assessment. This model automatically determines whether the submitted structure belongs in the Optimum Prediction Space (OPS) of the model, and (ii) computes QSAR similarity distance from chemicals with experimental LD50 data in order to evaluate the reliability of the QSAR-based assessment [56,57].

4.2. ADMET Predictor Rat Oral LD50 Model

ADMET Predictor™ is a state-of-the-art computer program designed to estimate certain ADMET (Absorption, Distribution, Metabolism, Elimination, and Toxicity) properties of a chemical from its 2 and 3 dimensional (2D and 3D) molecular structures (Simulations Plus Inc.). The program uses molecular descriptor values as inputs to independent mathematical models (generally, nonlinear machine learning techniques) in order to generate estimates for each of the ADMET properties. Qualitative and quantitative models of several measures of toxicity are estimated by ADMET Predictor including maximum recommended therapeutic dose, fathead minnow lethal toxicity, Daphnia magna lethal toxicity, acute rat toxicity, Ames mutagenicity in Salmonella typhimurium, carcinogenicity in rats, etc. The rat oral LD50 model is supported by data from two sources, CDC’s Registry of Toxic Effects of Chemical Substances (RTECS), and the ChemIDplus database. The LD50 data was converted to the negative logarithm of LD50 (pLD50) for the model development, 7150 unique identifiable compounds were selected and used. Two models are available that are based on 2 and 3 dimensional (2D and 3D) descriptors of the chemical structure. Greater than (or equal to) 20% of the data were set aside for the external test sets prior to training the models. It is noteworthy that the models had complete coverage and were able to make predictions having root mean square error (RMSE) of approximately 0.63 log units for both 2D and 3D test sets.

4.3. Toxicity Estimation Software Tool (T.E.S.T.)

T.E.S.T. estimates toxicity using a variety of QSAR methodologies, such as hierarchical clustering, the Food and Drug Administration (FDA) MDL, nearest neighbor, and a consensus model which is simply the average of the predicted toxicities from other QSAR methodologies (taking into account the applicability domain of each method) [30]. The required descriptors are calculated without requiring any external programs. The structure of a chemical can be simply entered through the use of multiple tools including a chemical sketcher window, a text file containing SMILES notations, or importing it from a database of structures. After entering the structure, a chemical’s toxicity can be estimated using one of several advanced methodologies. T.E.S.T. version 4.0 contains LD50 values from 7,420 chemicals [28].

4.3.1. The Hierarchical Clustering Method

The hierarchical clustering method utilizes a variation of the Ward’s Minimum Variance Clustering Method [58] to produce a series of clusters from the initial training set. For a training set of n chemicals, initially there will be n clusters formed. At each step in the clustering process, two clusters are combined so that the increase in variance over all of the clusters in the system is minimized. The change in variance caused by combining clusters j and k is as follows:
Molecules 17 08982 i023
where nj = number of chemicals in cluster j, Cj,i is the centroid (or average value) for descriptor i for cluster j, and d is the number of descriptors (~800) [28]. The process of combining clusters while minimizing variance continues until all of the chemicals are lumped into a single cluster. After the clustering is complete, each cluster is analyzed to determine if an acceptable QSAR model can be developed. A genetic algorithm technique is used to select descriptors to build a multilinear regression model for each cluster [28], and each model must achieve a leave-one-out cross-validation (LOO-CV) accuracy of 0.5 to be used in making predictions. The predicted value for a given test chemical is calculated using the equally weighted average of the model predictions from the closest cluster from each step in the hierarchical clustering.

4.3.2. The FDA MDL QSAR Method

The FDA MDL method is based on the work of Contrera and coworkers [59]. In this method, predictions for each test chemical are made using a unique cluster (constructed at runtime) which contains structurally similar chemicals selected from the overall training set. This is in contrast to the Hierarchical method, where the predictions are made using one or more clusters that are constructed a priori using Ward’s method. For each test chemical, a cluster is constructed using the 30 most similar chemicals from the training set as defined by the cosine similarity coefficient, SCi,k, which is calculated as follows:
Molecules 17 08982 i024
where xij is the value of the j-th normalized descriptor for chemical i (normalized with respect to all of the chemicals in the original training set) and xkj is the value of the j-th descriptor for chemical k. The entire pool of approximately 800 descriptors is used to calculate the similarity coefficient in equation 2. A multiple linear regression model is then built for the new cluster using a genetic algorithm-based method, and the toxicity is predicted [30].

4.3.3. The Nearest Neighbor Method

The nearest neighbor method is a simplification of the variable selection kNN approach. In the nearest neighbor method, the toxicity is simply predicted as the average of the toxicity of the three most similar chemicals from the training set. The similarity is defined in terms of the cosine similarity coefficient (Equation 2). In this method, the entire available descriptor pool is used to characterize molecular similarity (as opposed to a subset of the descriptor pool as in the descriptor selection kNN method). To make a prediction, each of the neighbors in the training set must exceed a minimum cosine similarity coefficient of 0.5 [28].

4.4. Applicability Domains (ADs)

Every QSAR model can predict the potential toxicity of any chemical but the confidence in such predictions can vary. However, because each model is developed using a training set of chemicals that cover only a small fraction of the entire chemical universe its prediction capability is restricted to its applicability domain (AD), i.e., its descriptor space. As a consequence of this only a certain fraction of chemicals of an external data set can be reasonably predicted. So it is important to determine if a chemical of interest falls within the AD of a model. If it falls outside the AD, varying degrees of uncertainties could be associated with such a prediction. Model ADs, their characteristics and limitations need to be understood thoroughly for the appropriate interpretation of results [29,31,32,60,61,62,63]. Described below are the AD restrictions or requirements of the models we used in this study.

4.4.1. AD of the TOPKAT Model

In the TOPKAT model two types of analysis, the univariate analysis and multivariate analysis, are automatically performed to determine if a chemical is within the AD of a model. The univariate analysis or coverage examination checks whether all of the structural fragments of the query structure are covered by the chemical database associated with the model. The multivariate analysis or Optimum Prediction Space (OPS) examination checks to see whether the submitted structure fits within or near the periphery of OPS of the equation. If the query compound is deemed outside the OPS a warning about acceptability of the assessment is issued [37]. The details of the assessment process using the TOPKAT software have been published previously [13,37,56,57]. Another feature of TOPKAT, the “QSAR similarity” analysis, enhances the confidence in a prediction [13,57,64]. To assign high, moderate, or low confidence in a prediction the nearest 4 neighbors in the data base with a similarity distance of <0.25 are considered [13].

4.4.2. AD of the ADMET Predictor Model

The ADMET Predictor automatically determines whether a given compound is within the AD of the model. The AD is defined in terms of molecular descriptor space, not in terms of the relative value of an ADMET property. Let X denote an ADMET model with known training set and let Molecules 17 08982 i025 
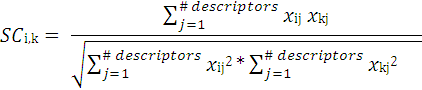
be a descriptor set of model X. For each descriptor, xi(i= 1,…, N), its minimum and maximum values, Molecules 17 08982 i026 and Molecules 17 08982 i027, are determined over the training set of X. A new compound C is said to be within the scope of X if the value of each relevant descriptor ci(i= 1,…, N) calculated for C is contained within the corresponding interval Molecules 17 08982 i028 with tolerance equal to 10% of the interval length. Such a compound has its X value typed in black bold font. Otherwise, the compound in question is outside the scope of X and its X value is marked by magenta font (Simulations Plus Inc.).

4.4.3. AD of the Hierarchical Clustering Method

The first restriction, the model ellipsoid constraint, checks if the test chemical is within the multidimensional ellipsoid defined by the ranges of descriptor values for the chemicals in its database. It is satisfied if the leverage of the test chemical (h00) is less than the maximum leverage value for all of the chemicals used in the model. The second restriction, the Rmax constraint, checks if the distance from the test chemical to the centroid of the database is less than the maximum distance for any chemical in the database to the database centroid. The final constraint, the fragment constraint, stipulates that the chemicals in the database must contain at least one example of each of the fragments that are present in the test chemical [28,30].

4.4.4. AD of the FDA MDL QSAR Method

For the prediction to be valid, three restrictions must be met. The first two, the model ellipsoid and fragment, are same as described above. Third restriction is that the predicted toxicity value must be within the range of experimental toxicity values for the chemicals in the database used to build the model [28,30].

4.4.5. AD of the Nearest Neighbor Method

Predictions using this model require at least three chemicals in the training set that are sufficiently similar to the test chemical. That is, the similarity coefficient between each of the three chemicals and the test chemical in equation 1 must exceed 0.5 [30].

5. Conclusions

This study has integrated commercial and open source robust QSAR LD50 models to develop an approach for evaluation of the toxicity of chemicals that lack experimental toxicity data. This project was undertaken to determine the potential toxicity of sulfur mustard neutralization breakdown products toxicity using QSAR analysis since there is no experimental toxicity data available for such breakdown products. The QSAR estimates obtained show that the breakdown products will have less potential toxicity than some of the better known breakdown products of sulfur mustard. This evaluation can provide stakeholders with the potential toxicity values to make risk based decisions related to these breakdown products.

Acknowledgments

The findings and conclusions in this report are those of the author(s) and do not necessarily represent the views of the Centers for Disease Control and Prevention/the Agency for Toxic Substances and Disease Registry.

Conflict of Interest

The authors declare no conflict of interest.

References

  1. Agency for Toxic Substances and Disease Registry (ATSDR), Toxicological Profile for Sulfur Mustard; ATSDR: Atlanta, GA, USA, 2003.
  2. International Agency for Research on Cancer (IARC), Monographs; IARC: Lyon, France, 1987; pp. 403–405.
  3. Lu, F.; Kacew, S. Basic toxicology. In Fundamentals, Target Organs, and Risk Assessment; Taylor & Francis: New York, NY, USA, 2002. [Google Scholar]
  4. Balls, M. Why modification of the LD50 test will not be enough. Lab. Anim. 1991, 25, 198–206. [Google Scholar] [CrossRef]
  5. Fiedler, H.; Hutzinger, O.; Giesy, J.P. Utility of the QSAR modeling system for predicting the toxicity of substances on the European inventory of existing commercial chemicals. Toxicol. Environ. Chem. 1990, 28, 167–188. [Google Scholar] [CrossRef]
  6. Cronin, M.T.; Dearden, J.C. QSAR in toxicology. 2. Prediction of acute mammalian toxicity and interspecies correlations. QSAR 1995, 14, 117–120. [Google Scholar]
  7. Greene, N. Computer systems for the prediction of toxicity: An update. Adv. Drug Deliv. Rev. 2002, 54, 417–431. [Google Scholar] [CrossRef]
  8. Tsakovska, I.; Lessigiarska, I.; Netzeva, T.; Worth, A.P. A mini review of mammalian toxicity (Q)SAR models. QSAR Comb. Sci. 2008, 27, 41–48. [Google Scholar] [CrossRef]
  9. Demchuk, E.; Ruiz, P.; Chou, S.; Fowler, B.A. SAR/QSAR methods in public health practice. Toxicol. Appl. Pharmacol. 2011, 254, 192–197. [Google Scholar] [CrossRef]
  10. Schultz, T.W.; Seward, J.R. Health-effects related structure-toxicity relationships: A paradigm for the first decade of the new millennium. Sci. Total Environ. 2000, 249, 73–84. [Google Scholar] [CrossRef]
  11. Simon-Hettich, B.; Rothfuss, A.; Steger-Hartmann, T. Use of computer-assisted prediction of toxic effects of chemical substances. Toxicology 2006, 224, 156–162. [Google Scholar] [CrossRef]
  12. Jaworska, J.S.; Comber, M.A.C.; van Leeuwen, C.J. Summary of a workshop on regulatory acceptance of (Q)SARs for human health and environmental endpoints. Environ. Health Perspect. 2003, 111, 1358–1360. [Google Scholar] [CrossRef]
  13. Ruiz, P.; Mumtaz, M.; Gombar, V. Assessing the toxic effects of ethylene glycol ethers using Quantitative Structure Toxicity Relationship models. Toxicol. Appl. Pharmacol. 2011, 254, 198–205. [Google Scholar] [CrossRef]
  14. Gombar, V.K. Quantiative structure-activity relationships in toxicology: From fundamentals to applications. Adv. Mol. Toxicol. 1997, 125–139. [Google Scholar]
  15. Klopman, G.; Zhu, H.; Fuller, M.A.; Saiakhov, R.D. Searching for an enhanced predictive tool for mutagenicity. SAR QSAR Environ. Res. 2004, 15, 251–263. [Google Scholar] [CrossRef]
  16. Richard, A.M.; Benigni, R. AI and SAR approaches for predicting chemical carcinogenicity: Survey and status report. SAR QSAR Environ. Res. 2002, 13, 1–19. [Google Scholar] [CrossRef]
  17. Enslein, K. QSTR applications in acute, chronic, and developmental toxicity, and carcinogenicity. Adv. Mol. Toxicol. 1998, 141–164. [Google Scholar]
  18. Cronin, M.T.; Walker, J.D.; Jaworska, J.S.; Comber, M.H.; Watts, C.D.; Worth, A.P. Use of QSARs in international decision-making frameworks to predict ecologic effects and environmental fate of chemical substances. Environ. Health Perspect. 2003, 111, 1376–1390. [Google Scholar] [CrossRef]
  19. McKinney, J.D.; Richard, A.; Waller, C.; Newman, M.C.; Gerberick, F. The Practice of Structure Activity Relationships (SAR) in Toxicology. Toxicol. Sci. 2000, 56, 8–17. [Google Scholar] [CrossRef]
  20. Richard, A.M. Commercial toxicology prediction systems: A regulatory perspective. Toxicol. Lett. 1998, 102–103, 611–616. [Google Scholar] [CrossRef]
  21. Gombar, V.K.; Jain, D.V.S. Quantification of molecular shape and its correlation with physico-chemical properties. Indian J. Chem. 1987, 24A, 554–555. [Google Scholar]
  22. Enslein, K. The future of toxicity prediction with QSAR. In Vitro Toxicol. 1993, 6, 163–169. [Google Scholar]
  23. Ruiz, P.; Faroon, O.; Moudgal, C.J.; Hansen, H.; De Rosa, C.T.; Mumtaz, M. Prediction of the health effects of polychlorinated biphenyls (PCBs) and their metabolites using quantitative structure-activity relationship (QSAR). Toxicol. Lett. 2008, 181, 53–65. [Google Scholar] [CrossRef]
  24. Gombar, V.K.; Enslein, K. Quantitative Structure-Activity Relationship (QSAR) studies using electronic descriptors calculated from topological and Molecular Orbital (MO) methods. QSAR 1990, 9, 321–325. [Google Scholar]
  25. Hall, L.H.; Mohney, B.; Kier, L.B. The electrotopological state: Structure information at the atomic level for molecular graphs. J. Chem. Inf. Comput. Sci. 1991, 31, 76–82. [Google Scholar] [CrossRef]
  26. Zheng, W.; Tropsha, A. Novel Variable Selection Quantitative Structure−Property relationship approach based on the k-Nearest-Neighbor principle. J. Chem. Inf. Comput. Sci. 1999, 40, 185–194. [Google Scholar]
  27. Eriksson, L.; Jaworska, J.; Worth, A.P.; Cronin, M.T.; McDowell, R.M.; Gramatica, P. Methods for reliability, uncertainty assessment, and applicability evaluations of classifications and regression-based QSARs. Environ. Health Perspect. 2003, 111, 1361–1375. [Google Scholar] [CrossRef]
  28. Martin, T.M.; Harten, P.; Venkatapathy, R.; Das, S.; Young, D.M. A hierarchical clustering methodology for the estimation of toxicity. Toxicol. Mech. Methods 2008, 18, 251–266. [Google Scholar] [CrossRef]
  29. Tropsha, A.; Golbraikh, A. Predictive QSAR modeling workflow, model applicability domains, and virtual screening. Curr. Pharm. Des. 2007, 13, 3494–3504. [Google Scholar] [CrossRef]
  30. Zhu, H.; Martin, T.M.; Ye, L.; Sedykh, A.; Young, D.M.; Tropsha, A. Quantitative structure-activity relationship modeling of rat acute toxicity by oral exposure. Chem. Res. Toxicol. 2009, 22, 1913–1921. [Google Scholar] [CrossRef]
  31. Golbraikh, A.; Shen, M.; Xiao, Z.; Xiao, Y.-D.; Lee, K.-H.; Tropsha, A. Rational selection of training and test sets for the development of validated QSAR models. J. Comput. Aided Mol. Des. 2003, 17, 241–253. [Google Scholar] [CrossRef]
  32. Golbraikh, A.; Tropsha, A. Beware of q2! J. Mol. Graph. Model. 2002, 20, 269–276. [Google Scholar] [CrossRef]
  33. Breiman, L. Random Forests. Mach. Learn. 2001, 45, 5–32. [Google Scholar] [CrossRef]
  34. Papa, E.; Kovarich, S.; Gramatica, P. On the use of local and global QSPRs for the prediction of physico-chemical properties of polybrominated diphenyl ethers. Mol. Inform. 2011, 30, 232–240. [Google Scholar] [CrossRef]
  35. Li, J.Z.; Gramatica, P. Classification and virtual screening of androgen receptor antagonists. J. Chem. Inf. Model. 2010, 50, 861–874. [Google Scholar] [CrossRef]
  36. Sazonovas, A.; Japertas, P.; Didziapetris, R. Estimation of reliability of predictions and model applicability domain evaluation in the analysis of acute toxicity (LD 50). SAR QSAR Environ. Res. 2010, 21, 127–148. [Google Scholar] [CrossRef]
  37. TOPKAT User Guide Version 6.2; Accelrys: San Diego, CA, USA, 2004.
  38. T. E. S.T Tool, User’s Guide for T.E.S.T, Version 4.0.; US EPA: Cincinatti, OH, USA, 2011.
  39. User Manual Version 5.5; Simulation Plus Inc, S. P.: Lancaster, CA, USA, 2011.
  40. Stedeford, T.; Zhao, Q.J.; Dourson, M.L.; Banasik, M.; Hsu, C.H. The application of non-default uncertainty factors in the US EPA’s Integrated Risk Information System (IRIS). Part I: UFL, UFS, and “Other uncertainty factors”. J. Environ. Sci. Heal. C 2007, 25, 245–279. [Google Scholar] [CrossRef]
  41. Votano, J.R.; Parham, M.; Hall, L.H.; Kier, L.B.; Oloff, S.; Tropsha, A.; Xie, Q.; Tong, W. Three new consensus QSAR models for the prediction of Ames genotoxicity. Mutagenesis 2004, 19, 365–377. [Google Scholar] [CrossRef]
  42. Moore, D.R.J.; Breton, R.L.; MacDonald, D.B. A comparison of model performance for six quantitative structure-activity relationship packages that predict acute toxicity to fish. Environ. Toxicol. Chem. 2003, 22, 1799–1809. [Google Scholar] [CrossRef]
  43. Tong, W.; Hong, H.; Fang, H.; Xie, Q.; Perkins, R. Decision forest: Combining the predictions of multiple independent decision tree models. J. Chem. Inf. Comput. Sci. 2003, 43, 525–531. [Google Scholar] [CrossRef]
  44. Tunkel, J.; Mayo, K.; Austin, C.; Hickerson, A.; Howard, P. Practical considerations on the use of predictive models for regulatory purposes. Environ. Sci. Technol. 2005, 39, 2188–2199. [Google Scholar] [CrossRef]
  45. Devillers, J.; Mombelli, E. Evaluation of the OECD QSAR Application Toolbox and Toxtree for estimating the mutagenicity of chemicals. Part 2. alpha-beta unsaturated aliphatic aldehydes. SAR QSAR Environ. Res. 2010, 21, 771–783. [Google Scholar] [CrossRef]
  46. Fjodorova, N.; Novich, M.; Vrachko, M.; Smirnov, V.; Kharchevnikova, N.; Zholdakova, Z.; Novikov, S.; Skvortsova, N.; Filimonov, D.; Poroikov, V.; et al. Directions in QSAR modeling for regulatory uses in OECD member countries, EU and in Russia. J. Environ. Sci. Heal. C 2008, 26, 201–236. [Google Scholar] [CrossRef]
  47. Liu, H.; Papa, E.; Gramatica, P. QSAR prediction of estrogen activity for a large set of diverse chemicals under the guidance of OECD principles. Chem. Res. Toxicol. 2006, 19, 1540–1548. [Google Scholar] [CrossRef]
  48. Canadian Center for Occupational Health & Safety. What is an LD50 and LC50. Available online: http://www.ccohs.ca/oshanswers/chemicals/LD50.html#_1_6 (accessed on 26 July 2012).
  49. Barratt, M.D. Integrating computer prediction systems with in vitro methods towards a better understanding of toxicology. Toxicol. Lett. 1998, 102–103, 617–621. [Google Scholar] [CrossRef]
  50. National Research Council (U.S.), Committee on Toxicity Testing and Assessment of Environmental Agents. In Toxicity Testing in the 21st Century: A Vision and a Strategy; National Academies Press: Washington, DC, USA, 2007; pp. xvii, 196.
  51. Guidance Document on the Validation and International Acceptance of New or Updated Test Methods for Hazard Assessment, Series on Testing and Assessment; OECD: Paris, France, 2005; p. 96.
  52. National Research Council (U.S.), Committee on Applications of Toxicogenomic Technologies to Predictive Toxicology. In Applications of Toxicogenomic Technologies to Predictive Toxicology and Risk Assessment; National Academies Press: Washington, DC, USA, 2007; pp. xxii, 275.
  53. Schrage, A.; Hempel, K.; Schulz, M.; Kolle, S.N.; van Ravenzwaay, B.; Landsiedel, R. Refinement and reduction of acute oral toxicity testing: A critical review of the use of cytotoxicity data. Atla.-Altern. Lab. Anim. 2011, 39, 273–295. [Google Scholar]
  54. Worth, A.P.; Bassan, A.; De Bruijn, J.; Gallegos Saliner, A.; Netzeva, T.; Pavan, M.; Patlewicz, G.; Tsakovska, I.; Eisenreich, S. The role of the European Chemicals Bureau in promoting the regulatory use of (Q)SAR methods. SAR QSAR Environ. Res. 2007, 18, 111–125. [Google Scholar]
  55. Organisation for Economic Co-operation and Development (OECD), Report on the Regulatory Uses and Applications in OECD Member Countries of (Quantitative) Structure-Activity Relationship [(Q)SAR] Models in the Assessment of New and Existing Chemicals, Series on Testing and Assessment; OECD: Paris, France, 2006; p. 79.
  56. Moudgal, C.J.; Lipscomb, J.C.; Bruce, R.M. Potential health effects of drinking water disinfection by-products using quantitative structure toxicity relationship. Toxicology 2000, 147, 109–131. [Google Scholar] [CrossRef]
  57. Venkatapathy, R.; Wang, C.Y.; Bruce, R.M.; Moudgal, C. Development of quantitative structure-activity relationship (QSAR) models to predict the carcinogenic potency of chemicals: I. Alternative toxicity measures as an estimator of carcinogenic potency. Toxicol. Appl. Pharmacol. 2009, 234, 209–221. [Google Scholar] [CrossRef]
  58. Romesburg, H.C. Cluster Analysis for Researchers; LULU Press: North Carolina, NC, USA, 1984. [Google Scholar]
  59. Contrera, J.F.; Matthews, E.J.; Daniel Benz, R. Predicting the carcinogenic potential of pharmaceuticals in rodents using molecular structural similarity and E-state indices. Regul. Toxicol. Pharmacol. 2003, 38, 243–259. [Google Scholar] [CrossRef]
  60. Netzeva, T.; Worth, A.P.; Aldenberg, T.; Benigni, R.; Cronin, M.T.; Gramatica, P.; Jaworska, J.; Kahn, S.; Klopman, G.; Marchant, C.A.; et al. Current status of methods for defining the applicability domain of (quantitative) structure-activity relationships. The report and recommendations of ECVAM Workshop 52. Altern. Lab. Anim. 2005, 33, 1–19. [Google Scholar]
  61. Schultz, T.W.; Hewitt, M.; Netzeva, T.I.; Cronin, M.T.D. Assessing Applicability Domains of Toxicological QSARs: Definition, Confidence in Predicted Values, and the Role of Mechanisms of Action. QSAR Comb. Sci. 2007, 26, 238–254. [Google Scholar] [CrossRef]
  62. Tetko, I.V.; Sushko, I.; Pandey, A.K.; Zhu, H.; Tropsha, A.; Papa, E.; Oberg, T.; Todeschini, R.; Fourches, D.; Varnek, A. Critical Assessment of QSAR Models of Environmental Toxicity against Tetrahymenapyriformis: Focusing on Applicability Domain and Overfitting by Variable Selection. J. Chem. Inf. Model. 2008, 48, 1733–1746. [Google Scholar] [CrossRef] [Green Version]
  63. Roy, P.P.; Kovarich, S.; Gramatica, P. QSAR Model Reproducibility and Applicability: A Case Study of Rate Constants of Hydroxyl Radical Reaction Models Applied to PolybrominatedDiphenyl Ethers and (Benzo-)Triazoles. J. Comput. Chem. 2011, 32, 2386–2396. [Google Scholar] [CrossRef]
  64. Pohl, H.R.; Chou, C.H.; Ruiz, P.; Holler, J.S. Chemical risk assessment and uncertainty associated with extrapolation across exposure duration. Regul.Toxicol. Pharmacol. 2010, 57, 18–23. [Google Scholar] [CrossRef]
  • Sample Availability: Not available.

