Article

Study of the Volatile Constituents in Radix Flemingiae Macrophyllae and a Substitute by Gas Chromatography-Mass Spectrometry and Chemometric Methods

School of Chemical and Material Engineering, Quzhou College, Quzhou 324000, China
*
Authors to whom correspondence should be addressed.
Molecules 2012, 17(12), 14111-14125; https://doi.org/10.3390/molecules171214111
Submission received: 8 October 2012 / Revised: 11 November 2012 / Accepted: 14 November 2012 / Published: 28 November 2012
(This article belongs to the Section Natural Products Chemistry)

Abstract

:
A combined approach of subwindow factor analysis and spectral correlative chromatography was used to analyze the volatile components in Radix Flemingiae Macrophyllae and Flemingiae Latifolia Benth, one of its substitutes. After extraction by a water distillation method, the volatile components in Radix Flemingiae Macrophyllae and Flemingiae Latifolia Benth were detected by GC-MS. Then the qualitative and quantitative analysis of the volatile components in Radix Flemingiae Macrophyllae was completed with the help of subwindow factor analysis resolving two-dimensional original data into mass spectra and chromatograms. Sixty five of 82 separated constituents in the total ion chromatogram of the volatile components in Radix Flemingiae Macrophyllae were identified and quantified, accounting for about 88.79% of the total content. Then, spectral correlative chromatography was used to extract correlative constituents in Flemingiae Latifolia Benth. Fifty one correlative components were recognized in essential oil of Flemingiae Latifolia Benth. The result proves the combined approach is powerful in the analysis of complex herbal samples. The developed method can be used to compare the sameness and differences of Radix Flemingiae Macrophyllae and its substitutes and it can also be used for quality control of Radix Flemingiae Macrophyllae.

1. Introduction

Radix Flemingiae Macrophyllae, belongs to the leguminous plant family. As a traditional Chinese medicine (TCM) listed in the Chinese Pharmacopoeia, it has been widely used to cure rheumatism, lumbar muscle strains, myasthenia of limbs, injuries from falls, swelling, sore throats, etc. [1,2,3]. Although Radix Flemingiae Macrophyllae contains tens or even hundreds of compounds, only a limited number of compounds, such as flavonoids and the volatile constituents, might be responsible for the pharmaceutical or toxic effects [4,5,6]. For example, the volatile constituents are known to exhibit pharmacological and biological activity, and are used for the therapy of various liver and gall bladder diseases [7]. In recent years, because Radix Flemingiae Macrophyllae has been widely harvested for a long time, its supplies have become scarce and many fakes or substitutes, such as Radix Flemingiae Latifolia Benth, appeared on the market. To ensure the reliability and repeatability of pharmacological and clinical research and understand their bioactivities and possible side effects of active compounds, it is necessary to study all of the phytochemical constituents of botanical extracts and develop a method for quality control of Radix Flemingiae Macrophyllae.
Analysis of the volatile compounds in Radix Flemingiae Macrophyllae is usually performed with gas chromatography (GC) and gas chromatography–mass spectrometry (GC-MS) [8,9]. Because the composition of Radix Flemingiae Macrophyllae is very complicated and the concentrations of many important volatile components in Radix Flemingiae Macrophyllae are very low, suitable sample-preparation methods are necessary before detection by GC-MS, such as steam distillation [8,9]. However, although sample preparation methods are used for the complicated Radix Flemingiae Macrophyllae samples, it is still difficult to achieve a complete separation unless rigorous conditions are imposed on the chromatographic separation process. In these reports, the qualitative and quantitative analysis of the volatile components determined by gas chromatography–mass spectrometry (GC-MS) is based on retention index of gas chromatography and mass spectra. However, it is difficult to assess the purity of chromatographic peaks by general GC and the peaks inspected as one component may be mixtures of several components, so the results obtained by the methods mentioned above would be questionable. Therefore, development of a simple and reliable method for the determination of the volatile constituents in Radix Flemingiae Macrophyllae and its substitutes is necessary. Fortunately, many associated chemometric methods [10,11,12,13,14,15,16] have been developed to provide more information for chemical analysis both in chromatographic separation and in spectral identification, which makes it possible to interpret these complex systems [17,18].
In this work, combined chemometrics methods, subwindow factor analysis (SFA) [14] and spectral correlative chromatography (SCC) [15], are used for analysis of the volatile constituents in Radix Flemingiae Macrophyllae and Radix Flemingiae Latifolia Benth., one of its substitutes. Then, a simple, reliable and reproducible procedure to reveal the sameness and differences between Radix Flemingiae Macrophyllae and its substitutes is developed. After extraction by the water distillation method, the volatile components in Radix Flemingiae Macrophyllae and Radix Flemingiae Latifolia Benth. were detected by GC-MS under appropriate conditions. The qualitative and quantitative analysis of volatile components in Radix Flemingiae Macrophyllae was completed when subwindow factor analysis was used as an auxiliary means. Then, spectral correlative chromatography (SCC) was used to extract the correlative constituent from Radix Flemingiae Latifolia Benth. The obtained results proved the power of the developed approach for the analysis of complex samples.

2. Results and Discussion

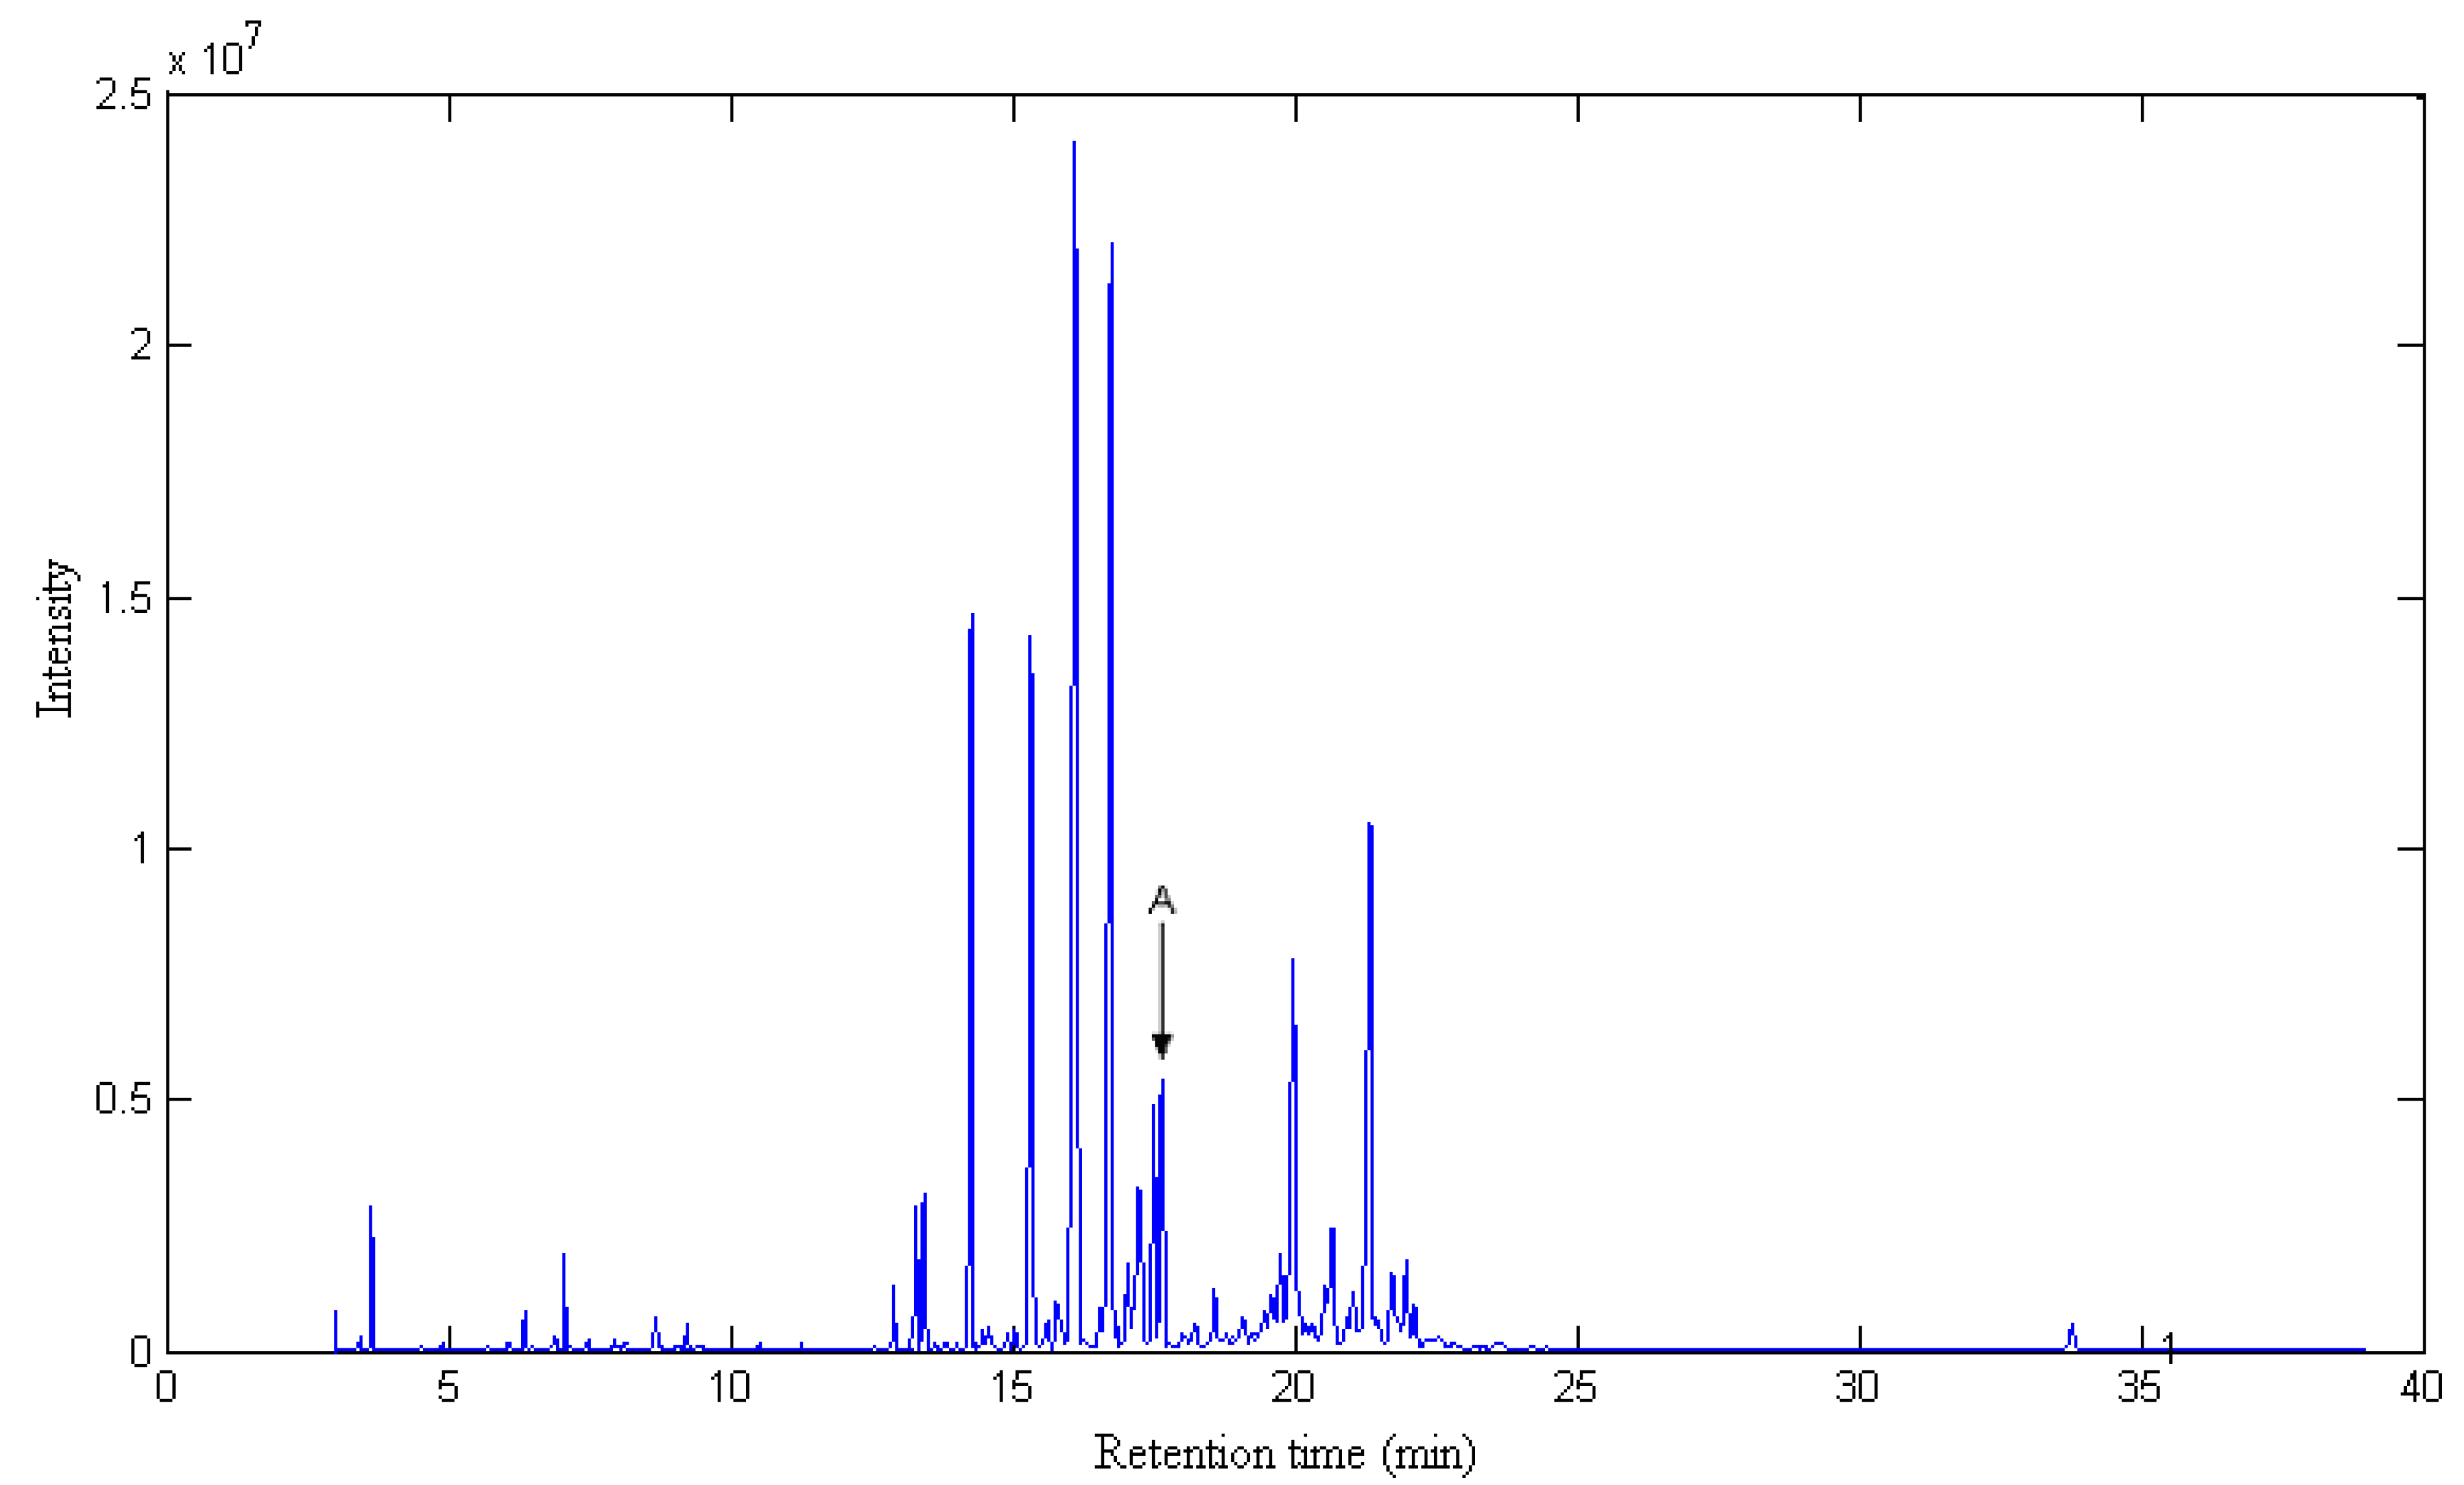
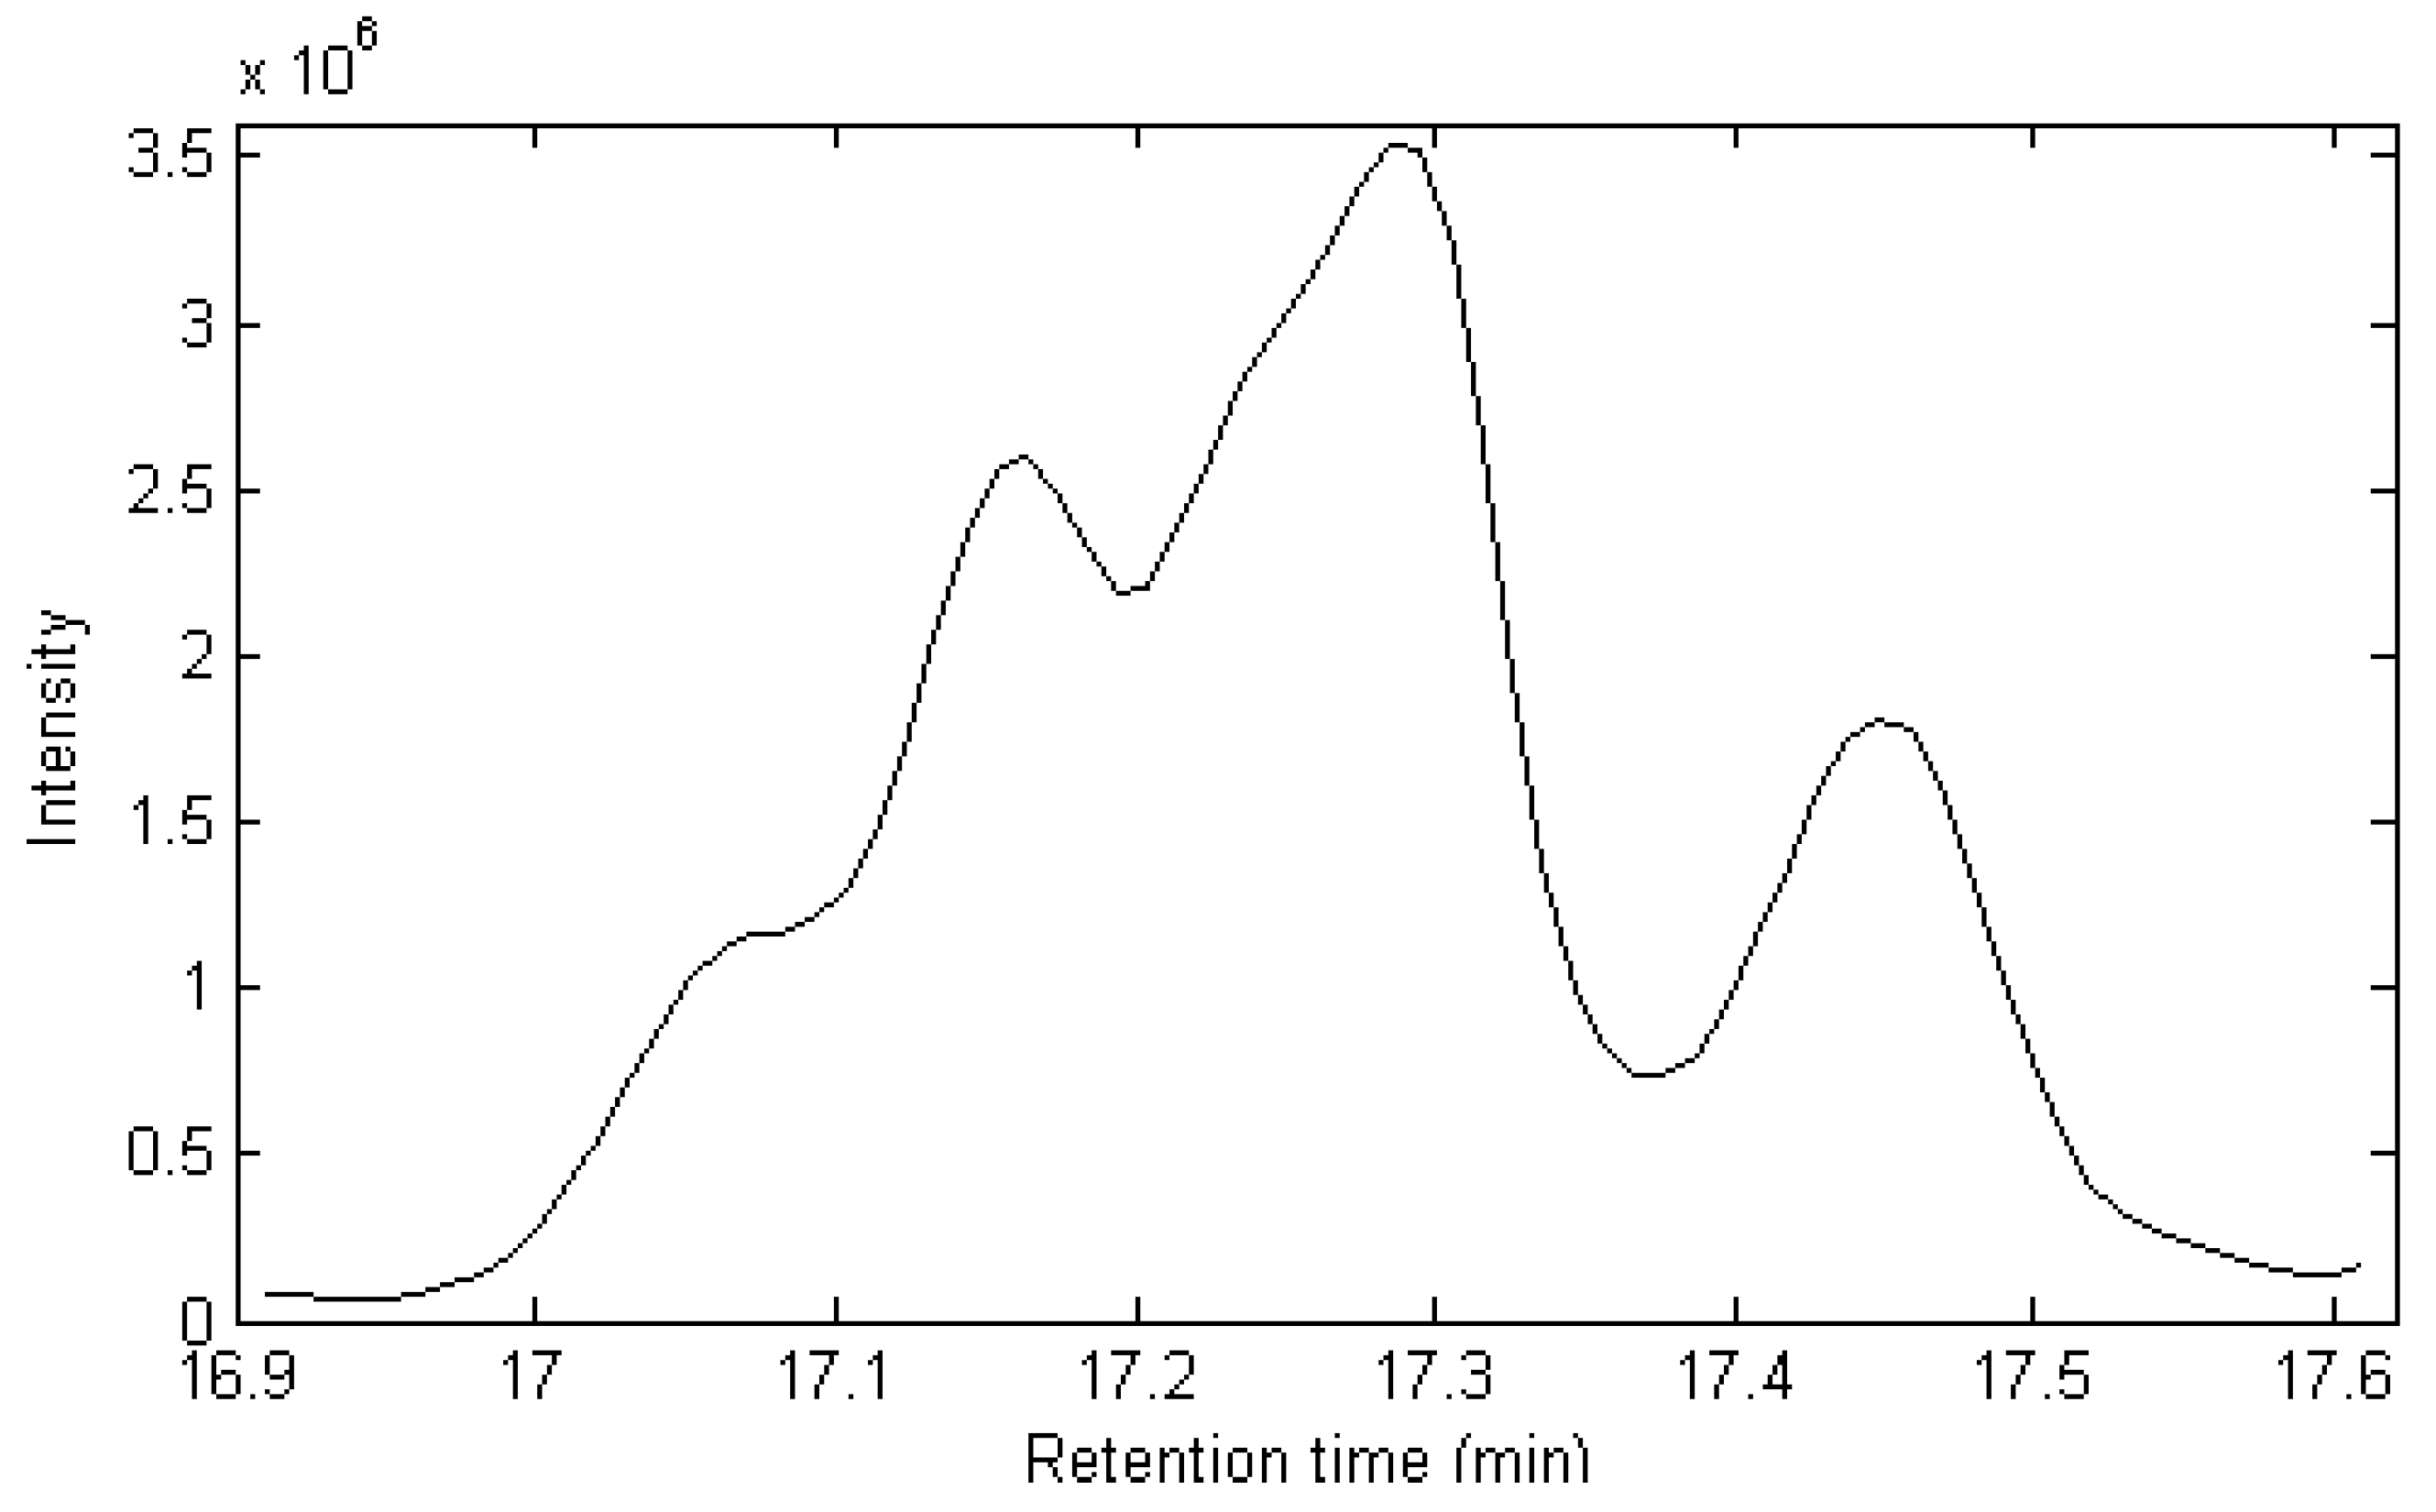
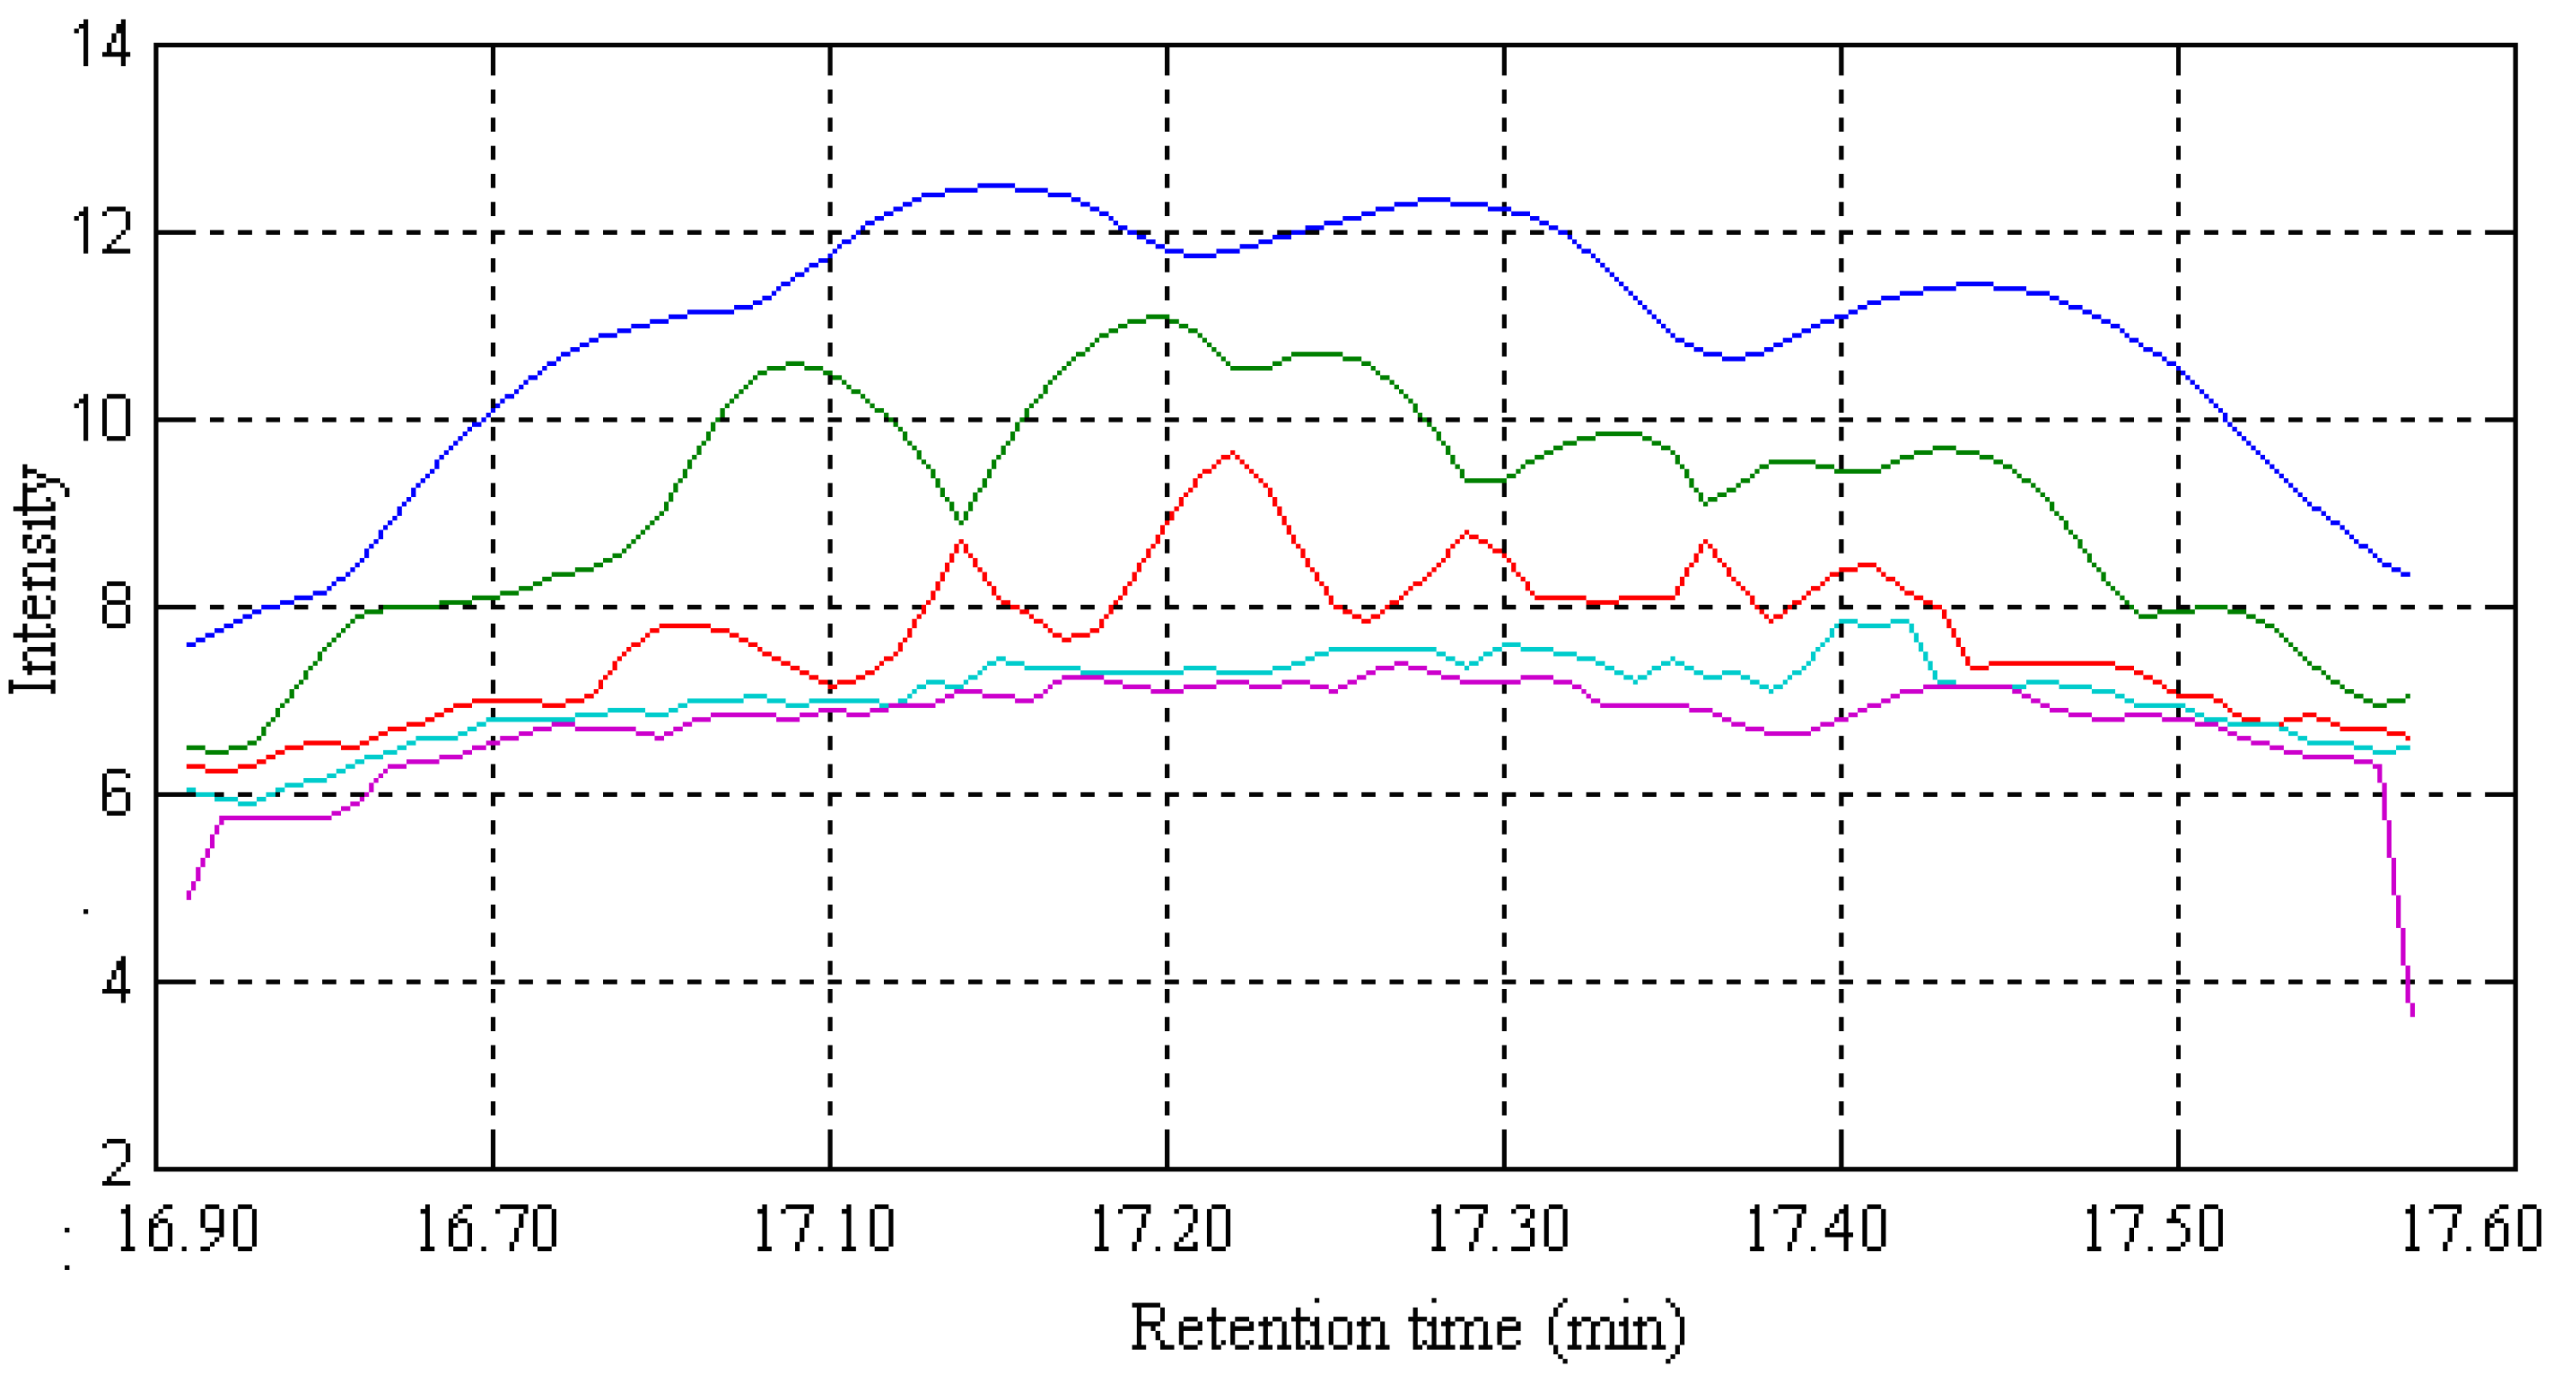
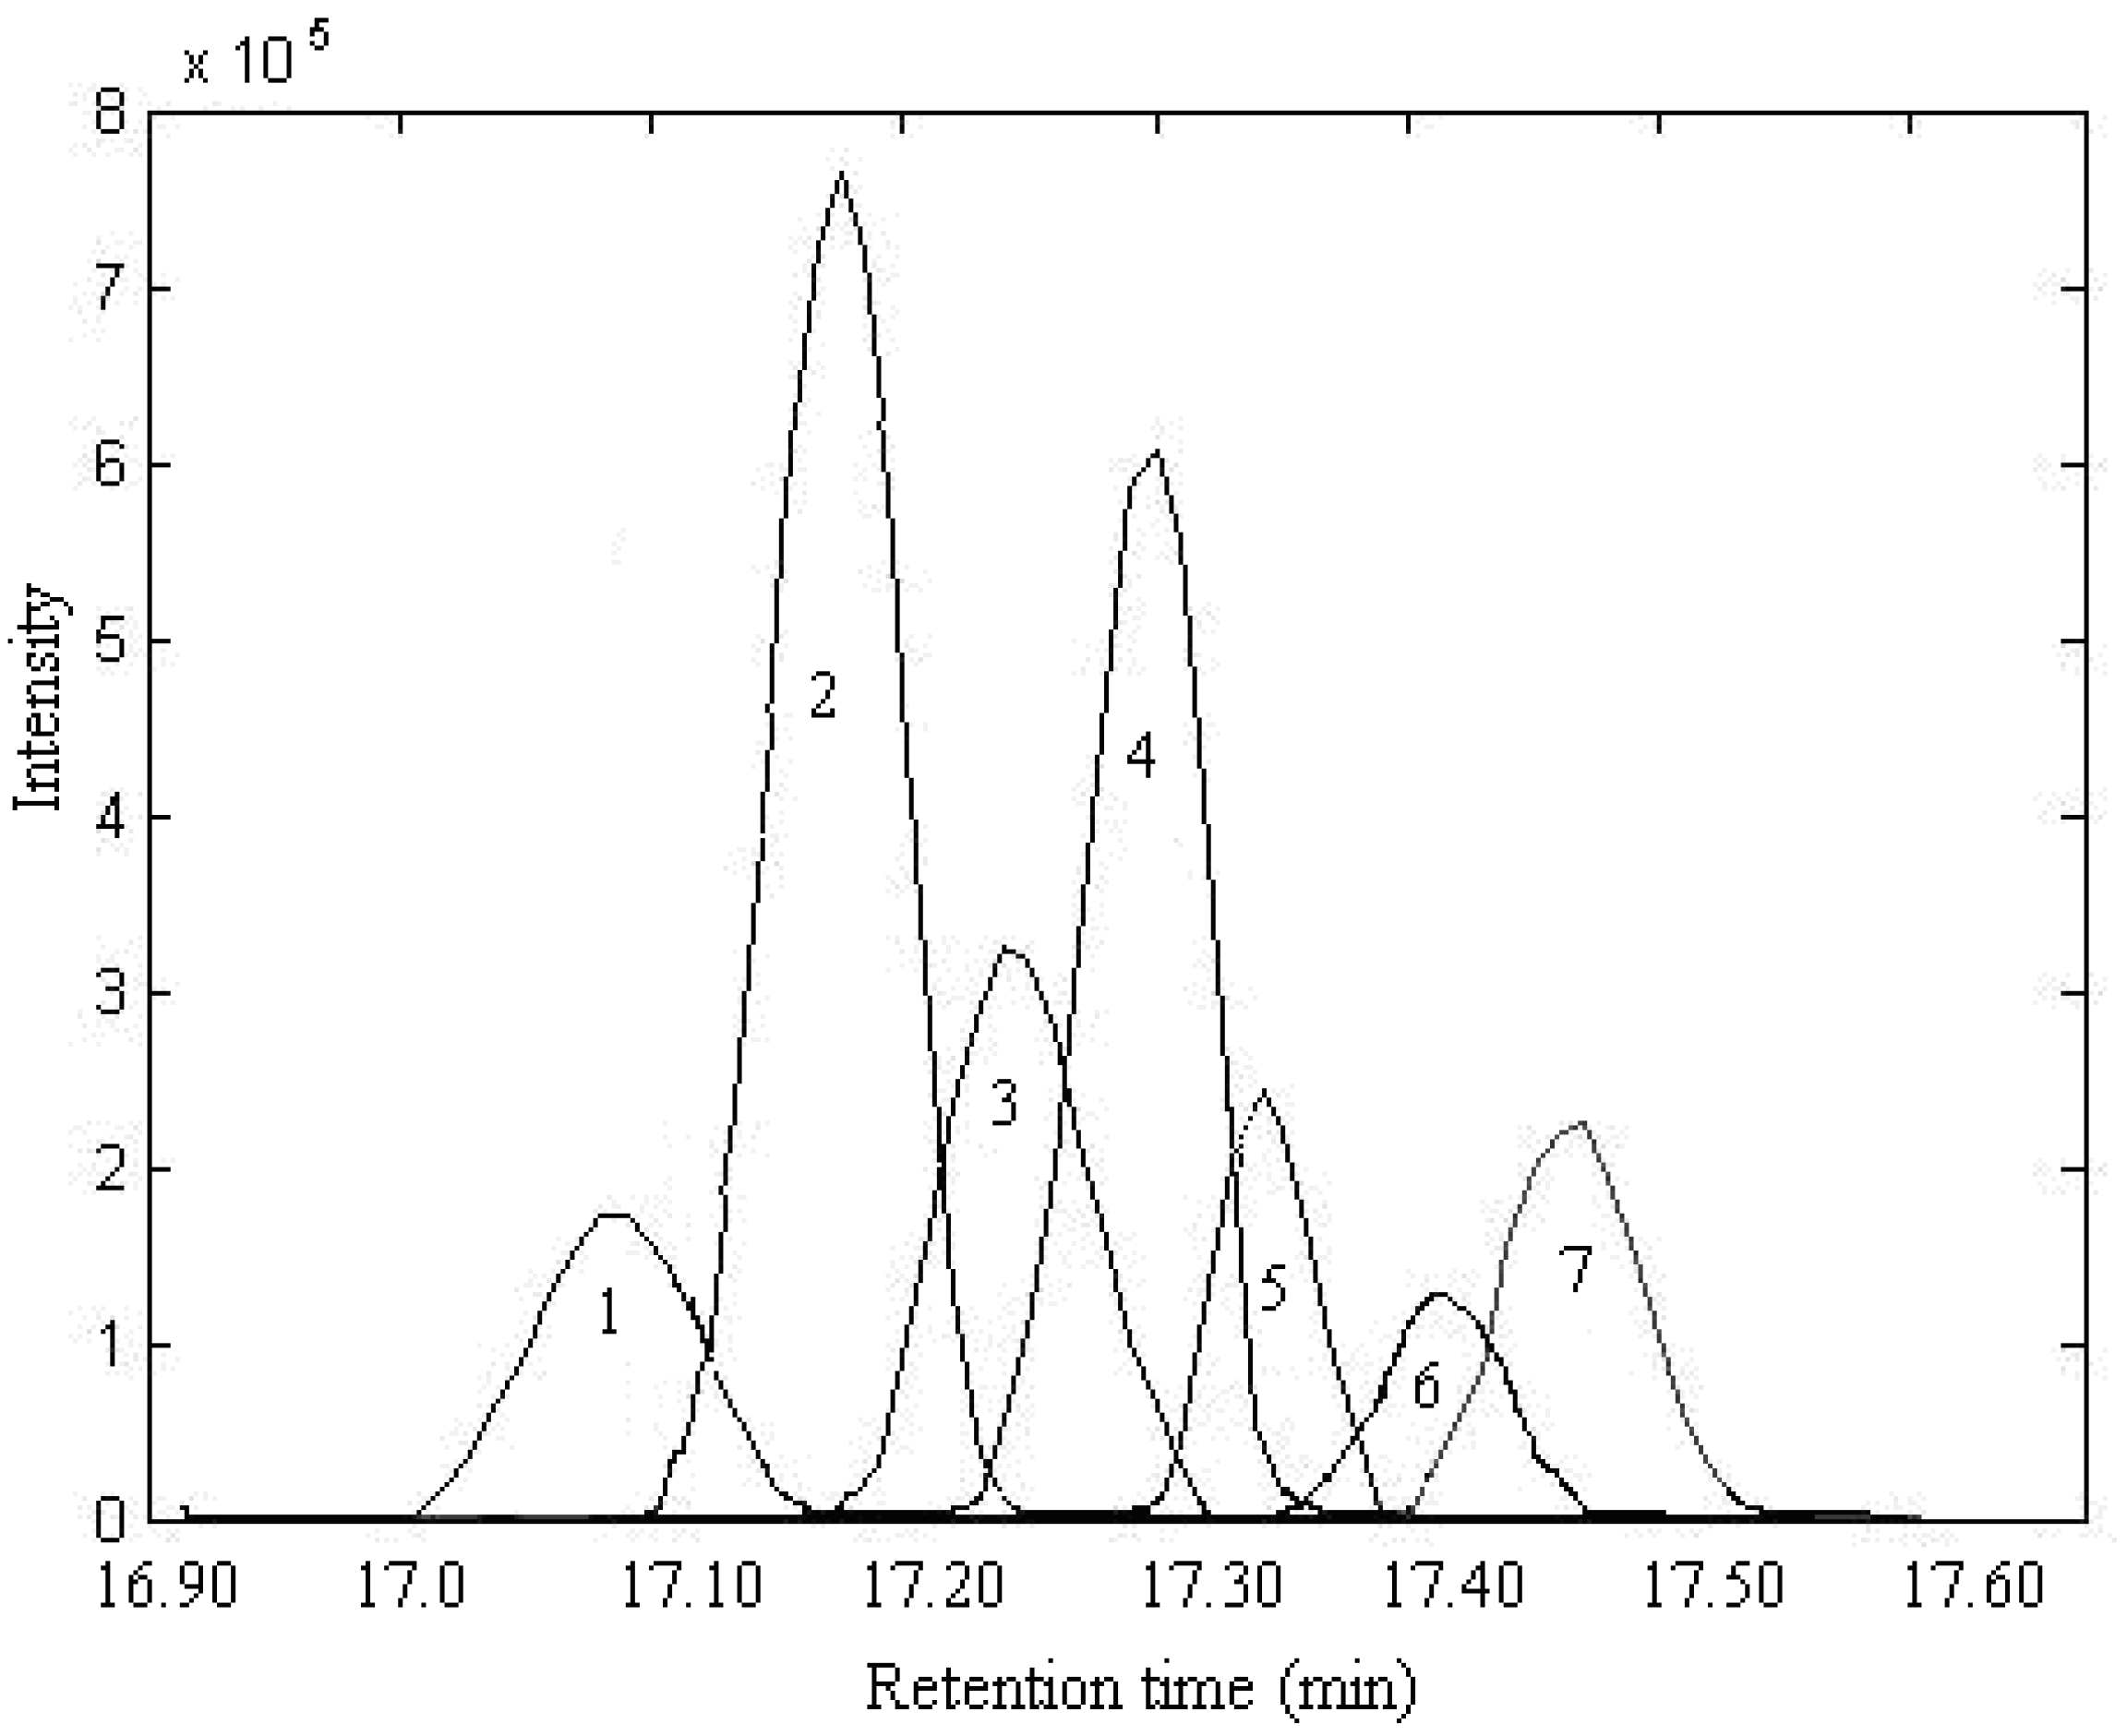
2.1. Resolution of Overlapped Peaks with SFA

The total ion chromatogram (TIC) of the volatile components in Radix Flemingiae Macrophyllae is shown in Figure 1. Apparently, it is indeed a very complicated system, and the majority of the peaks are grouped with retention times within the 12.50–25.00 min. range. If we searched in the NIST mass database directly without further data processing, incorrect results or impossible identification would result obtained. The main reason is that although the chromatographic separation conditions were optimized, some of the eluting components overlap with one another, as indicated by the fact that different mass spectra were obtained at different positions in the peaks when we searched in the NIST database, and the furthermore, the concentrations of many volatile components are very low. In order to obtain reliable qualitative and qualitative results of the volatile components in Radix Flemingiae Macrophyllae, it was necessary for the overlapped peaks and the components with low content to be resolved into pure spectra and chromatograms using combined chemometrics resolution methods. Subwindow factor analysis (SFA) [14], a common used chemometric method for solving these problem, was used for this purpose.
Figure 1. The total ion chromatogram (TIC) of the volatile components in Radix Flemingiae Macrophyllae.
Molecules 17 14111 g001
The TIC of peak cluster A (16.90–17.60 min) in Figure 1 is taken as an example to demonstrate the whole procedure of this approach. Figure 2 shows the total ion chromatogram (TIC) of this peak cluster, which seems to be a three component overlapped peak, but the diverse spectra at different parts of the cluster indicates there are actually more than three components in the cluster. A satisfactory result can’t be obtained by the usual direct search in the mass spectrum library. Of course, the quantitative analysis of this cluster can’t be completed because the area of each component can’t be determined. Thus, sub-window factor analysis is used to extract the pure spectra and pure chromatogram.
Figure 2. The total ion Chromatogram(TIC) of the peak cluster A.
Molecules 17 14111 g002
After background and baseline shift in the raw dimensional data are preprocessed by the appropriate method [13], the elution sequences of individual components (rank map of peak A) can be estimated by FSMWEFA [16], which is shown in Figure 3. It can be seen there are seven components in this peak cluster according to the rank estimation method, which are marked as components 1–7 according to elution sequence. By analyzing the correlation of two subwindows, the pure spectrum of each component can be extracted by SFA directly without previous resolution of their concentration profiles. The resolved mass spectrum of component 1 is shown in Figure 4.
Figure 3. The evolving eigenvalues of peak A obtained using FSMWEFA with a window size of 5.
Molecules 17 14111 g003
Figure 4. Resolved mass spectrum of component 1 by SFA and standard mass spectrum of β-guaiene.
Molecules 17 14111 g004
In the same way, the spectra of the other components were obtained, and the corresponding resolved mass spectra of each component are shown in Figure 5, Figure 6, Figure 7, Figure 8. After all the pure spectra were obtained, the concentration profiles could be achieved by using the prior information of the spectra and the linear regression C = XS (STS)−1, as shown in Figure 9.
Figure 5. Resolved mass spectrum of component 2 by SFA and standard mass spectrum of dihydroactinidiolide.
Molecules 17 14111 g005
Figure 6. Resolved mass spectrum of component 4 by SFA and standard mass spectrum of δ-cadinene.
Molecules 17 14111 g006
Figure 7. Resolved mass spectrum of component 5 by SFA and standard mass spectrum of β-cadinece.
Molecules 17 14111 g007
Figure 8. Resolved mass spectrum of component 7 by SFA and standard mass spectrum of valencene.
Molecules 17 14111 g008
Figure 9. Resolved chromatographic profiles of peak cluster A.
Molecules 17 14111 g009
Finally, when each pure spectrum was extracted and the resolved chromatographic profiles of these seven components were obtained, their identification can be done by similarity searches in the NIST mass spectral database. Components 1, 2, 4, 5, and 7 in this cluster may be β-guaiene, dihydroactinidiolide, δ-cadinene, β-cadinece and valencene, based on their similarity matching results of 0.93, 0.99, 0.97, 0.93, and 0.95, respectively. The accuracy and reliability of the results were thus increased greatly. The corresponding standard spectra of each component in cluster A are shown in Figure 4, Figure 5, Figure 6, Figure 7, Figure 8. Components 3 and 6 were not identified due to their very low match values. Likewise, the spectra of components in other segments can be obtained. The qualitative results are listed in Table 1. Eighty two constituents were resolved, and among them 65 components were identified. Unfortunately, 27 components remain unidentified, either because of the low signal-to-noise ratio or the absence of the compound from the mass spectral database, and some of the component identifications should be viewed as tentative.
Table 1. Identification and quantification of compounds in the essential oil from Flemingiae Macrophyllae and Radix Flemingiae Latifolia Benth.
Series No.Retention time (min)Compound nameMolecularformulaRelative content (%)
X1 aX2 b
13.439-PrenalC5H8O0.07
23.6533.658HexanalC6H12O0.35
36.3686.3722-AmylfuranC9H14O0.03
47.065-D-LimoneneC9H200.27
57.9797.984LinaloolC10H18O0.98
68.6828.691L-CamphorC10H16O1.91
79.104-l-2-BornanolC10H18O0.06
89.2679.275p-Menth-1-en-4-olC10H18O0.66
99.4199.428p-Menth-1-en-8-olC10H18O0.87
1010.52910.536Nonanoic acidC9H18O20.46
1110.671-Perillyl aldehydeC10H14O0.04
1210.91410.925AnetholeC10H12O1.62
1311.06511.081Bornyl acetateC12H20O20.72
1411.29411.308Tricyclo[3.2.1.02,7]oct-3-ene, 2,3,4,5-tetramethyl-C12H 180.57
1511.504-Furan, 2,5-dibutyl-C12H20O0.03
1612.46512.478Decanoic acidC10H20O20.06
1712.72012.731α-CubebeneC15H240.56
1812.85912.875α-LongipineneC15H241.47
1913.32513.331YlangeneC15H241.69
2013.47613.493LongicycleneC15H242.84
2113.771-CopaeneC15H240.64
2214.30514.312LongofoleneC15H243.21
2314.437-Di-epi-α-cedreneC15H260.08
241453014.542β-CaryophylleneC15H240.82
2514.57514.583β-CedreneC15H245.92
2614.74414.762Germacrene DC15H240.65
2715.05715.071(Z)-β-FarneseneC15H240.61
2815.108-Himachala-2,4-dieneC15H240.07
2915.38515.435α-HimachaleneC15H244.13
3015.57215.590α-CaryophylleneC15H240.44
3115.593-AcoradieneC15H240.33
3215.67315.685DihydrocurcumeneC15H240.03
3315.85815.869EremophileneC15H241.30
3416.00616.021(+)-CycloisosativeneC15H240.05
3516.10816.117Humulen-(v1)C15H240.92
3616.21016.215Longifolene-(V4)C15H246.82
3716.32116.327α-GuaieneC15H240.49
3816.419-PatchouleneC15H240.88
3916.72116.730β-HimachaleneC15H245.26
4017.07717.086β-GuaieneC15H240.72
4117.16217.184DihydroactinidiolideC11H16O22.14
4217.27517.292δ-CadineneC15H241.53
4317.32117.334β-CadineceC15H240.56
4417.510-ValenceneC15H240.67
4518.71018.722Caryophyllenyl alcoholC15H26O0.31
4619.07619.085Caryophyllene oxideC15H24O0.85
4719.14219.155DrimenolC15H26O1.27
4819.470-3-Isobutyl-4,5-dimethyl-3H-isobenzofuran-1-oneC14H18O20.06
4919.73219.740CedrolC15H26O0.83
5019.91819.932BulnesolC15H26O4.17
5120.235-Mansonone CC15H26O20.07
5220.34220.360EpiglobulolC15H26O0.78
5320.62120.647CubenolC15H26O1.74
5420.96720.982ι-CadinolC15H26O0.56
5521.15121.165δ-CadinolC15H26O1.82
5621.49421.522TorreyolC15H26O0.38
5721.66221.684β-SelinenolC15H26O7.12
5821.86721.887α-EudesmolC15H26O5.16
5922.06122.077CadaleneC15H182.22
6023.16723.185HedycaryolC15H26O0.51
6123.28623.310PeruviolC15H26O1.26
6226.17226.190Farnesol isomer aC15H26O4.87
6326.36226.384cis-FarnesalC15H24O0.46
6426.471-Tetradecanoic acidC14H28O20.24
6533.57133.590Hexadecanoic acidC16H32O20.58
a Representing the sample from Flemingiae Macrophyllae. b Representing the sample from Flemingiae Latifolia Benth. - Correlative component is not found in X2.

2.2. Quantitative Analysis

After the pure chromatographic profile and mass spectrum of each component were resolved, the total two-way response of each component can be obtained from the outer product of the concentration vector and the spectrum vector for each component, namely CiSiT. Similar to the general chromatographic quantitative method with peak area or height, the concentration of each component is proportional to the overall volume of its two-way response (CiSiT). The final relative quantitative results were also listed in Table 1. The 65 components which have been identified in Radix Flemingiae Macrophyllae accounted for 88.79% of the volatile components.

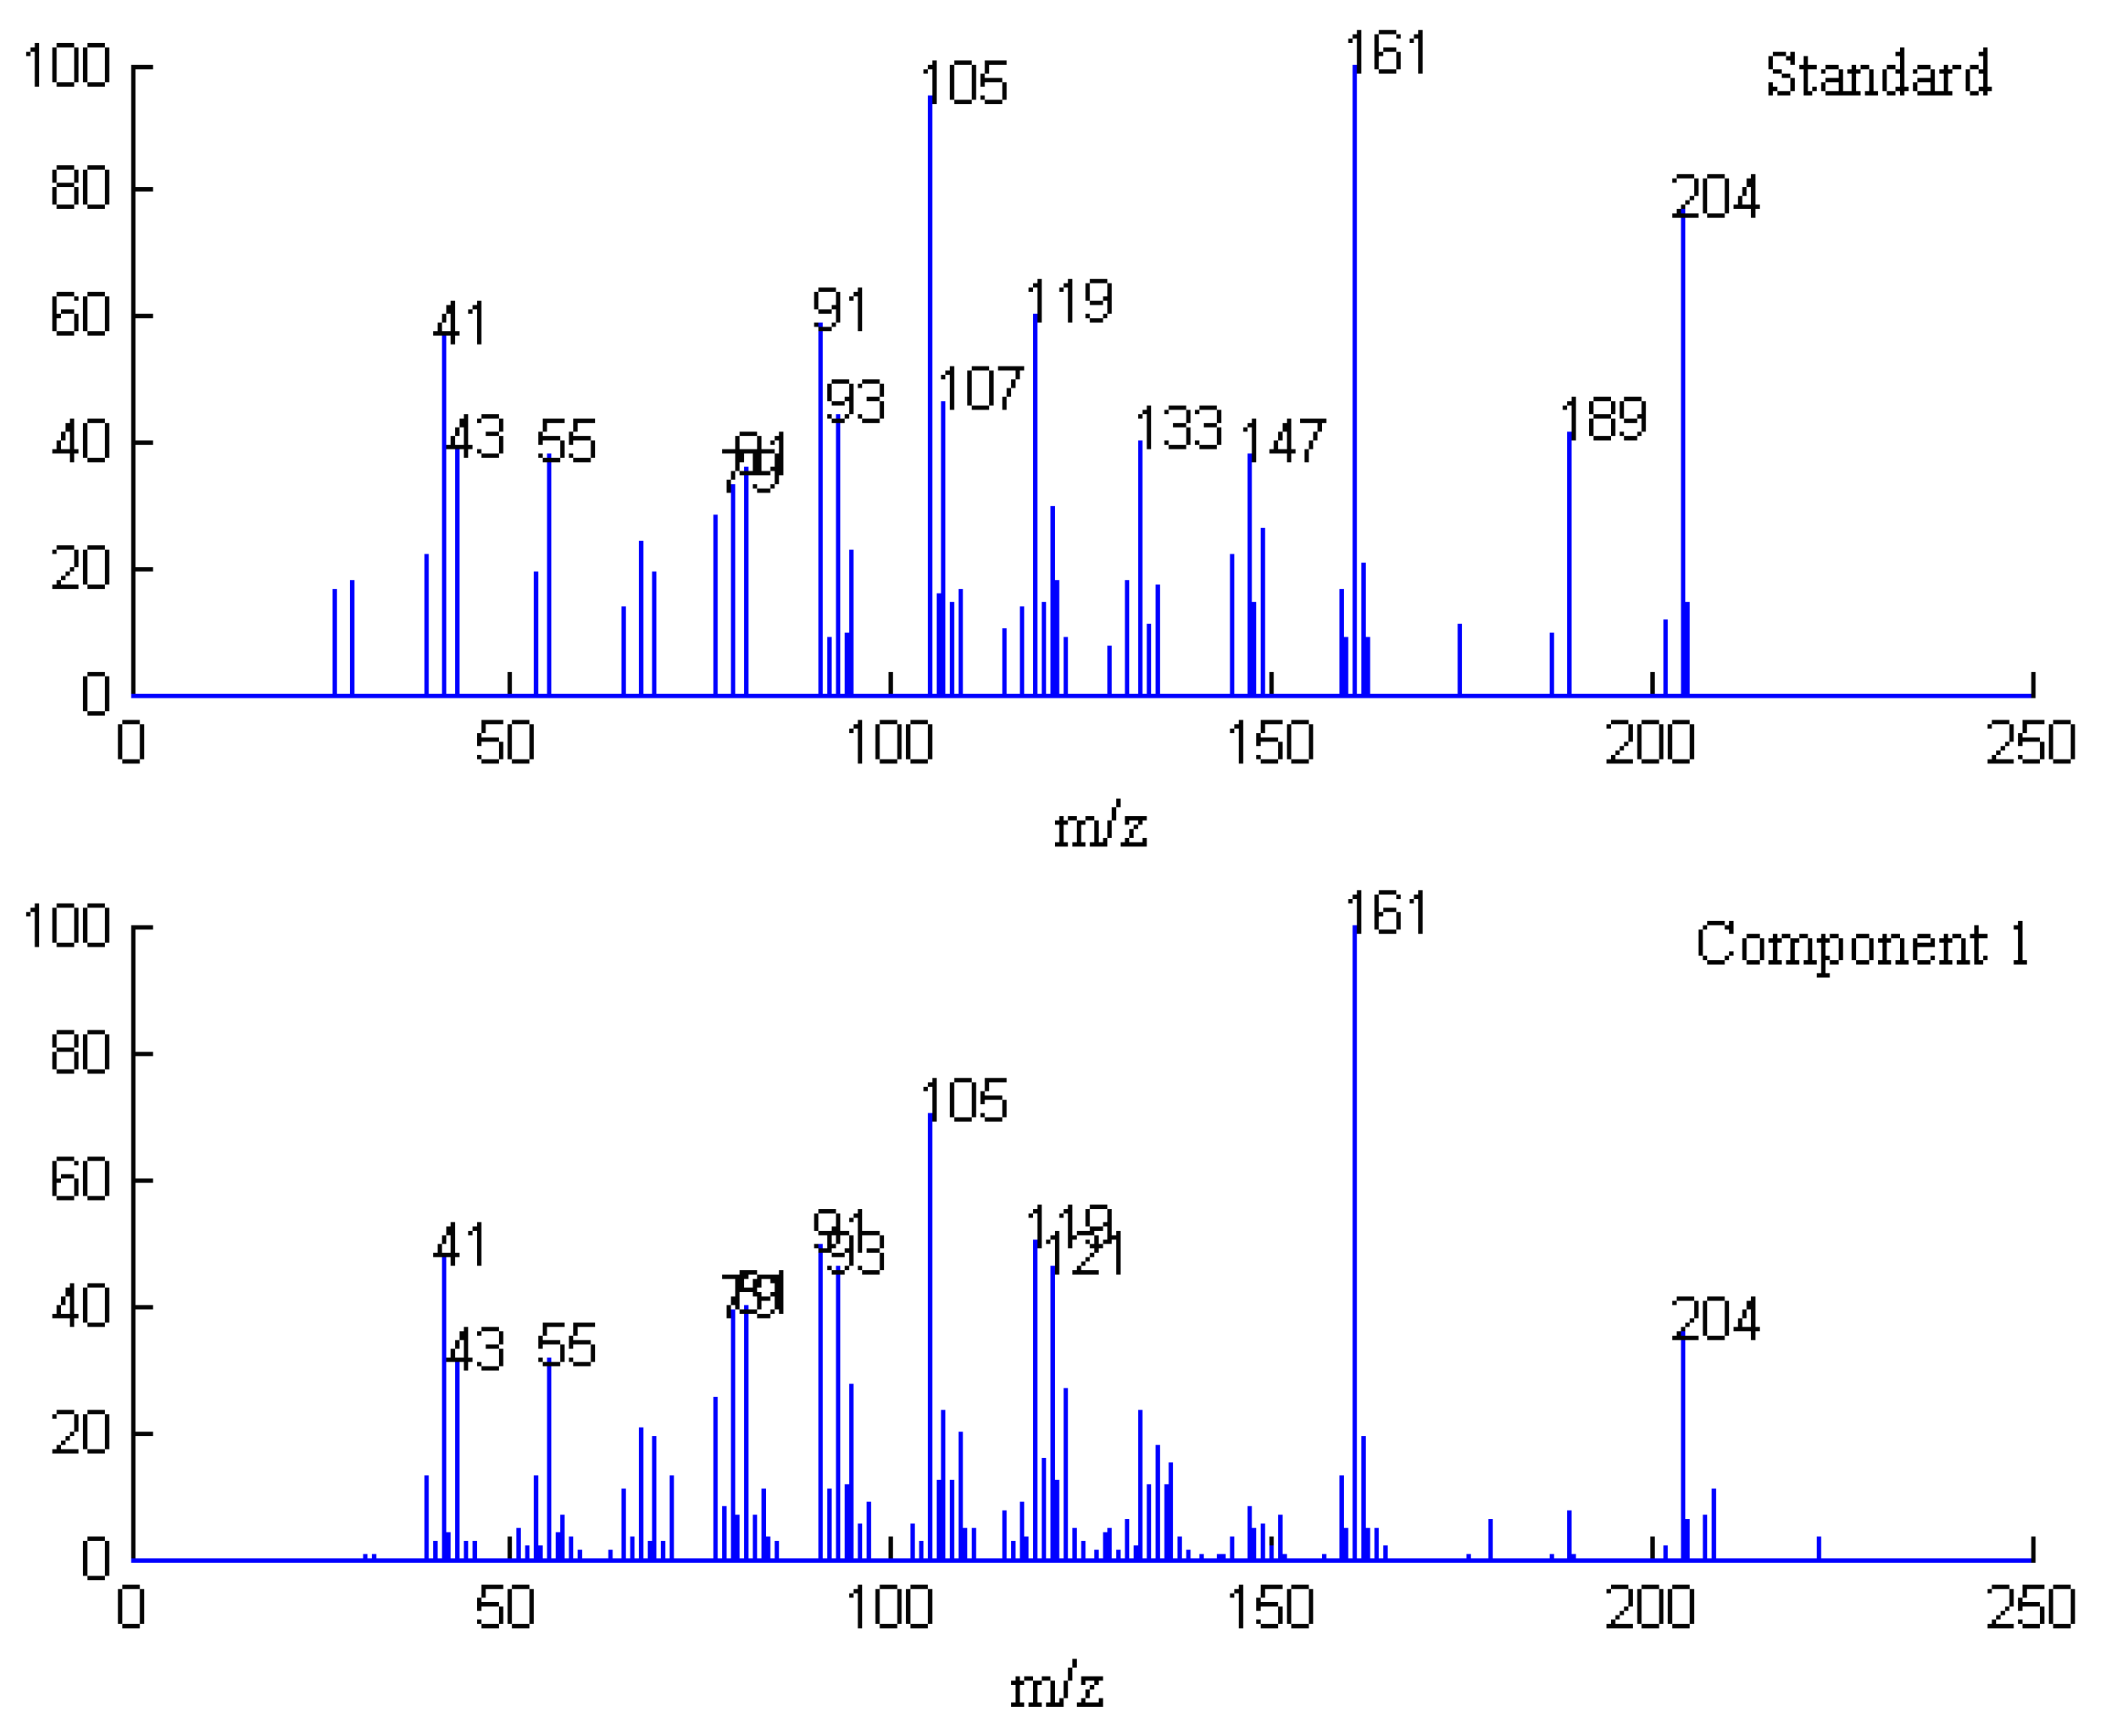
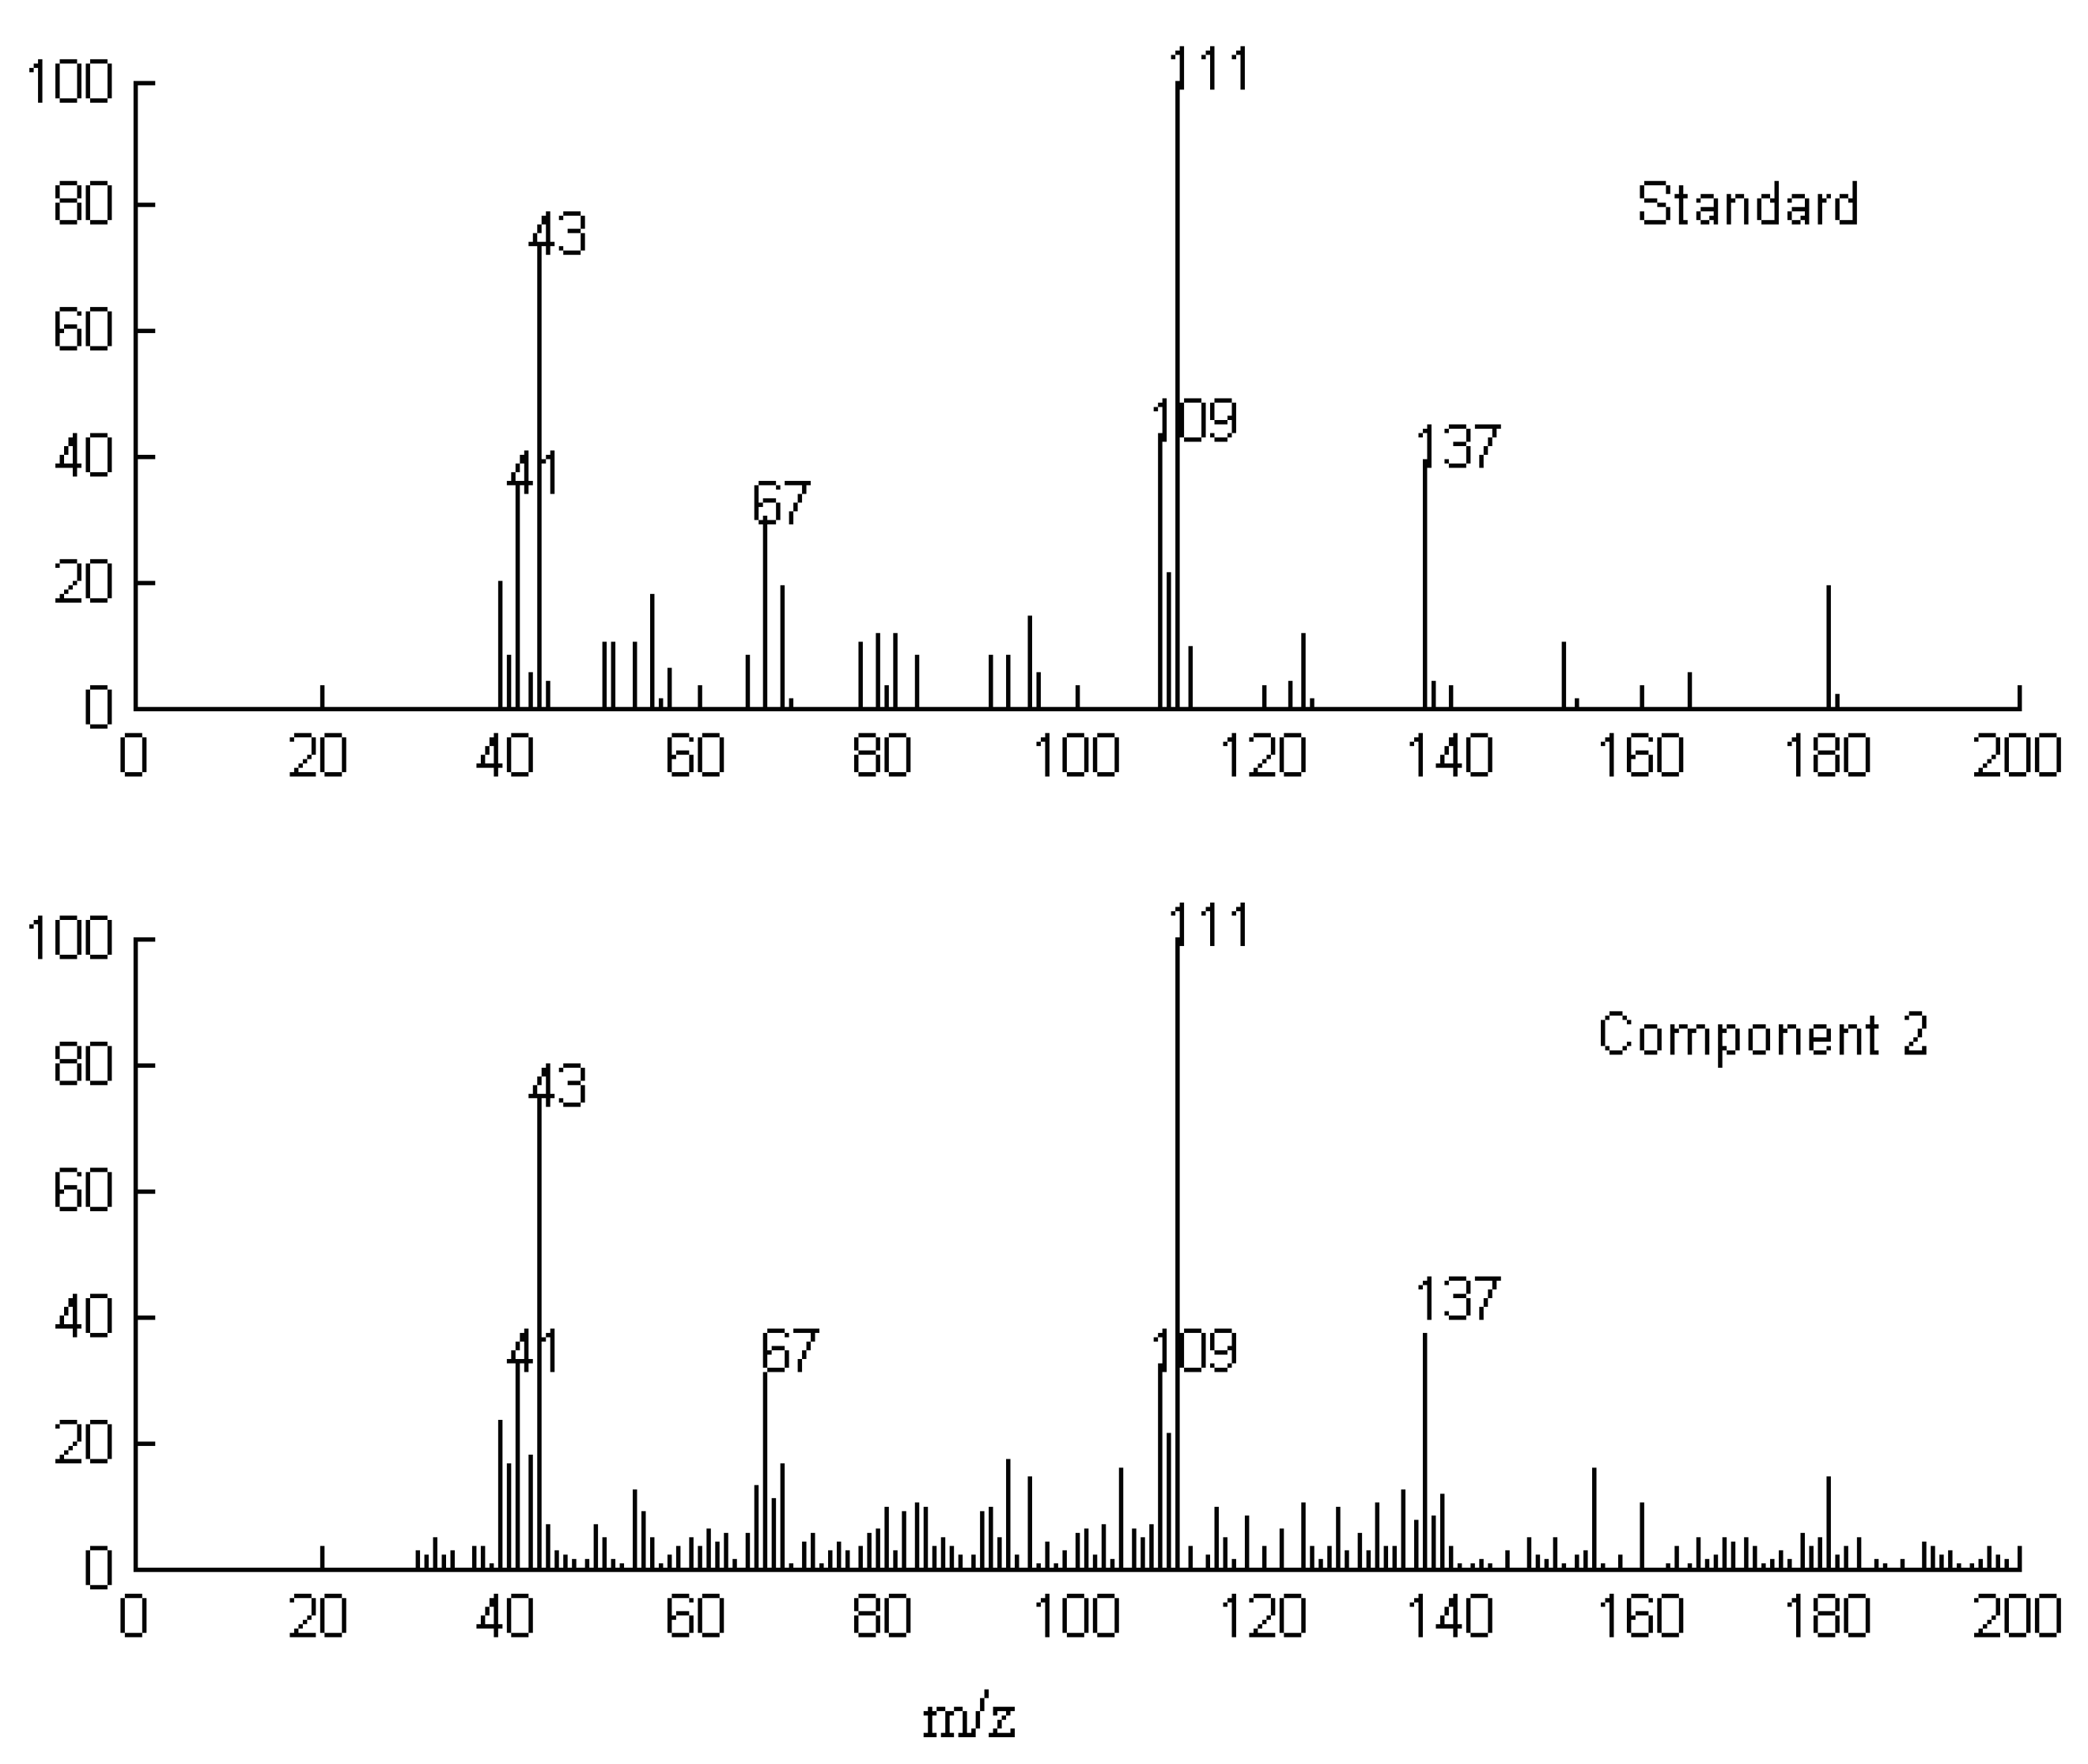
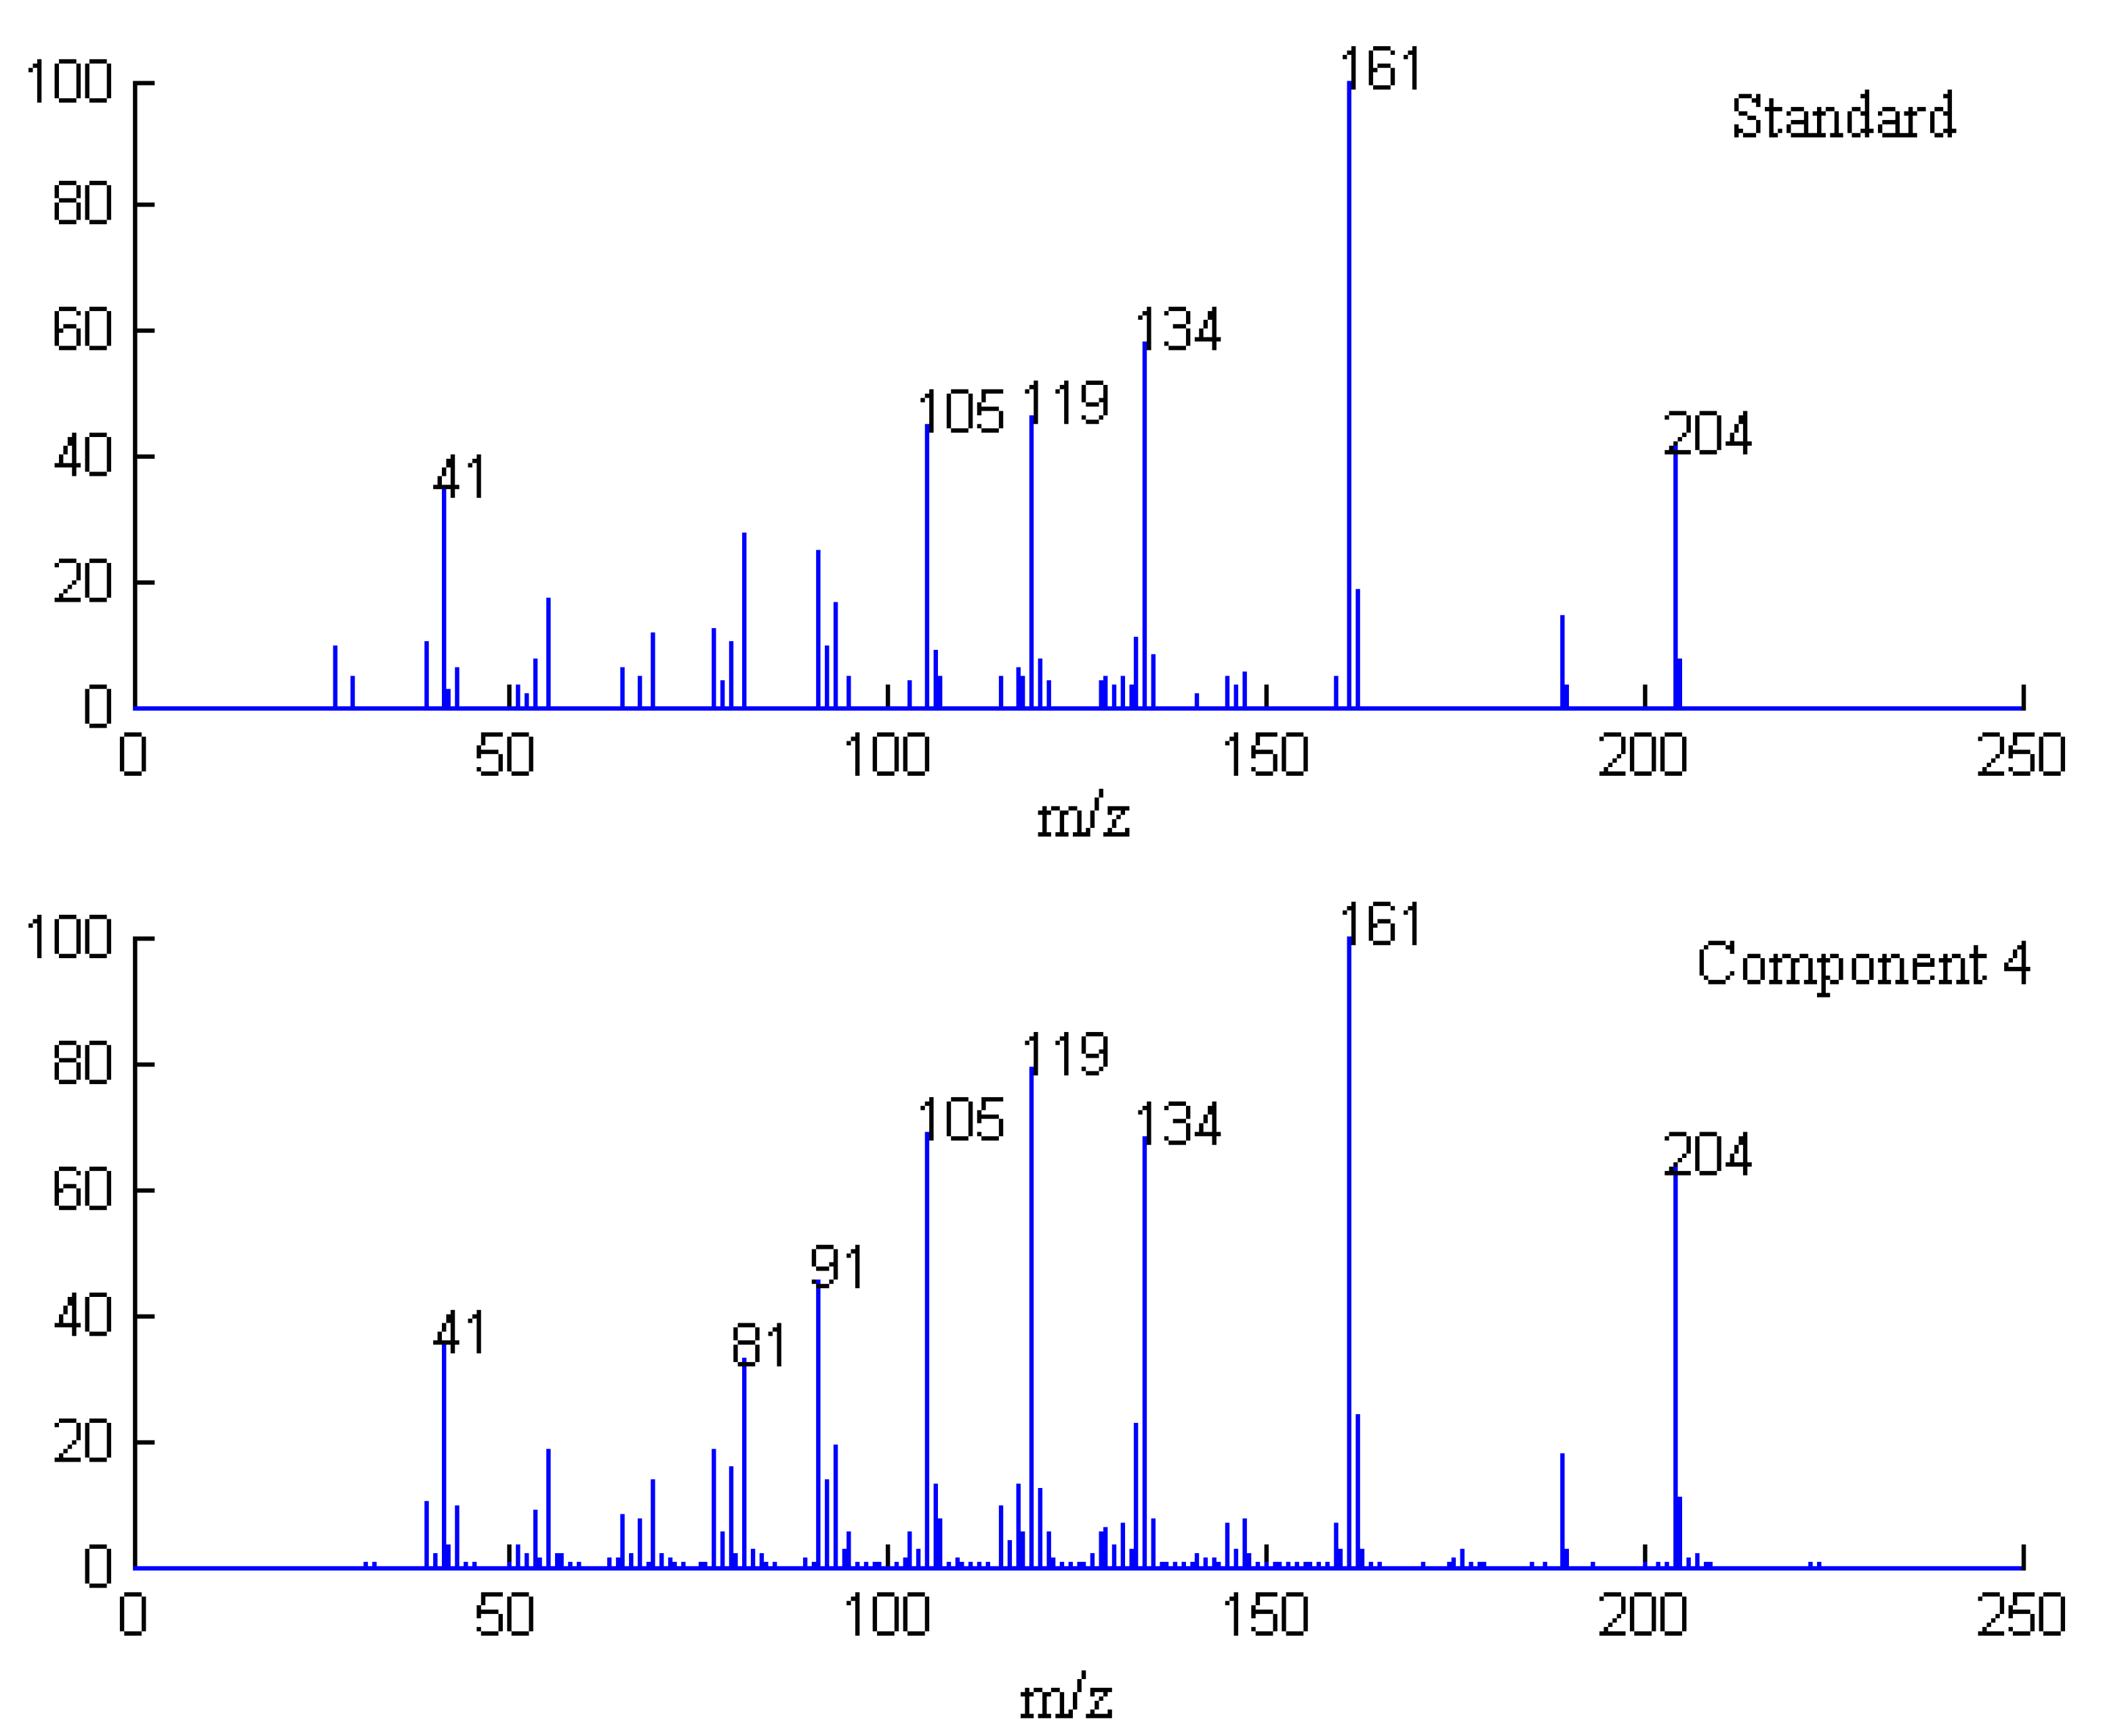
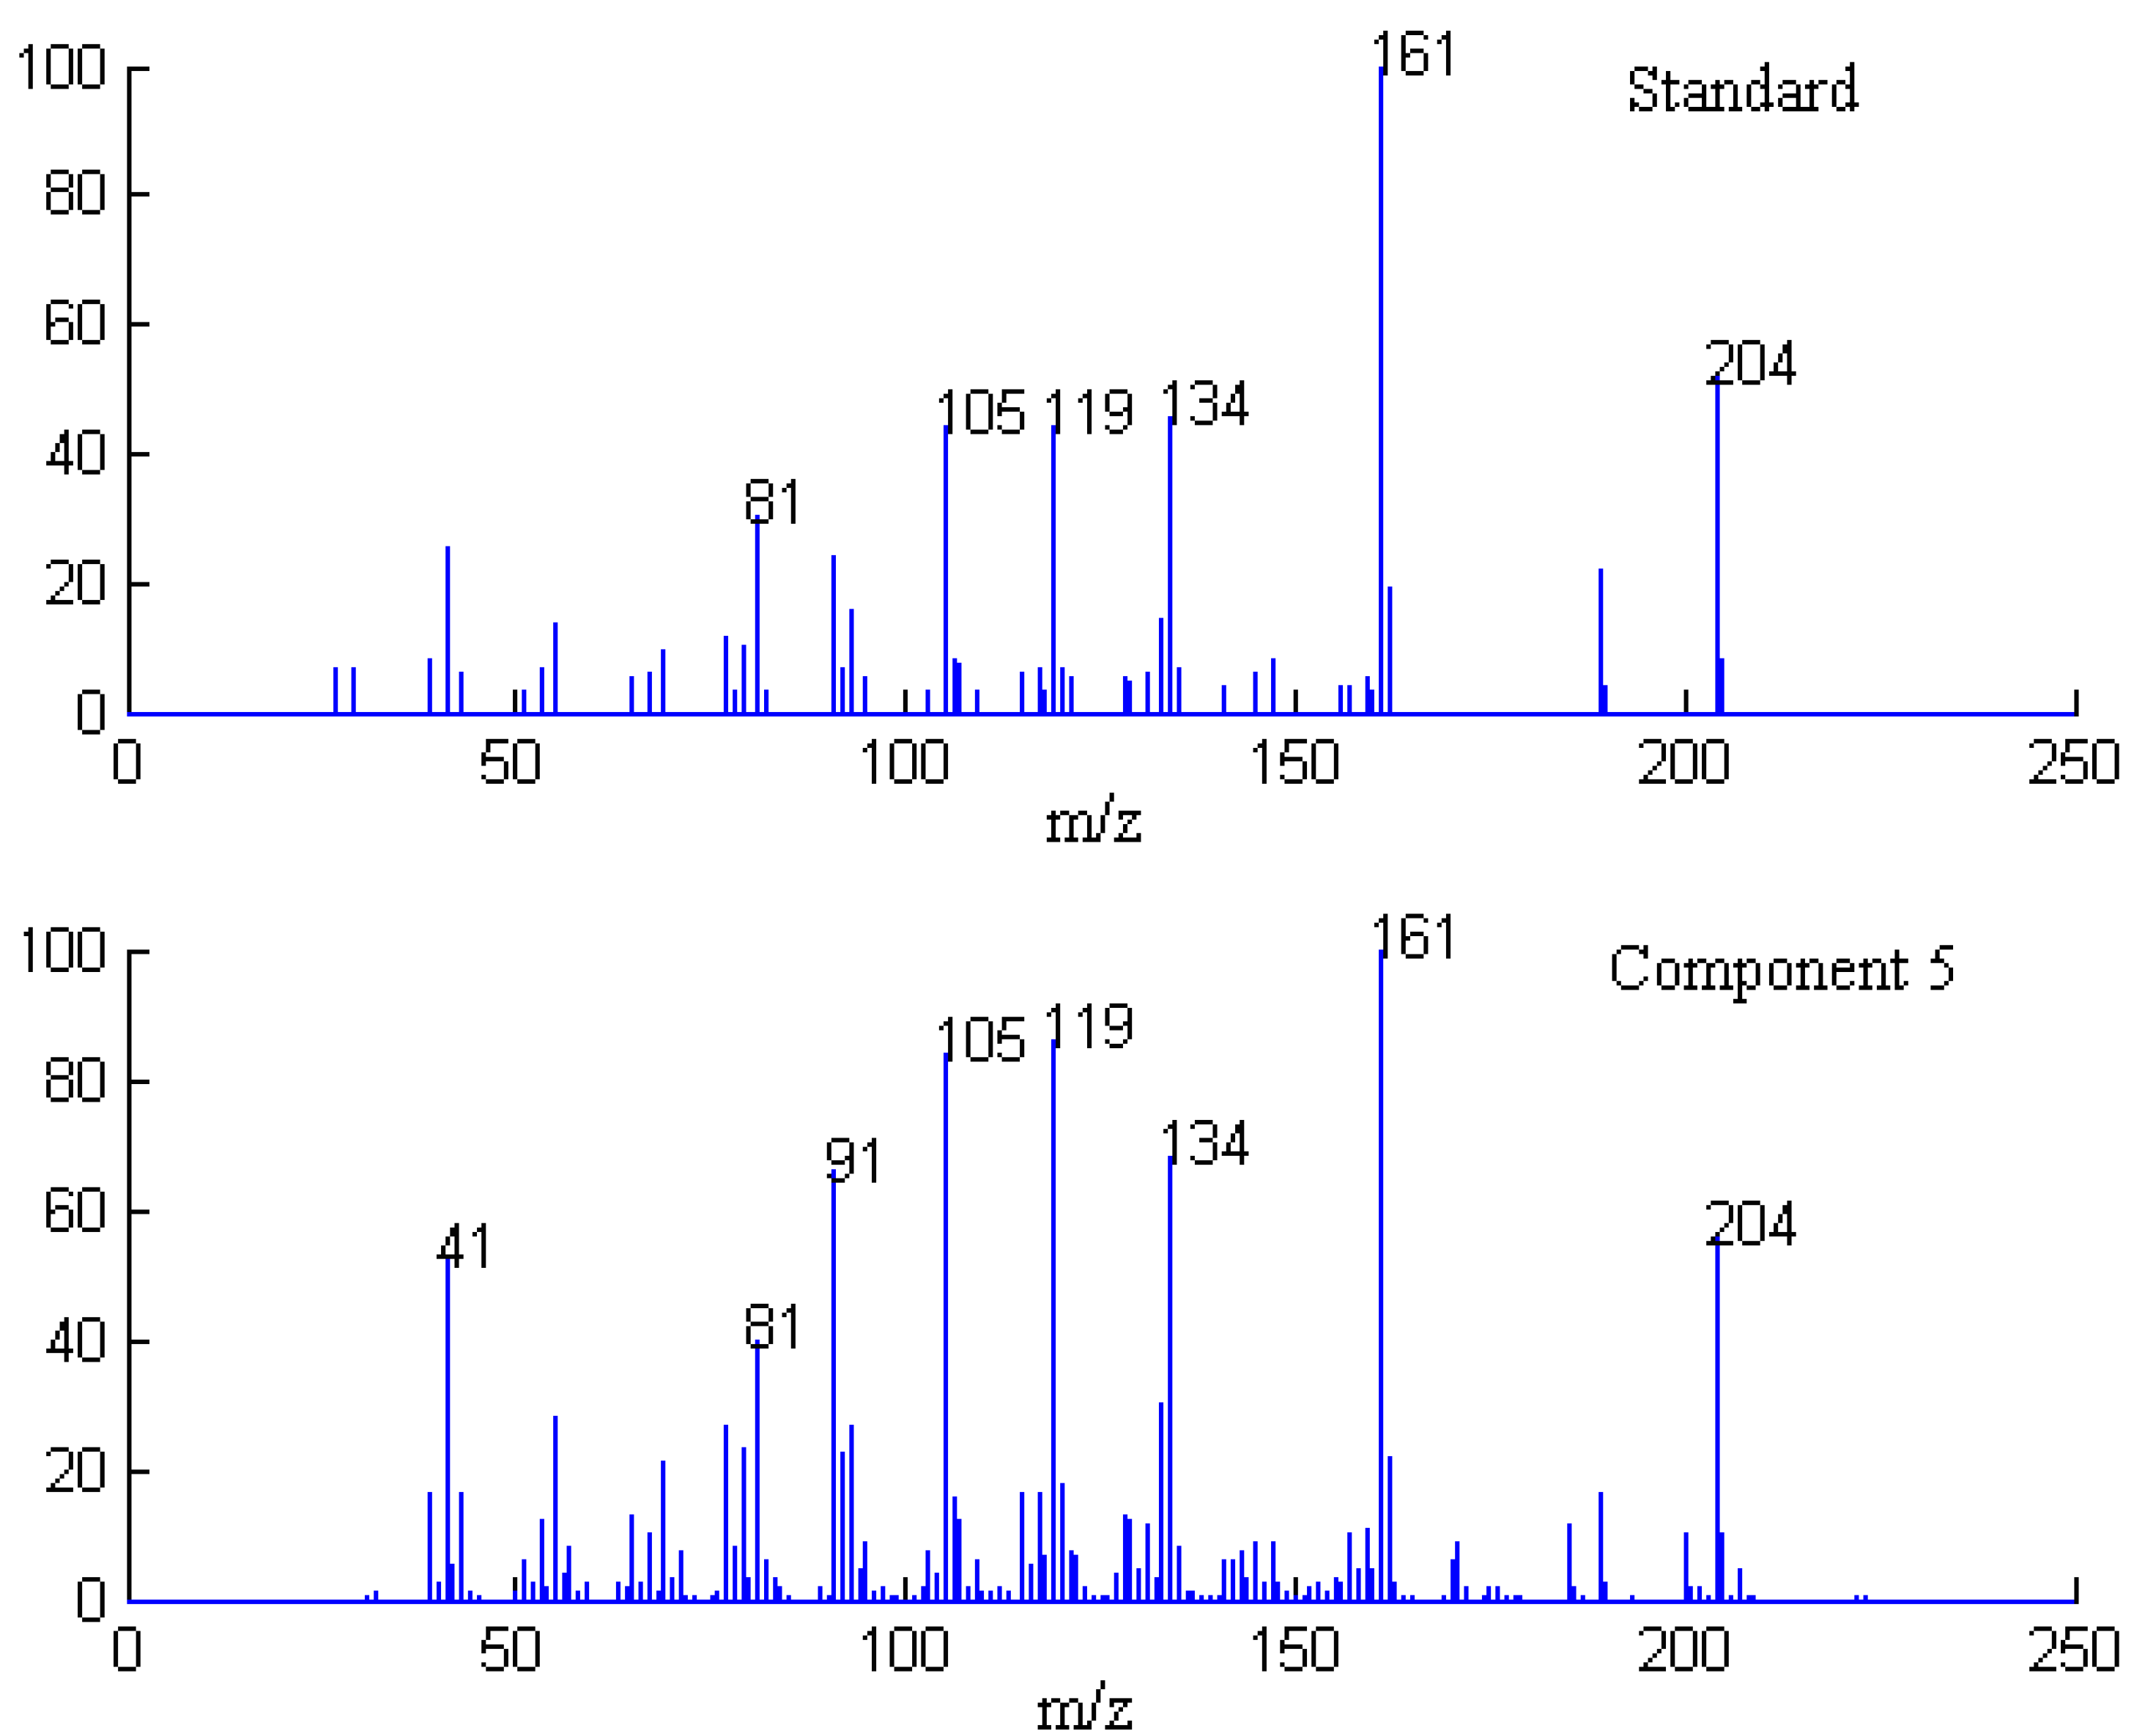
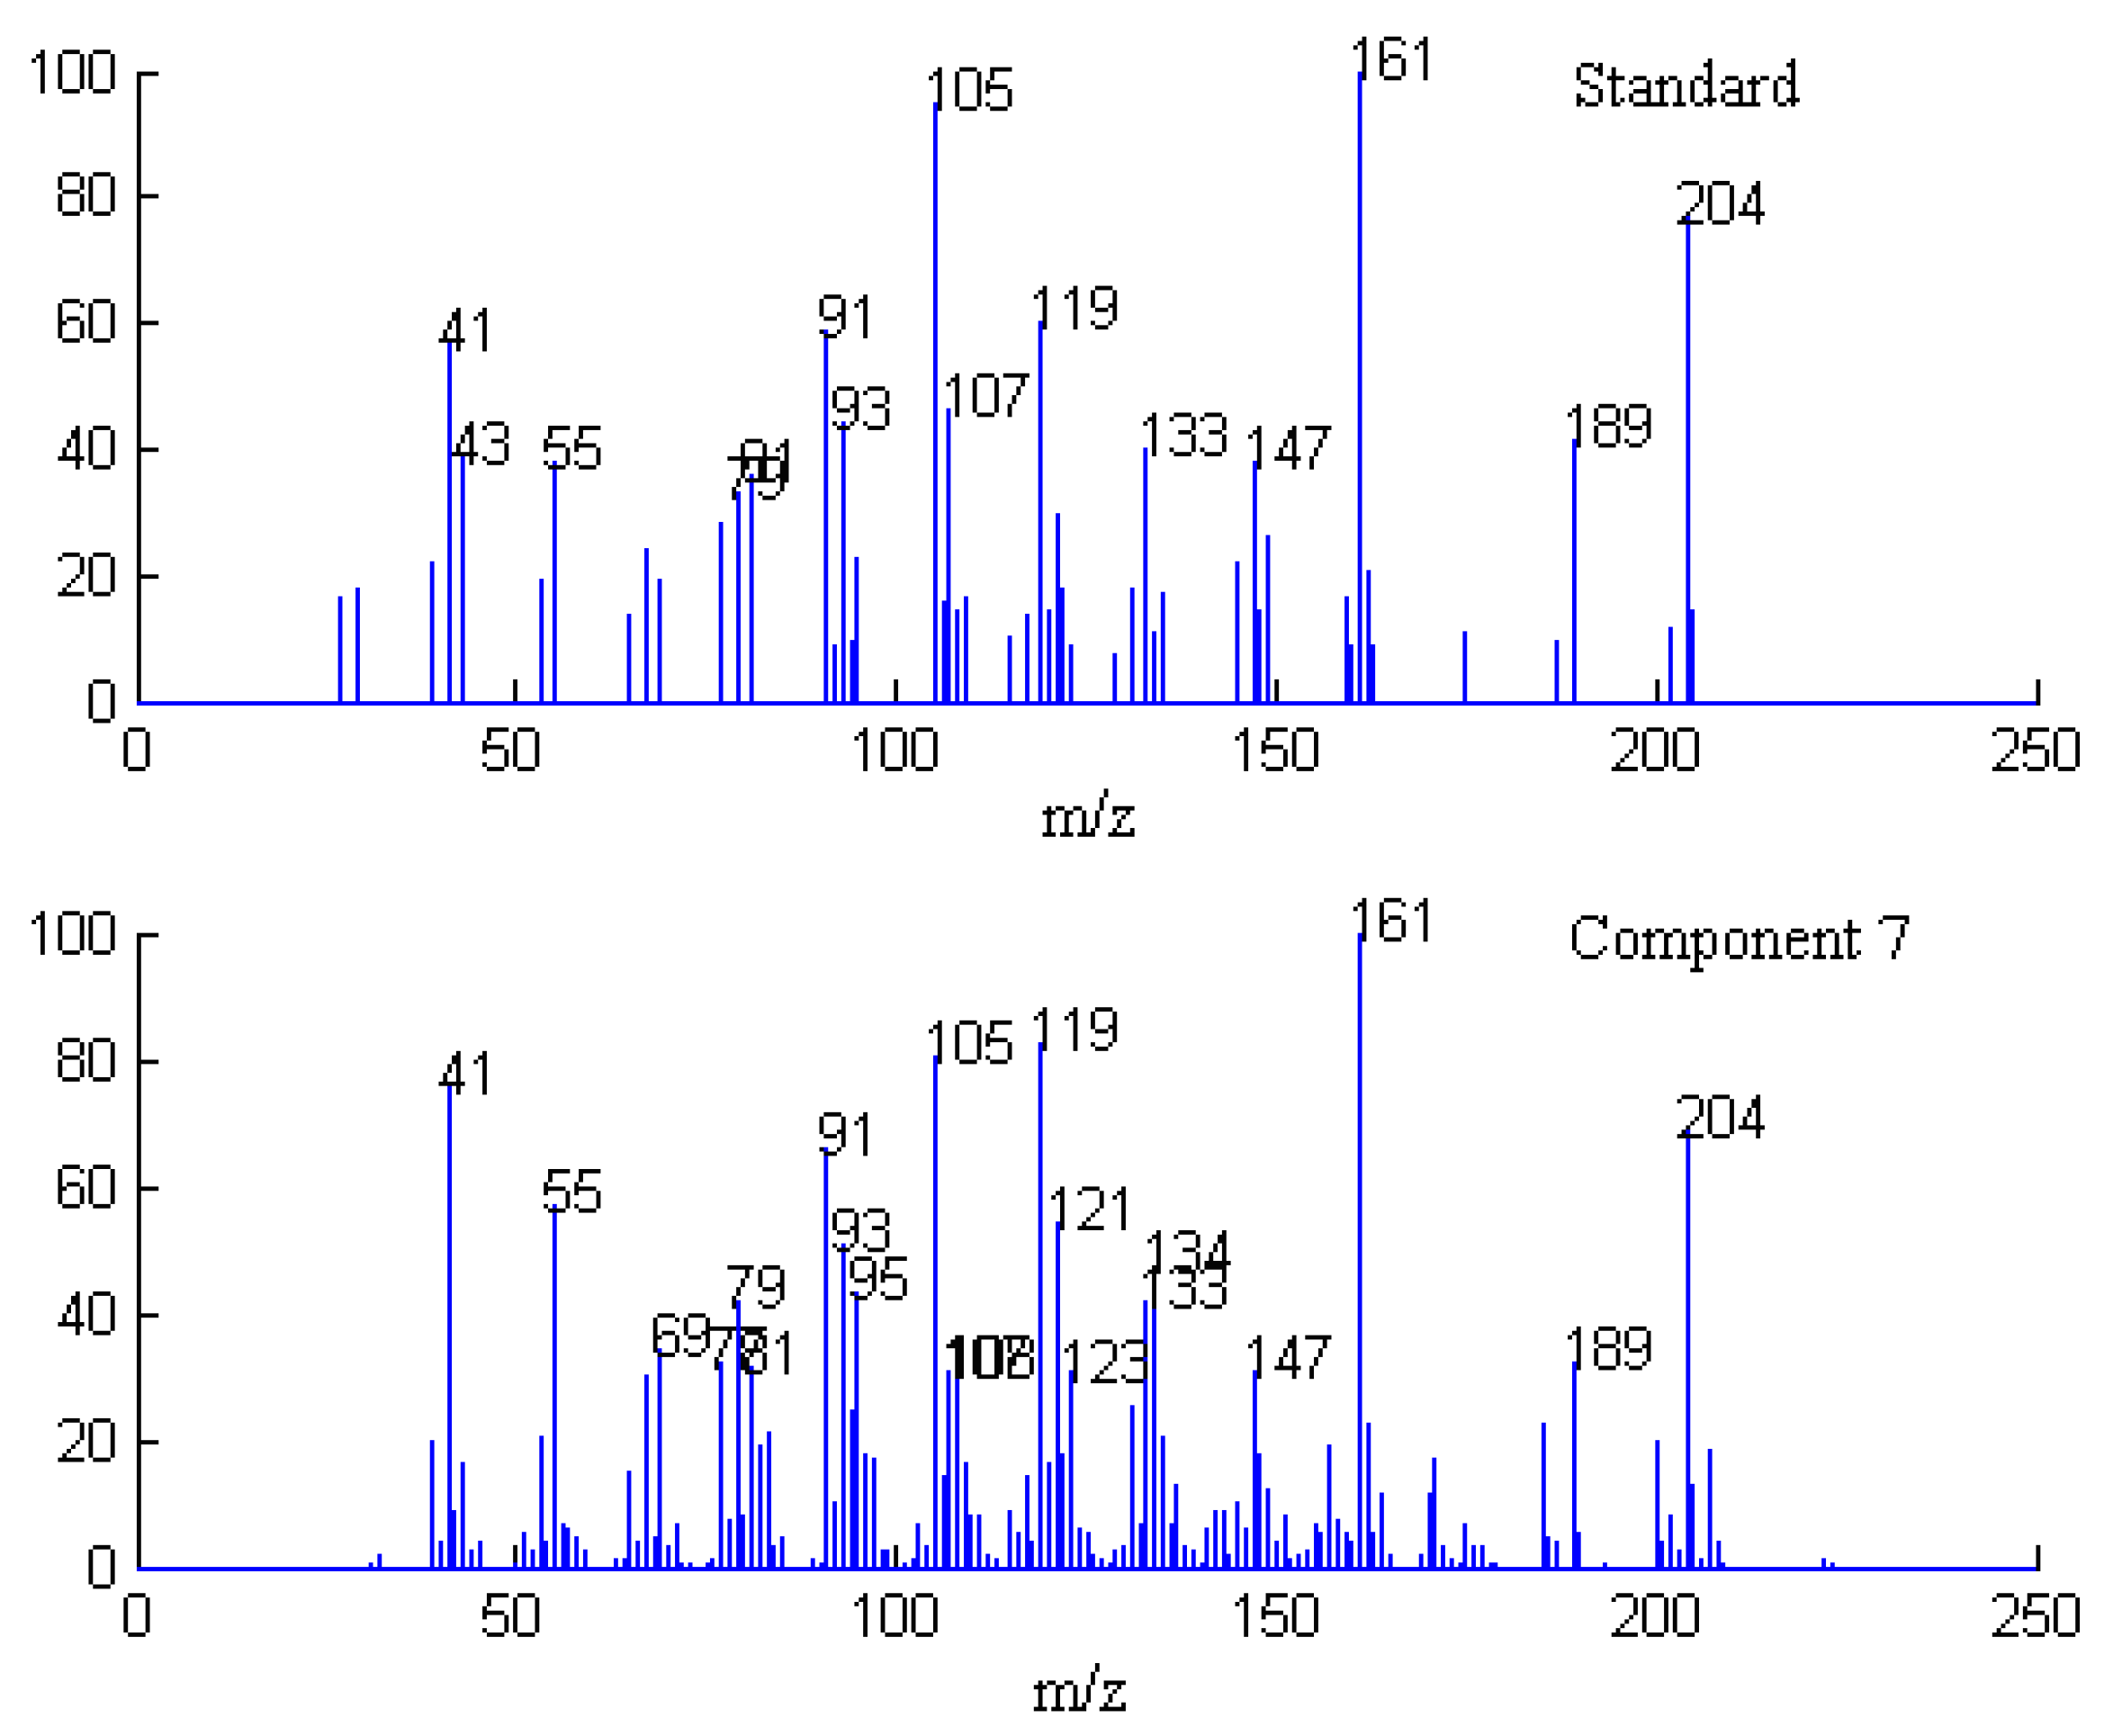
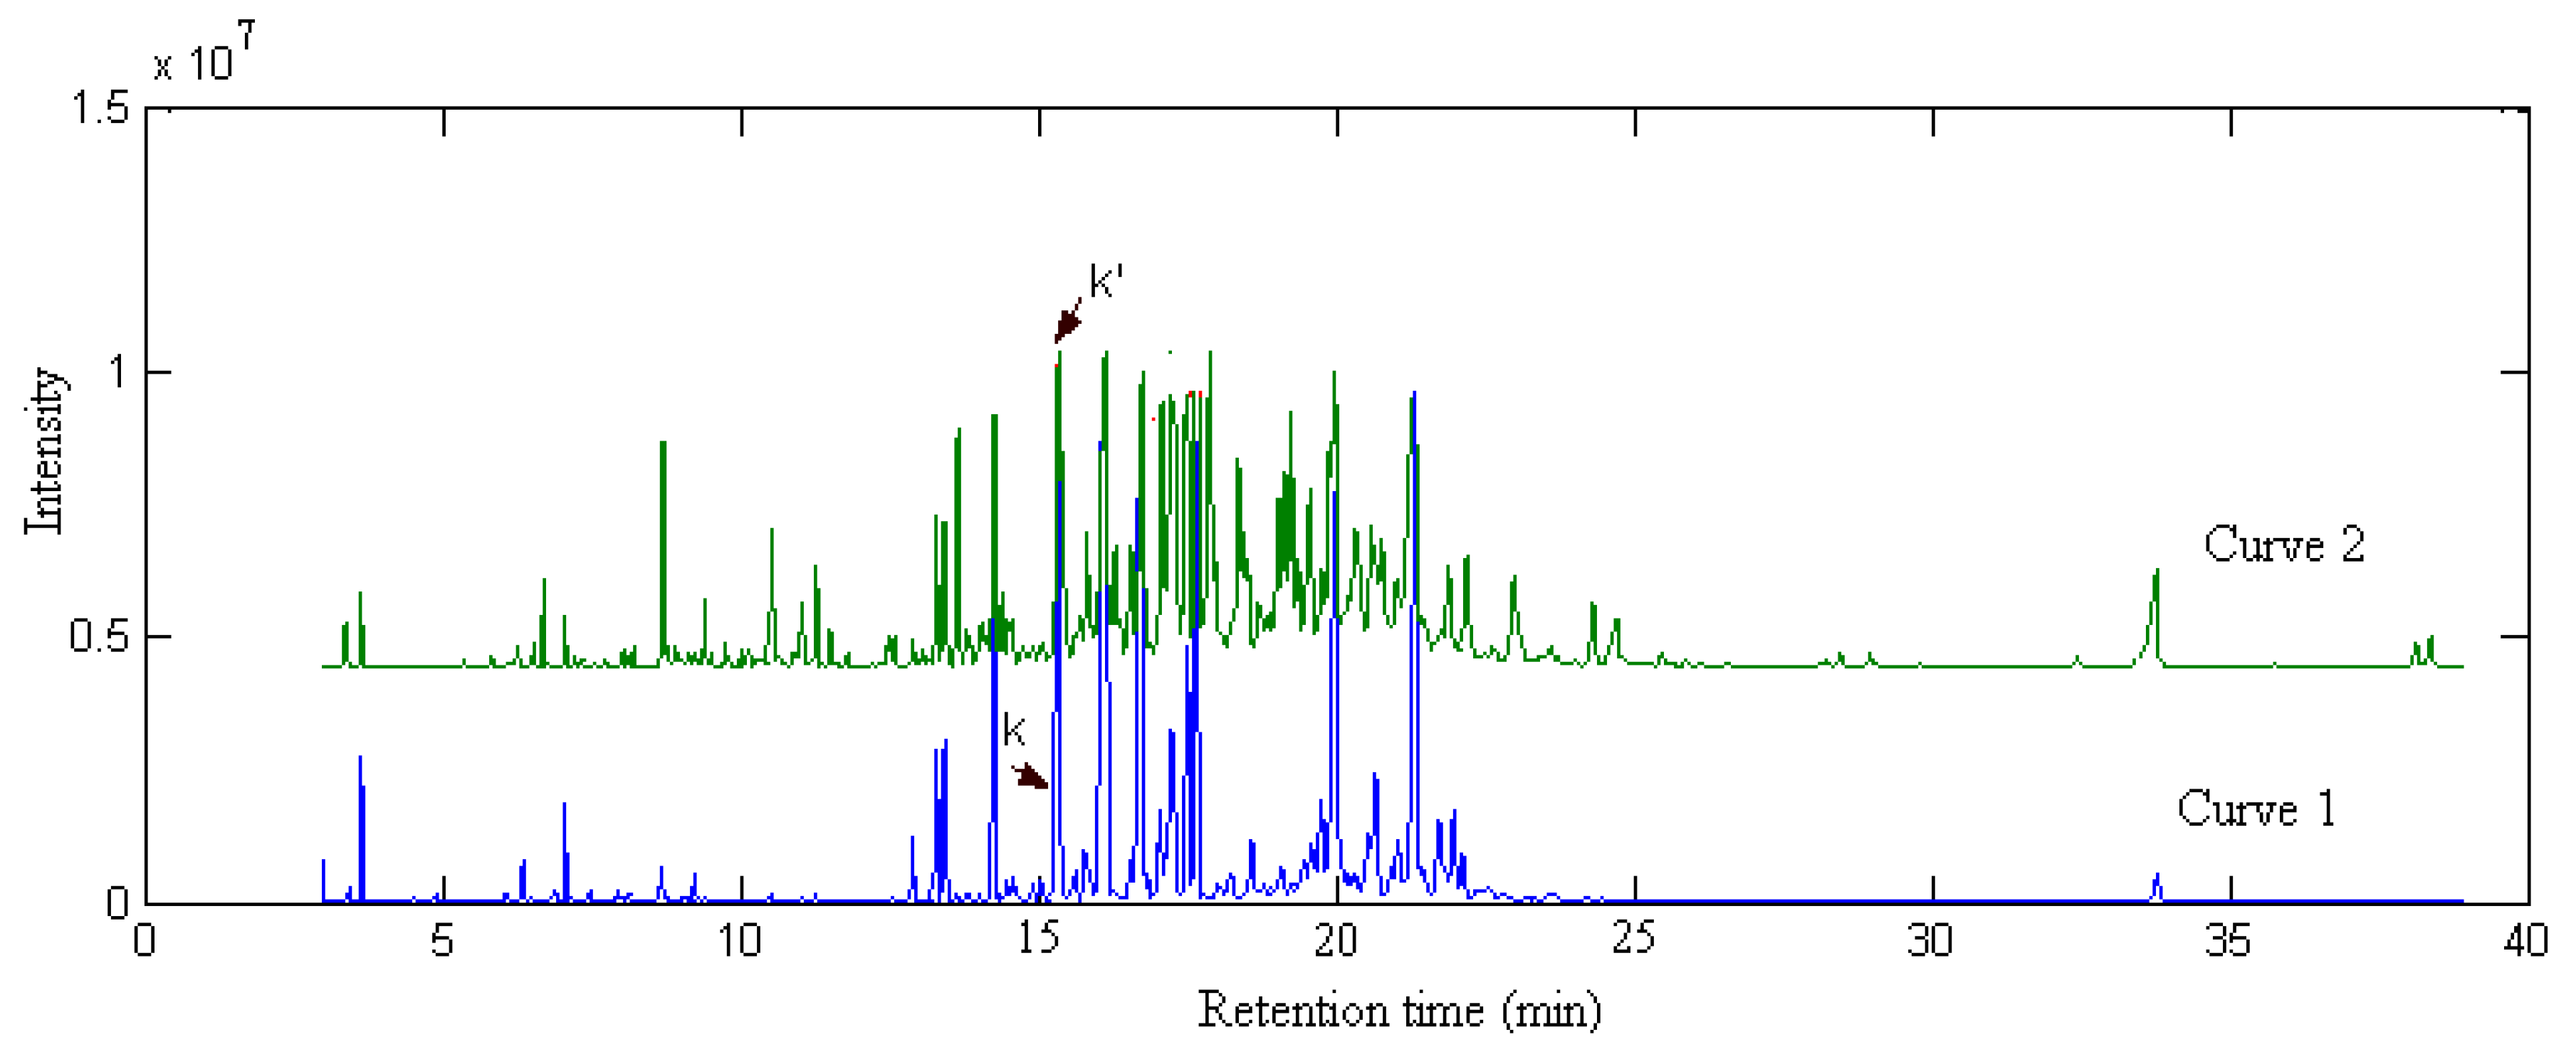
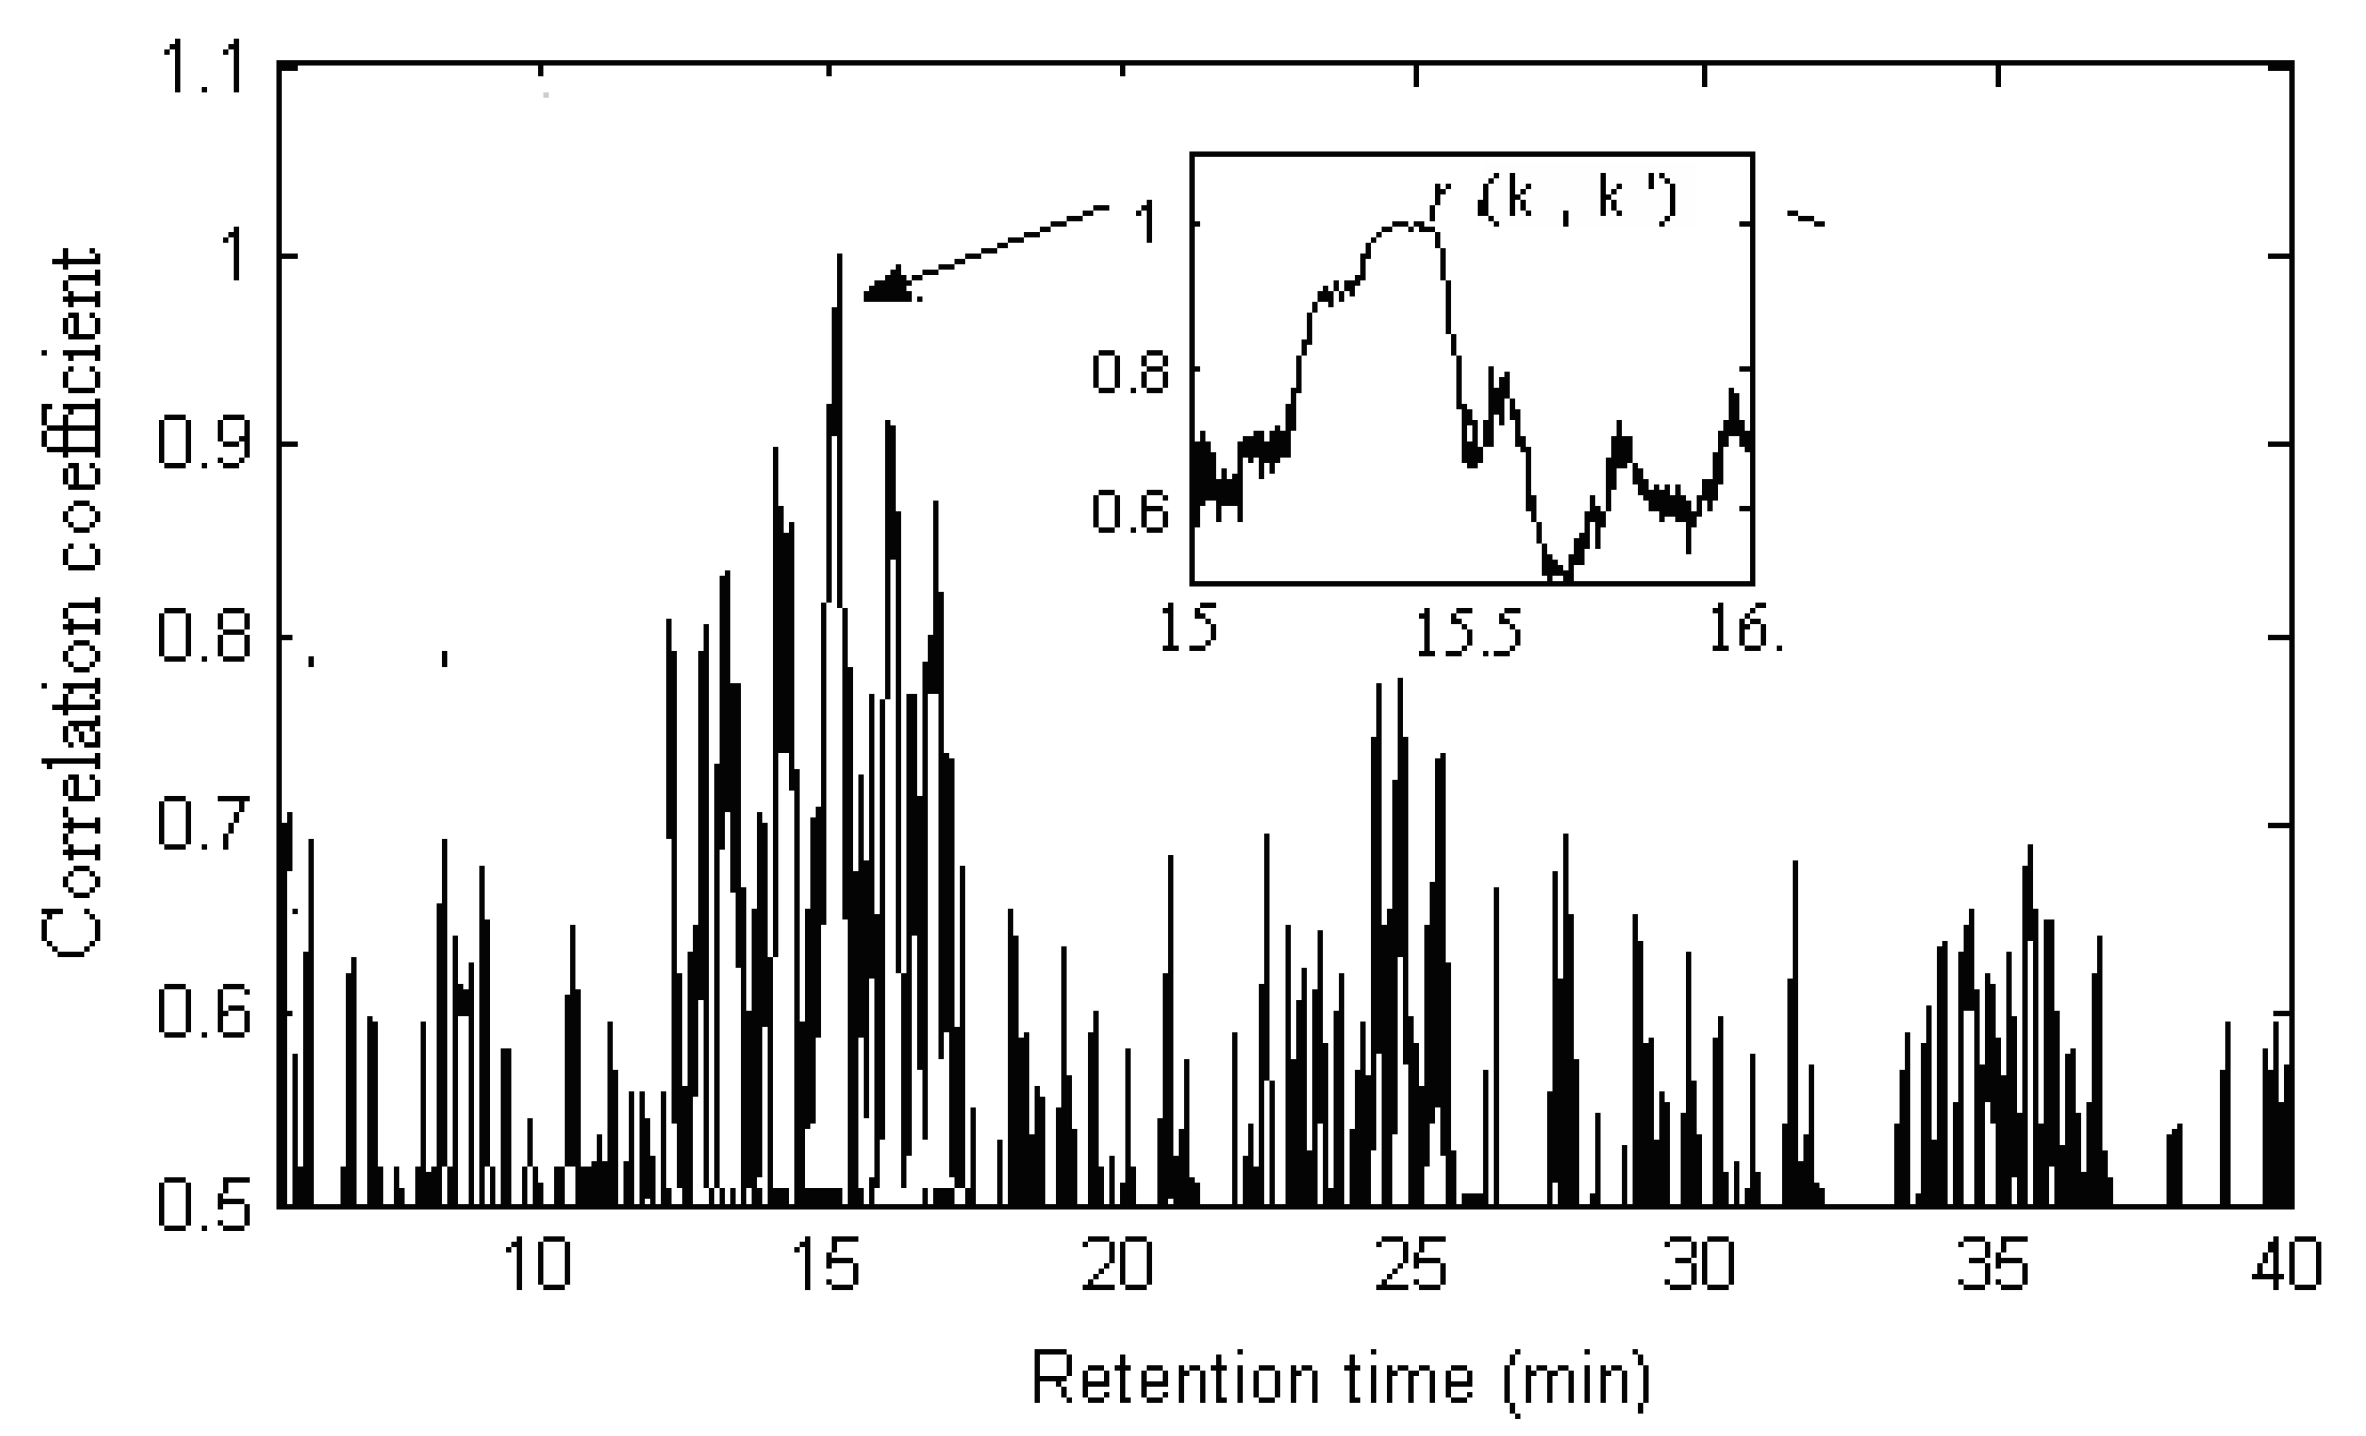
2.3. Identification of Common Components

Curve 1 and curve 2 in Figure 10 are the TIC chromatograms of response X1 from Radix Flemingiae Macrophyllae and X2 from Radix Flemingiae Latifolia Benth obtained from GC-MS, respectively. It can be seen from Figure 10 that X2 was consistent in eluting components with X1, but the concentration distribution of some individual components were different. To compare and distinguish Radix Flemingiae Macrophyllae and its substitutes, such as Radix Flemingiae Latifolia Benth, one may extract pure component spectra from response X2 and identify them once again. However, the a priori information of X1 may be used to reduce some unnecessary work when we compare the quality of Radix Flemingiae Macrophyllae and its substitutes, such as Radix Flemingiae Latifolia Benth. Here, spectral correlative chromatography (SCC) [16] was used to identify each common component directly from the known information of X1 instead of resolving each sample data one by one.
Figure 10. The total ionic current chromatograms of the volatile components in Radix Flemingiae Macrophyllae (X1: Curve1) and of the volatile components in Radix Flemingiae Latifolia Benth (X2: Curve 2) obtained from GC-MS, respectively. k is target component in Radix Flemingiae Macrophyllae and and k’ is the correlative component in Flemingiae Latifolia Benth.
Molecules 17 14111 g010
A brief depiction of spectral correlative chromatography was given as follows. Generally one substance has only a spectrum, no matter whether it exists in different samples, of course, it is best if they are comparable experiments. Suppose that X1 and X2 are two response matrices from two different samples of Chinese herbs, where si is the spectrum of the ith component of X1 and sj the spectrum of the jth component of X2, respectively. The correlation coefficient of these two components can be written as the product of two spectral vectors as follows:
Molecules 17 14111 i001
where Molecules 17 14111 i003 
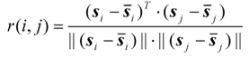
denotes the mean of the spectral vector, and Molecules 17 14111 i004 is Frobenius norm. The values r(i, j) of spectral correlation coefficient are in the range −1 ≤ r ≤ 1, and the larger the value of r is the more correlative are the components between the ith and the jth peak. When r equals to 1, these two components are identical. On account of errors and interference from noise and background, etc., in actual systems, the maximum of r is not equal to 1 but close to 1. In order to check if the component existing in X1 really also exists in X2, we may first extract si (the component to be investigated) from X1 and then calculate its corresponding correlation coefficient with every row vector, say xjT (j = 1, …, m), in X2 as shown in Equation (2)?:
Molecules 17 14111 i002
Accordingly, a spectral correlation coefficient curve is obtained by calculating r(i, j) of the spectral vector si against every row of X2 in sequence. The curve with the same length of the eluting chromatogram contains therefore the spectral correlation information in X2 corresponding to the component spectrum, say si, in X1. With the help of the correlation coefficient curve thus obtained, one may easily pick up the correlation information between X1 and X2. Consequently, the curve was named spectral correlative chromatography (SCC) in this work.
The detailed procedure is illustrated by an example, pure component k (α-himachalene) of X1. Its spectrum has been extracted with the SFA method. How to extract the common components from X2 with the SCC method?
A series of spectral correlation coefficients (r) were obtained by calculating the spectrum sk of component k against every row of X2 in sequence (see Figure 11) according to Equation (2). As shown in Figure 11, the correlation coefficients r(k, k’) corresponding to components k’ of X2 were larger than the others. As shown in middle top part of Figure 11, the value of r(k, k’) is 0.9981. If the errors and interference from noise and background, etc. in actual systems was taken into account, the correlation coefficient was quite close to 1. Then it was concluded that components k’ and k were correlative based on spectral-dependent principle of substance identification. In this way, other correlative components in X2 could be obtained. There were 51 common components between Radix Flemingiae Macrophyllae and Flemingiae Latifolia Benth. The results were also listed in Table 1.
Figure 11. Correlative chromatogram of component k of sample X1 against those of X2. Right top part is the amplified segment where component k′ from Flemingiae Latifolia Benth exists and r(k, k′) is the correlation coefficient of component k and k′.
Molecules 17 14111 g011

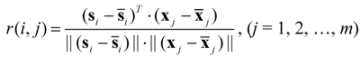
2.4. Comparison of Samples

The procedure performed for Flemingiae Macrophyllae was used for those peaks in Flemingiae Latifolia Benth, which were not identified by the SCC method. Thirty components in the essential oil of Flemingiae Latifolia Benth, which were not found in Flemingiae Macrophyllae, were identified with the SFA method. The results are listed in Table 2. Among the 79 separated constituents in the essential oil of Flemingiae Latifolia Benth, a total of 64 components were identified. Fifty one identified components existed in both Flemingiae Macrophyllae and Flemingiae Latifolia Benth. Alkenes, such as longifolene-V4, β-cedrene and β-himachalene, and alcohols, such as β-selinenol, α-eudesmol and farnesol isomer, were the main volatile constituents in both Flemingiae Macrophyllae and Flemingiae Latifolia Benth, but the contents of each component were different. The obtained results can provide useful information for further development of Flemingiae Macrophyllae.
Table 2. Qualitative results of some other constituents in the essential oil from Flemingiae Latifolia Benth.
Series No.Retention time (min)Compound nameMolecule structure
16.914m-CymeneC10H16
29.128Octanoic acidC8H16O2
310.7194-Hydroxy-3-methylacetophenoneC9H10O2
411.526Di-epi-α-cedreneC10H18O
514.430α-CedreneC15H32
615.1121 H-Benzocycloheptene, 2,4a,5,6,7,8,9,9a-octahydro-3,5,5-trimethyl-9-methylene-C15H24
715.672DihydrocurcumeneC15H24
816.541α-MuuroleneC15H24
917.512Eudesma-3,7(11)-dieneC15H24
1019.513Caryophyllenyl alcoholC15H26O
1120.2471-Cyclohexen-1-ol, 2,6-dimethyl-, acetateC10H16O2
1226.490(E)-10-PentadecenolC15H30O
1334.172cis-7-Tetradecen-1-olC14H28O

3. Experimental

3.1. Instrumentation and Materials

Radix Flemingiae Macrophyllae was purchased from a Zhejiang pharmaceutical store and was identified by a researcher from the Institute of Materia Medica, Hunan Academy of Traditional Chinese Medicine and Materia Medica. Radix Flemingiae Latifolia Benth, a substitute of Radix Flemingiae Macrophyllae was also purchased from a local pharmaceutical store in Zhejiang Province. Anhydrous sodium sulfate and ether were purchased from Shanghai Chemical Reagent Research Institute (Shanghai, P.R. China) and were of analytical grade. GC-MS was performed with a Shimadzu GC-2010 gas chromatography instrument coupled with a Shimadzu 2010 mass spectrometer. The volatile constituents in Radix Flemingiae Macrophyllae and Radix Flemingiae Latifolia Benth were separated on a 30 m × 0.25 mm I.D. fused silica capillary column coated with 0.25 µm OV-1 film.

3.2. Extraction of the Essential Oil

The samples were dried at constant temperature (40 °C) for 2 h. Then, 500 g distilled water and 200 g Radix Flemingiae Macrophyllae or Radix Flemingiae Latifolia Benth were added into a standard apparatus, and the volatile constituents were extracted by water distillation for 8 h according to the procedure described in the Chinese Pharmacopoeia [19]. Effluent was extracted with diethyl ether and the diethyl ether was removed under low temperature. The obtained essential oils were dried with anhydrous sodium sulfate and stored in the refrigerator at 4 °C prior to analysis.

3.3. Gas Chromatography-Mass Spectrometry

Analytical conditions were as follows: the oven was held at 50 °C for 1 min during injection, then programmed at 10 °C·min−1 to a temperature of 150 °C, finally ramped at 2 °C·min−1 to a temperature of 200 °C and held for 5 min. Inlet temperature was kept at 260°C all the time. A 1.0 µL volume of essential oil was injected into the GC. Helium carrier gas at a constant flow-rate of 1.0 mL·min−1 and a 10:1 split ratio were used simultaneously. Mass spectrometer was operated in full scan and electron impact (EI+) modes with an electron energy of 70 eV. Interface temperature was 250 °C. MS source temperature was 200 °C. In the range of m/z 30 to 350, mass spectra were recorded with 0.2 s·scan−1 velocity.

3.4. Data Analysis

Data analysis was performed on a Pentium based IBM compatible personal computer. All programs for the chemometrical resolution methods were coded in MATLAB 6.5 for Windows. The library searches and spectral matching of the resolved pure components were conducted on the National Institute of Standards and Technology (NIST) MS database containing about 107,000 compounds.

4. Conclusions

In this work, a combined chemometrics method, subwindow factor analysis (SFA) and spectral correlative chromatography (SCC), were used for analysis of the volatile constituents in Radix Flemingiae Macrophyllae and Radix Flemingiae Latifolia Benth, one of its common substitutes. This study showed that the application of this combined approach is a powerful tool, which comprehensively reveals the quality and quantity of chemical constituents of traditional medicines for effective evaluation of similarity or differences between complex analytical samples.

Acknowledgments

This research work was financially supported by Province Natural Science Foundation of Zhejiang of China (Grant No. Y4110075 and Y2100908) and Zhejiang Qianjiang Talent Project (Grant No. 2010R10054).
  • Sample Availability: Samples of the extracts from Radix Flemingiae Macrophyllae and Radix Flemingiae Latifolia Benth are available from the authors.

References

  1. Chen, Q.; Li, X.Y.; Cai, Y.; Zhu, Y.L.; Chen, S.Q. Pharmacognostical identification of Flemingia fruticulosa. West China J. Pharm. Sci. 2012, 27, 83–85. [Google Scholar]
  2. Zeng, C.L.; Zhong, Z.X.; Lu, W.J.; Wang, J.; Li, S.B.; Li, X.J. Study on the Pharmacological Action of Flemingia macrophylla(Willd.) Prain. Guiding J. Tradit. Chin. Med. Pharm. 2011, 17, 79–81. [Google Scholar]
  3. Shiao, Y.J.; Wang, C.N.; Wang, W.Y. Neuroprotective flavonoids from Flemingia macrophylla. Planta Med. 2005, 71, 835–840. [Google Scholar] [CrossRef]
  4. Li, D.Y.; Fu, Y.B.; Hua, H.M.; Li, Z.L. Chemical constituents from roots of Flemingia macrophylla. Chi. Tradit. Herbal Drugs 2012, 43, 1259–1262. [Google Scholar]
  5. Li, L.; Liu, Z.H.; Qin, M.J. Simultaneous Determination of Seven Flavonoids in the Flemingia macrophylla by HPLC. Chin. Wild Plant Resour. 2011, 30, 54–58. [Google Scholar]
  6. Ahn, E.M.; Nakamura, N.; Akao, T. Estrogenic and Antiestrogenic Activities of the Roots of Moghania philippinensis and Their Constituents. Biol. Pharm. Bull. 2004, 27, 548–553. [Google Scholar] [CrossRef]
  7. Sun, L.; Li, Z.L.; Han, G.H. Chemical constituents of the roots of Moghania philippinensis. Chin. J. Med. Chem. 2009, 19, 364–371. [Google Scholar]
  8. Wang, X.Q.; Yang, S.D.; Yang, Z.Y. Study on the chemical constituents of volatile components from Radix Flemingiae Macrophyllae. J. Yunnan Univ. Tradit. Chin. Med. 2008, 31, 12–15. [Google Scholar]
  9. Liu, J.H.; Gao, L.X.; Gao, Y.Q. Study on the chemical constituents of volatile oil from Radix Flemingiae Macrophyllae. Chin. Tradit. Pat. Med. 2003, 25, 485–487. [Google Scholar]
  10. Wei, D.; Edmund, R. Malinowski.Investigation of copper (II)- Ethylenediaminetetraacetate complexation by window factor analysis of ultraviolet spectra. J. Chemom. 1993, 7, 89–98. [Google Scholar]
  11. Shen, H.L.; Manne, R.; Xu, Q.S.; Chen, D.Z.; Liang, YZ. Local resolution ofhyphenated chromatographic data. Chemom. Intell. Lab. Syst. 1999, 45, 323–330. [Google Scholar] [CrossRef]
  12. Xu, C.J.; Jiang, J.H.; Liang, Y.Z. Evolving window orthogonal projections method for two-way Data Resolution. Analyst 1999, 124, 1471–1476. [Google Scholar] [CrossRef]
  13. Sanchez, F.C.; Rutan, S.C.; Gil Garcia, N.D. Resolution of multicomponent overlapped peaks by the orthogonal projection approach, evolving factor analysis and window factor analysis. Chemom. Intell. Lab. Syst. 1997, 36, 153–164. [Google Scholar] [CrossRef]
  14. Manne, R.; Shen, H.L.; Liang, Y.Z. Subwindow factor analysis. Chemom. Intell. Lab. Syst. 1999, 45, 171–176. [Google Scholar] [CrossRef]
  15. Li, B.Y.; Hu, Y.; Liang, Y.Z.; Huang, L.F.; Xu, C.J.; Xie, P.S. Spectral correlative chromatography and its application to analysis of chromatographic fingerprints of herbal medicines. J. Sep. Sci. 2003, 27, 581–588. [Google Scholar]
  16. Liang, Y.Z. White, Grey and Black Multicomponent Systems and Their Chemometric Algorithms; Hunan Publishing House of Science and Technology: Changsha, China, 1996. [Google Scholar]
  17. Guo, F.Q.; Liang, Y.Z.; Xu, C.J.; Huang, L.F. Determination of the volatile chemical constituents of Notoptergium Incium by gas chromatography- mass spectrometry and iterative or non-iterative chemometrics resolution methods. J. Chromatogr. A 1016, 99–110. [Google Scholar]
  18. Wang, Y.M.; Yi, L.Z.; Liang, Y.Z.; Li, H.D.; Yuan, D.L.; Gao, H.Y.; Zeng, M.M. Comparative analysis of essential oil components in Pericarpium Citri Reticulatae Viride and Pericarpium Citri Reticulatae by GC-MS combined with chemometric resolution method. J. Pharm. Biomed. Anal. 2008, 46, 66–74. [Google Scholar] [CrossRef]
  19. Chinese Pharmacopoeia Committee, Chinese Pharmacopoeia; Publishing House of People’s Health: Beijing, China, 2000.

