Article

The Triterpenes 3β-Lup-20(29)-en-3-ol and 3β-Lup-20(29)-en-3-yl Acetate and the Carbohydrate 1,2,3,4,5,6-Hexa-O-acetyl-dulcitol as Photosynthesis Light Reactions Inhibitors

by
Djalma Menezes-de-Oliveira
1,
Maria-Isabel Aguilar
2,
Beatriz King-Díaz
2,
Sidney Augusto Vieira-Filho
1,
Lucinier Pains-Duarte
1,
Grácia-Divina de Fátima Silva
1 and
Blas Lotina-Hennsen
2,*
1
Departamento de Química, Universidad Federal de Minas Gerais, Avenida Antonio Carlos 6627, Pampulha, 31270-901, Belo Horizonte, MG, Brazil
2
Departamento de Bioquímica, Facultad de Química, Universidad Nacional Autónoma de México, México D. F. 04510, Mexico
*
Author to whom correspondence should be addressed.
Molecules 2011, 16(12), 9939-9956; https://doi.org/10.3390/molecules16129939
Submission received: 28 September 2011 / Revised: 25 November 2011 / Accepted: 28 November 2011 / Published: 1 December 2011
(This article belongs to the Section Natural Products Chemistry)

Abstract

:
Three compounds were isolated from Maytenus acanthophylla Reissek (Celastraceae): the pentacyclic triterpenes lup-20(29)-en-3β-ol (lupeol, 1) and 3β-lup-20(29)-en-3-yl acetate (2) and the carbohydrate 1,2,3,4,5,6-hexa-O-acetyldulcitol (3);lupeol was also isolated from Xylosma flexuosa. The compounds’ structures were elucidated by spectroscopic and spectrometric analysis. Compound 1 acts as an energy transfer inhibitor, interacting with isolated CF1 bound to thylakoid membrane, and dulcitol hexaacetate 3 behaves as a Hill reaction inhibitor and as an uncoupler, as determined by polarography. Chlorophyll a (Chl a) fluorescence induction kinetics from the minimum yield F0 to the maximum yield FM provides information of the filling up from electrons coming from water to plastoquinone pool with reducing equivalents. In this paper we have examined the effects of compounds 1 and 3 on spinach leaf discs. Compound 1 induces the appearance of a K-band, which indicates that it inhibits the water splitting enzyme. In vivo assays measuring the fluorescence of chl a in P. ixocarpa leaves sprayed with compound 1, showed the appearance of the K-band and the PSII reaction centers was transformed to “heat sinks” or silent reaction centers unable to reduce QA. However, 3 also induced the appearance of a K band and a new band I appears in P. ixocarpa plants, therefore it inhibits at the water splitting enzyme complex and at the PQH2 site on b6f complex. Compounds 1 and 3 did not affect chlorophyll a fluorescence of L. perenne plants.

1. Introduction

Maytenus acanthophylla Reissek (Celastraceae) is a medicinal plant found in Bahia state, Brazil [1] where it is vulnerable to extinction and the sp. is already considered extinct in Minas Gerais [2]. Its chemical constituents isolated from roots include gutta-percha, flavonoids, alditol, lupanes, oleanane, ursane, and quinonamethides [3]. Xylosma flexuosa (Flacourtiaceae) is a tree or sometimes a shrub distributed in Mexico, Guatemala, Honduras, El Salvador, Nicaragua, Costa Rica, Panamá, Venezuela and Curaçao [4]. In Mexico it is vulnerable to extinction. The chemical constituents of the methanol extract of Xylosma flexuosa are (rel)-2-([2,6-dibenzoyl]-β-glucopyranosyloxy)-5-hydroxybenzoyl-1R,2R,6R-trihydroxy-3-oxocyclohex-4-enoate (xilosmin) and three glycosides: Salirespolide, poliotrisoside and 2′-benzoylpoliotrisoside [5].
As part of our study of bioactive metabolites from species of the Flacourtiaceae and Celastraceae plant families, the present investigation describes the isolation, identification, and photosynthetic inhibitory activities of two triterpenes: lupeol, 3β-lup-20(29)-en-3-ol (1), 3β-lup-20(29)-en-3-yl acetate (2) and the carbohydrate 1,2,3,4,5,6-hexa-O-acetyldulcitol (3) (Figure 1) obtained from M. acanthophylla; compound 1 was also isolated from X. flexuosa. Although a relatively large number of highly phytotoxic allelochemicals are derived from the terpenoid pathway [6,7], the mode of action of some terpenoids indicate that they participate in plant-plant interactions, and few of them have been found to affect photosynthesis [8,9]. Chlorophyll a fluorescence kinetics of photosystem II analysis indicated that the primary target of synthetic herbicides is the photosynthetic apparatus on the acceptor side of photosystem II (PSII), by displacing the quinone QB from the D1 protein demonstrated by Velthuys [10]. Furthermore, most of the natural products that affect photosynthesis have diverse targets of action on chloroplasts electron transport chain [11]. Therefore, our aim was to study the effect of these two triterpenes and the acetylated-alditol as natural photosynthetic inhibitors by fluorescence of chlorophyll a activity that could suggest their participation in plant-plant interactions.

2. Results and Discussion

2.1. Effect of Lupeol (1), 3β-Lup-20(29)-en-3-yl Acetate (2) and 1,2,3,4,5,6-Hexa-O-acetyl-dulcitol (3) on Photophosphorylation

Compounds 13 were monitored by assay the photophosphorylation inhibition of the water to methylviologen (MV) step in freshly lysed intact chloroplasts. Lupeol (1) and dulcitol hexaacetate 3 were found to be the bioactive compounds and this activity was displayed in a concentration dependent-manner, with I50 values of 123 and 143 μM, respectively. The I50 values were extrapolated from the plot of the rate of ATP formation against increasing concentration of compounds. 3β-acetyl lupeol 2 showed less inhibitory activity than compounds 1 and 3 and, its I50 value could not be estimated, thus compound 2 were not further studied. These results suggested that the 3β-ol moiety on lupeol is important for its activity, since when it was acetylated this suppressed drastically its inhibitory activity.
Figure 1. Structures of lup-20(29)-en-3β-ol (lupeol, 1), 3 β-lup-20(29)-en-3-yl acetate (2) and 1,2,3,4,5,6-hexa-O-acetyldulcitol (3).
Molecules 16 09939 g001

2.2. The Effect of Compounds 1 and 3 on Different Photosynthetic Activities

Further investigation of compounds 1 and 3 as potential natural inhibitors of electron flow, their photosynthetic inhibitory effects on non-cyclic electron transport on spinach chloroplasts from water to MV was evaluated under basal, phosphorylation, and uncoupled conditions previously incubated for 1 min. Lupeol (1) inhibited basal and phosphorylating electron transport by 20% at 300 µM and the uncoupled electron transport (Table 1) was not affected. However when the chloroplasts was incubated with the compound 1 for 7 min, the basal and phosphorylating electron flow inhibition increased by 100% and 73%, respectively, and uncoupled electron flow was not affected (Table 1).
The main distinguishing features of most energy transfer inhibitors decrease the rate of electron flow only under conditions where active phosphorylation can take place, and electron flow in the absence of Pi (basal electron flow) or in the presence of uncouplers is either not affected or only slightly inhibited, with some exceptions, i.e., Dio-9 which also inhibits basal electron flow [12], therefore, lupeol acts as a mild energy transfer inhibitor similar to Dio-9.
Table 1. Effect of 300 µM lupeol on the electron transport rate (basal, phosphorylating and uncoupled) measured from H2O to MV in isolated chloroplast was incubated for 1 and 7 min. The data are the average of three replicates.
Time (min)Conc. (µM)BasalPhosphorylatingUncoupled
ababab
10624100835100930100
3004998071085930100
703341006671001480100
3000018027140195
a = µequiv. e/mg Chl × h; b = %.
Furthermore, when energy transfer inhibitors are added to the thylakoid membrane bound Mg2+-ATPase or trypsin treated CF1 they inhibit the activity, with the exception of kaempferol [12] which had little effect on membrane bound Mg2+-ATPase. Moreover, isolated CF1 also catalyzes the Mg2+-ATPase or a rapid Ca2+-dependent ATPase reaction [12], the activity may be inhibited or enhanced by energy transfer inhibitors. Lupeol (100 μM) inhibited the membrane bound Mg2+-ATPase activity by 35% (Table 2) and thereafter its inhibitory effect decreased and the isolated CF1 Ca2+-ATPase activity was enhanced by 78% with lupeol (1, 300 μM) and it had no effect on the isolated Mg2+-ATPase activity (data not shown); these results indicate that lupeol interacts with isolated CF1 or when CF1 is bound to thylakoid membranes. McCarthy [12] concluded on the action of energy transfer inhibitor that “since all of these activities were shown to be catalyzed by the same enzyme (CF1), it appears that the chloroplast membrane confers special properties on CF1” in accord with our result, compound 1 enhanced Ca2+-ATPase activity in isolated CF1 and inhibits the Mg2+-ATPase activity bound to thylakoids membrane. We found that this enzyme is also targeted by others natural products like 2-methoxyethyl-7β-hydroxy-6-oxovouacapan-17β-oate and 3-methylbut-2-enyl-7β-hydroxy-6-oxovouacapan-17β-oate [8], epifriedelinol and canophyllol [9], as well as by other compounds like Dio-9, phlorizin, tri-n-butyltinchloride [12]. Ammonium chloride was used as positive control.
Table 2. Effect of lupenol on Mg2+-ATPase activity bound to thylakoid membrane and on the isolated CF1-Ca2+-ATPase activated by light and heat, respectively. Data are average of three replicates.
Lup-20(29)-in-3β-ol [μM]Mg2+-ATPase (%)Ca2+-ATPase (%)
Control100100
10065182
20086178.3
30098178.8
Compound 3 inhibited the uncoupled electron transport as its concentration increased up to 300 μM with an I50 value of 67 µM, furthermore, compound 3 (300 µM) enhanced the phosphorylating electron transport rate by 30% (Figure 2). The whole results on electron flow indicate that 1,2,3,4,5,6-hexa-O-acetyldulcitol (3) acts as Hill reaction inhibitor and as a mild uncoupler when the thylakoids were incubated with compound 3.
Figure 2. Effect of 3 on electron flow from water to MV in spinach chloroplasts on three different conditions: basal (■), phosphorylating (●), and uncoupled (▲) rate on isolated spinach chloroplasts. Control rate values were 624, 930 and 835, respectively in μequiv. e mg−1 Chl h−1. Other conditions are indicated in the Experimental section. Data are average of three replicates.
Molecules 16 09939 g002

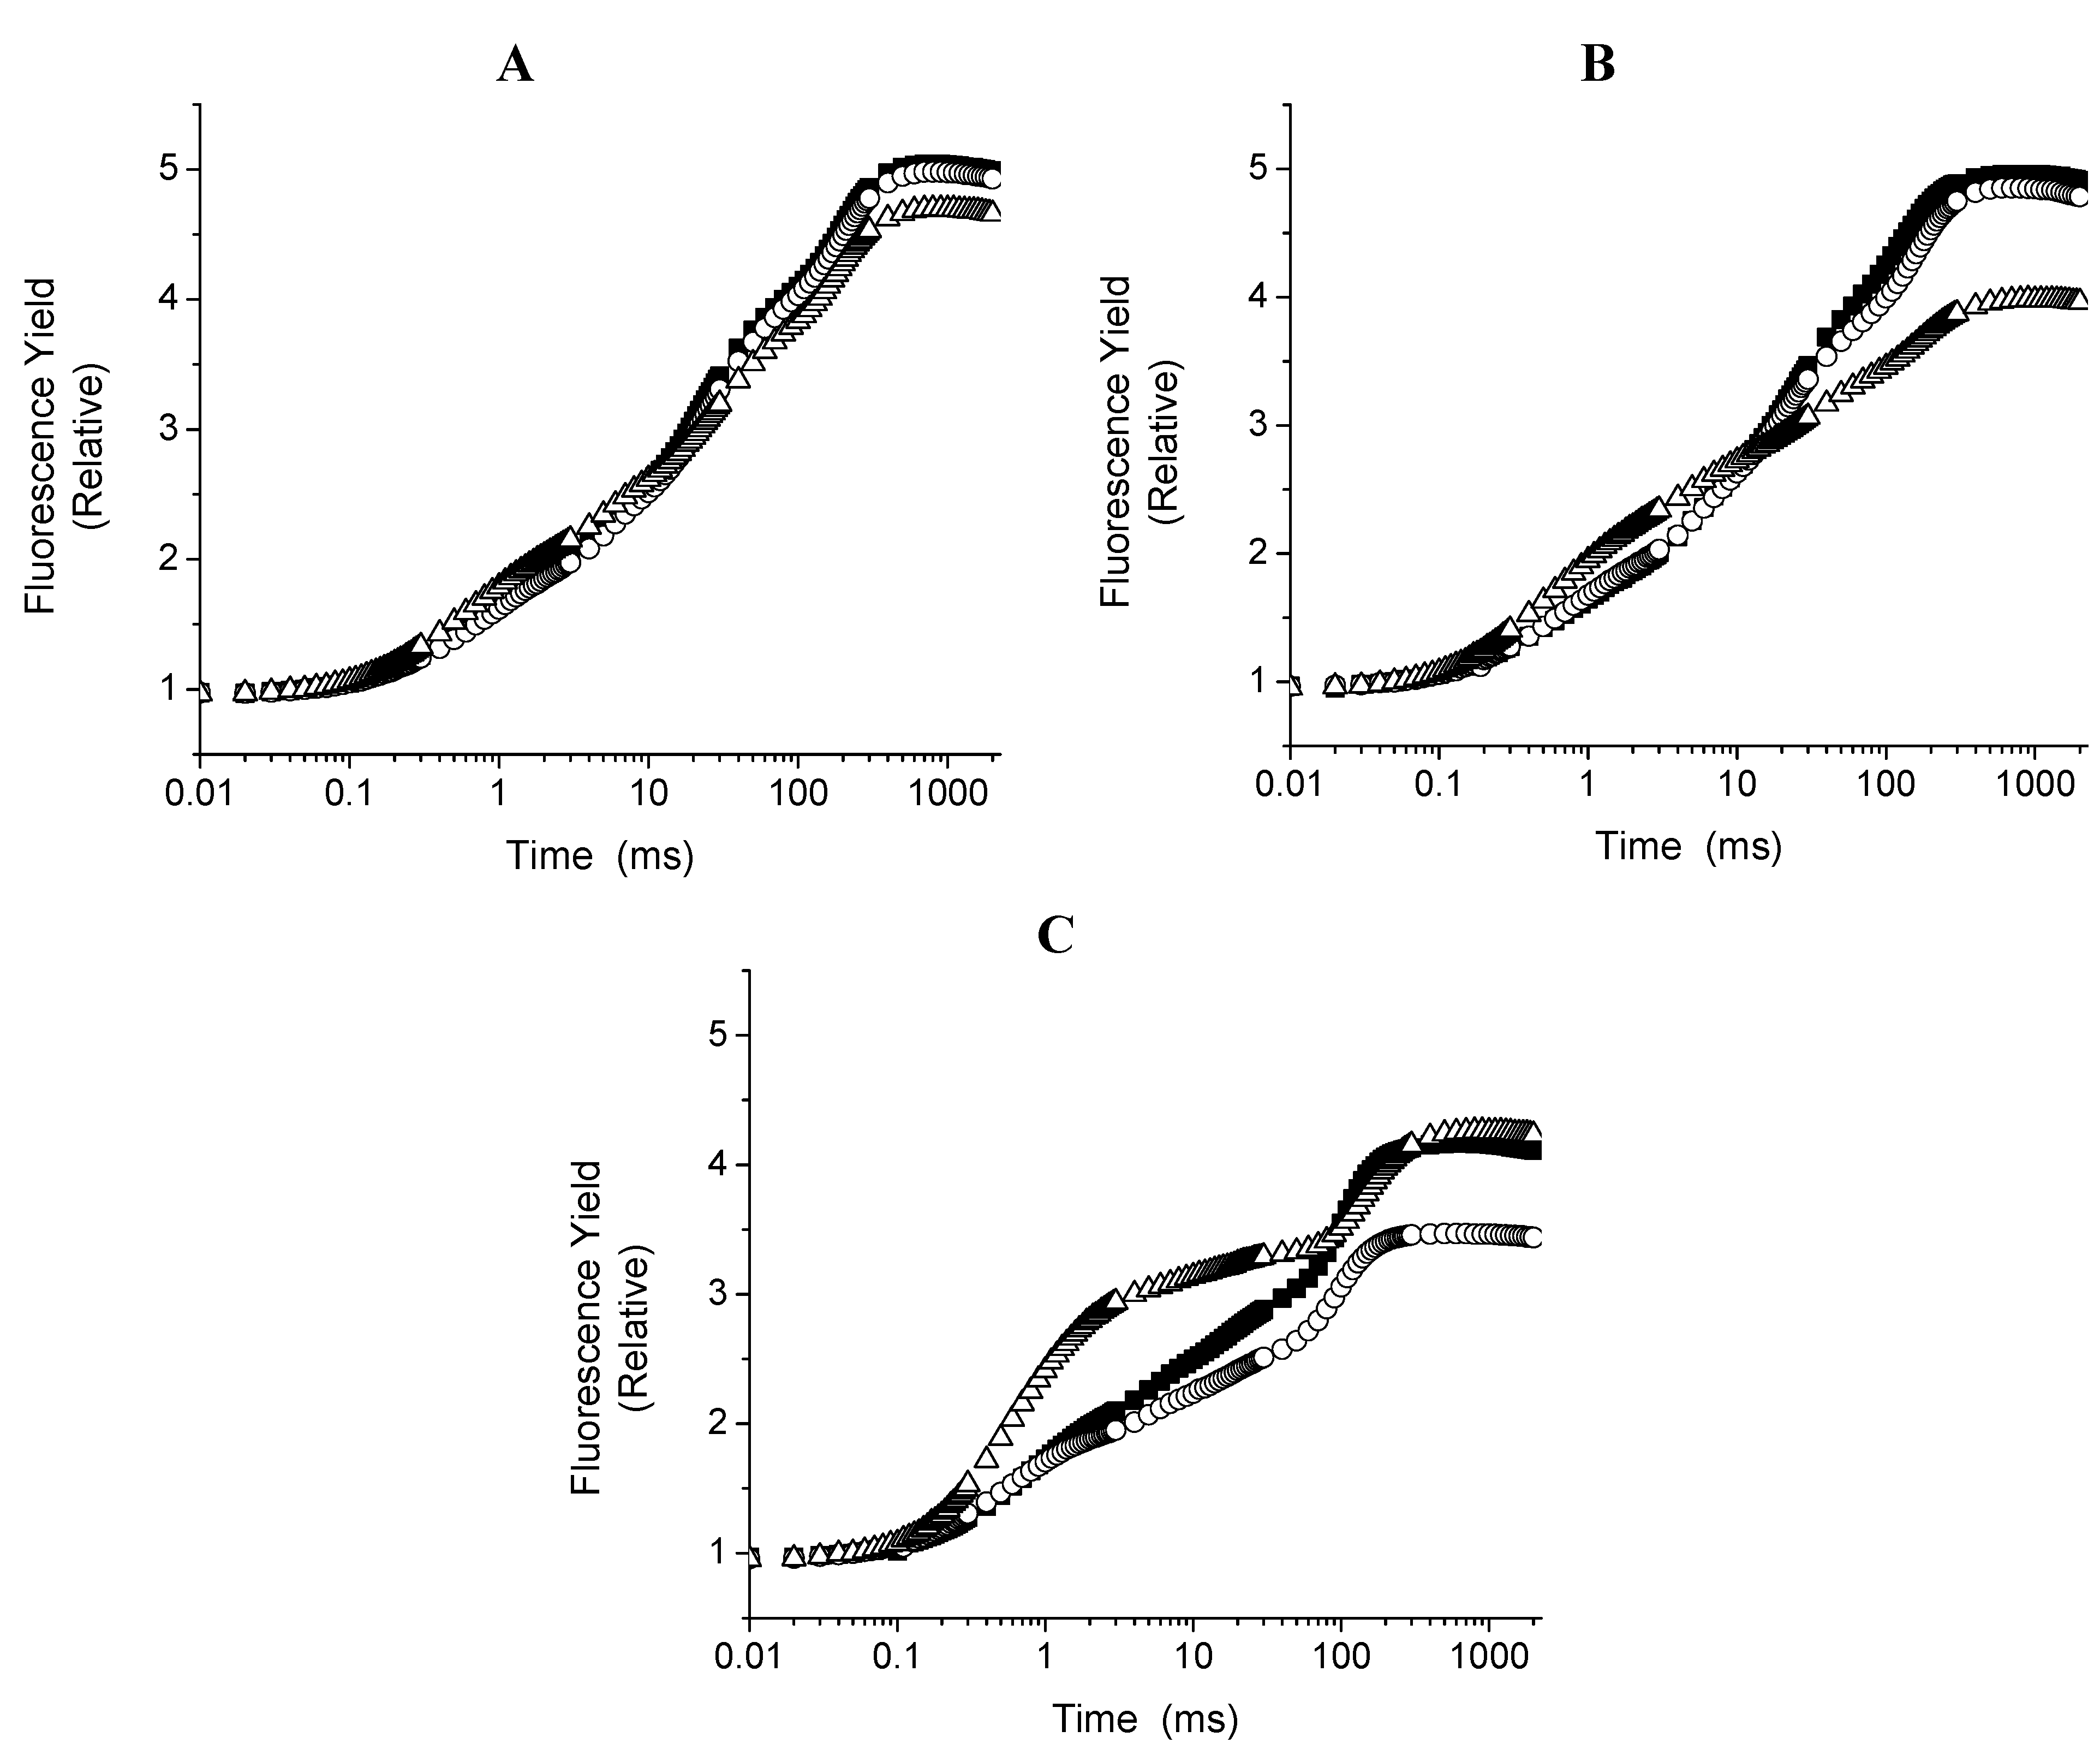
2.3. Chl a Fluorescence Measurements in Spinach Leaf Discs with and without Compounds 1 and 3

Any photosynthetic sample in any physiological state exhibits upon illumination a fast fluorescence rise leading to a transient F0-K-J-I-P from initial fluorescence intensity F0 to a maximal intensity FP or FM with saturating light intensity. Between these two extremes the fluorescence intensity Ft shows intermediate steps as follows: FJ appears at about 2 ms; FI appears at about 30–50 ms; and FM appears at about 300–500 ms; K-band appears at about 300 μs in heat-stressed samples [13,14] or in the influences of chemicals or secondary metabolites [8,9,15,16,17]. Strasser [18] concluded that the appearance of the K-band is satisfactorily explained by an imbalance between the electron flow to the acceptor side and the electron flow from the donor side leading to the accumulation of YZ+. Thus, any treatment or stress condition which affects the donor side capacity will make the K-band apparent, if the electron flow to the acceptor side is sufficient. Therefore, the K-band can be used as a specific indicator of injury to the OEC. Here Chl a fluorescence induction kinetic curve on spinach leaf discs incubated with compounds 1 and 3 for 12 h in the dark was measured in order to localize the target of the compounds on the electron transport chain. Control spinach leaf discs showed a typical polyphasic rise (OJIP curve) [10]. The plot on a logarithmic time scale revealed that there are large differences between the control and samples treated with 1 or 3 150 µM and 300 µM changed to polyphasic rise called OKJIP curve (data not shown). Therefore, the OJIP kinetics data was normalized between FJ and F0, and expressed as Vt = (Ft − F0)/(FJ − F0) and interpreted as a measure of the fraction of the electron acceptor QA being in its reduced state [13,15]. The results show a fast rise at about 300 μs thus appears the K-band (Figure 3A). Thus, compound 1 inhibits the water splitting enzyme at the oxygen-evolving complex (OEC).
Figure 3. Appearance of K bands from fluorescence kinetics (Ft) expressed as the kinetics of relative variable fluorescence of chlorophyll a on the spinach leaf disk incubated with two different concentrations 150 µM (■), 300 µM (▲) of compound 1 (left, panel A) and compound 3 (right, panel B). Data are average of five replicates.
Molecules 16 09939 g003
The OJIP kinetics data was also normalized to a intermediate steps I and F0, or P and F0, and various parameters was calculated and the data were plotted as a radar graph, a circular graphic with a series of spokes or rays projecting from a central point, with each ray label representing a different variables (Figure 4). Figure 4A shows that lupeol (1), 150 and 300 µM, enhanced 35% (dV/dt0) (Figure 4A). (dV/dt0) is an approximate initial slope (in ms−1) of the fluorescence transient V = f(t) and is related to TR0 /RC which expresses the rate, per RC, by which excitons are trapped by RC resulting in the reduction of QA to QA and calculated as = 4(F300 − F0)/(FM − F0) which measure the rate of primary photochemistry ((dQA/QA(total))/dt0), where (dQA/QA(total) is the fraction of closed reaction center, therefore compound 1 make to function better the primary photochemistry.
When 300 µM of compound 1 was tested it enhanced by 30% the following parameters: the (ABS/RC) absorption flux per reaction center and the (TR0/RC) trapped energy flux per RC. Therefore, compound 1, 300 µM induced a better light absorption through the RC and trapping of the electrons in the RC of PSII (ABS/RC), thus the pigment proteins and the RC have better thylakoid membrane functions due to conformation changes and compound 1 enhanced the activity. Finally, the following parameters: trapped energy flux per cross section (TR0/CS0); electron transport per reaction center (ET0/RC); quantum yield of energy dissipation, PHI(D0); the efficiency for an electron moves from the reduced intersystem electron acceptors to the end of PSI electron acceptors, dR/RC; the maximum quantum yield of primary photochemistry, PHI(P0); the probability that a trapped exciton moves an electron into the electron transport chain beyond QA- and the electron transport per cross section (ET0/CS) were not affected with compound 1 (300 µM), indicating that either it had no-inhibition effect on the PSI electron transport chain or had a non-significant value. Moreover, the phenomenological fluxes RC/CS0 decreased 20% with compound 1 (300 µM), which indicates that a % of energy flux is dissipated as heat. We conclude that lupeol (1) partially inhibits and interacts with the water splitting enzyme and partially with the Mg2+-ATPase bound to thylakoid membrane and interacts also with the PSII RC by changing the architecture of the thylakoid membrane and affects the energy migration properties by enhancing its function.
Figure 4. Radar plot graphs show the effects of compound 1 (Panel A) and compound 3 (panel B) on chlorophyll a fluorescence parameter calculated from OJIP curve. Both compounds were infiltrated on spinach leaf disk at three different concentrations 150 µM (■) and 300 µM (▲) respectively, and compared with the control leaf disc (dashed black line). The incubation time with the compounds for each treatment was 12 h and then adapted in the dark for 30 min.
Molecules 16 09939 g004
When the spinach leaf discs were treated with 3 (150 and 300 µM), the following phenomenological energy fluxes per excited cross section ABS/CS0, TR0/CS, and ET0/CS were reduced by 50% with both concentrations; these results indicate that PSII electron transport chain and pigment protein were damaged with compound 3, moreover, (dV/dt0) function was increased by 10 and 30%, respectively, with both concentrations, indicating that the PSII electron flow function worked with major efficiency. Other fluorescence parameters were not or slightly affected (Figure 4B). The parameters calculated from the fluorescence kinetic profiles showed an additional rapid appearance of the K-band at about 300 µs range (Figure 3B) induced with compound 3, therefore, its target is the water splitting enzyme which in normal conditions donates electrons to PSII by a reduction of its activity. This site is also targeted by other natural products such as pachypodol [11], labdane-8α,15-diol [16] and 1-O-acetyl-12,13-dihydroxanthorrhizol [17].
The results presented here allow us to conclude that 1 and 3 interact and inhibit the donor side of PSII in spinach leaf discs previously incubated for 12 h in the dark. The major effect of 1 and 3 on leaf disc fluorescence of chlorophyll a transient rather than in thylakoids indicates that these compounds are not metabolized and all of them might reach the target within the 12 h. This observations are supported due to the fact when the discs leaf were incubated for 30 min and 4 h with 300 µM of lupeol, or 50 µM of DCMU, in both cases they reached partially the inhibition site (see Figure 5), furthermore, with polarography studies using the thylakoids incubated with compounds by 1 (300 µM) and 7 min, the results show (Table 1) a major inhibition was at 7 min. suggesting that compounds 1 and 3 have difficulties to reach their targets, thus require more incubation to totally affect thylakoids’ light reaction activities.
Figure 5. Curves OJIP measured in leaf discs affected after 30 min. (panel A), 4 h (panel B) and 12 h (Panel C) of incubation with 300 µM lupeol (○) and 50 µM DCMU (△). Control (■). The data are the average of ten replicates.
Molecules 16 09939 g005

2.4. In Vivo Assays

To investigate if 1 and 3 inhibit plant growth and if they were metabolized in vivo, their effect on intact plant leaves of P. ixocarpa and L. perenne was tested using the fluorescence of Chl a technique. P. ixocarpa and L. perenne,dicot- and -monocot plants, were used to distinguish if the compounds have selectivity in inhibiting plant growth, due to differences in wax content, wall cell thickness, chemical composition or enzyme contents. The Chl a fluorescence transient were measured at 24, 48 and 72 h after treatment of leaves and compared with control. Compound 1 (150 µM) had no effect on fluorescence of Chl a kinetics at 24 h of treatment on P. ixocarpa plants, (Figure 6, Panel A). However, compound 1 (300 µM) caused a reduction in the absorption per reaction center (ABS/RC) by 9%, the absorption per cross section (ABS/CS0) by 15%, the trapping flux per cross section (TR0/CS) by 12% and PHI(D0) by 11%, but these results had non-significant values. When P. ixocarpa plants were treated for 48 h with compound 1 (300 µM) did not show any effect (Figure 6C). When we used 1 (150 µM) the dV/dt0 parameter was enhanced by 20%, indicating that PSII electron flow functioned with major efficiency (Figure 6C). Other fluorescence parameters were not affected or were slightly affected with non-significant values like ABS/RC by 10%, ET0/RC by 10%, TR0/RC by 10%, and cross section by 10 %. After treatment of P. ixocarpa plants with compound 1 (150 µM) for 72 h the following parameters increased by 30%: RC/CS0, ABS/CS0, TR0/CS0, ET0/CS0 (Figure 6, Panel E). The phenomenological fluxes are calculated as RC/CS0 = (ABS/CS0)/(ABS/RC) and with compound 1, 150 µM indicated that the energy flux function with major efficiency. The ET0/CS0 (calculated as = [1 − (F0/FM)](1 − VJ)F0) is the electron transport flux per cross section function with better efficiency in PSII electron flow.
Figure 6. Radar plot showed the effect of compounds 1 and 3 on different calculated parameters from OJIP curves measured on Physalis ixocarapa plants treated with 1 after 24 h (Panel A), 48 h (Panel C) and 72 h (Panel E) at two different concentrations of 1, 150 µM (■) and 300 µM (▲). Panels B, D and F showed the effect of 3 measured under the same conditions as 1.
Molecules 16 09939 g006
When the parameter Vt = (Ft − F0)/(FJ − F0) was calculated it showed a faster rise of the appearance of the K-band at about 300 μs (Figure 7A), which indicates that compound 1 (150 µM) inhibits the water splitting enzyme at the oxygen-evolving complex (OEC). Furthermore, at 72 h of treatment with 1 (300 µM) the appearance a greater K-band was more noticeable (Figure 7B).
Figure 7. Appearance of K-bands at 48 h (Panel A), and 72 h (panel B) on fluorescence of chlorophyll a of P: ixocarpa plants treated with 150 µM (■) and 300 µM (○) of (1). Panel C shows the appearance of K and I bans after 72 h of treatments with 3, 150 µM on P. ixocarpa plants.
Molecules 16 09939 g007
When P. ixocarpa plants were sprayed with compound 3 (150 and 300 μM), after 24 h of treatment the show some similar behavior as when treated with 1. The following parameters PHI(D0), ABS/RC, TR0/RC decreased quasi 11% and dV/dt0 by 25%. However, parameters such as ET0/RC, RC/CS0 and ET0/CS increased by 10% and PSI0 by 30% (Figure 6B). Moreover, at 48 h of treatment of P. ixocarpa plants with 3 (150 μM) some parameters values were increased more: ET0/RC, RC/CS0 and ET0/CS and with compound 3 (300 μM) the same parameters decreased. Other parameters also increased slightly: ABS/CS0, TR0/CS0and PHI(P0) (Figure 6D), and at 72 h of treatment with 3, 150 μM dV/dt0 was enhanced by 12% (Figure 6C) and it induced the appearance of the K and I bands (Figure 7, Panel C). These results confirm its inhibitor behavior at the water splitting enzyme as a target and a new interaction site appears the I-band around 20–30 ms. Oukarroum et al. [18] suggested that the appearance of an I-band is due to the heterogeneity of components such as QA and QB during the filling up the plastoquinone pool. Therefore, the target of compound 3 was located where PQH2 interact at its site on the b6f complex. This last site is also targeted by the natural product β-photogedunin acetate [19]. Chl a transients of L. perenne plants treated with 1, and 3 at 150 and 300 µM were not affected after 24, 48 and 72 h (data not shown). These results indicate that compounds 1 and 3 were selective to P. ixocarpa plants.

3. Experimental

3.1. General

3.1.1. Reagents

Adenosine diphosphateAdenosine triphosphateAscorbic acid
CaCl2Chloroform Ethyl acetate
2,5-Dibromo-6-isopropyl-3-methyl-1,4-benzoquinone2,5-Dichloro-1,4-benzoquinone2,6-Dichlorophenolindophenol
3-(3,4-Dichlorophenyl)-1,1-dimethylureaDimethyl sulfoxide (DMSO)Dithiothreitol (DTT)
Ethylenediaminetetraacetic acid (EDTA)n-HexaneN-[2-Hydroxyethyl]piperazine-N′-[2-ethanesulfonic acid]
Isopropyl alcoholKClKOH
MgCl2MethanolMethylviologen
NaClNaHCO3Na2SO4
2-(N-Morpholino)-ethanesulfonic acidPolyoxyethylensorbitan monolaurate (Tween-20)Silica-gel 60-230 mesh
Silica-gel HF 60Sodium silicomolybdate (SiMo)Sorbitol
SucroseTrichloacetic acid (TCA)Tricine

3.1.2. Equipment

Bruker DRX 400 (or 200) spectrometer for NMR experiments
Corning potentiometer model 12 (Corning Medical, Acton, MA, USA)
Gilson recorder (Kipp & Zonen, Bohemia, NY, USA)
Hansatech Fluorescence Handy PEA (plant efficiency analyzer)
Oxygraph YSI (Yellow Spring Instrument) Model 5300
Shimadzu QP-5050A Gas chromatography/Mass Spectrometry GC/MS, equipped with a PTE™-5 column (30 m, 0.25 mm, 0.25 µm, Supelco, USA)
Shimadzu QP5050A device for electron impact (70 eV) low-resolution mass spectra (EI-MS)

3.1.3. Methods

3.1.3.1. Plant Material

The leaves of M. acanthophylla were collected in April 2006 at Pé de Serra, Maracás, Bahia, Brazil. A voucher specimen (Collection No. OUPR-15532) was deposited in Herbário Professor José Badini, UFOP, Ouro Preto, Minas Gerais, Brazil. The leaves of Xylosma flexuosa (Flacourtiaceae) were collected in Zochipala-Leonardo Bravo, Guerrero, Mexico. A voucher specimen (SCME 056775) was deposited in the Herbario of Facultad de Ciencias, UNAM.

3.1.3.2. Extraction and Isolation from M. acanthophylla

The air-dried leaves of M. acanthophylla were ground to a powder (2.8 kg) and extracted by percolation for five days with five liters of n-hexane (followed by ethyl acetate and methanol, five liters each for three days); the organic soluble fractions were concentrated under reduced pressure and tested. The bioactivity was located in the hexane (39.0 g) and methanol (55.0 g) extracts. Samples of the hexane extract (20.5 g) were subjected to silica gel column chromatography (CC) eluted with mixtures of n-hexane-chloroform of increasing polarity to afford nine fractions. Fraction (F5) collected with n-hexane-chloroform (3:7 v/v) was purified twice by silica gel flash CC eluted with n-hexane-chloroform-isopropyl alcohol (90:9:1 v/v/v) to yield 3β-lup-20(29)-en-ol (lupeol, 1, 87.8 mg) and by re-crystallization with ethanol 96% yielded 3β-lup-20(29)-en-3-yl acetate (2, 592.3 mg). Gas chromatography (GC) and thin layer chromatography (TLC) analysis of the methanol extract indicated dulcitol as the primary constituent in the complex mixture which also contained phenolic compounds. The methanol extract (1.0 g) was acetylated [19] and partitioned into aqueous solution with ethyl acetate furnishing the dulcitol derivative 1,2,3,4,5,6-hexa-O-acetyldulcitol or dulcitol hexaacetate, 3 (400 mg). The structure elucidations of compounds 1, 2 and 3 (Figure 1) from M. acanthophylla was done by spectroscopic (IR-FT, 1D and 2D Nuclear Magnetic Resonance) and spectrometric data (MS/EI) and by comparison with literature data previously published [20,21,22].

3.1.3.3. Extraction and Isolation from Xylosma flexuosa

Air-dried aerial parts of Xylosma flexuosa (517 g) were ground into a powder and extracted exhaustively by maceration with n-hexane (1.5 L for three days) at room temperature. After filtration, the extract was concentrated in vacuo to yield 4.3 g of residue. The active n-hexane extract bioactivity measured on photophosphorylation showing an I50 (concentration producing 50% inhibition) of 79 ppm was subjected to column chromatography over silica gel (45 g) and eluted with a gradient of n-hexane-AcOEt. Four hundred and nineteen fractions (100 mL each) were collected and pooled on the basis of their TLC profiles to yield twelve major fractions (F1–F12). Bioactivities on the ATP synthesis for fractions F2, F3, F4, F5, F6, F9, 10, and F11 were tested; these fractions were obtained in enough amounts for the test and showed three active pools (F3, F4, and F10). F4 spontaneously precipitated (5 mg) as white crystals which were purified by crystallization with analytical reagent grade acetone (0.0562 g). The structure was established by its physical, spectroscopic (UV, IR, 1H- and 13C-NMR experiments), and spectrometric (GC-MS) data to afford the triterpene lup-20(29)-en-3β-ol (lupeol) [23]. F3 and F10 were obtained in small amounts and contain a mixture of compounds and were not further studied. The characterization of lupeol isolated from Xylosma flexuosa was carried out by comparison with the spectroscopic data from the literature [20].
Lup-20(29)-en-3β-ol (1): White crystalline powder (needles). M.p. 214–216 °C. IR-FT (KBr): 3550, 3400, 3295, 2920, 2850, 1640 (weak), 1455, 1380, 1040, 1015, 880. 1H-NMR (400 MHz; CDCl3) δ: 4.69 (br. d, 2.5 Hz, H-29b), 4,57 (dt, 2.5, 2.5 e 1.3 Hz, H-29a), 3.19 (dd, 11.0 e 5.0 Hz, H-3), 2.38 (dt, 11.0 e 5.8 Hz, H-19), 1.68 (br. dd, 1.3 e 0.8 Hz, H-30), 1.03 (s, H-26), 0.97 (s, H-23), 0.94 (br. d, 0.8 Hz, H-27), 0.83 (br. d, 0.8 Hz, H-25), 0.79 (s, H-28), 0.76 (s, H-24). 13C-NMR (100 MHz; CDCl3) δ: 0.96 (C-20), 109.32 (C-29), 79.01 (C-3), 55.32 (C-5), 50.46 (C-9), 48.33 (C-18), 47.78 (C-19), 43.01 (C-17), 42.85 (C-14), 40.85 (C-8), 40.02 (C-22), 38.87 (C-4), 38.73 (C-1), 38.07 (C-13), 37.19 (C-10), 35.60 (C-16), 34.30 (C-7), 29.87 (C-21), 28.00 (C-23), 27.46 (C-15), 27.43 (C-2), 25.17 (C-12), 20.95 (C-11), 19.32 (C-30), 18.33 (C-6), 18.01 (C-28), 16.12 (C-25), 15.99 (C-26), 15.37 (C-24), 14.56 (C-27). MS, m/z (%): 69 (100), 55 (72), 41 (64), 135 (52), 133 (34), 197 (28), 203 (26), 218 (26), 121 (44), 189 (40), 409 (1), 408 (1), 426 (1, M+, C30H50O).
3β-Lup-20(29)-en-3-yl acetate (2): White powder. M.p. 159–162 °C. IR-FT (KBr): 3070 (weak), 2920, 2850, 1735, 1640 (weak), 1455, 1380, 1370, 1250, 1010, 980, 880. 1H-NMR (400 MHz; CDCl3) δ: 4.69 (br. d, 3.0 Hz, H-29b), 4,57 (br. dt, 1.5, 1.5 e 0.8 Hz, H-29a), 4.47 (m, H-3), 2.37 (dt, 11.0 e 5.8 Hz, H-19), 2.04 (s, H-2′), 1.68 (br. s, H-30), 1.03 (s, H-26), 0.94 (s, H-27), 0.86 (s, H-25), 0.85 (s, H-23), 0.84 (s, H-24), 0.79 (s, H-28). 13C-NMR (100 MHz; CDCl3) δ: 171.01 (C-1′), 150.97 (C-20), 109.36 (C-29), 81,00 (C-3), 55.41 (C-5), 50.38 (C-9), 48.32 (C-18), 48.03 (C-19), 43.02 (C-17), 42.85 (C-14), 40.88 (C-8), 40.02 (C-22), 37.82 (C-4), 38.42 (C-1), 38.08 (C-13), 37.11 (C-10), 35.60 (C-16), 34.25 (C-7), 29.87 (C-21), 27.09 (C-23), 27.46 (C-15), 27.73 (C-2), 25.14 (C-12), 21,32 (C-2′), 20.97 (C-11), 19.31 (C-30), 18.23 (C-6), 18.02 (C-28), 16.51 (C-25), 16.00 (C-26), 16.19 (C-24), 14.52 (C-27). MS, m/z (%): 73 (100), 109 (55), 133 (34), 197 (28), 203 (23), 218 (15), 191 (44), 189 (44), 409 (1), 408 (2), 426 (4), 468 (3, M+, C32H52O2).
1,2,3,4,5,6-Hexa-O-acetyldulcitol (3): White powder. M.p. 168–170 °C. IR-FT (KBr): 3459, 2969 and 2955 (weak), 1747, 1376, 1247, 1227, 1084, 1053, 963, 608. 1H-NMR (200 MHz; CDCl3) δ: 5.36 (m, H-3 and H-4), 5.30 (m, H-2 and H-5), 4.28 (dd, 11.4, 4.4 Hz, H-1a and H-6a), 3.84 (dd, 11.4, 7.7 Hz, H-1b and H-6b), 2.11 (s, H-2′ and H-12′), 2.08 (s, H-6′ and H-8′), 2.02 (s, H-4′ and H-10’). 13C-NMR (50 MHz; CDCl3) δ: 170.46 (C-1′ and C-11′), 170.30 (C-3′ and C-9′), 169.78 (C-5′ and C-7′), 67.54 (C-2 and C-5), 67.45 (C-3 and C-4), 62.19 (C-1 and C-6), 20.72 (C-2′ and C-12′), 20.65 (C-4′ and C-10′), 20.58 (C-6′ and C-8′). MS, m/z (%):115 (100), 85 (46), 139 (52), 127 (42), 187 (43), 145 (33), 289 (25), 259 (16), 361 (6), 371 (5), 434 (2, M+, C18H26O12).

3.1.3.4. Chloroplast Isolation and Chlorophyll Determination

Intact chloroplasts were obtained from spinach leaves (Spinacea oleraceae L) purchased from the local market as previously described [9,16] were suspended in a small volume of the following solution: 400 mM sucrose, 5 mM MgCl2, 10 mM KCl, and 30 mM of the buffer tricine-KOH (pH 8.0). They were stored as a concentrated suspension in the dark for 1 h at 4 °C. The chlorophyll (Chl) concentration was measured according to Strain [24].

3.1.3.5. ATP Synthesis and Electron Flow Determinations

ATP synthesis was determined titrimetrically using a microelectrode (Orion model 8103; Ross, Beverly, MA, USA) connected to a Corning potentiometer model 12 (Corning Medical, Acton, MA, USA), with an expanded scale and a Gilson recorder (Kipp & Zonen, Bohemia, NY, USA) as previously reported [25]. Intact chloroplasts (20 μg Chl/mL) were broken before each assay by osmotic rupture in 3 mL of the non-buffered solution containing 100 mM sorbitol, 10 mM KCl, 5 mM MgCl2, 0.5 mM KCN, and 1 mM tricine-KOH at pH 8.0 in the presence of 50 μM methyl viologen (MV) and 1 mM adenosine triphosphate (ADP) at pH 6.7, and the pH was adjusted to 8.0 with 50 mM KOH. Alkalization rates were measured in the linear part during illumination. The reaction was calibrated by back-titration with saturated HCl and the ATP formed (μmol ATP mg–1·Chl h–1) was measured. Compounds at concentrations of 50, 100, 150, 200 and 300 μmol were prepared from 20 mM of stock solution, compounds were dissolved in dimethyl sulfoxide (DMSO).

3.1.3.6. Measurements of Non-Cyclic Electron Transport Rate

Light-induced non-cyclic electron transport activity from water to MV, was performed using a Clark type electrode connected to an Oxygraph YSI (Yellow Spring Instrument) Model 5300. Basal electron transport was determined by illuminating chloroplasts (20 μg Chl/mL) during 1 min in 3 mL of medium containing 100 mM sorbitol, 10 mM KCl, 5 mM MgCl2, 0.5 mM KCN, 50 μM MV and 15 mM tricine-KOH (pH 8.0) as previously described [9,16]. Phosphorylating non-cyclic electron transport rate was measured as basal electron transport from water to MV except that 1 mM ADP and 3 mM KH2PO4 were added. Uncoupled electron transport was tested in the medium for basal electron transport, and 6 mM NH4Cl was added as uncoupler.

3.1.3.7. Mg2+-ATPase Activity Assays

Chloroplasts were isolated from 30–40 g of spinach leaves, which were ground in 160 mL of medium containing 350 mM sorbitol, 5 mM ascorbic acid and 20 mM 2-(N-morpholino)-ethanesulfonic acid (MES) at pH 6.5. Chloroplasts were centrifuged at 3,000 g for 60 s, washed once in 40 mL of grinding medium, and re-suspended in 35 mM N-[2-hydroxyethyl]piperazine-N′-[2-ethanesulfonic acid] (HEPES) buffer (pH 7.6). Light-triggered Mg2+-ATPase activity associated to thylakoid membranes was measured as previously described [26], and released inorganic P was measured as reported [27].

3.1.3.8. Ca2+-ATPase Activity Assays

Chloroplasts were diluted with 0.75 mM EDTA pH 7.8 to a final concentration of 0.4 mg of chlorophyll per mL and allowed to sit for 10 min at room temperature. CF1 depleted membranes were then removed by centrifugation. This EDTA extract (0.5 mL) was added to a 20 mM tricine pH 8.0, 2 mM EDTA, 10 mM DTT, 40 mM ATP (0.5 mL), heated at 60 °C for 4 min. and 0.1 mL of this activated mixture was incubated for 20 min at 37 °C with 0.9 mL of a medium containing 50 mM Tris pH 8.4, 5 mM ATP [26]. Reaction was stopped with 2% TCA and determination of Pi was evaluated [27]. In this case three repetitions were tested.

3.1.3.9. Chlorophyll a Fluorescence Measurements in Spinach Leaf Discs

Chlorophyll a fluorescence was measured at room temperature with a Hansatech Fluorescence Handy PEA (plant efficiency analyzer) in dark-adapted spinach leaf discs (the physiological state of the leaf discs as dark adapted and standardized to kept the discs for 12 h in dark and light conditions before incubation with the compounds for 30 min in the dark using red light intensity (broad band 650 nm) of 3,000 µmol m–2 s–1, provided by an array of three light emitting diodes. The pulse duration was 2 s. Fifteen spinach leaf discs of 7 mm were placed in each Petri dishes with 10 mL of modified Krebs solution which contained: 115 mM NaCl, 5.9 mM KCl, 1.2 mM MgCl2, 1.2 mM KH2PO4, 1.2 mM Na2SO4, 2.5 mM CaCl2 and 25 mM NaHCO3 (pH = 7.4), the Petri dish were incubated for 12 h at room temperature. After this time for each Petri dish control DMSO was added in equal quantity that added to leaf disk treated with compounds. After this treatment, the leaf discs were dark adapted 30 min and immediately the chlorophyll fluorescence was measured. The OJIP transients were analyzed according to the JIP test. From the OJIP transient, the measured parameters were: Fluorescence intensity level at 50 μs when plastoquinone electron acceptor pool (QA) is fully oxidized (F0); Fluorescence level when QA is transiently fully reduced (Fm); variable component of fluorescence obtained by subtraction of F0 from the Fm value (FV). Different technical fluorescence photosynthetic parameters associated to PSII were obtained according to the equations of the O-J-I-P test [28,29,30]: (1) Derived parameters: VJ = (F2ms − F0)/(Fm − F0), relative variable fluorescence at the J step (2 ms); Vi = (F30ms − F0)/(Fm − F0), relative variable fluorescence at the I step; dV/dt0 = Mo = 4(F300µs − F0)/(Fm − F0), approximated initial slope (in ms−1) of the fluorescence transient V = f(t); (2) Specific energy fluxes (per QA reducing PSII center, RC): ABS/RC = (dV/dt0)(1/VJ)(1/PHI(P0), Absorption flux per reaction center; TR0/RC = (dV/dt0)(1/VJ), trapped energy flux per RC (at t = 0); ET0/RC = (dV/dt0)(1/VJ)PHI(P0), electron transport flux per RC (at t = 0); (3) Phenomenological energy fluxes per excited cross section (CS): ABS/CS0 = F0, absorption flux per CS, approximated by F0; TR0/CS0 = (ABS/CS0) [PHI(P0)], trapped energy flux per excited cross section (CS) at t = 0; ET0/CS0 = (ABS/CS0) [PHI(E0)], electron transport flux per excited CS; (4) Yields or flux ratios: PHI(P0) = TR0/ABS = 1 − F0/Fm, maximum quantum yield of primary photochemistry at t = 0; PSI0 = ET0/TR0 = (1 − VJ), probability at t = 0, that a trapped exciton moves an electron into the electron transport chain beyond QA; PHI(E0) = ET0/ABS = [1 − (F0/Fm)], quantum yield of electron transport; PHI(D0) = 1 − PHI(P0) = F0/Fm, quantum yield (at t = 0) of energy dissipation; dR/RC = RE0/ET0 = (1− VI)/(1 − VJ). W is the relative variable fluorescence between F0 and Fm calculated as Vt = FVt/(Fm − F0) = (Ft − F0)/(Fm − F0) and plotted. K-band is calculated from WOJ, it is the relative variable fluorescence between F0 and FJ and VOJ(t) = FVt/(FJ − F0) = (Ft − F0)/(FJ − F0) [30].

3.1.3.10. Plant Material for in Vivo Assays

The seeds of Physalis ixocarpa and Lolium perenne, a weed species, were sown in 12 cm diameter pots and were watered daily in the greenhouse at 25 to 30 °C. After 15 and 18 days of emergence for P. ixocarpa and L. perenne, respectively, the plants were selected for similar size and were sprayed manually with the compounds 1 and 3 at concentrations of 150 and 300 µM (one stock of 20 mM of each compound was prepared in DMSO). An aliquot of this solution was taken to obtain the desired concentration in an aqueous suspension containing 0.05% w/v of polyoxyethylene sorbitan monolaurate . The control group was sprayed with distilled water containing the same amount of DMSO and Tween-20.

3.1.3.11. Chlorophyll a Fluorescence Determination in Intact Leaves in Vivo

This was performed at room temperature with a portable Handy PEA apparatus [31], from the dark adapted for 15 min leaves, of control and treated plants, 24, 40 and 72 h after spraying with the compounds.

4. Conclusions

In conclusion, compound 1 interacts with H+-ATPase in thylakoids and acts as an energy coupling inhibitor when incubated for one minute. Further incubation time (7 min) of thylakoids with compound increases the inhibition activity. Furthermore, the fluorescence of chlorophyll a measured on spinach leaf disc incubated with 1 for 12 h induces the appearance of “heat sink centers” or silent reaction centers unable to reduce QA, thus 1 inhibits donor site of PSII. Moreover, in P. ixocarpa leaves in vivo 150 µM 1 induced the appearance of the K band only at 48, and 72 h after treatment, thus interacting at the water splitting enzyme too. In the other hand, compound 3 acts as a Hill reaction inhibitor on thylakoids as determined by oxygen evolution, and when its activity was measured on spinach leaf disc by fluorescence, it induced the appearance of the K band indicating that it inhibits the water splitting enzyme. When P. ixocarpa plants were sprayed with 3 it induces the appearance K and I bands after 72 h of treatment indicating two targets of interaction, one at the OEC complex and the second at the PQH2 (plastoquinone pool) site, the b6f complex.

Acknowledgments

This work was supported by Fundação de Amparo à Pesquisa do Estado de Minas Gerais (FAPEMIG), Conselho Nacional de Desenvolvimento Científico e Tecnológico (CNPq), Brazil. The photosynthetic study was financed by the grant IN 211309 from DGAPA, UNAM and the PAIP of Facultad de Química, UNAM.

References and Notes

  1. Carvalho-Okano, R.M. Estudos taxonômicos do gênero Maytenus Mol: emend. Mol. (Celastraceae) do Brasil Extra-Amazônico. Ph.D. Thesis,, Instituto de Biologia, UNICAMP, 1992; p. 252. [Google Scholar]
  2. Biodiversitas Revisăo das listas das espécies da flora e da fauna ameaçadas de extinção do estado de Minas gerais – relatório final; Fundação bBiodiversitas: Belo Horizonte, Brazil, 2007; Volume 2.
  3. de Oliveira, D.M.; Silva, G.; Duarte, L.P.; Vieira, A.S. Chemical constituents isolated from roots of Maytenus acanthophylla Reissek (Celastraceae). Biochem. System. Ecol. 2006, 34, 661–665. [Google Scholar] [CrossRef]
  4. Morales, F.; Fonseca, R.M.; Diego, P. Flora de Guerrero. Rev de la Fac de Ciencias, UNAM, México. 2002, 9, 109–110. [Google Scholar]
  5. Gibbons, S.; Gray, A.I.; Waterman, P.G.; Hockless, D.C.R.; Skelton, B.W.; White, A.H. Beonxoylated derivatives od 2-neta.glucopyranosyloxy-2,5-dihydroxybenzyl alcohol from Xylosma flexuosum: Structure and relative configuration of xylosmin. J. Nat. Prod. 1995, 58, 554–559. [Google Scholar] [CrossRef]
  6. Macias, F.A.; Molinillo, J.M.G.; Galindo, J.C.G.; Varela, R.M.; Simonet, A.M. Castellano, D. The use of allelophatic Studies in the search for natural herbicides. J. Crop Prod. 2001, 4, 237–255. [Google Scholar] [CrossRef]
  7. Macias, F.A.; Molinillo, J.M.G.; Galindo, J.C.G.; Varela, R.M.; Torres, A.; Simonet, A.M. Terpenoids with potencial use as natural herbicide templates. In Biologically Active Natural Products: Agrochemicals; Cutler, H.G., Cutler, S.J., Eds.; CRC Press: Boca Raton, FL, USA, 1999; pp. 15–31. [Google Scholar]
  8. King-Díaz, B.; Castelo-Branco, P.A.; Leite dos Santos, F.J.; Rubinger, M.M.M.; Ferreira-Alves, D.L.; Piló-Veloso, D.; Lotina-Hennsen, B. Furanoditerpene ester and thiocarbonyldioxy derivatives inhibit photosynthesis. Pestic. Biochem. Physiol. 2010, 96, 119–126. [Google Scholar] [CrossRef]
  9. Torres-Romero, D.; King-Díaz, B.; Strasser, R.J.; Jiménez, I.A.; Lotina-Hennsen, B.; Bazzocchi, I.L. Friedelane triterpenes from Celastrus vulcanicola as Photosynthetic Inhibitors. J. Agric. Food Chem. 2010, 58, 10847–10854. [Google Scholar]
  10. Strasser, R.J.; Srivastava, A.; Govindjee. Polyphasic chlorophyll a fluorescence transients in plants and cyanobacteria. Photochem. Photobiol. 1995, 61, 32–42. [Google Scholar] [CrossRef]
  11. Vázquez, R.; King-Díaz, B.; Aguilar, M.I.; Diego, N.; Lotina-Hennsen, B. Pachypodol from Croton ciliatoglanduliferus Ort as water-splitting enzyme inhibitor on thylakoids. J. Agric. Food Chem. 2006, 54, 1217–1221. [Google Scholar] [CrossRef]
  12. McCarthy, R.E. Energy Transfer inhibitors of photophosphorylation in chloroplasts. In Encyclopedia of Plant Physiology New Series, Chapter 12. Photosynthesis; Trebst, A., Avron, M., Eds.; Springer-Verlag: Berlin, Germany, 1977; Volume 5, pp. 437–447. [Google Scholar]
  13. Srivastava, A.; Guisse, B.; Greppin, H.; Strasser, R.J. Regulation of antenna structure and electron transport in PSII of Pisumsativum under elevated temperature probed by the fast polyphasic chlorophyll a fluorescence transient OKJIP. Biochim. Biophys. Acta 1320, 95–106. [Google Scholar]
  14. Guisse, B.; Srivastava, A.; Strasser, R.J. The polyphasic rise of the chlorophyll a fluorescence (O–K–J–I–P) in heat stressed leaves. Arch. Sci. Geneve 1995, 48, 147–160. [Google Scholar]
  15. Morales-Flores, F.; Aguilar, M.I.; King-Díaz, B.; de Santiago-Gómez, J.-R.; Lotina-Hennsen, B. Natural diterpenes from Croton ciliatoglanduliferus as photosystem II and photosystem I inhibitors as spinach chloroplasts. Photosynth. Res. 2007, 91, 71–80. [Google Scholar] [CrossRef]
  16. González-Bernardo, E.; Aguilar, M.I.; Delgado, G.; King-Díaz, B.; Lotina-Hennsen, B. Photosynthetic electron transport interaction of xanthorrhizol isolated from Iostephane heterophylla and its derivatives. Physiol. Plant. 2003, 119, 598–604. [Google Scholar] [CrossRef]
  17. Oukarroum, A.; El Madidi, S.; Strasser, R.J. Drougth stress induced in barley cultivars (Hordeum vulgare L.) by polyethylene glycol, probed by the fast fluorescence rise OJIP, germination and root length. Arch. Sci. Genève 2006, 59, 20–21. [Google Scholar]
  18. Strasser, B.J. Donor side capacity of Photosystem II probed by chlorophyll a fluorescence transients. Photosyn.Res. 1997, 52, 147–155. [Google Scholar] [CrossRef]
  19. Céspedes, C.L.; Calderón, J.S.; King-Díaz, B.; Lotina-Hennsen, B. Phytochemical and biochemical characterization of epimeric photogedunin derivatives. Their different sites of interaction on the redox electron transport carrier of Spinaceae oleracea L. chloroplasts. J. Agric. Food Chem. 1998, 46, 2810–2816. [Google Scholar]
  20. Burns, D.; Reynolds, W.F.; Buchanan, G.; Reese, P.B.; Enriquez, R.G. Assignment of spectra and investigation of hindered side-chain rotation in lupeol derivatives. Magn. Reson. Chem. 2000, 38, 488–493. [Google Scholar]
  21. Silva, J.R.D.A.; Rezende, C.M.; Pinto, A.C.; Pinheiro, M.L.B.; Cordeiro, M.C.; Tamborini, E.; Young, C.; Bolzani, V.D.S. Ésteres triterpénicos de Himatanthus succuba (Spruce) Woodson. Quím. Nova 1998, 21, 702–704. [Google Scholar] [CrossRef]
  22. Angyal, S.J.; Fur, R.L. The 13C-NMR espectra of alditols. Carbohyd. Res. 1980, 84, 201–209. [Google Scholar] [CrossRef]
  23. Atta-ur, R. Handbook of Natural Products. Pentacyclic Triterpenoids; Elsevier: Amsterdam, The Netherlands, 1994; pp. 1038–1040. [Google Scholar]
  24. Strain, H.H.; Cope, B.T.; Svec, W.A. Analytical procedures for the isolation, identification, estimation and investigation of the chlorophylls. Meth. Enzymol. 1971, 23, 452–276. [Google Scholar] [CrossRef]
  25. Dilley, R.A. Ion transport (H+, K+, Mg2+ exchange phenomena). Methods. Enzymol. 1972, 24, 68–74. [Google Scholar] [CrossRef]
  26. Mills, J.D.; Mitchell, P.; Schurrmann, P. Modulation of coupling ATPase activity in intact chloroplasts. FEBS Lett. 1980, 112, 173–177. [Google Scholar] [CrossRef]
  27. Sumner, J.B. Scientific apparatus and laboratory methods. A method for the colorimetric determination of phosphorus. Science 1944, 100, 413–418. [Google Scholar]
  28. Aguilar, M.I.; Romero, M.G.; Chávez, M.I.; King-Díaz, B.; Lotina-Hennsen, B. Biflavonoids isolated from Selaginella lepidophylla inhibit photosynthesis in spinach chloroplasts. J. Agric. Food Chem. 2008, 56, 6994–7000. [Google Scholar]
  29. Panda, D.; Rao, D.N.; Sharma, S.G.; Strasser, R.J.; Sarkar, R.K. Subemergence effects on rice genotypes during seedling stage: Probing of subemergence driven changes of photosystem II by chlorophyll a fluorescence induction O-J-I-P transients. Photosynthetica 2006, 44, 69–75. [Google Scholar] [CrossRef]
  30. Jiang, H.-X.; Chen, L.-S.; Zheeng, J.-G.; Han, S.; Tang, N.; Smith, B.R. Aluminum-induced effects on photosystem II photochemistry in Citrus leaves assessed by the chlorophyll a fluorescence transient. Tree Physiol. 2008, 28, 1863–1871. [Google Scholar] [CrossRef]
  31. González-Ibarra, M.; Farfán, N.; Trejo, C.; Uribe, S.; Lotina-Hennsen, B. Selective herbicide activity of 2,5-di(benzylamine)-p-benzoquinone against the monocot weed Echinochloa crusgalli. An in vivo analysis of photosynthesis and growth. J. Agric. Food Chem. 2005, 53, 3415–3420. [Google Scholar]
  • Samples Availability: Not available.

