Analysis of Protein Pathway Networks Using Hybrid Properties


Abstract
:1. Introduction
2. Materials and Methods
2.1. Materials
2.2. Features

| Properties | C | T | D | Total |
|---|---|---|---|---|
| Normalized van der Waals volume | 3 | 3 | 15 | 21 |
| Polarity | 3 | 3 | 15 | 21 |
| Polarizability | 3 | 3 | 15 | 21 |
| Secondary structure | 3 | 3 | 15 | 21 |
| Solvent accessibility | 1 | 1 | 5 | 7 |
| Amino acid composition | 20 | --- | --- | 20 |
| Total | --- | --- | --- | 132 |
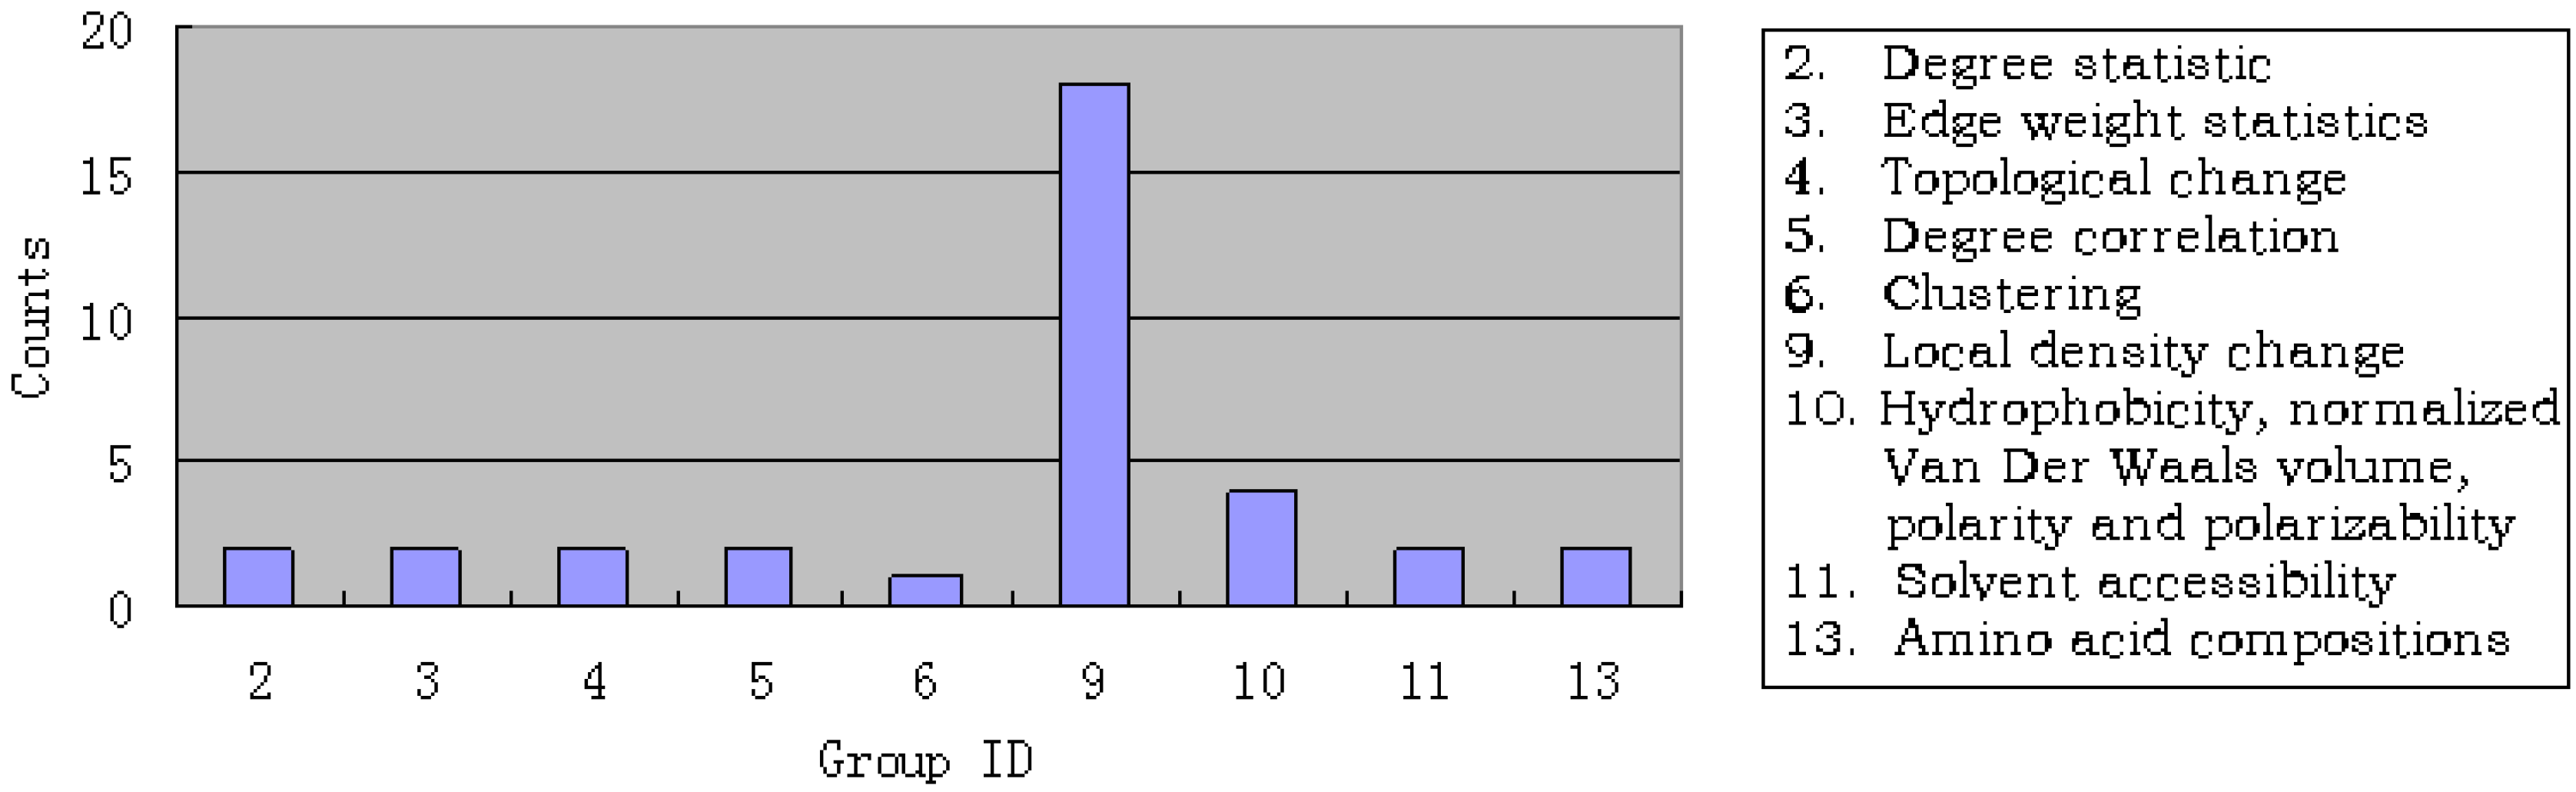
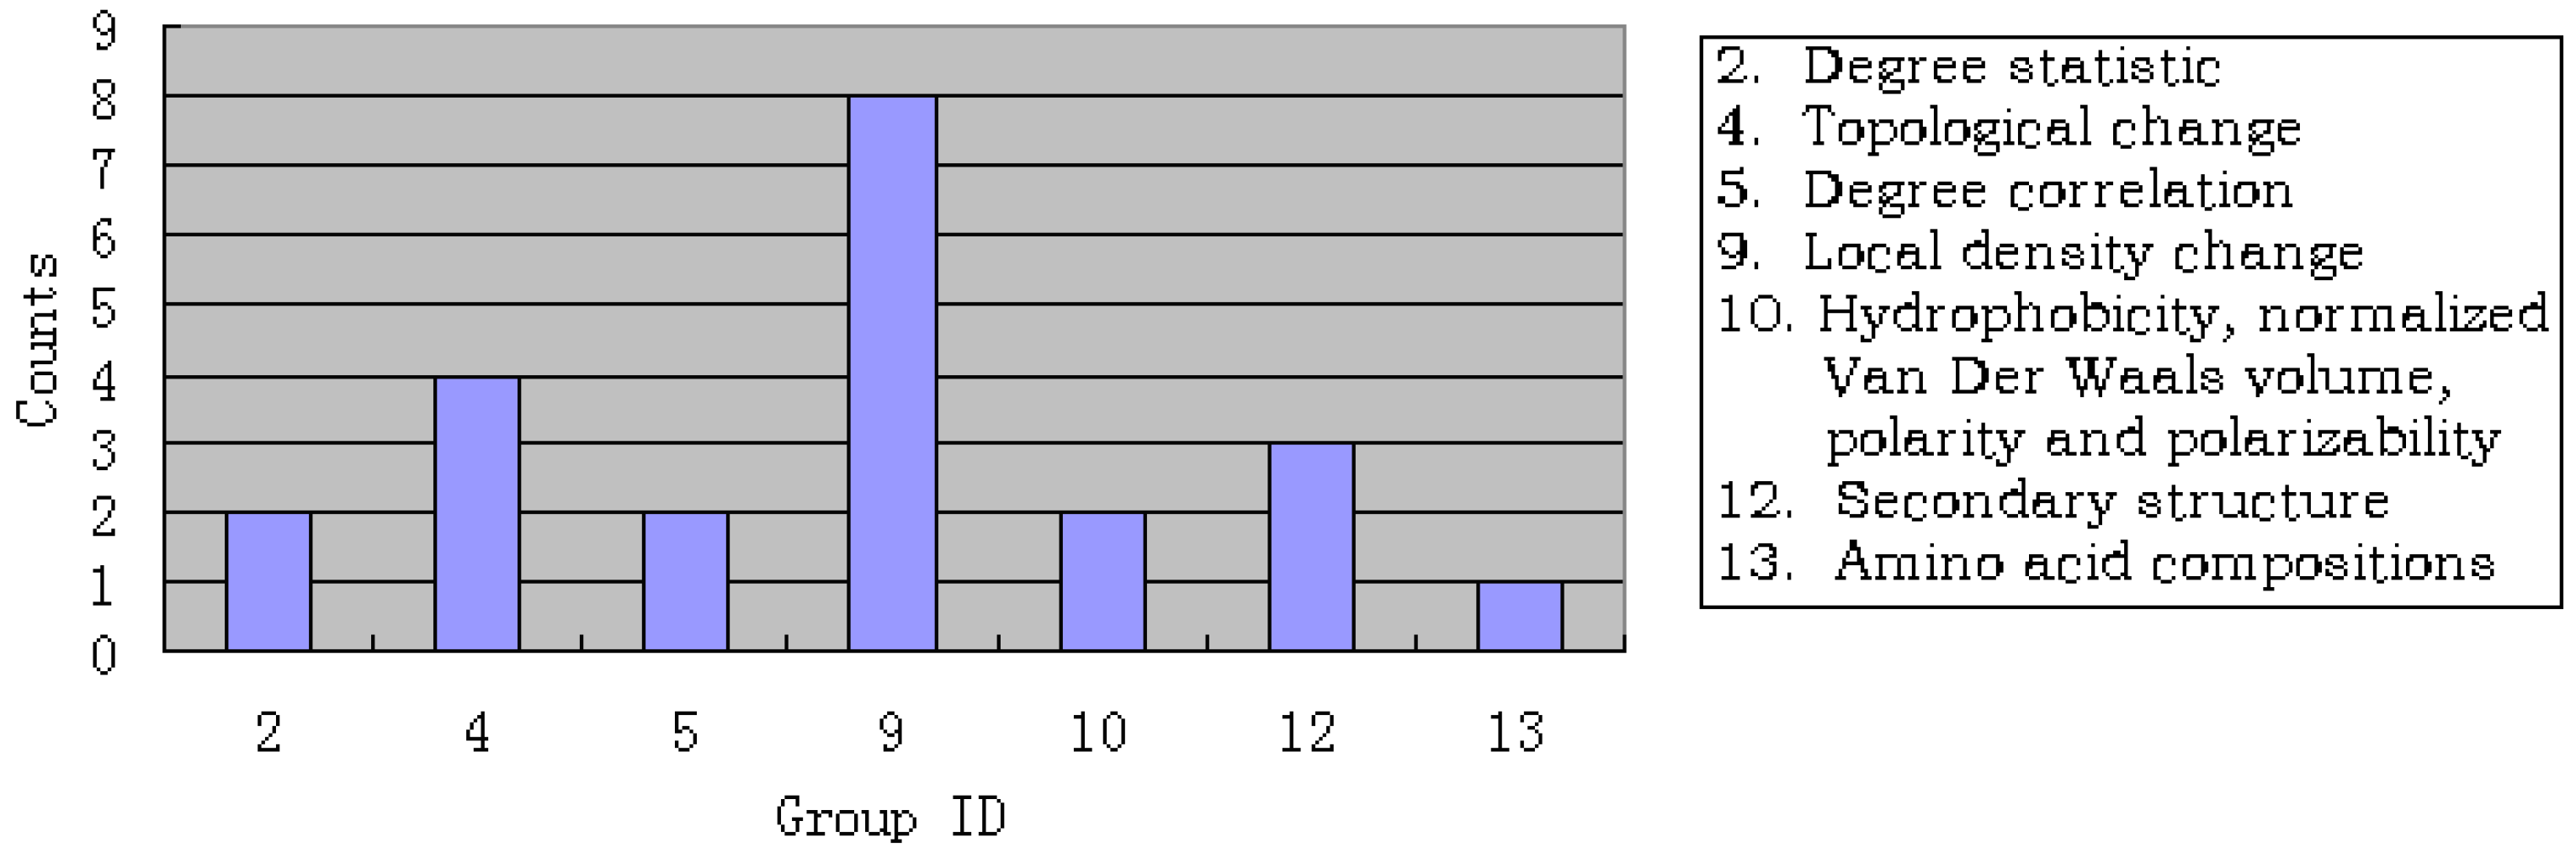
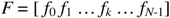
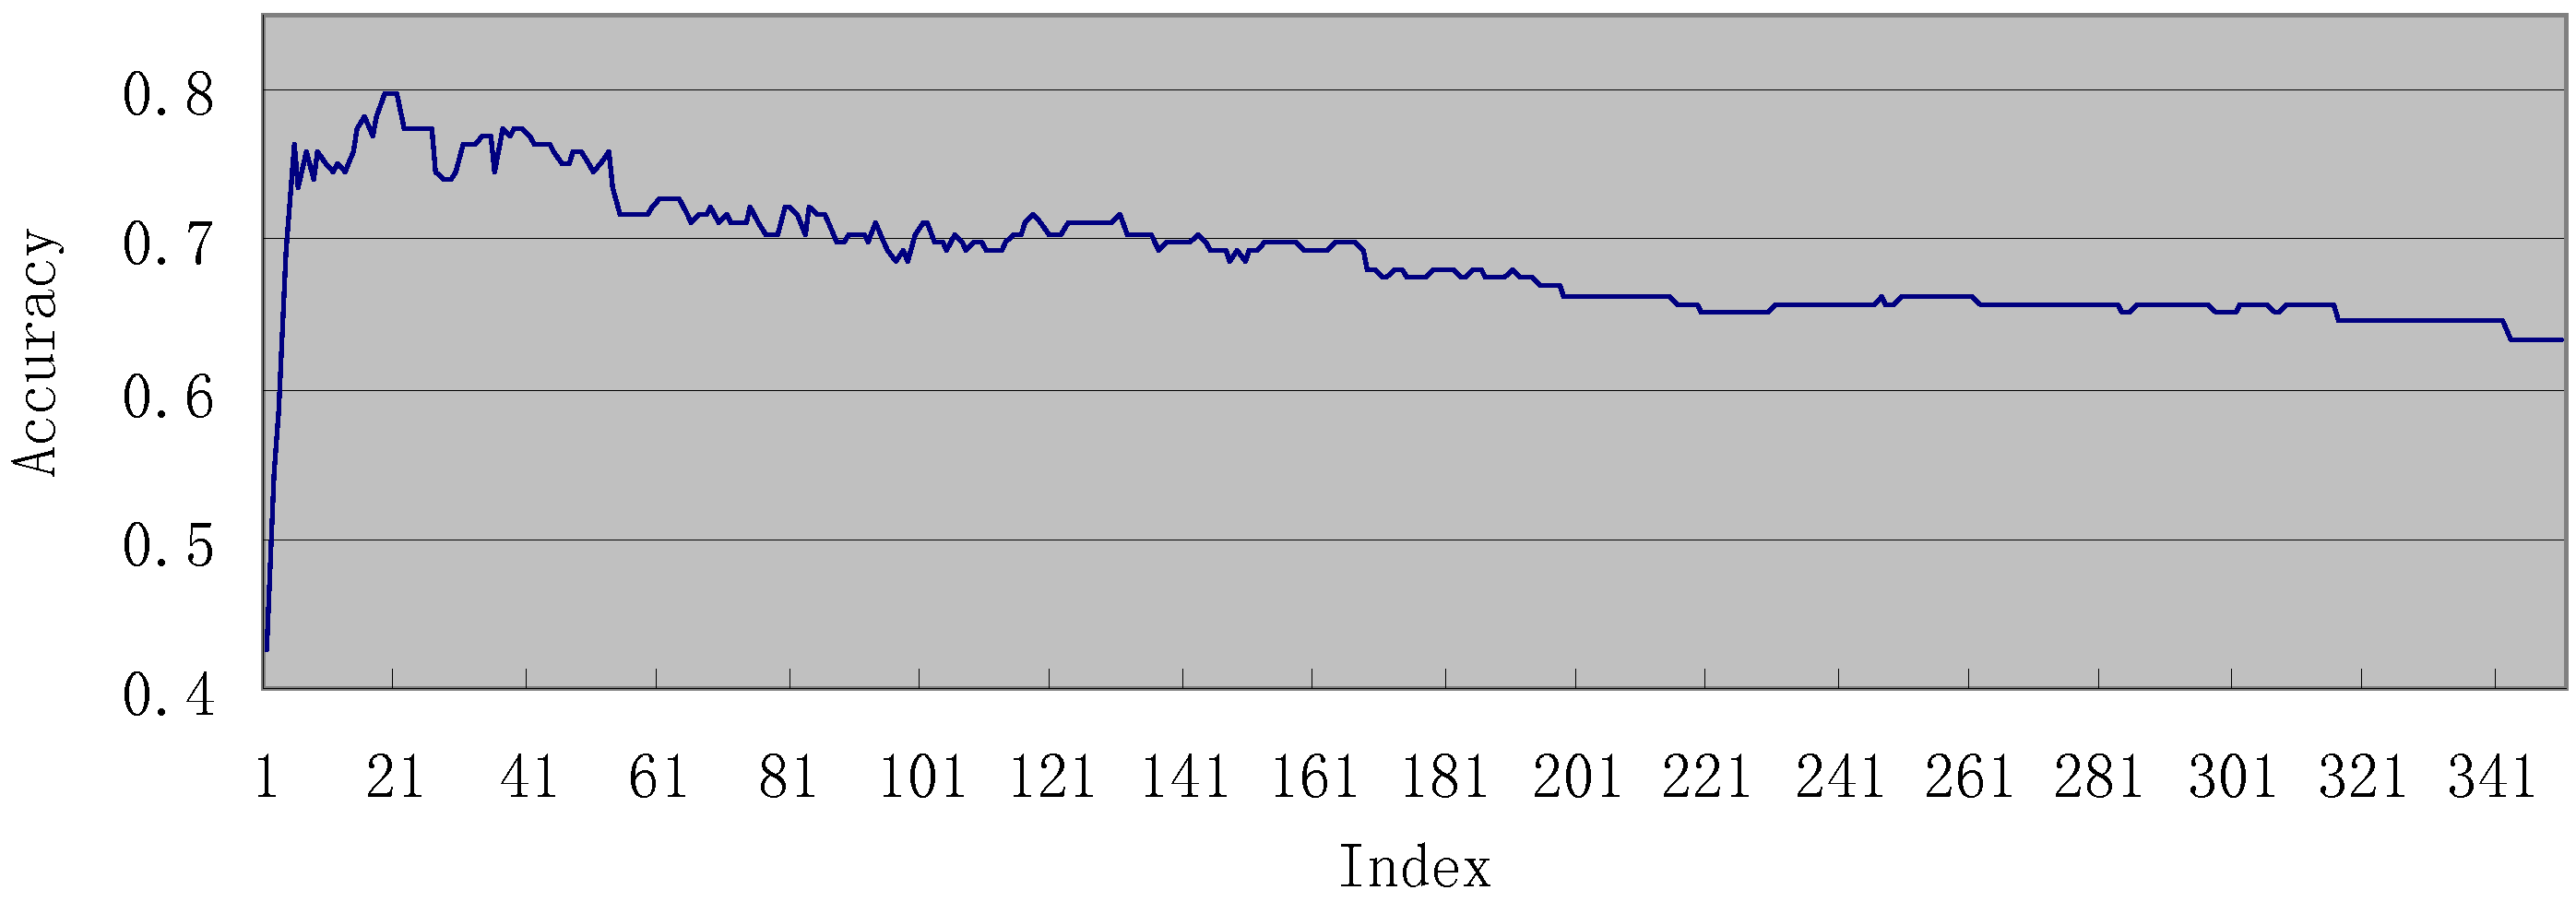
| Group ID | Group Name | Number of features |
|---|---|---|
| 1 | Graph size and graph density | 2 |
| 2 | Degree statistic | 8 |
| 3 | Edge weight statistics | 4 |
| 4 | Topological change | 7 |
| 5 | Degree correlation | 6 |
| 6 | Clustering | 6 |
| 7 | Topological | 12 |
| 8 | Singular values | 3 |
| 9 | Local density change | 40 |
| 10 | Hydrophobicity, normalized van der Waals volume, polarity and polarizability | 4 × 2 × 21 = 168 |
| 11 | Solvent accessibility | 7 × 2 = 14 |
| 12 | Secondary structure | 2 × 21 = 42 |
| 13 | Amino acid compositions | 2 × 20 = 40 |


2.3. Gene ontology


2.4. Minimum redundancy maximum relevance (mRMR)


2.5. Nearest neighbor algorithm

2.6. Jackknife cross-validation
2.7. Incremental feature selection (IFS)
3. Results and Discussion
3.1. Results of mRMR
3.2. Results of IFS
3.3. Analysis of the important features
4. Conclusions
Supplementary Materials
Supplementary File 1Supplementary File 2Supplementary File 3Supplementary File 4Supplementary File 5Acknowledgements
References
- Kanehisa, M. A database for post-genome analysis. Trends Genet. 1997, 13, 375–376. [Google Scholar] [CrossRef]
- Ogata, H.; Goto, S.; Sato, K.; Fujibuchi, W.; Bono, H.; Kanehisa, M. KEGG: Kyoto encyclopedia of genes and genomes. Nucl. Acid. Res. 1999, 27, 29–34. [Google Scholar] [CrossRef]
- Bairoch, A. The ENZYME data bank. Nucl. Acid. Res. 1994, 22, 3626–3627. [Google Scholar] [CrossRef]
- Schomburg, I.; Chang, A.; Hofmann, O.; Ebeling, C.; Ehrentreich, F.; Schomburg, D. BRENDA: a resource for enzyme data and metabolic information. Trends Biochem. Sci. 2002, 27, 54–56. [Google Scholar] [CrossRef]
- Schomburg, I.; Chang, A.; Schomburg, D. BRENDA, enzyme data and metabolic information. Nucl. Acid. Res. 2002, 30, 47–49. [Google Scholar] [CrossRef]
- Krieger, C.; Zhang, P.; Mueller, L.; Wang, A.; Paley, S.; Arnaud, M.; Pick, J.; Rhee, S.; Karp, P. MetaCyc: a multiorganism database of metabolic pathways and enzymes. Nucl. Acid. Res. 2004, 32, D438–D442. [Google Scholar] [CrossRef]
- Kanehisa, M.; Goto, S. KEGG: Kyoto encyclopedia of genes and genomes. Nucl. Acid. Res. 2000, 28, 27–30. [Google Scholar] [CrossRef]
- Kanehisa, M.; Araki, M.; Goto, S.; Hattori, M.; Hirakawa, M.; Itoh, M.; Katayama, T.; Kawashima, S.; Okuda, S.; Tokimatsu, T. KEGG for linking genomes to life and the environment. Nucl. Acid. Res. 2008, 36, D480–D484. [Google Scholar]
- Klukas, C.; Schreiber, F. Dynamic exploration and editing of KEGG pathway diagrams. Bioinformatics 2007, 23, 344–350. [Google Scholar] [CrossRef]
- Pharkya, P.; Nikolaev, E.; Maranas, C. Review of the BRENDA Database. Metab. Eng. 2003, 5, 71–73. [Google Scholar] [CrossRef]
- Caspi, R.; Foerster, H.; Fulcher, C.; Hopkinson, R.; Ingraham, J.; Kaipa, P.; Krummenacker, M.; Paley, S.; Pick, J.; Rhee, S. MetaCyc: A multiorganism database of metabolic pathways and enzymes. Nucl. Acid. Res. 2006, 34, D511–D516. [Google Scholar] [CrossRef]
- Caspi, R.; Foerster, H.; Fulcher, C.; Kaipa, P.; Krummenacker, M.; Latendresse, M.; Paley, S.; Rhee, S.; Shearer, A.; Tissier, C. The MetaCyc Database of metabolic pathways and enzymes and the BioCyc collection of Pathway/Genome Databases. Nucl. Acid. Res. 2008, 36, D623–D631. [Google Scholar]
- Zhou, G.P.; Assa-Munt, N. Some insights into protein structural class prediction. Protein. Struct. Funct. Genet. 2001, 44, 57–59. [Google Scholar] [CrossRef]
- Chou, K.C.; Zhang, C.T. Prediction of protein structural classes. Crit. Rev. Biochem. Molec. Biol. 1995, 30, 275–349. [Google Scholar] [CrossRef]
- Zhou, G.P.; Troy, F.A. NMR studies on how the binding complex of polyisoprenol recognition sequence peptides and polyisoprenols can modulate membrane structure. Curr. Protein Pept. Sci. 2005, 6, 399–411. [Google Scholar] [CrossRef]
- Chou, K.C. Review: Structural bioinformatics and its impact to biomedical science. Curr. Med. Chem. 2004, 11, 2105–2134. [Google Scholar] [CrossRef]
- Sharma, A.K.; Zhou, G.P.; Kupferman, J.; Surks, H.K.; Christensen, E.N.; Chou, J.J.; Mendelsohn, M.E.; Rigby, A.C. Probing the interaction between the coiled coil leucine zipper of cGMP-dependent protein kinase Ialpha and the C terminus of the myosin binding subunit of the myosin light chain phosphatase. J. Biol. Chem. 2008, 283, 32860–32869. [Google Scholar]
- Zhou, G.P.; Surks, H.K.; Schnell, J.R.; Chou, J.J.; Mendelsohn, M.E.; Rigby, A.C. The Three-Dimensional Structure of the cGMP-Dependent Protein Kinase I-α Leucine Zipper Domain and Its Interaction with the Myosin Binding Subunit. Blood 2004, 104, 963. [Google Scholar]
- Zhou, G.Q.; Zhong, W.Z. Diffusion-controlled reactions of enzymes. A comparison between Chou's model and Alberty-Hammes-Eigen's model. Eur. J. Biochem. 1982, 128, 383–387. [Google Scholar]
- Chou, K.C.; Zhou, G.P. Role of the protein outside active site on the diffusion-controlled reaction of enzyme. J. Amer. Chem. Soc. 1982, 104, 1409–1413. [Google Scholar] [CrossRef]
- Zhou, G.P.; Li, T.T.; Chou, K.C. The flexibility during the juxtaposition of reacting groups and the upper limits of enzyme reactions. Biophys. Chem. 1981, 14, 277–281. [Google Scholar] [CrossRef]
- Zhou, G.Z.; Wong, M.T.; Zhou, G.Q. Diffusion-controlled reactions of enzymes. An approximate analytic solution of Chou's model. Biophys. Chem. 1983, 18, 125–132. [Google Scholar] [CrossRef]
- Qi, J.P.; Ding, Y.S.; Shao, S.H.; Zeng, X.H.; Chou, K.C. Cellular responding kinetics based on a model of gene regulatory networks under radiotherapy. Health 2010, 2, 137–146, (openly accessible at http://www.scirp.org/journal/Health/). Available online: http://www.scirp.org/journal/Health/). [Google Scholar] [CrossRef]
- Qi, J.P.; Shao, S.H.; Li, D.D.; Zhou, G.P. A dynamic model for the p53 stress response networks under ion radiation. Amino Acids 2007, 33, 75–83. [Google Scholar] [CrossRef]
- Zhou, G.P. Biological functions of soliton and extra electron motion in DNA structure. Phys. Scr. 1989, 40, 698–701. [Google Scholar] [CrossRef]
- Chou, K.C. Review: Low-frequency collective motion in biomacromolecules and its biological functions. Biophys. Chem. 1988, 30, 3–48. [Google Scholar] [CrossRef]
- Chou, K.C. The biological functions of low-frequency phonons: 6. A possible dynamic mechanism of allosteric transition in antibody molecules. Biopolymers 1987, 26, 285–295. [Google Scholar] [CrossRef]
- Zhou, G.P.; Cai, Y.D. Predicting protease types by hybridizing gene ontology and pseudo amino acid composition. Protein. Struct. Funct. Genet. 2006, 63, 681–684. [Google Scholar] [CrossRef]
- Chou, K.C.; Shen, H.B. ProtIdent: A web server for identifying proteases and their types by fusing functional domain and sequential evolution information. Biochem. Biophys. Res. Comm. 2008, 376, 321–325. [Google Scholar] [CrossRef]
- Cai, Y.D.; Zhou, G.P.; Chou, K.C. Support vector machines for predicting membrane protein types by using functional domain composition. Biophys. J. 2003, 84, 3257–3263. [Google Scholar] [CrossRef]
- Chou, K.C.; Shen, H.B. MemType-2L: A Web server for predicting membrane proteins and their types by incorporating evolution information through Pse-PSSM. Biochem. Biophys. Res. Commun. 2007, 360, 339–345. [Google Scholar] [CrossRef]
- Chou, K.C. A vectorized sequence-coupling model for predicting HIV protease cleavage sites in proteins. J. Biol. Chem. 1993, 268, 16938–16948. [Google Scholar]
- Chou, K.C. Review: Prediction of HIV protease cleavage sites in proteins. Anal. Biochem. 1996, 233, 1–14. [Google Scholar] [CrossRef]
- Chou, K.C. Review: Prediction of protein signal sequences. Curr. Protein Pept. Sci. 2002, 3, 615–622. [Google Scholar] [CrossRef]
- Chou, K.C.; Shen, H.B. Signal-CF: A subsite-coupled and window-fusing approach for predicting signal peptides. Biochem. Biophys. Res. Commun. 2007, 357, 633–640. [Google Scholar] [CrossRef]
- Chou, K.C.; Forsen, S. Graphical rules for enzyme-catalyzed rate laws. Biochem. J. 1980, 187, 829–835. [Google Scholar]
- Myers, D.; Palmer, G. Microcomputer tools for steady-state enzyme kinetics. Bioinformatics 1985, 1, 105–110. [Google Scholar] [CrossRef]
- Zhou, G.P.; Deng, M.H. An extension of Chou's graphical rules for deriving enzyme kinetic equations to system involving parallel reaction pathways. Biochem. J. 1984, 222, 169–176. [Google Scholar]
- Chou, K.C. Graphic rules in steady and non-steady enzyme kinetics. J. Biol. Chem. 1989, 264, 12074–12079. [Google Scholar]
- Andraos, J. Kinetic plasticity and the determination of product ratios for kinetic schemes leading to multiple products without rate laws: New methods based on directed graphs. Can. J. Chem. 2008, 86, 342–357. [Google Scholar] [CrossRef]
- Chou, K.C. Review: Applications of graph theory to enzyme kinetics and protein folding kinetics. Steady and non-steady state systems. Biophys. Chem. 1990, 35, 1–24. [Google Scholar] [CrossRef]
- Althaus, I.W.; Chou, J.J.; Gonzales, A.J.; Diebel, M.R.; Chou, K.C.; Kezdy, F.J.; Romero, D.L.; Aristoff, P.A.; Tarpley, W.G.; Reusser, F. Kinetic studies with the nonnucleoside HIV-1 reverse transcriptase inhibitor U-88204E. Biochemistry 1993, 32, 6548–6554. [Google Scholar]
- Althaus, I.W.; Chou, J.J.; Gonzales, A.J.; Diebel, M.R.; Chou, K.C.; Kezdy, F.J.; Romero, D.L.; Aristoff, P.A.; Tarpley, W.G.; Reusser, F. Steady-state kinetic studies with the non-nucleoside HIV-1 reverse transcriptase inhibitor U-87201E. J. Biol. Chem. 1993, 268, 6119–6124. [Google Scholar]
- Althaus, I.W.; Gonzales, A.J.; Chou, J.J.; Diebel, M.R.; Chou, K.C.; Kezdy, F.J.; Romero, D.L.; Aristoff, P.A.; Tarpley, W.G.; Reusser, F. The quinoline U-78036 is a potent inhibitor of HIV-1 reverse transcriptase. J. Biol. Chem. 1993, 268, 14875–14880. [Google Scholar]
- Chou, K.C.; Kezdy, F.J.; Reusser, F. Review: Steady-state inhibition kinetics of processive nucleic acid polymerases and nucleases. Anal. Biochem. 1994, 221, 217–230. [Google Scholar]
- Chou, K.C. Graphic rule for drug metabolism systems. Curr. Drug Metabol. 2010, 11, 369–378. [Google Scholar] [CrossRef]
- Perez-Montoto, L.G.; Santana, L.; Gonzalez-Diaz, H. Scoring function for DNA-drug docking of anticancer and antiparasitic compounds based on spectral moments of 2D lattice graphs for molecular dynamics trajectories. Eur. J. Medicinal Chem. 2009, 44, 4461–4469. [Google Scholar] [CrossRef]
- Gonzalez-Diaz, H.; Perez-Montoto, L.G.; Duardo-Sanchez, A.; Paniagua, E.; Vazquez-Prieto, S.; Vilas, R.; Dea-Ayuela, M.A.; Bolas-Fernandez, F.; Munteanu, C.R.; Dorado, J.; Costas, J.; Ubeira, F.M. Generalized lattice graphs for 2D-visualization of biological information. J. Theor. Biol. 2009, 261, 136–147. [Google Scholar] [CrossRef]
- Munteanu, C.R.; Magalhaes, A.L.; Uriarte, E.; Gonzalez-Diaz, H. Multi-target QPDR classification model for human breast and colon cancer-related proteins using star graph topological indices. J. Theor. Biol. 2009, 257, 303–311. [Google Scholar] [CrossRef]
- Perez-Bello, A.; Munteanu, C.R.; Ubeira, F.M.; De Magalhaes, A.L.; Uriarte, E.; Gonzalez-Diaz, H. Alignment-free prediction of mycobacterial DNA promoters based on pseudo-folding lattice network or star-graph topological indices. J. Theor. Biol. 2009, 256, 458–466. [Google Scholar] [CrossRef]
- Zhang, J.; Wiemann, S. KEGGgraph: A graph approach to KEGG PATHWAY in R and Bioconductor. Bioinformatics 2009, 25, 1470–1471. [Google Scholar] [CrossRef]
- Chakrabarti, D. Tools for Large Graph Mining. PhD Thesis, School of Computer Science, Carnegie Mellon University, 2005. [Google Scholar]
- Barabási, A.; Oltvai, Z. Network biology: Understanding the cell's functional organization. Nat. Rev. Genet. 2004, 5, 101–113. [Google Scholar] [CrossRef]
- Stelzl, U.; Worm, U.; Lalowski, M.; Haenig, C.; Brembeck, F.; Goehler, H.; Stroedicke, M.; Zenkner, M.; Schoenherr, A.; Koeppen, S. A human protein-protein interaction network: A resource for annotating the proteome. Cell 2005, 122, 957–968. [Google Scholar] [CrossRef]
- Niu, B.; Jin, Y.H.; Lu, L.; Fen, K.Y.; Gu, L.; He, Z.S.; Lu, W.L.; Li, Y.X.; Cai, Y.D. Prediction of small molecule and enzyme interaction-ness using AdaBoost. Mol. Divers. 2009, 13, 313–320. [Google Scholar] [CrossRef]
- Chen, L.; Shi, X.; Kong, X.; Zeng, Z.; Cai, Y. Identifying Protein Complexes Using Hybrid Properties. J. Proteome Res. 2009, 8, 5212–5218. [Google Scholar] [CrossRef]
- Li, W.; Lin, K.; Feng, K.; Cai, Y. Prediction of protein structural classes using hybrid properties. Mo. Divers. 2008, 12, 171–179. [Google Scholar] [CrossRef]
- Yu, X.; Cao, J.; Cai, Y.; Shi, T.; Li, Y. Predicting rRNA-, RNA-, and DNA-binding proteins from primary structure with support vector machines. J. Theor. Biol. 2006, 240, 175–184. [Google Scholar] [CrossRef]
- Chou, K.C. Prediction of protein cellular attributes using pseudo amino acid composition. Protein. Struct. Funct. Genet. 2001, 43, 246–255. [Google Scholar] [CrossRef]
- He, Z.S.; Zhang, J.; Shi, X.H.; Hu, L.L.; Kong, X.G.; Cai, Y.D.; Chou, K.C. Predicting drug-target interaction networks based on functional groups and biological features. PLoS ONE 2010, 5, e9603. [Google Scholar]
- Huang, T.; Shi, X.H.; Wang, P.; He, Z.; Feng, K.Y.; Hu, L.; Kong, X.; Li, Y.X.; Cai, Y.D.; Chou, K.C. Analysis and Prediction of the Metabolic Stability of Proteins Based on Their Sequential Features, Subcellular Locations and Interaction Networks. PLoS ONE 2010, 5, e10972. [Google Scholar]
- Chou, K.C. Pseudo amino acid composition and its applications in bioinformatics, proteomics and system biology. Curr. Proteomics 2009, 6, 262–274. [Google Scholar] [CrossRef]
- Xiao, X.; Chou, K.C. Digital coding of amino acids based on hydrophobic index. Protein Peptide Lett. 2007, 14, 871–875. [Google Scholar] [CrossRef]
- Dubchak, I.; Muchnik, I.; Holbrook, S.; Kim, S. Prediction of protein folding class using global description of amino acid sequence. Proc. Nat. Acad. Sci. 1995, 92, 8700–8704. [Google Scholar] [CrossRef]
- Dubchak, I.; Muchnik, I.; Mayor, C.; Dralyuk, I.; Kim, S. Recognition of a protein fold in the context of the SCOP classification. Protein. Struct. Funct. Genet. 1999, 35, 401–407. [Google Scholar] [CrossRef]
- Pollastri, G.; Baldi, P.; Fariselli, P.; Casadio, R. Prediction of coordination number and relative solvent accessibility in proteins. Proteins 2002, 47, 142–153. [Google Scholar] [CrossRef]
- Cheng, J.; Randall, A.; Sweredoski, M.; Baldi, P. SCRATCH: a protein structure and structural feature prediction server. Nucl. Acid. Res. 2005, 33, W72–W76. [Google Scholar] [CrossRef]
- Frishman, D.; Argos, P. Seventy-five percent accuracy in protein secondary structure prediction. Protein. Struct. Funct. Genet. 1997, 27, 329–335. [Google Scholar] [CrossRef]
- Camon, E.; Magrane, M.; Barrell, D.; Binns, D.; Fleischmann, W.; Kersey, P.; Mulder, N.; Oinn, T.; Maslen, J.; Cox, A. The gene ontology annotation (GOA) project: Implementation of GO in SWISS-PROT, TrEMBL, and InterPro. Genome Res. 2003, 13, 662–672. [Google Scholar] [CrossRef]
- Chou, K.; Cai, Y. Predicting Protein- Protein Interactions from Sequences in a Hybridization Space. J. Proteome Res. 2006, 5, 316–322. [Google Scholar] [CrossRef]
- Chou, K.C.; Shen, H.B. A new method for predicting the subcellular localization of eukaryotic proteins with both single and multiple sites: Euk-mPLoc 2.0. PLoS ONE 2010, 5, e9931. [Google Scholar] [CrossRef]
- Chou, K.C.; Shen, H.B. Plant-mPLoc: A Top-Down Strategy to Augment the Power for Predicting Plant Protein Subcellular Localization. PLoS ONE 2010, 5, e11335. [Google Scholar]
- Peng, H.; Long, F.; Ding, C. Feature selection based on mutual information: Criteria of max-dependency, max-relevance, and min-redundancy. IEEE Trans. Patt. Anal. Mach. Int. 2005, 27, 1226–1238. [Google Scholar] [CrossRef]
- Salzberg, S.; Cost, S. Predicting protein secondary structure with a nearest-neighbor algorithm. J. Mol. Biol. 1992, 227, 371–374. [Google Scholar] [CrossRef]
- Chou, K.C.; Shen, H.B. Review: Recent progresses in protein subcellular location prediction. Anal. Biochem. 2007, 370, 1–16. [Google Scholar] [CrossRef]
- Chou, K.C.; Shen, H.B. Cell-PLoc: A package of Web servers for predicting subcellular localization of proteins in various organisms. Nat. Protoc. 2008, 3, 153–162. [Google Scholar] [CrossRef]
- Zhou, G.P. An intriguing controversy over protein structural class prediction. J. Protein Chem. 1998, 17, 729–738. [Google Scholar] [CrossRef]
- Munteanu, C.B.; Gonzalez-Diaz, H.; Magalhaes, A.L. Enzymes/non-enzymes classification model complexity based on composition, sequence, 3D and topological indices. J. Theoret. Biol. 2008, 254, 476–482. [Google Scholar] [CrossRef]
- Vilar, S.; Gonzalez-Diaz, H.; Santana, L.; Uriarte, E. A network-QSAR model for prediction of genetic-component biomarkers in human colorectal cancer. J. Theoret. Biol. 2009, 261, 449–458. [Google Scholar] [CrossRef]
- Zhou, G. P.; Doctor, K. Subcellular location prediction of apoptosis proteins. Protein. Struct. Funct. Genet. 2003, 50, 44–48. [Google Scholar]
- Qiu, J.D.; Huang, J.H.; Liang, R.P.; Lu, X.Q. Prediction of G-protein-coupled receptor classes based on the concept of Chou's pseudo amino acid composition: An approach from discrete wavelet transform. Anal. Biochem. 2009, 390, 68–73. [Google Scholar]
- Jahandideh, S.; Sarvestani, A.S.; Abdolmaleki, P.; Jahandideh, M.; Barfeie, M. gamma-Turn types prediction in proteins using the support vector machines. J. Theor. Biol. 2007, 249, 785–790. [Google Scholar] [CrossRef]
- Shao, X.; Tian, Y.; Wu, L.; Wang, Y.; Jing, L.; Deng, N. Predicting DNA- and RNA-binding proteins from sequences with kernel methods. J. Theoret. Biol. 2009, 258, 289–293. [Google Scholar] [CrossRef]
- Yang, J.Y.; Peng, Z.L.; Yu, Z.G.; Zhang, R.J.; Anh, V.; Wang, D. Prediction of protein structural classes by recurrence quantification analysis based on chaos game representation. J. Theoret. Biol. 2009, 257, 618–626. [Google Scholar] [CrossRef]
- Lin, H. The modified Mahalanobis discriminant for predicting outer membrane proteins by using Chou's pseudo amino acid composition. J. Theoret. Biol. 2008, 252, 350–356. [Google Scholar] [CrossRef]
- Zeng, Y.H.; Guo, Y.Z.; Xiao, R.Q.; Yang, L.; Yu, L.Z.; Li, M.L. Using the augmented Chou's pseudo amino acid composition for predicting protein submitochondria locations based on auto covariance approach. J. Theoret. Biol. 2009, 259, 366–372. [Google Scholar] [CrossRef]
- Lin, H.; Ding, H.; Feng-Biao Guo, F.B.; Zhang, A.Y.; Huang, J. Predicting subcellular localization of mycobacterial proteins by using Chou's pseudo amino acid composition. Protein Peptide Lett. 2008, 15, 739–744. [Google Scholar] [CrossRef]
- Gu, Q.; Ding, Y.S.; Zhang, T.L. Prediction of G-Protein-Coupled Receptor Classes in Low Homology Using Chou's Pseudo Amino Acid Composition with Approximate Entropy and Hydrophobicity Patterns. Protein Peptide Lett. 2010, 17, 559–567. [Google Scholar] [CrossRef]
- Sample Availability: Samples of the compounds are available from the authors.
© 2010 by the authors; licensee MDPI, Basel, Switzerland. This article is an open access article distributed under the terms and conditions of the Creative Commons Attribution license (http://creativecommons.org/licenses/by/3.0/).
Share and Cite
Chen, L.; Huang, T.; Shi, X.-H.; Cai, Y.-D.; Chou, K.-C. Analysis of Protein Pathway Networks Using Hybrid Properties. Molecules 2010, 15, 8177-8192. https://doi.org/10.3390/molecules15118177
Chen L, Huang T, Shi X-H, Cai Y-D, Chou K-C. Analysis of Protein Pathway Networks Using Hybrid Properties. Molecules. 2010; 15(11):8177-8192. https://doi.org/10.3390/molecules15118177
Chicago/Turabian StyleChen, Lei, Tao Huang, Xiao-He Shi, Yu-Dong Cai, and Kuo-Chen Chou. 2010. "Analysis of Protein Pathway Networks Using Hybrid Properties" Molecules 15, no. 11: 8177-8192. https://doi.org/10.3390/molecules15118177