Chemometric Studies on Natural Products as Potential Inhibitors of the NADH Oxidase from Trypanosoma cruzi Using the VolSurf Approach

Abstract
:1. Introduction
2. Results and Discussion
2.1. CPCA
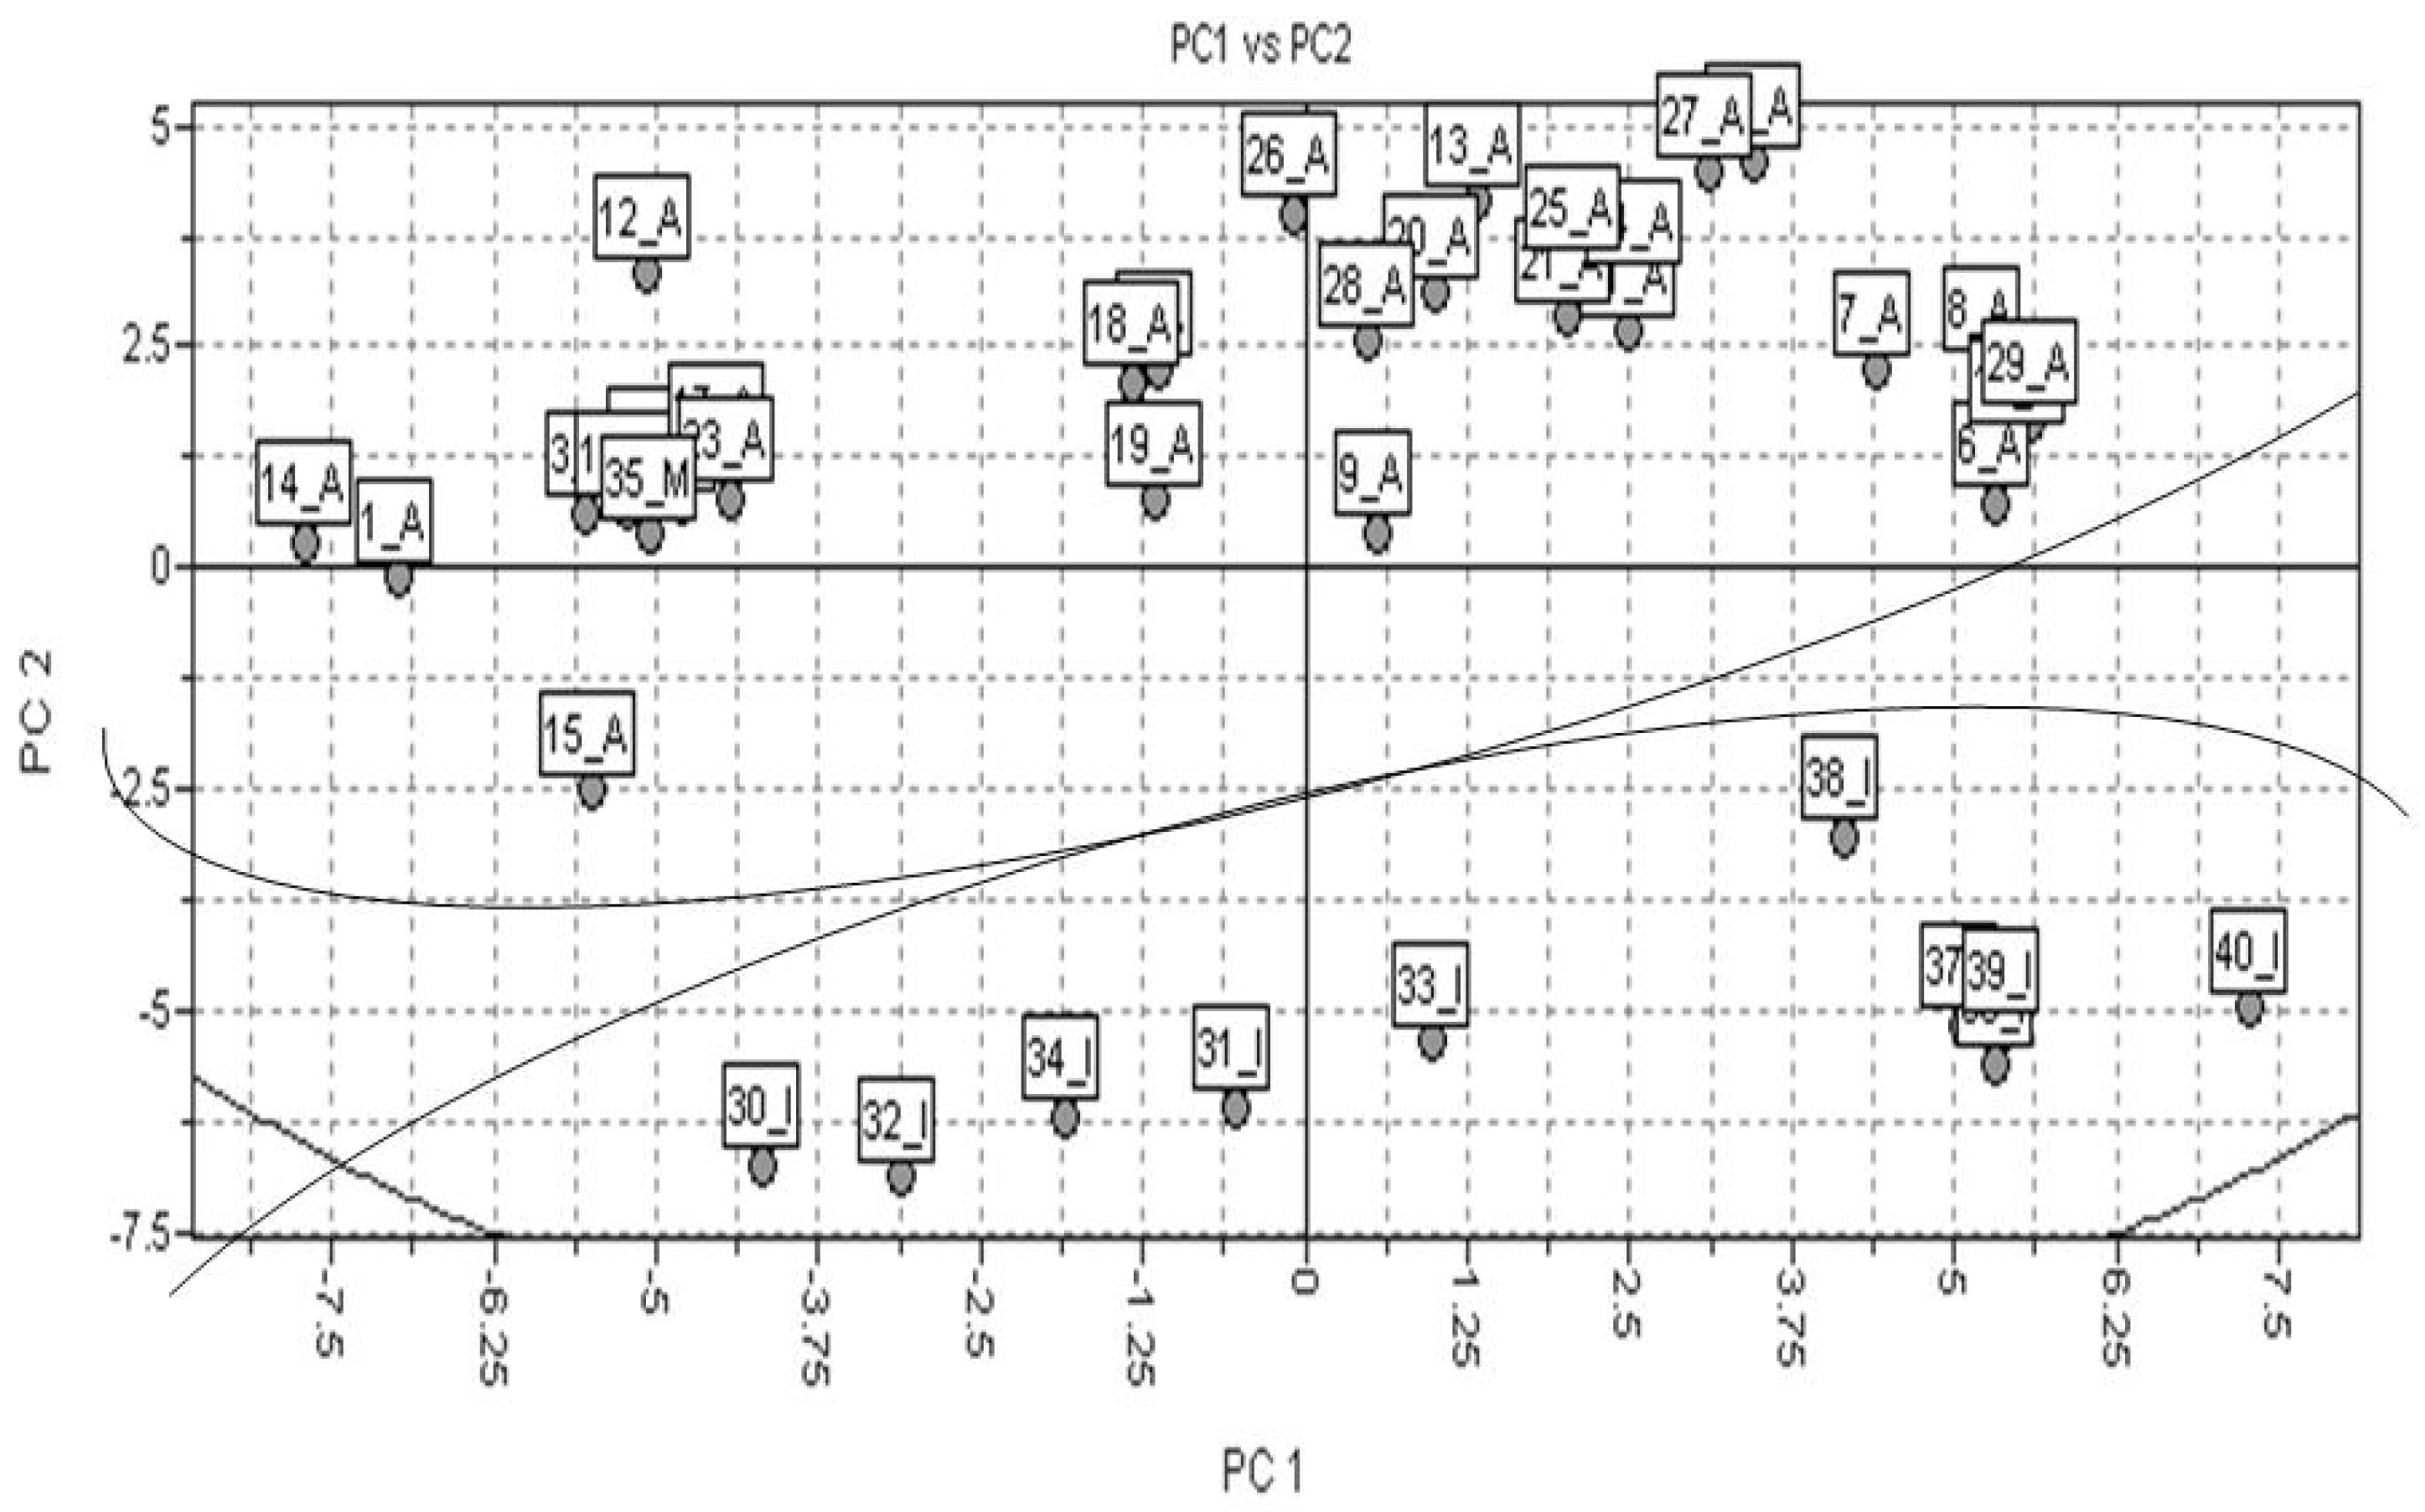
2.2. PCA
2.3. PLS
2.4. Discussion
3. Experimental Section

| Name [Id] | Biological activity pIC50 | Chemical structure |
|---|---|---|
| 5 – Hydroxyflavone [1] | 9.373 |  |
| 7,8 – Dihydroxyflavone [2] | 9.562 |  |
| 7 – Hydroxyflavone [3] | 8.853 |  |
| Apigenin [4] | 9.043 |  |
| Baicalein [5] | 10.113 |  |
| Butein [6] | 10.741 |  |
| (2R,3S) – Catechin [7] | 8.741 |  |
| (2S,3R) – Catechin [8] | 8.741 |  |
| Cyanidin [9] | 9.301 |  |
| Crysin [10] | 9.603 |  |
| Delphidin [11] | 9.001 |  |
| Eupatorin [12] | 10.372 |  |
| Fisetin [13] | 10.821 |  |
| Flavone [14] | 9.623 |  |
| Flavanone [15] | 9.513 |  |
| Fustin [16] | 9.901 |  |
| Galangin [17] | 8.721 |  |
| Genistein [18] | 9.443 |  |
| Kaempferol [19] | 8.721 |  |
| Luteolin [20] | 10.321 |  |
| Morin [21] | 9.371 |  |
| Myrecitin [22] | 10.461 |  |
| Norwogonin [23] | 9.472 |  |
| Quercetagin [24] | 9.751 |  |
| Quercetin [25] | 9.841 |  |
| Rhamnetin [26] | 7.382 |  |
| Robinetin [27] | 7.722 |  |
| Rutin [28] | 8.723 |  |
| Taxifolin [29] | 9.761 |  |
| Tigliane 1 [30] | 5.604 |  |
| Tigliane 2 [31] | 4.724 |  |
| Tigliane 3 [32] | 4.724 |  |
| Tigliane 4 [33] | 4.884 |  |
| Tigliane 5 [34] | 5.114 |  |
| Rotenone [35] | 8.294 |  |
| Jatrophane 1b [36] | 5.205 |  |
| Jatrophane 2 b [37] | 5.295 |  |
| Jatrophane 3 b [38] | 5.155 |  |
| Jatrophane 4 b [39] | 4.865 |  |
| Jatrophane 5 b [40] | 4.965 |  |
4. Conclusions
Acknowledgements
References
- Hodnick, W.F.; Bohmont, C.W.; Capps, C.; Pardini, R.S. Inhibition of the mitochondrial NADH-oxidase (NADH-Coenzyme Q oxido-reductase) enzyme system by flavonoids: a structure-activity study. Biochem. Pharm. 1987, 36, 2873–2874. [Google Scholar] [CrossRef]
- Hodnick, W.F.; Duval, D.L.; Pardini, R.S. Inhibition of mitochondrial respiration and cyanide-stimulated generation of reactive oxygen species by selected flavonoids. Biochem. Pharm. 1994, 47, 573–580. [Google Scholar] [CrossRef]
- Bohmont, C.; Aaronson, L.M.; Mann, K.; Pardini, R.S. Inhibition of mitochondrial NADH oxidase, Succinoxidase, and ATPASE by naturally occurring flavonoids. J. Nat. Prod. 1987, 50, 427–433. [Google Scholar] [CrossRef] [PubMed]
- Betancur-Galvis, L.; Palomares, E.; Marco, J.A.; Estornell, E. Tigliane diterpenes from the latex of Euphorbia obtusifolia with inhibitory activity on the mammalian mitochondrial respiratory chain. J. Ethnopharmacol. 2003, 85, 279–282. [Google Scholar] [CrossRef]
- Betancur-Galvis, L.; Checa, J.; Marco, J.A.; Estornell, E. Jatrophane diterpenes of Euphorbia obtusifolia with inhibitory activity on the mammalian mitochondrial respiratory chain. Planta Med. 2003, 69, 177–178. [Google Scholar] [CrossRef] [PubMed]
- Hayes, R.J.; Schofield, C.J. Estimación de las tasas de incidencia de infecciones y parasitosis crónicas a partir de la prevalencia: La enfermedad de Chagas en América Latina. Bol. Ofic. Sanit. Panam. 1990, 108, 308. [Google Scholar]
- Beebe, K.R.; Pell, R.J.; Seasholtz, M.B. Chemometrics: A Practical Guide; Wiley: NewYork, NY, USA, 1998. [Google Scholar]
- Sharaf, M.A.; Illman, D.L.; Kowalski, B.R. Chemometrics; John Wiley & Sons: NewYork, NY, USA, 1986. [Google Scholar]
- Westerhuis, J.A.; Kourti, T.; Macgregor, J.F. Analysis of multiblock and hierarchical PCA and PLS models. J. Chemometr. 1998, 12, 301–321. [Google Scholar] [CrossRef]
- Cruciani, G.; Crivori, P.; Carrupt, P.-A.; Testa, B. Molecular fields in quantitative structure–permeation relationships: the VolSurf approach. J. Mol. Struct. 2000, 503, 17–30. [Google Scholar] [CrossRef]
- Zamora, I.; Oprea, T.; Cruciani, G.; Pastor, M.; Ungell, A.-L. Surface descriptors for protein-ligand affinity prediction. J. Med. Chem. 2003, 46, 25–33. [Google Scholar] [CrossRef] [PubMed]
- Crivori, P.; Cruciani, G.; Carrupt, P.-A.; Testa, B. Predicting Blood-Brain Barrier Permeation from Three-Dimensional Molecular Structure. J. Med. Chem. 2000, 43, 2204–2216. [Google Scholar] [CrossRef] [PubMed]
- Kovatcheva, A.; Golbraikh, A.; Oloff, S.; Xiao, Y.-D.; Zheng, W.; Wolschann, P.; Buchbauer, G.; Tropsha, A. Combinatorial QSAR of Ambergris Fragrance Compounds. J. Chem. Inform. Comput. Sci. 2004, 44, 582–595. [Google Scholar] [CrossRef] [PubMed]
- Oprea, T.I.; Zamora, I.; Ungell, A.-L. Pharmacokinetically Based Mapping Device for Chemical Space Navigation. J. Comb. Chem. 2002, 4, 258–266. [Google Scholar] [CrossRef] [PubMed]
- Lowry, O.H.; Rosebrough, N.J.; Farr, A.L.; Randall, R.J. Protein measurement with the Folin phenol reagent. J. Biol. Chem. 1951, 193, 265–275. [Google Scholar] [PubMed]
- Bohmont, C.; Aaronson, L.M.; Mann, K.; Pardini, R.S. Inhibition of mitochondrial NADH oxidase, Succinoxidase, and ATPASE by naturally occurring flavonoids. J. Nat. Prod. 1987, 50, 427–433. [Google Scholar] [CrossRef] [PubMed]
- Hyperchem Program Release 6.0 for Windows. Hybercube, Inc.: Gainesville, FL, USA, 2000.
- Jez, J.M.; Noel, J.P. Reaction mechanism of chalcone isomerase. pH dependence, diffusion control, and product binding differences. J. Biol. Chem. 2002, 277, 1361–1369. [Google Scholar] [CrossRef] [PubMed]
- Welford, R.W.; Clifton, I.J.; Turnbull, J.J.; Wilson, S.C.; Schofield, C.J. Structural and mechanistic studies on anthocyanidin synthase catalysed oxidation of flavanone substrates: the effect of C-2 stereochemistry on product selectivity and mechanism. Org. Biomol. Chem. 2005, 3, 3117–3126. [Google Scholar] [CrossRef] [PubMed]
- Wilmouth, R.C.; Turnbull, J.J.; Welford, R.W.; Clifton, I.J.; Prescott, A.G.; Schofield, C.J. Structure and mechanism of anthocyanidin synthase from Arabidopsis thaliana. Structure 2002, 10, 93–103. [Google Scholar] [CrossRef]
- Jez, J.M.; Bowman, M.E.; Dixon, R.A.; Noel, J.P. Structure and mechanism of the evolutionarily unique plant enzyme chalcone isomerase. Nat. Struct. Biol. 2000, 7, 786–791. [Google Scholar] [PubMed]
- Cohen, N.C. Guidebook on Molecular Modeling in Drug Design; Academic Press: San Diego, CA, USA, 1996. [Google Scholar]
- Leach, A.R. Molecular Modeling: Principles and Applications; Prentice Hall: London, UK, 2001. [Google Scholar]
- Dewar, M.J.S.E.; Zoebisch, G.; Healy, E.F.; Stewart, J.J.P. AM1: A new general purpose quantum mechanical molecular model. J. Am. Chem. Soc. 1985, 107, 3902–3909. [Google Scholar] [CrossRef]
- Cruciani, G.; Pastor, M.; Guba, W. VolSurf: a new tool for the pharmacokinetic optimization of lead compounds. Eur. J. Pharm. Sci. 2000, 11, S29–S39. [Google Scholar] [CrossRef]
- Cruciani, G.; Pastor, M.; Mannhold, R. Suitability of Molecular Descriptors for Database Mining. A Comparative Analysis. J. Med. Chem. 2002, 45, 2685–2694. [Google Scholar] [CrossRef] [PubMed]
- Cianchetta, G.; Mannhold, R.; Cruciani, G.; Baroni, M.; Cecchetti, V.J. Chemometric Studies on the Bactericidal Activity of Quinolones via an Extended VolSurf Approach. J. Med. Chem. 2004, 47, 3193–3201. [Google Scholar] [CrossRef] [PubMed]
- Golbraikh, A.; Shen, M.; Xiao, Z.; Xiao, Y.-D.; Lee, K.-H.; Tropsha, A. Rational selection of training and test sets for the development of validated QSAR models. J. Comput. Aid Molec. Design 2003, 17, 241–253. [Google Scholar] [CrossRef]
Sample Availability: Samples of the compounds are available from the authors. |


| PC | % explained variance from original data |
|---|---|
| 1 | 38.99 |
| 2 | 32.24 |
| 3 | 7.53 |
| 4 | 3.87 |
| 5 | 2.52 |
| PC | % explained variance from original data |
|---|---|
| 1 | 43.72 |
| 2 | 32.83 |
| 3 | 10.02 |
| 4 | 5.95 |
| 5 | 2.07 |
| LV | % explained variance from original data |
|---|---|
| 1 | 32.08 |
| 2 | 36.99 |
| 3 | 17.54 |
| 4 | 3.34 |
© 2010 by the authors; licensee MDPI, Basel, Switzerland. This article is an open access article distributed under the terms and conditions of the Creative Commons Attribution license (http://creativecommons.org/licenses/by/3.0/).
Share and Cite
Scotti, L.; Ferreira, E.I.; Silva, M.S.d.; Scotti, M.T. Chemometric Studies on Natural Products as Potential Inhibitors of the NADH Oxidase from Trypanosoma cruzi Using the VolSurf Approach. Molecules 2010, 15, 7363-7377. https://doi.org/10.3390/molecules15107363
Scotti L, Ferreira EI, Silva MSd, Scotti MT. Chemometric Studies on Natural Products as Potential Inhibitors of the NADH Oxidase from Trypanosoma cruzi Using the VolSurf Approach. Molecules. 2010; 15(10):7363-7377. https://doi.org/10.3390/molecules15107363
Chicago/Turabian StyleScotti, Luciana, Elizabeth Igne Ferreira, Marcelo Sobral da Silva, and Marcus Tullius Scotti. 2010. "Chemometric Studies on Natural Products as Potential Inhibitors of the NADH Oxidase from Trypanosoma cruzi Using the VolSurf Approach" Molecules 15, no. 10: 7363-7377. https://doi.org/10.3390/molecules15107363