
Change Point Test for the Conditional Mean of Time Series of Counts Based on Support Vector Regression


Department of Statistics, Seoul National University, Seoul 08826, Korea
*
Author to whom correspondence should be addressed.
Entropy 2021, 23(4), 433; https://doi.org/10.3390/e23040433
Submission received: 25 March 2021
/
Revised: 2 April 2021
/
Accepted: 3 April 2021
/
Published: 7 April 2021
(This article belongs to the Special Issue Machine/Statistical Learning and Modeling with Potential Applications in Entropy, Information Theory, and Artificial Intelligence)
Abstract
:This study considers support vector regression (SVR) and twin SVR (TSVR) for the time series of counts, wherein the hyper parameters are tuned using the particle swarm optimization (PSO) method. For prediction, we employ the framework of integer-valued generalized autoregressive conditional heteroskedasticity (INGARCH) models. As an application, we consider change point problems, using the cumulative sum (CUSUM) test based on the residuals obtained from the PSO-SVR and PSO-TSVR methods. We conduct Monte Carlo simulation experiments to illustrate the methods’ validity with various linear and nonlinear INGARCH models. Subsequently, a real data analysis, with the return times of extreme events constructed based on the daily log-returns of Goldman Sachs stock prices, is conducted to exhibit its scope of application.
1. Introduction
In this study, we developed a forecasting method for the time series of counts based on support vector regression (SVR) with particle swarm optimization (PSO), and used it to detect a change in the conditional mean of the time series based on the cumulative sum (CUSUM) test that is calculated from integer-valued autoregressive conditional heteroscedastic (INGARCH) residuals. Over the past few decades, the time series of counts have gained increased attention from researchers in diverse scientific areas. Considering the research conducted by [1,2,3,4,5], two classes of models, such as integer-valued autoregressive (INAR) and INGARCH models, have been popular for analyzing the time series of counts. See [6] for more details. These models have been harnessed to analyze polio data [7], crime data [8], car accident traffic data [9], and financial data [10].
Although the basic theories and analytical tools for these models are quite well developed in the literature, as seen in [11,12,13,14,15], a restriction on their usage exists because both INAR and INGARCH models are mostly assumed to have a linear structure in their conditional mean. In INGARCH models, Poisson and negative binomial distributions have been widely adopted as the conditional distribution of current observations over past information. This is because assuming these distributions is not impractical, as the correct specification of underlying distributions is not essential when attempting to estimate the conditional mean equation, as demonstrated by [16], who considered the quasi-maximum likelihood estimation (QMLE) method for the time series of counts. However, for the QMLE approach to perform adequately, the conditional mean structure must be correctly specified. As misspecification can potentially lead to false conclusions in real situations, we considered SVR as a nonparametric algorithm for forecasting the time series of counts. To our knowledge, our current study is the first attempt in the literature to use SVR for the prediction of time series of counts based on the INGARCH scheme.
SVR has been one of the most popular nonparametric algorithms for forecasting time series and has been proven to outperform classical time series models, such as autoregressive and moving average (ARMA) and GARCH models, as SVR can approximate nonlinearity without knowing the underlying dynamic structure of time series [17,18,19,20,21,22,23,24,25]. SVR has the merit of implementing the “structural risk minimization principle” [26] and seeks a balance between model complexity and empirical risk [27]. Moreover, a smaller number of tuning parameters is required, and determining a global solution is not problematic because it solves a quadratic programming problem (QPP).
SVR has been modified in various manners; for example, smooth SVR [28], least squares (LS)-SVM [29], and twin SVR (TSVR) [30]. TSVR generates two hyperplanes unlike SVR and has a significant advantage over SVR in computational speed. For the relevant references, see [31,32,33]. Here, we harness the SVR and TSVR methods particularly with the particle swarm optimization (PSO) algorithm, originally proposed by [34], in determining a set of optimal parameters to enhance their efficacy. For an overview of PSO, see [35,36].
As an application of our SVR method, we consider the problem of detecting a significant change in the conditional mean of the INGARCH time series. Since [37], the parameter change detection problem has been a core issue in various research areas. As financial time series often suffer from structural changes, owing to changes in governmental policy and critical social events, and ignoring them leads to a false conclusion, change point tests have been considered as an important research topic in time series analysis. See [38,39] for a general review. The CUSUM test has long been used as a tool for detecting a change point, owing to its practical efficiency [40,41,42,43,44]. As regards the time series of counts, see [7,45,46,47,48,49,50].
Among the CUSUM tests, we adopted the residual-based CUSUM test, because the residual method can successfully discard the correlations of time series and enhance the performance of the CUSUM test in terms of both stability and power. See [51,52]. The authors of the recent reference [43,53] developed a simplistic residual-based CUSUM test for location-scale time series models, based on which the authors of [21,22] designated a hybridization of the SVR and CUSUM methods for handling the change point problem for AR and GARCH time series and demonstrated its superiority over classical models. However, their approach is not directly applicable and requires a new modification for effective performance, especially on the proxies used for the GARCH prediction, as seen in Section 3.4, as simple or exponential moving average type proxies conventionally used for SVR-GARCH models [22] would not work adequately in our current study. Here, we instead used the proxies obtained through the linear INGARCH fit to time series of counts.
The rest of this paper is organized as follows. Section 2 reviews the principle of the CUSUM test and CUSUM of squares test for the INGARCH models and then briefly describes how to apply the SVR-INGARCH method for constructing the CUSUM tests. Section 3 presents the SVR and TSVR-GARCH models for forecasting the conditional mean and describes the SVR and TSVR methods with PSO. Section 4 discusses the Monte Carlo simulations conducted to evaluate the performance of the proposed method. Section 5 discusses the performance of the real data analysis, using the return times of extreme events constructed based on the daily log-returns of Goldman Sachs (GS) stock prices. Finally, Section 6 provides concluding remarks.
2. INGARCH Model-Based Change Point Test
Let be a time series of counts. In order to make inferences for , one can consider fitting a parametric model to , for instance, the INGARCH model with the conditional distribution of the one-parameter exponential family and the link function , parameterized with , that describes the conditional expectation, namely,
where denotes the past information up to time t, is defined on with , and is a probability mass function given by
where is the natural parameter, and are known real-valued functions, is strictly increasing, and . and are the conditional mean and variance of over past observations, respectively. Symbols and are used to emphasize .
Conventionally, is assumed to be bounded below by some real number and to satisfy
for all and , where satisfies , which, according to [12], allows to be strictly stationary and ergodic, required for the consistency of the parameter estimates.
In practice, Poisson or negative binomial (NB) linear INGARCH(1,1) models with , , are frequently used. For the former, we assume , whereas for the latter, we assume , where and NB denotes the negative binomial distribution with its mass function: .
Let be a true parameter, which is assumed to be an interior point of the compact parameter space . The is then estimated using the conditional likelihood function of model (1), based on the observations :
where is updated through the equations: for , with an initial value .The conditional maximum likelihood estimator (CMLE) of is then obtained as the maximizer of the likelihood function in Equation (3):
with . The authors of the reference [12,50] showed that, under certain conditions, converges to in probability and is asymptotically normally distributed as n tends to ∞. This is harnessed to make prediction for calculating residuals.
In our current study, we aim to extend Model (1) to the nonparametric model:
where and g are unknown, and g is implicitly assumed to satisfy Equation (2). Provided and is known a priori, one can estimate g with . Even if is unknown, one can still consider using the Poisson or NB quasi-likelihood estimator (QMLE) method as in [16]. See also [54] for various types of CUSUM tests based on the QMLEs. However, when one has no prior information as to g, the parametric modeling may hamper the inference, and in this case, one can estimate g with the nonparametric SVR method stated below in Section 3.
On Model (1), setting up the null and alternative hypotheses: remain the same over vs. The authors of the reference [50] considered the problem of detecting a change in based on the CUSUM test:
with the residuals and Furthermore, the authors of the references [55,56] employed the residual-based CUSUM of squares test:
with , and
The authors of the reference [50] verified that, under the null , behaves asymptotically the same as
where and . As forms a sequence of martingale differences, we obtain in distribution [57], where denotes a Brownian bridge, owing to Donsker’s invariance principle, so that, as , we have in distribution. For instance, is rejected if at the level of 0.05, which is obtainable with Monte Carlo simulations. Similarly, the authors of the reference [55] verified that in distribution, so that the same critical values as for the case of can be harnessed. Provided that a change point exists, the location of change is identified as
This CUSUM framework for parametric models can be easily adopted for nonparametric models as far as the residuals can be accurately calculated, as seen in [21,22] who deal with the change point problem on SVR-ARMA and SVR-GARCH models. Below, when dealing with Model (4), instead of in Equation (5), we use in the construction of the CUSUM tests in Equations (5) and (6).
When estimating g with SVR and TSVR, we train either with and or and , with some proper proxy . The former has been used for the SVR-GARCH model in [21], while the latter is newly considered here, inspired by the fact that , where the error process is a sequence of martingale differences, which also holds for Model (1) because we can express in this case. See Step 3 in Section 4 below for more details.
3. SVR-INGARCH Model
In this section, we provide an outline of the SVR, TSVR, and PSO methods for a quick reference and describe the change point test based on the SVR-INGARCH model.
3.1. Support Vector Regression
SVR is an extension of the SVM, originally proposed by [58], and merits accurate nonlinear prediction. SVR aims to identify a nonlinear function of the form: where x denotes a vector of inputs, w and b are vectors of regression parameters, and is a known kernel function. The optimal w and b are determined from the -insensitive loss function (Vapnik, 2000):
Given input vectors , scalar output , , and a constant , we construct the objective function of the SVR as follows:
where denote slack variables that allow some points to lie outside the -band with a penalty, and C denotes a trade-off between the function complexity and the training error.
To obtain the optimal w and b, we formulate an unconstrained optimization problem using Lagrange multipliers [27]. The Karush–Kuhn–Tucker (KKT) conditions then lead to the following dual form:
subject to , where and denote dual variables [26]. Subsequently, the optimization problem in Equation (9) yields the solutions of , as follows:
with . In particular, we employ the Gaussian kernel for K in Equation (10), , and determine the tuning parameters , C in Equation (8), and in the loss function Equation (7) using the PSO method on the cube of with , , and .
3.2. Twin Support Vector Regression
TSVR is a modified version of SVR [30]. Similar to TSVM [59], TSVR derives two nonparallel planes and , which respectively determines the -sensitive downbound and -sensitive upbound of data. Given input vectors and output , , the linear TSVR can be formulated as the constraint minimization problem as follows:
where , 0, e denotes a vector whose components are all equal to 1, are hyperparameters, and are slack variables. Each QPP has m constraints instead of constraints and has an advantage of faster computational speed. To obtain the optimal and in Equation (11), we solve the QPP using the Lagrangian function:
where and are Lagrangian multiplier vectors. If there is an optimal solution, it must satisfy the following KKT conditions:
We define , and . Combining Equations (14) and (15), we have
However, since is only semidefinite, we introduce a regularization term , where is very small, to overcome some ill-conditioned setting and use . Next, substituting Equation (16) and the KKT conditions into Equation (13), we obtain the dual QPP form:
which yields . Likewise, Equation (12) can acquire the dual QPP form:
where is the Lagrangian multiplier vector and . This yields . Then, the estimated regressor can be formulated as follows:
For extending the linear TSVR to a nonlinear one, we use the kernel-generated nonparallel hyperplanes, that is, and . The optimization problem in this case is similar to the linear TSVR, and the nonlinear TSVR regressor is obtained as follows:
3.3. Particle Swarm Optimization Method
In a standard PSO algorithm [34], a set of d hyperparameters are considered as a particle of d-dimensional vector in search region Here, N particles are modeled to move in S, with the position and velocity for . The previous best position of the i-th particle is represented by , and the previous best position of all particles is represented by . At each iteration k, where with maximum iteration number , the velocity and position of the i-th particle are updated as follows:
where and are two acceleration factors, and are two random variables following a uniform distribution over [0,1], and is an inertia factor defined by
where and are initial and final values of inertia. Since the positions of particles are updated, and are also updated as follows:
The finally updated in the above procedure is used as an optimal hyperparameter in estimating the SVR and TSVR models as seen below.
3.4. PSO-TSVR Model-Based CUSUM Test
In this subsection, we explain how to estimate in Model (4) using the SVR and TSVR methods with PSO as described above and how to construct the CUSUM test based on the residuals obtained from the SVR-INGARCH model. In the following steps, we assume that a time series has no change points.
- Step 1. As in Section 3.3, in order to apply the PSO method, we set a space of hyperparameters and initialize the positions and velocities of particles to be evaluated within this space. Subsequently, we divide the given time series into two groups of time series, and . The former is used as a training set while the latter is used as a validation set.
- Step 2. Compute the initial estimates of based on the training time series. For this task, we use two different methods. The first method is using moving averages (Niemira, 1994):where m is a positive integer. When t is smaller than m, is computed as an average of the first to the t-th squares of observations, i.e. when .
- Step 3. For particles , , we train , either with and or and with proxy to the SVR and TSVR models to obtain . Subsequently, for the first, we obtainnamed “-targeting”, and for the second,named “-targeting”, where is an estimate of , which is an estimate as well since itself is the conditional expectation.
- Step 4. Applying the estimated SVR and TSVR models and using the same proxy formula as in Step 2 for the validation time series, the mean absolute error (MAE) is computed as follows:for the case of Equation (19), andfor the case of Equation (20). The MAE is employed here because it is more robust against outliers in a model fitting than the root mean square error.
- Step 5. Update the , and as in Section 3.3 and repeat Steps 3 and 4 until the MAE in Step 4 converges within a limit or k reaches the maximum iteration number .
4. Simulation Results
In this section, we apply the PSO-SVR and -TSVR models to the INAR(1) and INGARCH(1,1) models, and evaluate the performance of the proposed CUSUM tests. For this task, we generate a time series of length 1000 ( to evaluate the empirical sizes and powers at the nominal level of 0.05. The size and power are calculated as the rejection number of the null hypothesis of no changes out of 500 repetitions. The simulations were conducted with R version 3.6.3, running on Windows 10. Moreover, we use the following R packages: “pso” for the PSO [60], “kernlab” for the Gaussian kernel [61], and “osqp” [62] for solving the quadratic problem. The procedure for the simulation is as follows.
- Step 1. Generate a time series of length to train the PSO-SVR and -TSVR models.
- Step 3. Generate a testing time series of length to evaluate the size and power. For computing sizes, we generate a time series of no changes, whereas to examine the power, we generate a time series with a change point in the middle.
- Step 4. Apply the estimated model in Step 2 to the time series of Step 3 and conduct the residual CUSUM and CUSUM of squares tests.
- Step 5. Repeat the above steps N times, e.g., 500, and then compute the empirical sizes and powers.
We consider the INGARCH(1,1) and INAR(1) models, as these are the most acclaimed models in practice:
- Model 1.
- Model 2. , where ∘ is a binomial thinning operator and .
Further, upon one referee’s suggestion, we also consider the softplus INGARCH(1,1) model in [63]:
- Model 3. , where .
Under the null hypothesis, we use the parameter settings as follows.
- Model 1:
- −
- Case 1: ;
- −
- Case 2: ;
- −
- Case 3: ;
- −
- Case 4: ;
- Model 2:
- −
- Case 1: ;
- −
- Case 2: ;
- −
- Case 3: ;
- Model 3:
- −
- .
Under the alternative hypothesis, we only consider the case of one parameter change, while the other parameters remain the same. Table A1, Table A2, Table A3 and Table A4 in Appendix A summarize the results for Model 1. Here, MA and ML denote the proxies obtained from the moving average in Equation (17) and Poisson QMLE in Equation (18), and and , respectively, denote the two targeting methods in Equation (20) and Equation (19). The tables show that the difference between the SVR and TSVR methods is marginal. Moreover, in most cases, appears to be much more stable than ; that is, the latter test suffers from more severe size distortions. In terms of power, with the ML proxy and -targeting tends to outperform the others. However, the gap between this test and is only marginal; therefore, considering the stability of the test, is highly favored for Model 1. Table A5, Table A6 and Table A7 summarize the result for Model 2, showing that exhibits a more stable performance for the INAR models than for the INGARCH models. However, it is still not as stable as and tends to outperform in terms of power. Table A8 summarizes the result for Model 3, showing no significant differences from the results of the previous models. This result, to a certain extent, coincides with that of Lee and Lee (2020) who considered parametric INGARCH models for a change point test. Overall, our findings strongly confirm the reliability of using , particularly with the ML proxy and -targeting. However, in practice, one can additionally implement because either test can react more sensitively to a specific situation in comparison to the other.
Table A9 lists the computing times (in seconds) of the SVR and TSVR methods when implemented in R on Windows 10, running on a PC with an Intel i7-3770 processor (3.4 GHz) with 8 GB of RAM, wherein the figures denote the averages of training times in simulations, and the values in the parentheses indicate the sample standard deviations. In each model and parameter setting, the values of the two quickest results are written in boldface. As reported by [21,30], the TSVR method is shown to markedly reduce the CPU time. In particular, the results indicate that the computational speed of the TSVR-based method, with the ML proxy and -targeting, appears to be the fastest in most cases. The result suggests that using the TSVR-based CUSUM tests is beneficial when computational speed is of significance to the implementation.
5. Real Data Analysis
In this section, we analyze the return times of extreme events constructed based on the daily log-returns of GS stock prices from 1 January 2003, to 28 June 2019, obtained using the R package “quantmod.” We used data from 2 January 2003, to 29 June 2007, as the training set and that from 1 July 2009, to 28 June 2019, as the test set. Figure 1 and Figure 2 exhibit the GS stock prices and 100 times the log-returns, with their ranges denoted by the green and blue vertical lines, respectively. As shown in Figure 2, the time series between the training and test sets has severe volatility, owing to the financial crisis that occurred in 2008; therefore, it is omitted from our data analysis.
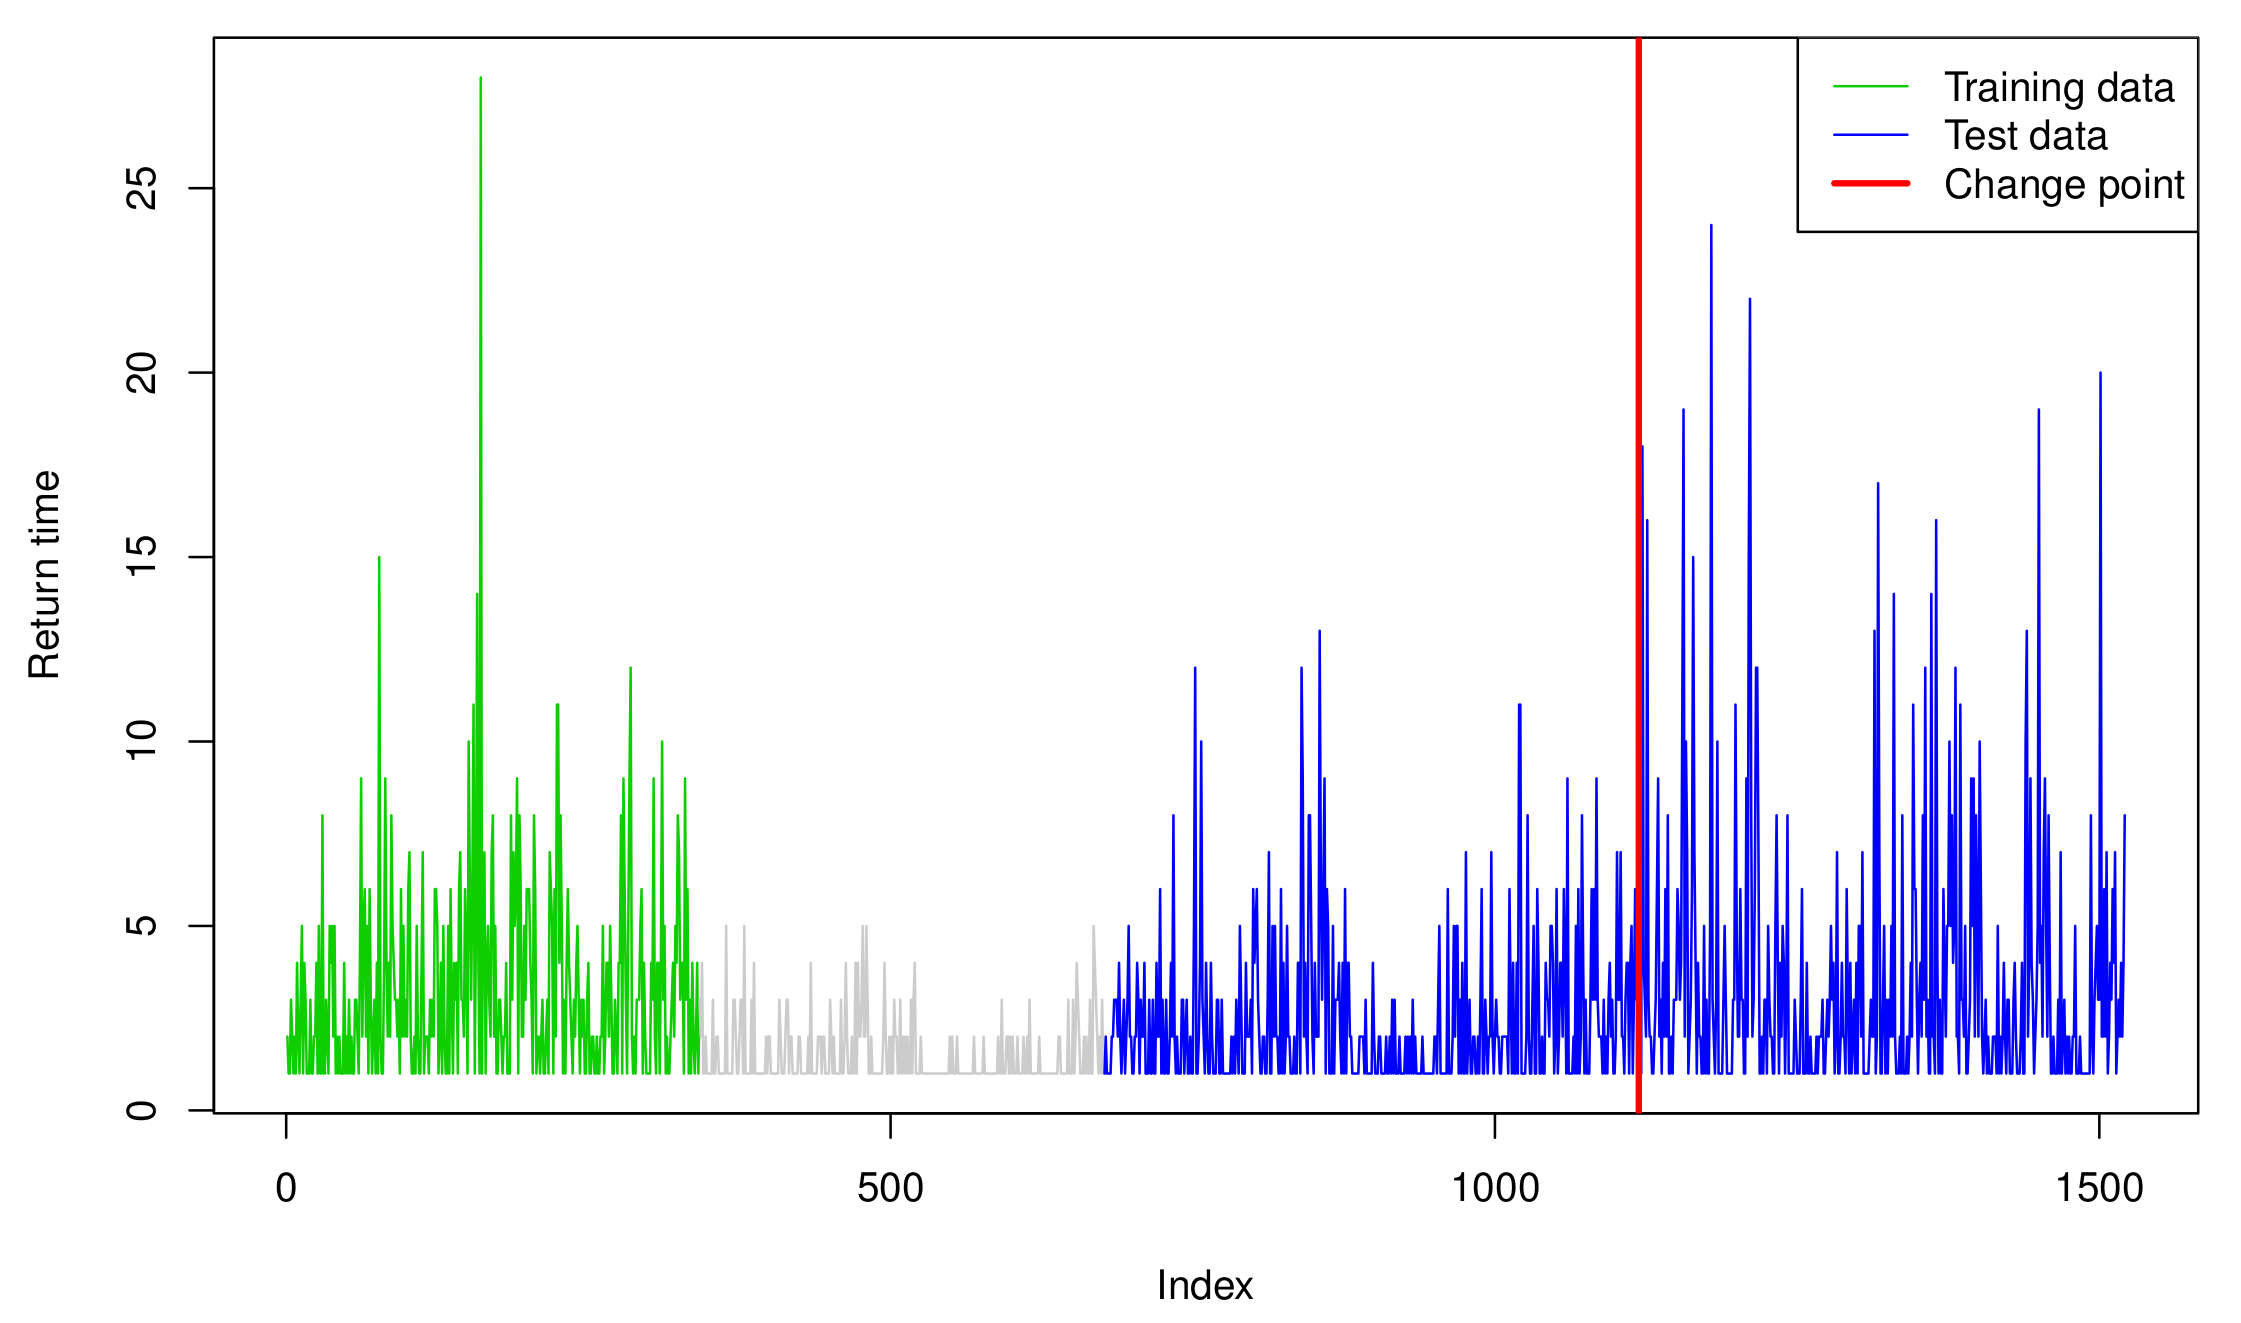
Before applying the PSO-SVR-INGARCH and PSO-TSVR-INGARCH methods, similarly to [12,14], we first transform the given time series into the hitting times , for which the log-returns of the GS stock fall outside the 0.15 and 0.85 quantiles of the training data, that is, -1.242 and 1.440, respectively. More specifically, , , where denote the 100 times log-returns. We then set , which forms the return times of these extreme events. Consequently, the training set is transformed into an integer-valued time series of length 341, and the test set is transformed into that of length 844 (see Figure 2), plotting .
To determine whether the training set exhibits change, we apply the Poisson QMLE method and CUSUM of squares test from [54]. The result shows that the CUSUM statistics has a value of 0.590, which is smaller than the theoretical critical value of 1.358; thus, the null hypothesis of no change is not rejected at the nominal level of 0.05, supporting the adequacy of the training set. The residual-based CUSUM of squares tests based on the SVR and TSVR models with the ML proxy and -targeting are then applied; subsequently, both tests detect a change point at the 441st observation of the testing data, corresponding to 16 October 2013. The red vertical line in Figure 3 denotes the detected change point.
To examine how the change affects the dynamic structure of the time series, we fit a Poisson linear INGARCH model to the training and testing time series before and after the change point. For the training time series, the fitted INGARCH model appears to have , and . Conversely, for the testing time series before the change, we obtain , and , which are not as different as those from the training time series case. However, after the change point, the fitted parameters are shown to be , and , thus confirming a significant change in the parameters. For instance, the sum of and in the training data is 0.899, which changes from 0.945 to 0.707 in the testing data.
6. Concluding Remarks
In this study, we proposed the CUSUM test based on the residuals obtained with the SVR and TSVR-INGARCH models to detect a parameter change in the conditional mean of the time series of counts. To improve accuracy and efficiency, we also employed the PSO method to obtain an optimal set of hyperparameters. Monte Carlo simulations were conducted using the INAR and INGARCH models with various parameter settings. The results showed that the TSVR method using the ML proxy and the conditional mean -targeting method is recommendable, as it generally performs well and markedly reduces computational time. Our method was then applied to the analysis of the return times of extreme events constructed based on the daily log-returns of Goldman Sachs stock prices and, subsequently, detected one change. Overall, our findings, based on a simulation study and real data analysis, demonstrated the validity of our method. Although the proposed method performs well in general, it might have a limitation in its performance when the amount of available training data is not large enough or the dataset has features that can violate the stationarity, e.g., high volatilities. The method can also suffer from over-fitting to a specific training sample. Thus, it would be an important task to develop more robust methods, which we leave as our future project.
Author Contributions
Conceptualization, S.L. (Sangyeol Lee); methodology, S.L. (Sangyeol Lee) and S.L. (Sangjo Lee); software, S.L. (Sangjo Lee); formal analysis, S.L. (Sangyeol Lee) and S.L. (Sangjo Lee); data curation, S.L. (Sangjo Lee); writing—original draft preparation, S.L. (Sangyeol Lee) and S.L. (Sangjo Lee); writing—review and editing, S.L. (Sangyeol Lee) and S.L. (Sangjo Lee); funding acquisition, S.L. (Sangyeol Lee). All authors have read and agreed to the published version of the manuscript.
Funding
This work was supported by the National Research Foundation of Korea (NRF) grant funded by the Korea government (MSIT), grant no. NRF-2021R1A2C1004009.
Data Availability Statement
Publicly available datasets were analyzed in this study. This data can be found here: https://finance.yahoo.com, (accessed on 10 August 2020).
Acknowledgments
We sincerely thank the Editor and the two anonymous reviewers for their precious time and valuable comments.
Conflicts of Interest
The authors declare no conflict of interest.
Abbreviations
The following abbreviations are used in this manuscript:
| SVR | Support vector regression |
| TSVR | Twin support vector regression |
| PSO | Particle swarm optimization |
| INGARCH | Integer-valued generalized autoregressive conditional heteroskedasticity |
| CUSUM | Cumulative sum |
| INAR | Integer-valued autoregressive |
| QMLE | Quasi-maximum likelihood estimation |
| ARMA | Autoregressive and moving average |
| GARCH | Generalized autoregressive conditional heteroskedasticity |
| NB | Negative binomial |
| CMLE | Conditional maximum likelihood estimator |
| SVM | Support vector machine |
| MAE | Mean absolute error |
Appendix A

Table A1.
Empirical sizes and powers for the INGARCH(1,1) model, Case 1.
| Method | SVR | TSVR | ||||||||
|---|---|---|---|---|---|---|---|---|---|---|
| Target | ||||||||||
| Proxy | MA | ML | MA | ML | MA | ML | MA | ML | ||
| size | 0.072 | 0.104 | 0.000 | 0.096 | 0.076 | 0.064 | 0.000 | 0.074 | ||
| 0.040 | 0.034 | 0.032 | 0.042 | 0.036 | 0.038 | 0.032 | 0.046 | |||
| power | 1.000 | 1.000 | 0.640 | 1.000 | 0.984 | 0.860 | 0.274 | 0.996 | ||
| 0.968 | 0.980 | 0.776 | 0.994 | 0.984 | 0.964 | 0.808 | 0.990 | |||
| 1.000 | 1.000 | 1.000 | 1.000 | 0.972 | 0.962 | 0.948 | 0.956 | |||
| 1.000 | 1.000 | 1.000 | 1.000 | 1.000 | 1.000 | 1.000 | 1.000 | |||
| 1.000 | 1.000 | 0.978 | 1.000 | 0.976 | 0.868 | 0.620 | 0.982 | |||
| 0.986 | 0.994 | 0.936 | 0.944 | 0.986 | 0.992 | 0.944 | 1.000 | |||
| 1.000 | 1.000 | 0.988 | 1.000 | 0.982 | 0.870 | 0.664 | 0.982 | |||
| 0.952 | 0.950 | 0.826 | 0.956 | 0.916 | 0.924 | 0.826 | 0.980 | |||
Table A2.
Empirical sizes and powers for the INGARCH(1,1) model, Case 2.
| Method | SVR | TSVR | ||||||||
|---|---|---|---|---|---|---|---|---|---|---|
| Target | ||||||||||
| Proxy | MA | ML | MA | ML | MA | ML | MA | ML | ||
| size | 0.062 | 0.114 | 0.000 | 0.104 | 0.072 | 0.068 | 0.000 | 0.084 | ||
| 0.048 | 0.044 | 0.048 | 0.044 | 0.038 | 0.048 | 0.050 | 0.046 | |||
| power | 1.000 | 1.000 | 0.878 | 1.000 | 1.000 | 0.986 | 0.826 | 1.000 | ||
| 0.620 | 0.558 | 0.636 | 0.566 | 0.556 | 0.520 | 0.590 | 0.504 | |||
| 1.000 | 1.000 | 1.000 | 1.000 | 0.962 | 0.920 | 0.770 | 1.000 | |||
| 0.996 | 0.996 | 0.996 | 1.000 | 0.992 | 1.000 | 0.986 | 1.000 | |||
| 1.000 | 1.000 | 1.000 | 1.000 | 0.974 | 0.918 | 0.790 | 1.000 | |||
| 0.996 | 0.994 | 0.988 | 1.000 | 0.986 | 0.980 | 0.956 | 1.000 | |||
| 1.000 | 1.000 | 1.000 | 1.000 | 0.976 | 0.928 | 0.824 | 1.000 | |||
| 0.990 | 0.988 | 0.902 | 0.994 | 0.946 | 0.948 | 0.870 | 1.000 | |||
Table A3.
Empirical sizes and powers for the INGARCH(1,1) model, Case 3.
| Method | SVR | TSVR | ||||||||
|---|---|---|---|---|---|---|---|---|---|---|
| Target | ||||||||||
| Proxy | MA | ML | MA | ML | MA | ML | MA | ML | ||
| size | 0.176 | 0.278 | 0.002 | 0.230 | 0.154 | 0.180 | 0.000 | 0.180 | ||
| 0.036 | 0.036 | 0.042 | 0.046 | 0.032 | 0.048 | 0.040 | 0.042 | |||
| power | 1.000 | 1.000 | 0.990 | 1.000 | 0.970 | 0.928 | 0.746 | 1.000 | ||
| 0.964 | 0.948 | 0.856 | 0.948 | 0.956 | 0.956 | 0.866 | 0.972 | |||
| 1.000 | 1.000 | 1.000 | 1.000 | 0.998 | 0.996 | 1.000 | 1.000 | |||
| 0.998 | 0.998 | 1.000 | 0.998 | 0.994 | 0.972 | 0.996 | 1.000 | |||
| 1.000 | 1.000 | 1.000 | 1.000 | 1.000 | 1.000 | 1.000 | 1.000 | |||
| 0.992 | 0.998 | 0.974 | 0.998 | 0.958 | 0.908 | 0.860 | 0.998 | |||
Table A4.
Empirical sizes and powers for the INGARCH(1,1) model, Case 4.
| Method | SVR | TSVR | ||||||||
|---|---|---|---|---|---|---|---|---|---|---|
| Target | ||||||||||
| Proxy | MA | ML | MA | ML | MA | ML | MA | ML | ||
| size | 0.258 | 0.260 | 0.020 | 0.174 | 0.172 | 0.158 | 0.018 | 0.100 | ||
| 0.036 | 0.040 | 0.032 | 0.030 | 0.032 | 0.026 | 0.024 | 0.030 | |||
| power | 0.992 | 0.996 | 0.820 | 0.998 | 0.934 | 0.904 | 0.422 | 0.848 | ||
| 0.492 | 0.472 | 0.326 | 0.428 | 0.602 | 0.586 | 0.570 | 0.776 | |||
| 1.000 | 1.000 | 0.994 | 1.000 | 0.996 | 0.994 | 0.994 | 1.000 | |||
| 0.800 | 0.780 | 0.436 | 0.604 | 0.634 | 0.674 | 0.406 | 0.644 | |||
| 1.000 | 1.000 | 0.996 | 1.000 | 0.998 | 0.994 | 1.000 | 1.000 | |||
| 0.926 | 0.920 | 0.716 | 0.862 | 0.882 | 0.890 | 0.712 | 0.956 | |||
Table A5.
Empirical sizes and powers for the INAR(1) model, Case 1.
| Method | SVR | TSVR | ||||||||
|---|---|---|---|---|---|---|---|---|---|---|
| Target | ||||||||||
| Proxy | MA | ML | MA | ML | MA | ML | MA | ML | ||
| size | 0.052 | 0.070 | 0.000 | 0.070 | 0.064 | 0.060 | 0.000 | 0.060 | ||
| 0.048 | 0.060 | 0.064 | 0.054 | 0.066 | 0.052 | 0.058 | 0.062 | |||
| power | 1.000 | 1.000 | 0.466 | 1.000 | 0.996 | 0.990 | 0.156 | 1.000 | ||
| 0.960 | 0.994 | 0.800 | 1.000 | 0.982 | 0.990 | 0.810 | 1.000 | |||
| 1.000 | 1.000 | 1.000 | 1.000 | 0.984 | 0.966 | 0.838 | 0.976 | |||
| 1.000 | 1.000 | 1.000 | 1.000 | 1.000 | 1.000 | 1.000 | 1.000 | |||
| 0.906 | 0.932 | 0.000 | 0.940 | 0.922 | 0.922 | 0.000 | 0.934 | |||
| 0.218 | 0.150 | 0.166 | 0.080 | 0.084 | 0.078 | 0.178 | 0.072 | |||
| 1.000 | 1.000 | 0.106 | 1.000 | 0.994 | 0.992 | 0.026 | 1.000 | |||
| 0.600 | 0.598 | 0.164 | 0.584 | 0.606 | 0.562 | 0.186 | 0.542 | |||
Table A6.
Empirical sizes and powers for the INAR(1) model, Case 2.
| Method | SVR | TSVR | ||||||||
|---|---|---|---|---|---|---|---|---|---|---|
| Target | ||||||||||
| Proxy | MA | ML | MA | ML | MA | ML | MA | ML | ||
| size | 0.068 | 0.084 | 0.000 | 0.070 | 0.068 | 0.068 | 0.000 | 0.060 | ||
| 0.062 | 0.044 | 0.038 | 0.048 | 0.042 | 0.048 | 0.036 | 0.040 | |||
| power | 1.000 | 1.000 | 0.630 | 1.000 | 1.000 | 0.998 | 0.692 | 1.000 | ||
| 0.578 | 0.566 | 0.716 | 0.442 | 0.492 | 0.552 | 0.708 | 0.452 | |||
| 1.000 | 1.000 | 0.992 | 1.000 | 0.976 | 0.962 | 0.688 | 1.000 | |||
| 0.986 | 0.998 | 0.996 | 1.000 | 1.000 | 1.000 | 0.998 | 1.000 | |||
| 0.990 | 1.000 | 0.002 | 0.996 | 0.998 | 0.996 | 0.000 | 0.996 | |||
| 0.282 | 0.224 | 0.162 | 0.096 | 0.122 | 0.148 | 0.170 | 0.112 | |||
| 1.000 | 1.000 | 0.340 | 1.000 | 1.000 | 0.996 | 0.138 | 1.000 | |||
| 0.800 | 0.822 | 0.172 | 0.830 | 0.812 | 0.774 | 0.204 | 0.812 | |||
Table A7.
Empirical sizes and powers for the INAR(1) model, Case 3.
| Method | SVR | TSVR | ||||||||
|---|---|---|---|---|---|---|---|---|---|---|
| Target | ||||||||||
| Proxy | MA | ML | MA | ML | MA | ML | MA | ML | ||
| size | 0.116 | 0.072 | 0.002 | 0.054 | 0.092 | 0.056 | 0.000 | 0.048 | ||
| 0.048 | 0.058 | 0.034 | 0.054 | 0.054 | 0.052 | 0.038 | 0.058 | |||
| power | 1.000 | 1.000 | 0.762 | 1.000 | 0.978 | 0.916 | 0.426 | 0.976 | ||
| 0.940 | 0.960 | 0.648 | 0.942 | 0.940 | 0.936 | 0.728 | 0.990 | |||
| 1.000 | 1.000 | 0.896 | 1.000 | 1.000 | 1.000 | 0.946 | 1.000 | |||
| 0.852 | 0.846 | 0.284 | 0.836 | 0.854 | 0.906 | 0.210 | 0.898 | |||
Table A8.
Empirical sizes and powers for the softplus INGARCH(1,1) model.
| Method | SVR | TSVR | ||||||||
|---|---|---|---|---|---|---|---|---|---|---|
| Target | ||||||||||
| Proxy | MA | ML | MA | ML | MA | ML | MA | ML | ||
| size | 0.072 | 0.114 | 0.000 | 0.108 | 0.080 | 0.062 | 0.000 | 0.072 | ||
| 0.034 | 0.032 | 0.034 | 0.038 | 0.032 | 0.036 | 0.030 | 0.046 | |||
| power | 1.000 | 0.998 | 0.666 | 1.000 | 0.978 | 0.862 | 0.284 | 0.996 | ||
| 0.966 | 0.982 | 0.792 | 0.992 | 0.984 | 0.962 | 0.828 | 0.986 | |||
| 1.000 | 0.998 | 0.984 | 1.000 | 0.980 | 0.834 | 0.658 | 0.982 | |||
| 0.982 | 0.986 | 0.932 | 0.994 | 0.982 | 0.988 | 0.924 | 1.000 | |||
| 1.000 | 1.000 | 0.984 | 1.000 | 0.980 | 0.842 | 0.704 | 0.978 | |||
| 0.948 | 0.938 | 0.810 | 0.950 | 0.926 | 0.936 | 0.830 | 0.964 | |||
Table A9.
Computing times for training the SVR and the TSVR methods.
| Method | SVR | TSVR | |||||||
|---|---|---|---|---|---|---|---|---|---|
| Target | |||||||||
| Proxy | MA | ML | MA | ML | MA | ML | MA | ML | |
| INGARCH | 918.02 | 863.33 | 1466.45 | 825.02 | 193.70 | 192.68 | 185.44 | 193.09 | |
| (190.61) | (201.94) | (247.97) | (305.41) | (19.79) | (19.11) | (15.94) | (21.02) | ||
| 1633.97 | 1065.13 | 1231.81 | 1029.88 | 224.41 | 245.24 | 155.52 | 162.26 | ||
| (319.64) | (229.89) | (191.73) | (363.53) | (22.42) | (27.33) | (16.06) | (17.89) | ||
| 1979.82 | 1552.36 | 2456.07 | 1766.37 | 195.97 | 207.49 | 191.79 | 192.45 | ||
| (242.94) | (366.01) | (395.27) | (666.71) | (20.59) | (21.05) | (19.60) | (19.34) | ||
| 1877.27 | 1940.01 | 2697.95 | 2219.46 | 1198.25 | 196.93 | 186.23 | 189.34 | ||
| (389.79) | (347.92) | (356.38) | (587.99) | (20.95) | (20.56) | (18.98) | (21.95) | ||
| INAR | 780.01 | 1379.59 | 1340.27 | 754.08 | 191.38 | 189.67 | 182.64 | 192.35 | |
| (189.10) | (358.28) | (256.68) | (255.29) | (20.17) | (19.59) | (16.42) | (26.07) | ||
| 1000.50 | 972.17 | 1128.04 | 1336.76 | 240.72 | 226.47 | 150.59 | 105.45 | ||
| (235.13) | (240.82) | (217.57) | (516.75) | (31.46) | (23.05) | (12.85) | (14.81) | ||
| 828.82 | 1437.23 | 1542.48 | 769.35 | 194.25 | 193.05 | 184.82 | 194.41 | ||
| (208.43) | (378.40) | (239.95) | (288.29) | (19.67) | (17.84) | (16.14) | (21.17) | ||
| softplus | 692.41 | 711.94 | 911.11 | 692.71 | 193.99 | 193.54 | 186.39 | 196.66 | |
| INGARCH | (118.22) | (146.43) | (157.28) | (206.60) | (19.01) | (18.86) | (17.34) | (20.83) | |
References
- Al-Osh, M.A.; Aly, E.-E.A.A. First order autoregressive time series with negative binomial and geometric marginals. Commun. Stat. Theory Methods 1992, 21, 2483–2492. [Google Scholar] [CrossRef]
- Alzaid, A.A.; Al-Osh, M. An integer-valued pth-order autoregressive structure (INAR(p)) process. J. Appl. Probab. 1990, 27, 314–324. [Google Scholar] [CrossRef]
- Ferland, R.; Latour, A.; Oraichi, D. Integer-valued GARCH process. J. Time Ser. Anal. 2006, 27, 923–942. [Google Scholar] [CrossRef]
- Fokianos, K.; Rahbek, A.; Tjøstheim, D. Poisson autoregression. J. Am. Stat. Assoc. 2009, 104, 1430–1439. [Google Scholar] [CrossRef] [Green Version]
- McKenzie, E. Some simple models for discrete variate time series1. J. Am. Water Resour. Assoc. 1985, 21, 645–650. [Google Scholar] [CrossRef]
- Weiß, C.H. An Introduction to Discrete-Valued Time Series; Wiley: New York, NY, USA, 2018. [Google Scholar]
- Kang, J.; Lee, S. Parameter change test for random coefficient integer-valued autoregressive processes with application to polio data analysis. J. Time Ser. Anal. 2009, 30, 239–258. [Google Scholar] [CrossRef]
- Kim, H.; Lee, S. Improved CUSUM monitoring of Markov counting process with frequent zeros. Qual. Reliab. Eng. Int. 2019, 35, 2371–2394. [Google Scholar] [CrossRef]
- Lee, Y.; Lee, S.; Tjøstheim, D. Asymptotic normality and parameter change test for bivariate Poisson INGARCH models. Test 2018, 27, 52–69. [Google Scholar] [CrossRef]
- Kim, B.; Lee, S. Robust change point test for general integer-valued time series models based on density power divergence. Entropy 2020, 22, 493. [Google Scholar] [CrossRef] [PubMed]
- Christou, V.; Fokianos, K. Quasi-likelihood inference for negative binomial time series models. J. Time Ser. Anal. 2014, 35, 55–78. [Google Scholar] [CrossRef]
- Davis, R.A.; Liu, H. Theory and inference for a class of nonlinear models with application to time series of counts. Stat. Sin. 2016, 26, 1673–1707. [Google Scholar] [CrossRef] [Green Version]
- Jazi, M.A.; Jones, G.; Lai, C.D. First-order integer valued AR processes with zero inflated Poisson innovations. J. Time Ser. Anal. 2012, 33, 954–963. [Google Scholar] [CrossRef]
- Kim, B.; Lee, S. Robust estimation for general integer-valued time series models. Ann. Inst. Stat. Math. 2019, 72, 1371–1396. [Google Scholar] [CrossRef]
- Zhu, F. A negative binomial integer-valued GARCH model. J. Time Ser. Anal. 2011, 32, 54–67. [Google Scholar] [CrossRef]
- Ahmad, A.; Francq, C. Poisson QMLE of count time series models. J. Time Ser. Anal. 2016, 37, 291–314. [Google Scholar] [CrossRef]
- Bezerra, P.C.S.; Albuquerque, P.H.M. Volatility forecasting via SVR–GARCH with mixture of Gaussian kernels. Comput. Manag. Sci. 2017, 14, 179–196. [Google Scholar] [CrossRef]
- Cao, L.; Tay, F.E. Financial forecasting using support vector machines. Neural. Comput. Appl. 2001, 10, 184–192. [Google Scholar] [CrossRef]
- Chen, S.; Härdle, W.K.; Jeong, K. Forecasting volatility with support vector machine-based GARCH model. J. Forecast. 2010, 29, 406–433. [Google Scholar] [CrossRef]
- Cherkassky, V.; Ma, Y. Practical selection of SVM parameters and noise estimation for SVM regression. Neural Netw. 2004, 17, 113–126. [Google Scholar] [CrossRef] [Green Version]
- Lee, S.; Lee, S.; Moon, M. Hybrid change point detection for time series via support vector regression and CUSUM method. Appl. Soft Comput. 2020, 89, 106101. [Google Scholar] [CrossRef]
- Lee, S.; Kim, C.K.; Lee, S. Hybrid CUSUM change point test for time series with time-varying volatilities based on support vector regression. Entropy 2020, 22, 578. [Google Scholar] [CrossRef]
- Pérez-Cruz, F.; Afonso-Rodríguez, J.A.; Giner, J. Estimating GARCH models using support vector machines. Quant. Finance 2003, 3, 163–172. [Google Scholar] [CrossRef]
- Shim, J.; Kim, Y.; Lee, J.; Hwang, C. Estimating value at risk with semiparametric support vector quantile regression. Comput. Stat. 2012, 27, 685–700. [Google Scholar] [CrossRef]
- Shim, J.; Hwang, C.; Seok, K. Support vector quantile regression with varying coefficients. Comput. Stat. 2016, 31, 1015–1030. [Google Scholar] [CrossRef]
- Vapnik, V.N. The Nature Of Statistical Learning Theory; Springer: New York, NY, USA, 2000. [Google Scholar] [CrossRef]
- Smola, A.J.; Schölkopf, B. A tutorial on support vector regression. Stat. Comput. 2004, 14, 199–222. [Google Scholar] [CrossRef] [Green Version]
- Lee, Y.J.; Hsieh, W.F.; Huang, C.M. ϵ-SSVR: A smooth support vector machine for ϵ-insensitive regression. IEEE Trans. Knowl. Data Eng. 2005, 17, 678–685. [Google Scholar] [CrossRef]
- Suykens, J.A.K.; Vandewalle, J. Least squares support vector machine classifiers. Neural Process. Lett. 1999, 9, 293–300. [Google Scholar] [CrossRef]
- Peng, X. TSVR: An efficient twin support vector machine for regression. Neural Netw. 2010, 23, 365–372. [Google Scholar] [CrossRef] [PubMed]
- Gupta, D.; Pratama, M.; Ma, Z.; Li, J.; Prasad, M. Financial time series forecasting using twin support vector regression. PLoS ONE 2019, 14, 1–27. [Google Scholar] [CrossRef]
- Tomar, D.; Agarwal, S. Twin support vector machine: A review from 2007 to 2014. Egypt. Inform. J. 2015, 16, 55–69. [Google Scholar] [CrossRef]
- Zhong, P.; Xu, Y.; Zhao, Y. Training twin support vector regression via linear programming. Neural. Comput. Appl. 2012, 21, 399–407. [Google Scholar] [CrossRef]
- Kennedy, J.; Eberhart, R. Particle swarm optimization. In Proceedings of the ICNN’95—International Conference on Neural Networks, Perth, WA, Australia, 27 November–1 December 1995; pp. 1942–1948. [Google Scholar] [CrossRef]
- Wang, D.; Tan, D.; Liu, L. Particle swarm optimization algorithm: An overview. Soft Comput. 2018, 22, 387–408. [Google Scholar] [CrossRef]
- Zhang, Y.; Wang, S.; Ji, G. A comprehensive survey on particle swarm optimization algorithm and its applications. Math. Probl. Eng. 2015, 2015, 1–38. [Google Scholar] [CrossRef] [Green Version]
- Page, E.S. A test for a change in a parameter occurring at an unknown point. Biometrika 1955, 42, 523. [Google Scholar] [CrossRef]
- Chen, J.; Gupta, A.K. Parametric Statistical Change Point Analysis: With Applications To Genetics, Medicine, and Finance, 2nd ed.; Birkhäuser: Boston, MA, USA, 2012. [Google Scholar]
- Csörgö, M.; Horváth, L. Limit Theorems In Change-Point Analysis; John Wiley & Sons Inc.: New York, NY, USA, 2012. [Google Scholar]
- Berkes, I.; Gombay, E.; Horváth, L.; Kokoszka, P. Sequential change-point detection in GARCH(p,q) models. Econ. Theory 2004, 20, 1140–1167. [Google Scholar] [CrossRef]
- Inclán, C.; Tiao, G.C. Use of cumulative sums of squares for retrospective detection of changes of variance. J. Am. Stat. Assoc. 1994, 89, 913–923. [Google Scholar] [CrossRef]
- Lee, S.; Ha, J.; Na, O.; Na, S. The cusum test for parameter change in time series models. Scand. Stat. Theory Appl. 2003, 30, 781–796. [Google Scholar] [CrossRef]
- Oh, H.; Lee, S. Modified residual CUSUM test for location-scale time series models with heteroscedasticity. Ann. Inst. Stat. Math. 2018, 71, 1059–1091. [Google Scholar] [CrossRef]
- Ross, G.J. Modelling financial volatility in the presence of abrupt changes. Physica A 2013, 392, 350–360. [Google Scholar] [CrossRef] [Green Version]
- Kang, J.; Lee, S. Parameter change test for Poisson autoregressive models. Scand. Stat. Theory Appl. 2014, 41, 1136–1152. [Google Scholar] [CrossRef]
- Fokianos, K.; Fried, R. Interventions in INGARCH processes. J. Time Ser. Anal. 2010, 31, 210–225. [Google Scholar] [CrossRef] [Green Version]
- Franke, J.; Kirch, C.; Kamgaing, J.T. Changepoints in times series of counts. J. Time Ser. Anal. 2012, 33, 757–770. [Google Scholar] [CrossRef]
- Fokianos, K.; Gombay, E.; Hussein, A. Retrospective change detection for binary time series models. J. Stat. Plan. Inference 2014, 145, 102–112. [Google Scholar] [CrossRef]
- Rakitzis, A.C.; Castagliola, P.; Maravelakis, P.E. On the modelling and monitoring of general inflated poisson processes. Qual. Reliab. Eng. Int. 2016, 32, 1837–1851. [Google Scholar] [CrossRef]
- Lee, Y.; Lee, S. CUSUM test for general nonlinear integer-valued GARCH models: Comparison study. Ann. Inst. Stat. Math. 2019, 71, 1033–1057. [Google Scholar] [CrossRef]
- De Pooter, M.; Van Dijk, D. Testing for Changes in Volatility in Heteroskedastic Time Series—A Further Examination. Available online: https://repub.eur.nl/pub/1627/ (accessed on 28 July 2020).
- Lee, S.; Tokutsu, Y.; Maekawa, K. The cusum test for parameter change in regression models with ARCH errors. J. Jpn. Stat. Soc. 2004, 34, 173–188. [Google Scholar] [CrossRef] [Green Version]
- Lee, S. Location and scale-based CUSUM test with application to autoregressive models. J. Stat. Comput. Simul. 2020, 90, 2309–2328. [Google Scholar] [CrossRef]
- Lee, S.; Lee, S. Exponential family QMLE-based CUSUM test for integer-valued time series. Commun. Stat. Simul. Comput. 2021. accepted. [Google Scholar]
- Lee, S. Residual-based CUSUM of squares test for poisson integer-valued GARCH models. J. Stat. Comput. Simul. 2019, 89, 3182–3195. [Google Scholar] [CrossRef]
- Lee, S.; Kim, D.; Seok, S. Modelling and inference for counts time series based on zero-infated exponential family INGARCH models. J. Stat. Comput. Simul. 2021, in press. [Google Scholar] [CrossRef]
- Billingsley, P. Convergence of Probability Measures, 2nd ed.; John Wiley & Sons: Hoboken, NJ, USA, 1999. [Google Scholar]
- Cortes, C.; Vapnik, V. Support-vector networks. Mach. Learn. 1995, 20, 273–297. [Google Scholar] [CrossRef]
- Khemchandani, R.; Chandra, S. Twin Support Vector Machines for Pattern Classification. IEEE Trans. Pattern Anal. Mach. Intell. 2007, 29, 905–910. [Google Scholar] [CrossRef]
- Bendtsen, C. Pso: Particle Swarm Optimization. R Package Version 1.0.3. Foundation for Statistical Computing. Available online: https://cran.r-project.org/web/packages/pso (accessed on 27 July 2020).
- Karatzoglou, A.; Smola, A.; Hornik, K.; Zeileis, A. Kernlab—An S4 package for kernel methods in R. J. Stat. Softw. 2004, 11, 1–20. [Google Scholar] [CrossRef] [Green Version]
- Stellato, B.; Banjac, G.; Goulart, P.; Boyd, S. Osqp: Quadratic Programming Solver Using the ‘osqp’ Library. R Package Version 0.6.0.3; Foundation for Statistical Computing. Available online: https://cran.r-project.org/web/packages/osqp (accessed on 27 July 2020).
- Weiss, C.H.; Zhu, F.; Hoshiyar, A. Softplus INGARCH models. Stat. Sin. 2020, in press. [Google Scholar]
Figure 1.
Goldman Sachs stock price.
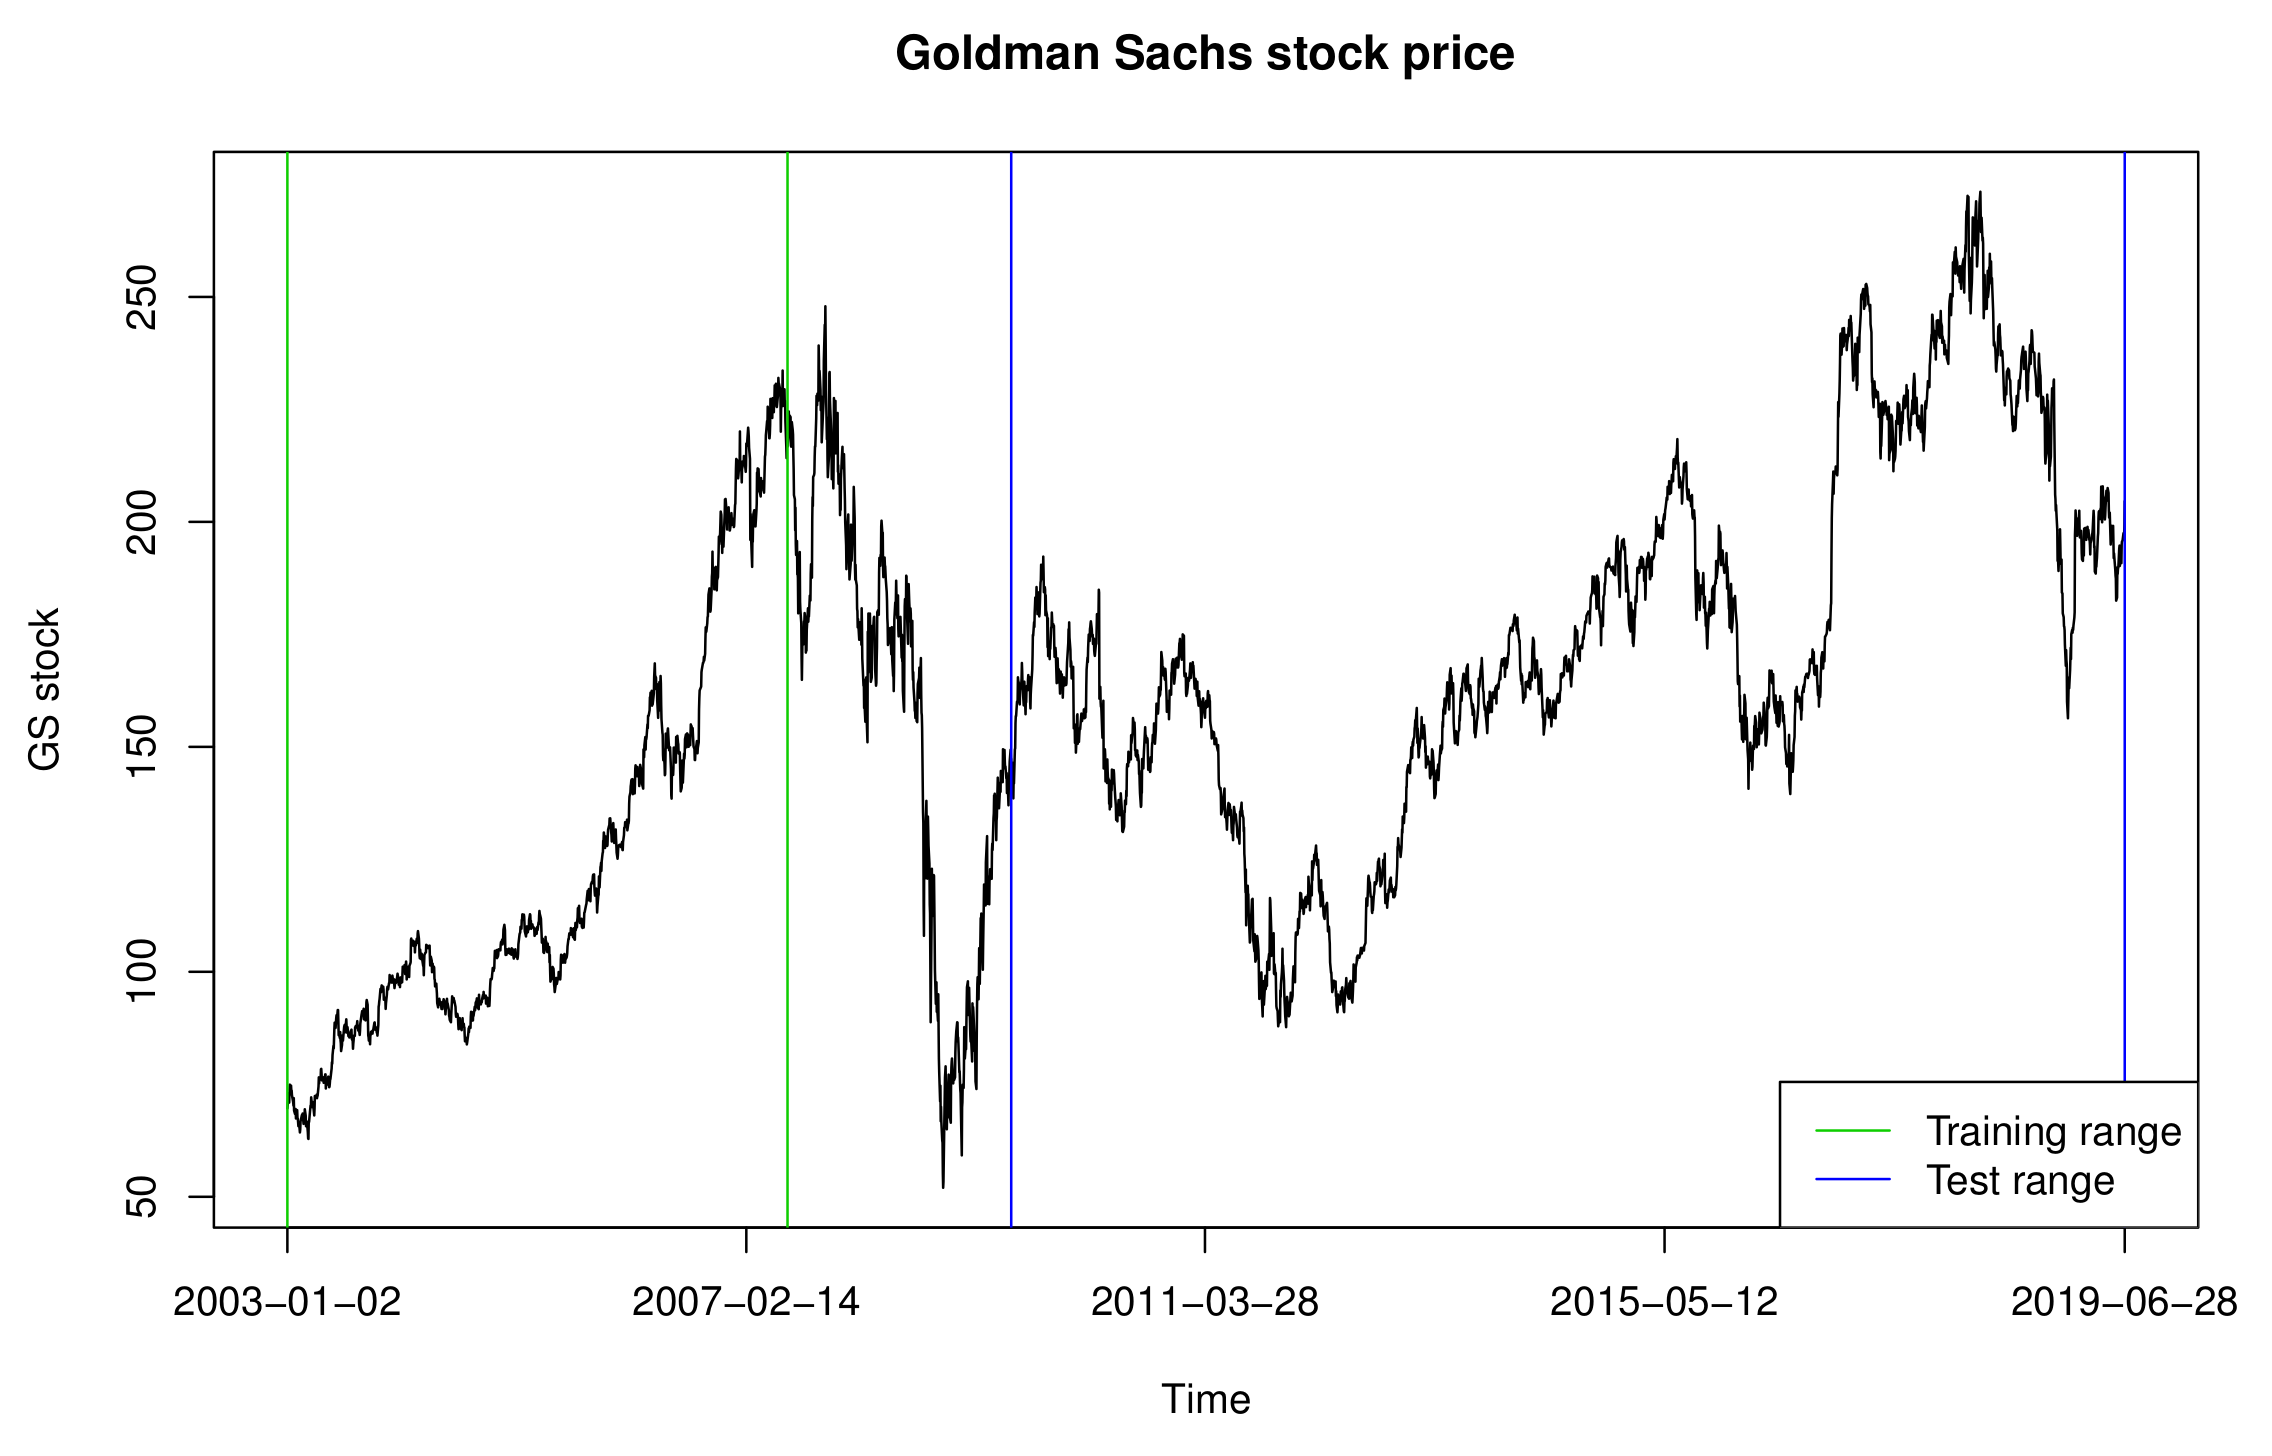
Figure 2.
Log-return of Goldman Sachs stock price.
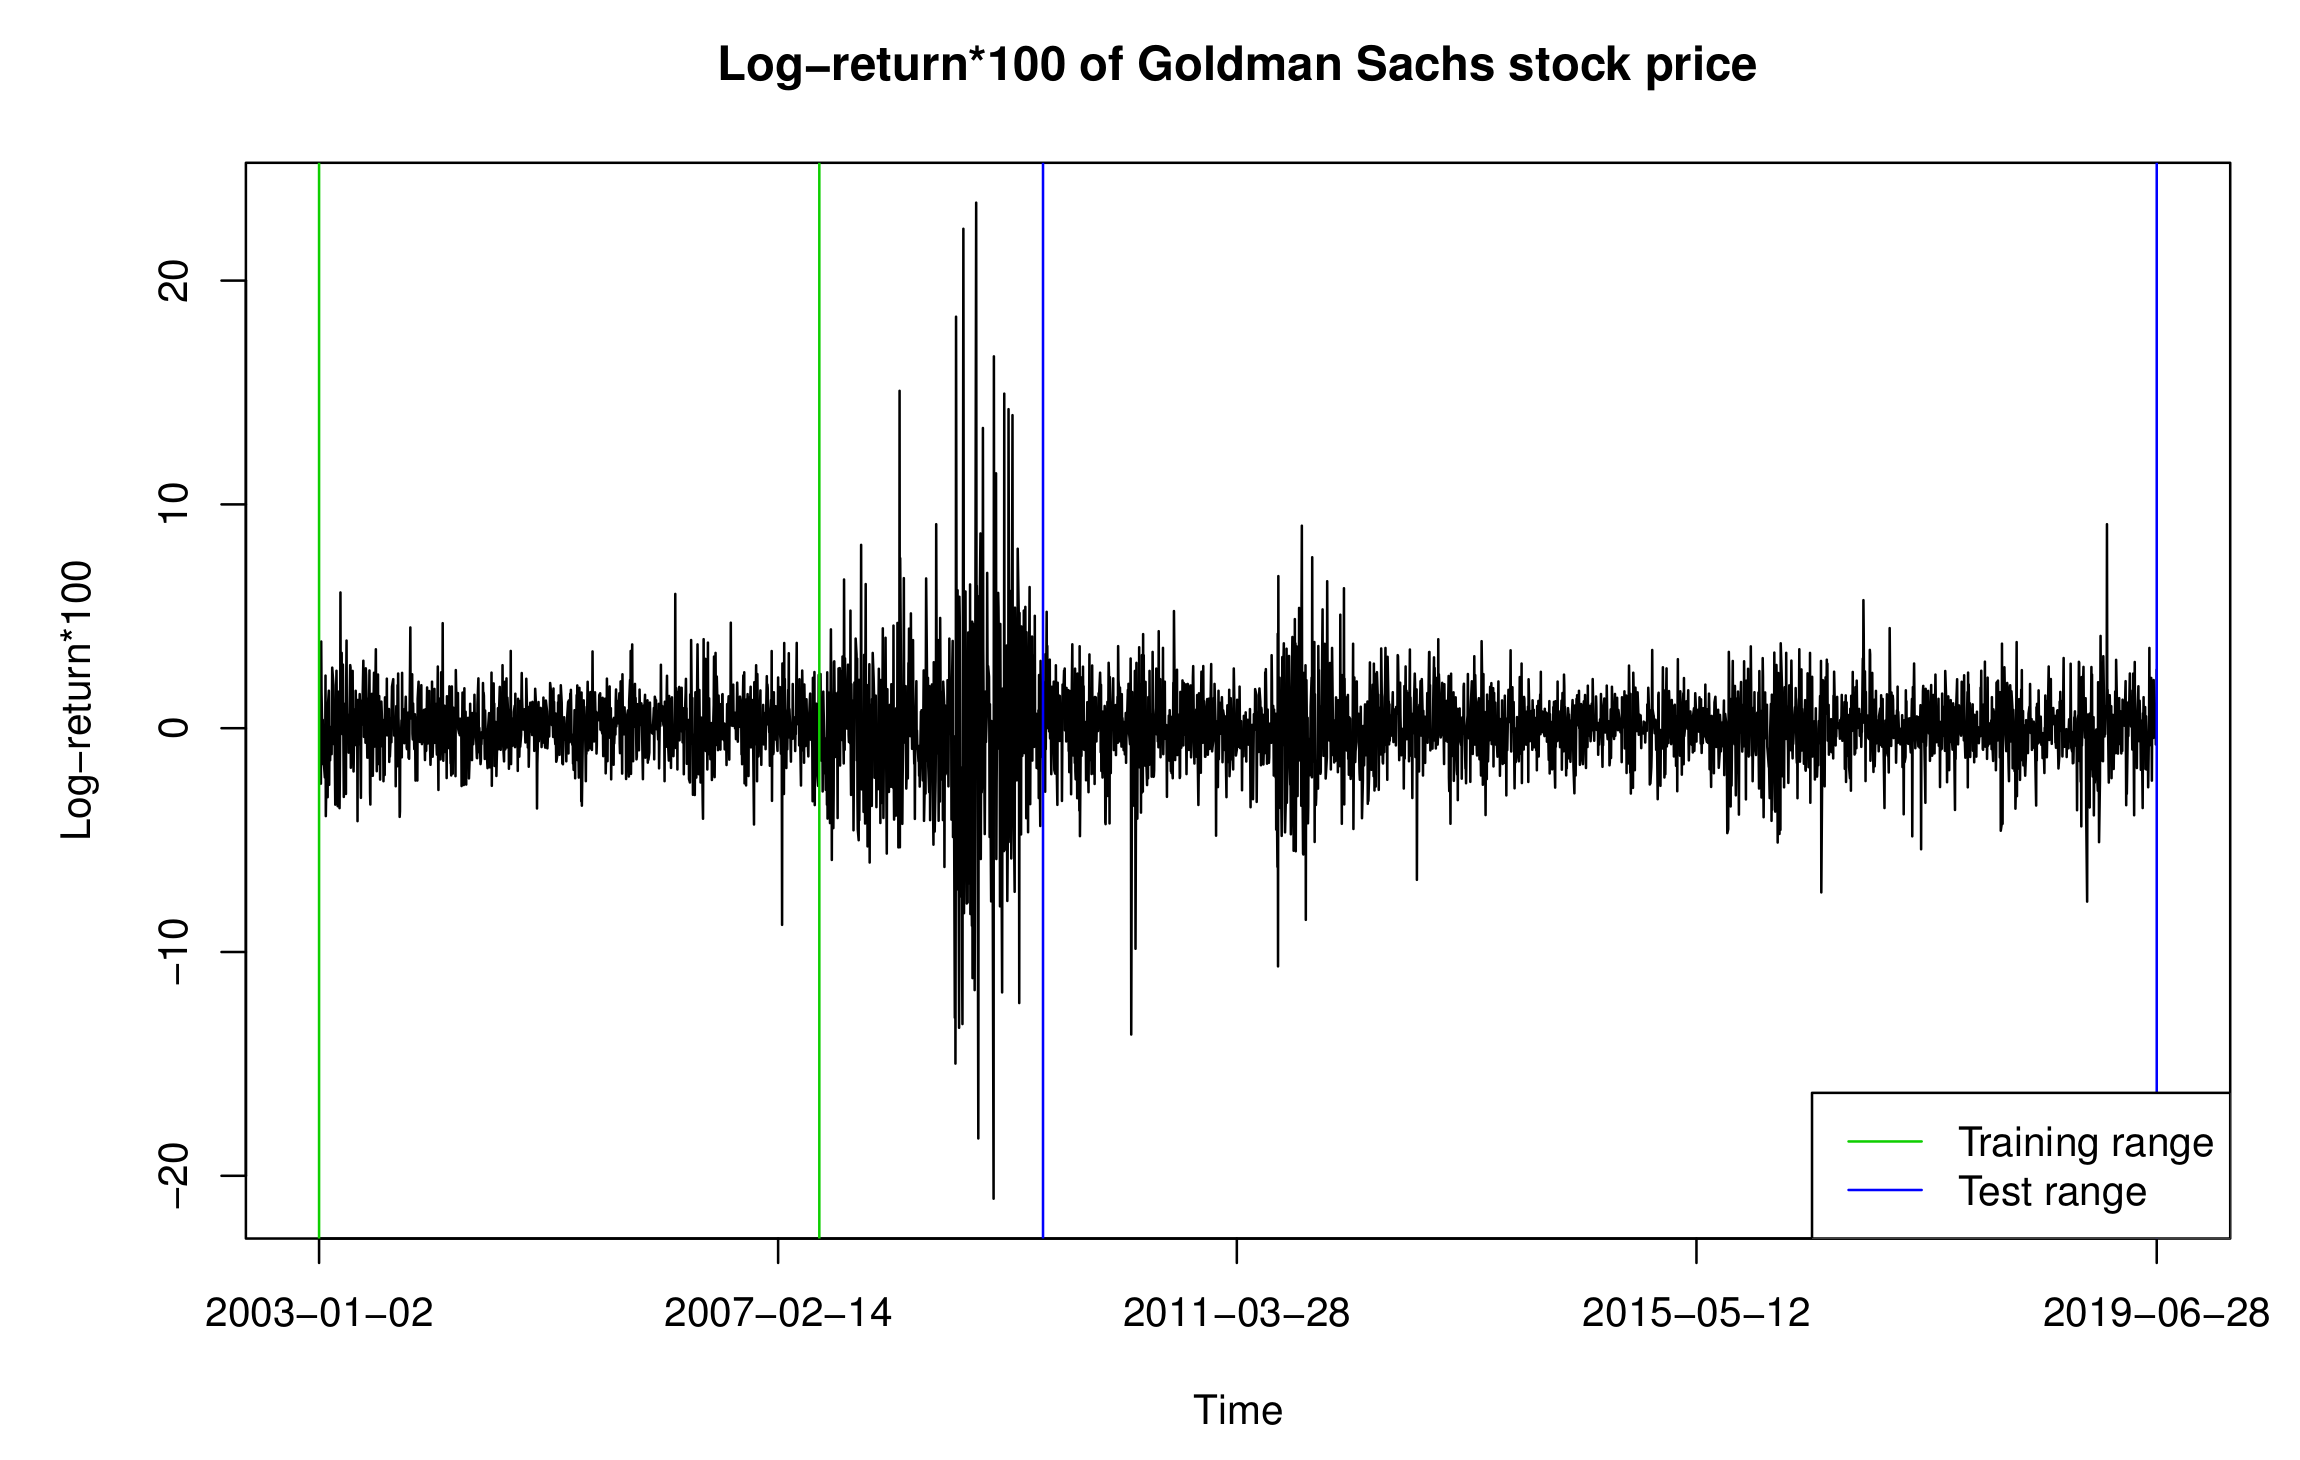
Figure 3.
Return time of extreme events of Goldman Sachs stock prices.
Publisher’s Note: MDPI stays neutral with regard to jurisdictional claims in published maps and institutional affiliations. |
© 2021 by the authors. Licensee MDPI, Basel, Switzerland. This article is an open access article distributed under the terms and conditions of the Creative Commons Attribution (CC BY) license (https://creativecommons.org/licenses/by/4.0/).
Share and Cite
MDPI and ACS Style
Lee, S.; Lee, S. Change Point Test for the Conditional Mean of Time Series of Counts Based on Support Vector Regression. Entropy 2021, 23, 433. https://doi.org/10.3390/e23040433
AMA Style
Lee S, Lee S. Change Point Test for the Conditional Mean of Time Series of Counts Based on Support Vector Regression. Entropy. 2021; 23(4):433. https://doi.org/10.3390/e23040433
Chicago/Turabian StyleLee, Sangyeol, and Sangjo Lee. 2021. "Change Point Test for the Conditional Mean of Time Series of Counts Based on Support Vector Regression" Entropy 23, no. 4: 433. https://doi.org/10.3390/e23040433
Note that from the first issue of 2016, this journal uses article numbers instead of page numbers. See further details here.