Composite Interpolation-Based Multiscale Fuzzy Entropy and Its Application to Fault Diagnosis of Rolling Bearing


Abstract
:1. Introduction
2. Composite Interpolation Multiscale Fuzzy Entropy
2.1. MSE and CMSE Methods
- (1)
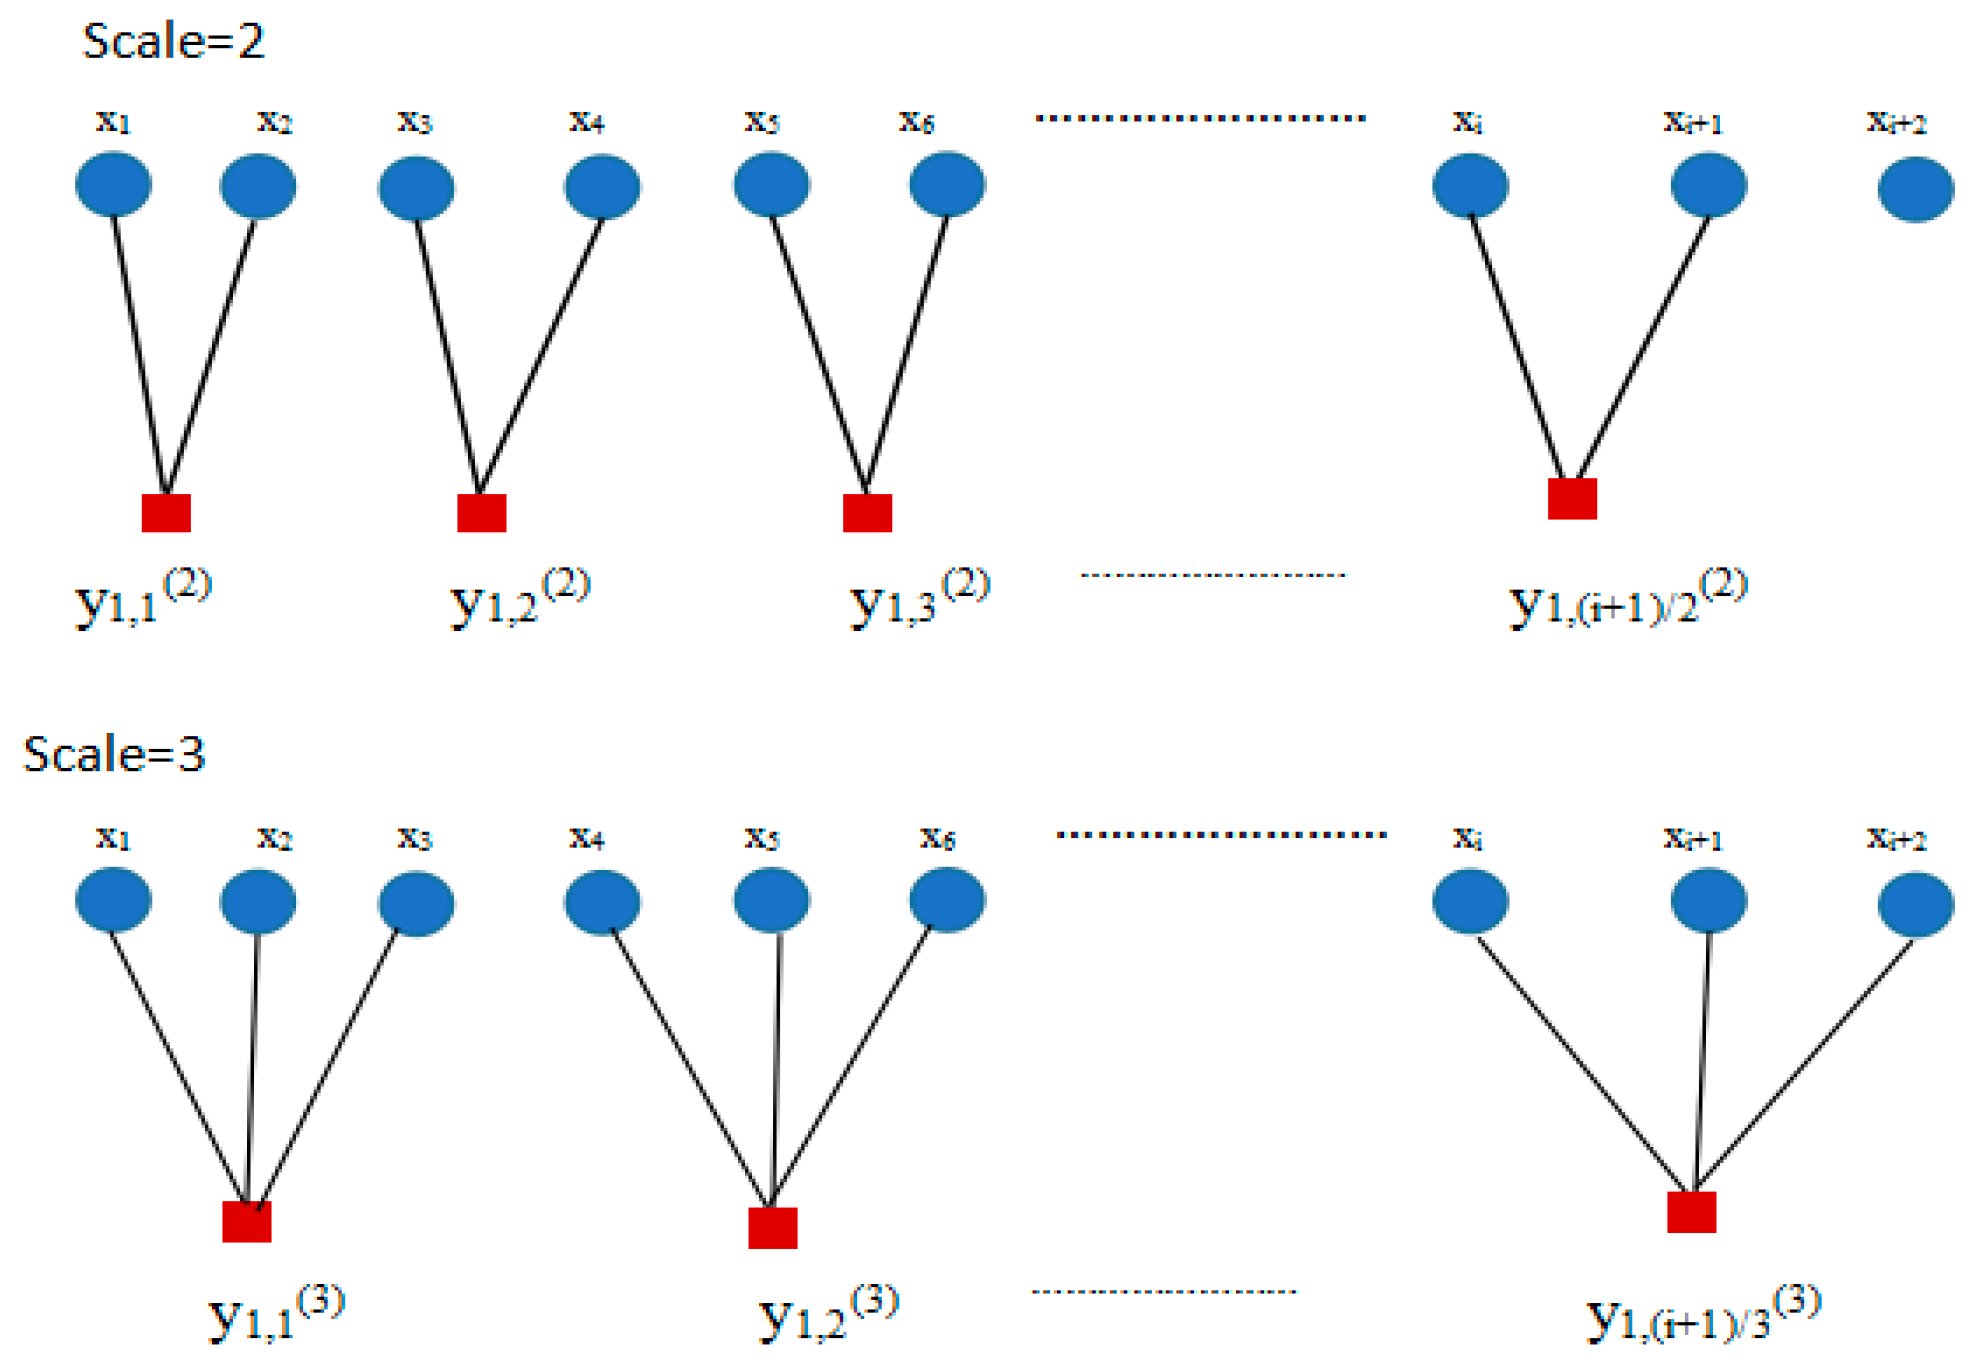
- For original data with length N, the coarse-grained sequence is established as:where is scale factor. is the original time series and when , is divided into coarse-grained sequence with length (no greater than the positive integer ).
- (2)
- Sample entropy of each coarse-grained sequence are calculated under the same similar tolerance as follows:where, m is the embedding dimension, n is the exponential function gradient parameter, and r is the tolerance. Then all obtained entropies can be seen as a function at scale factor and this process is called multiscale entropy analysis.
- (1)
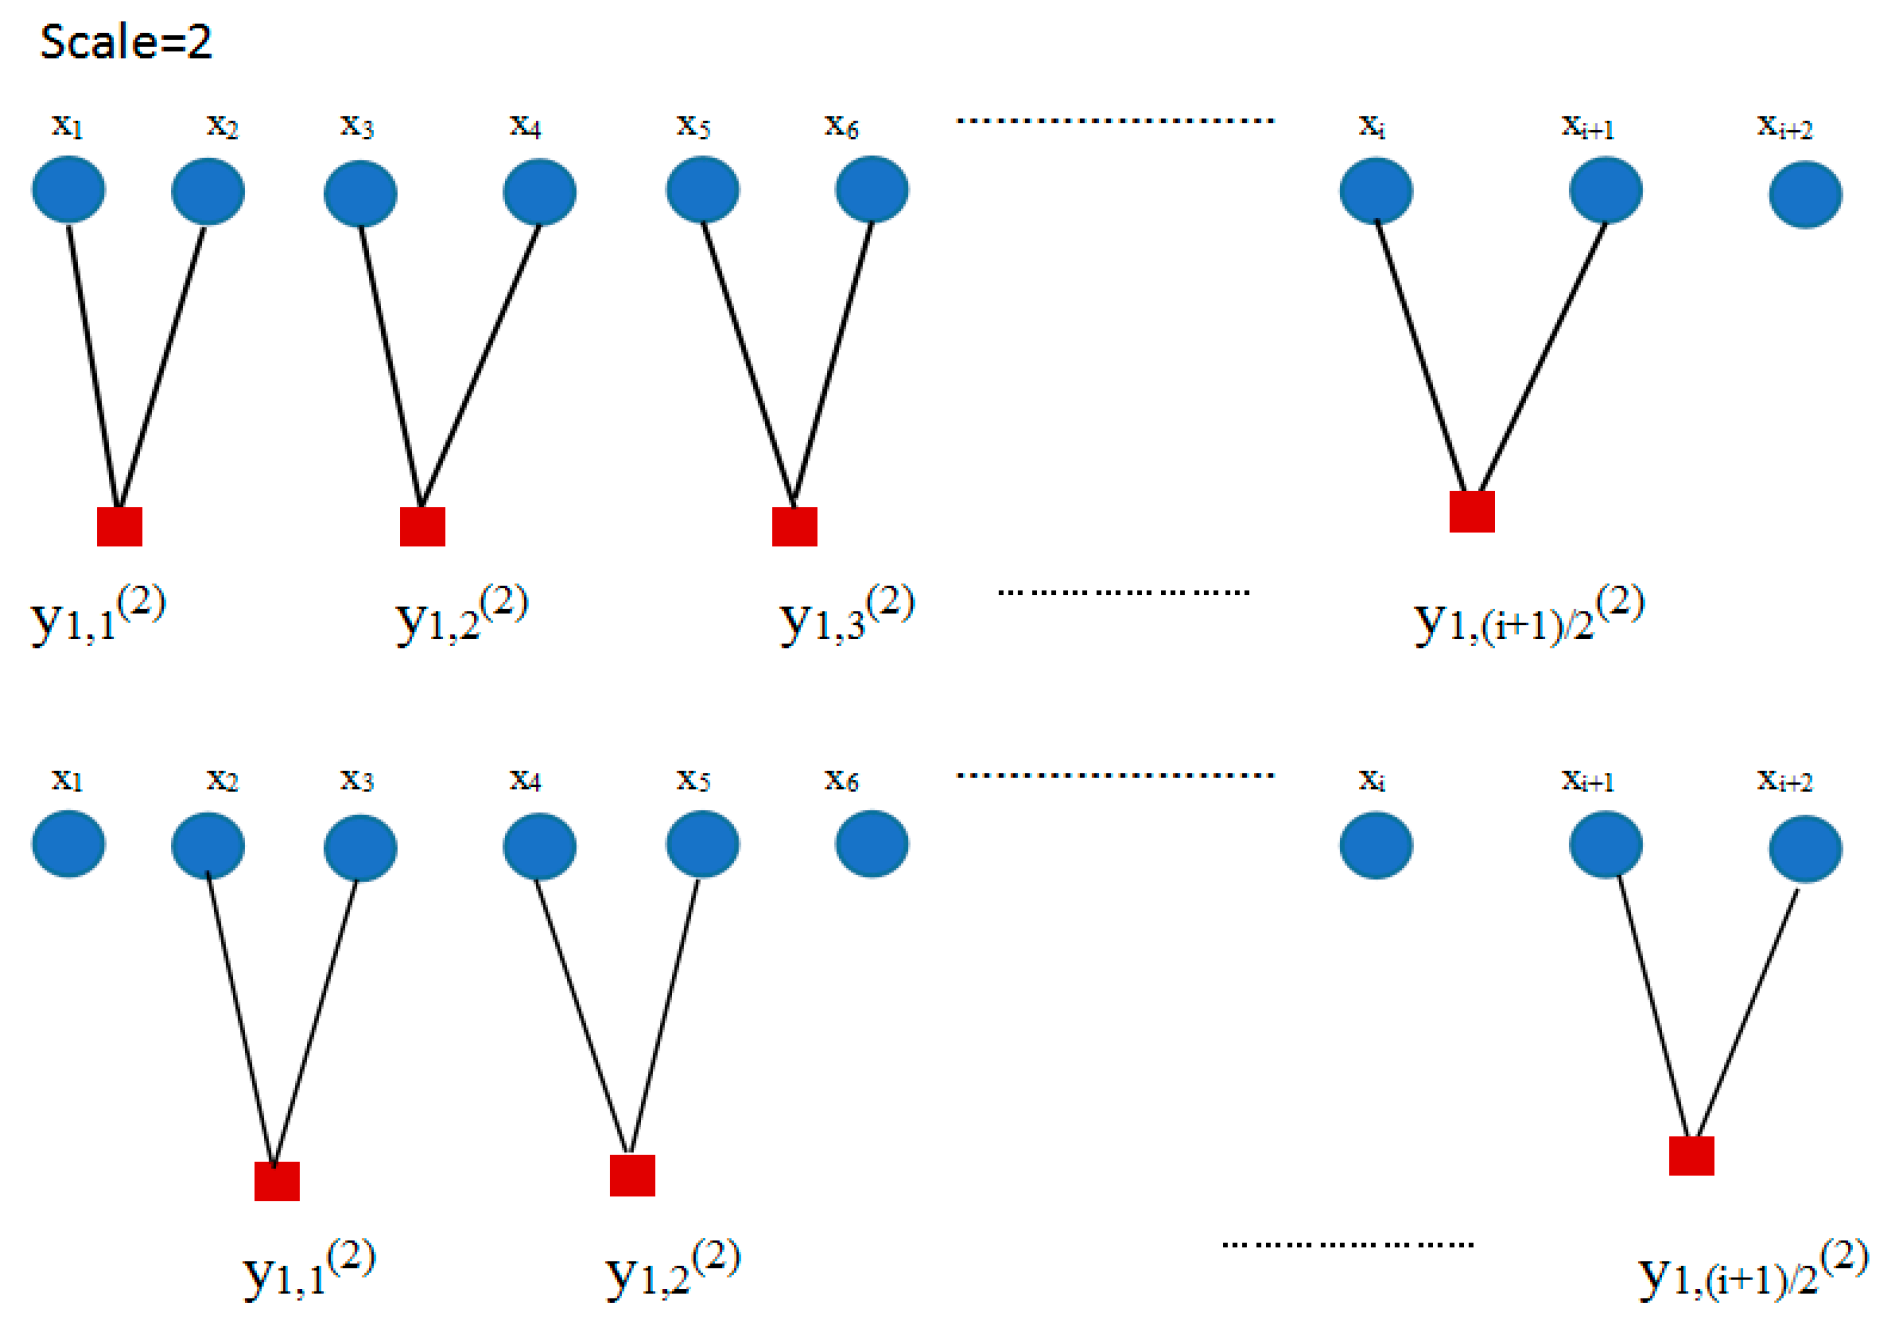
- For the time series with data length N, the coarse grained series , can be calculated as:
- (2)
- For each scale factor and , the SampEns of each coarse grained sequence are calculated and then the average of all the k SampEn values for each are computed. The CMSE for scale factor is obtained by:
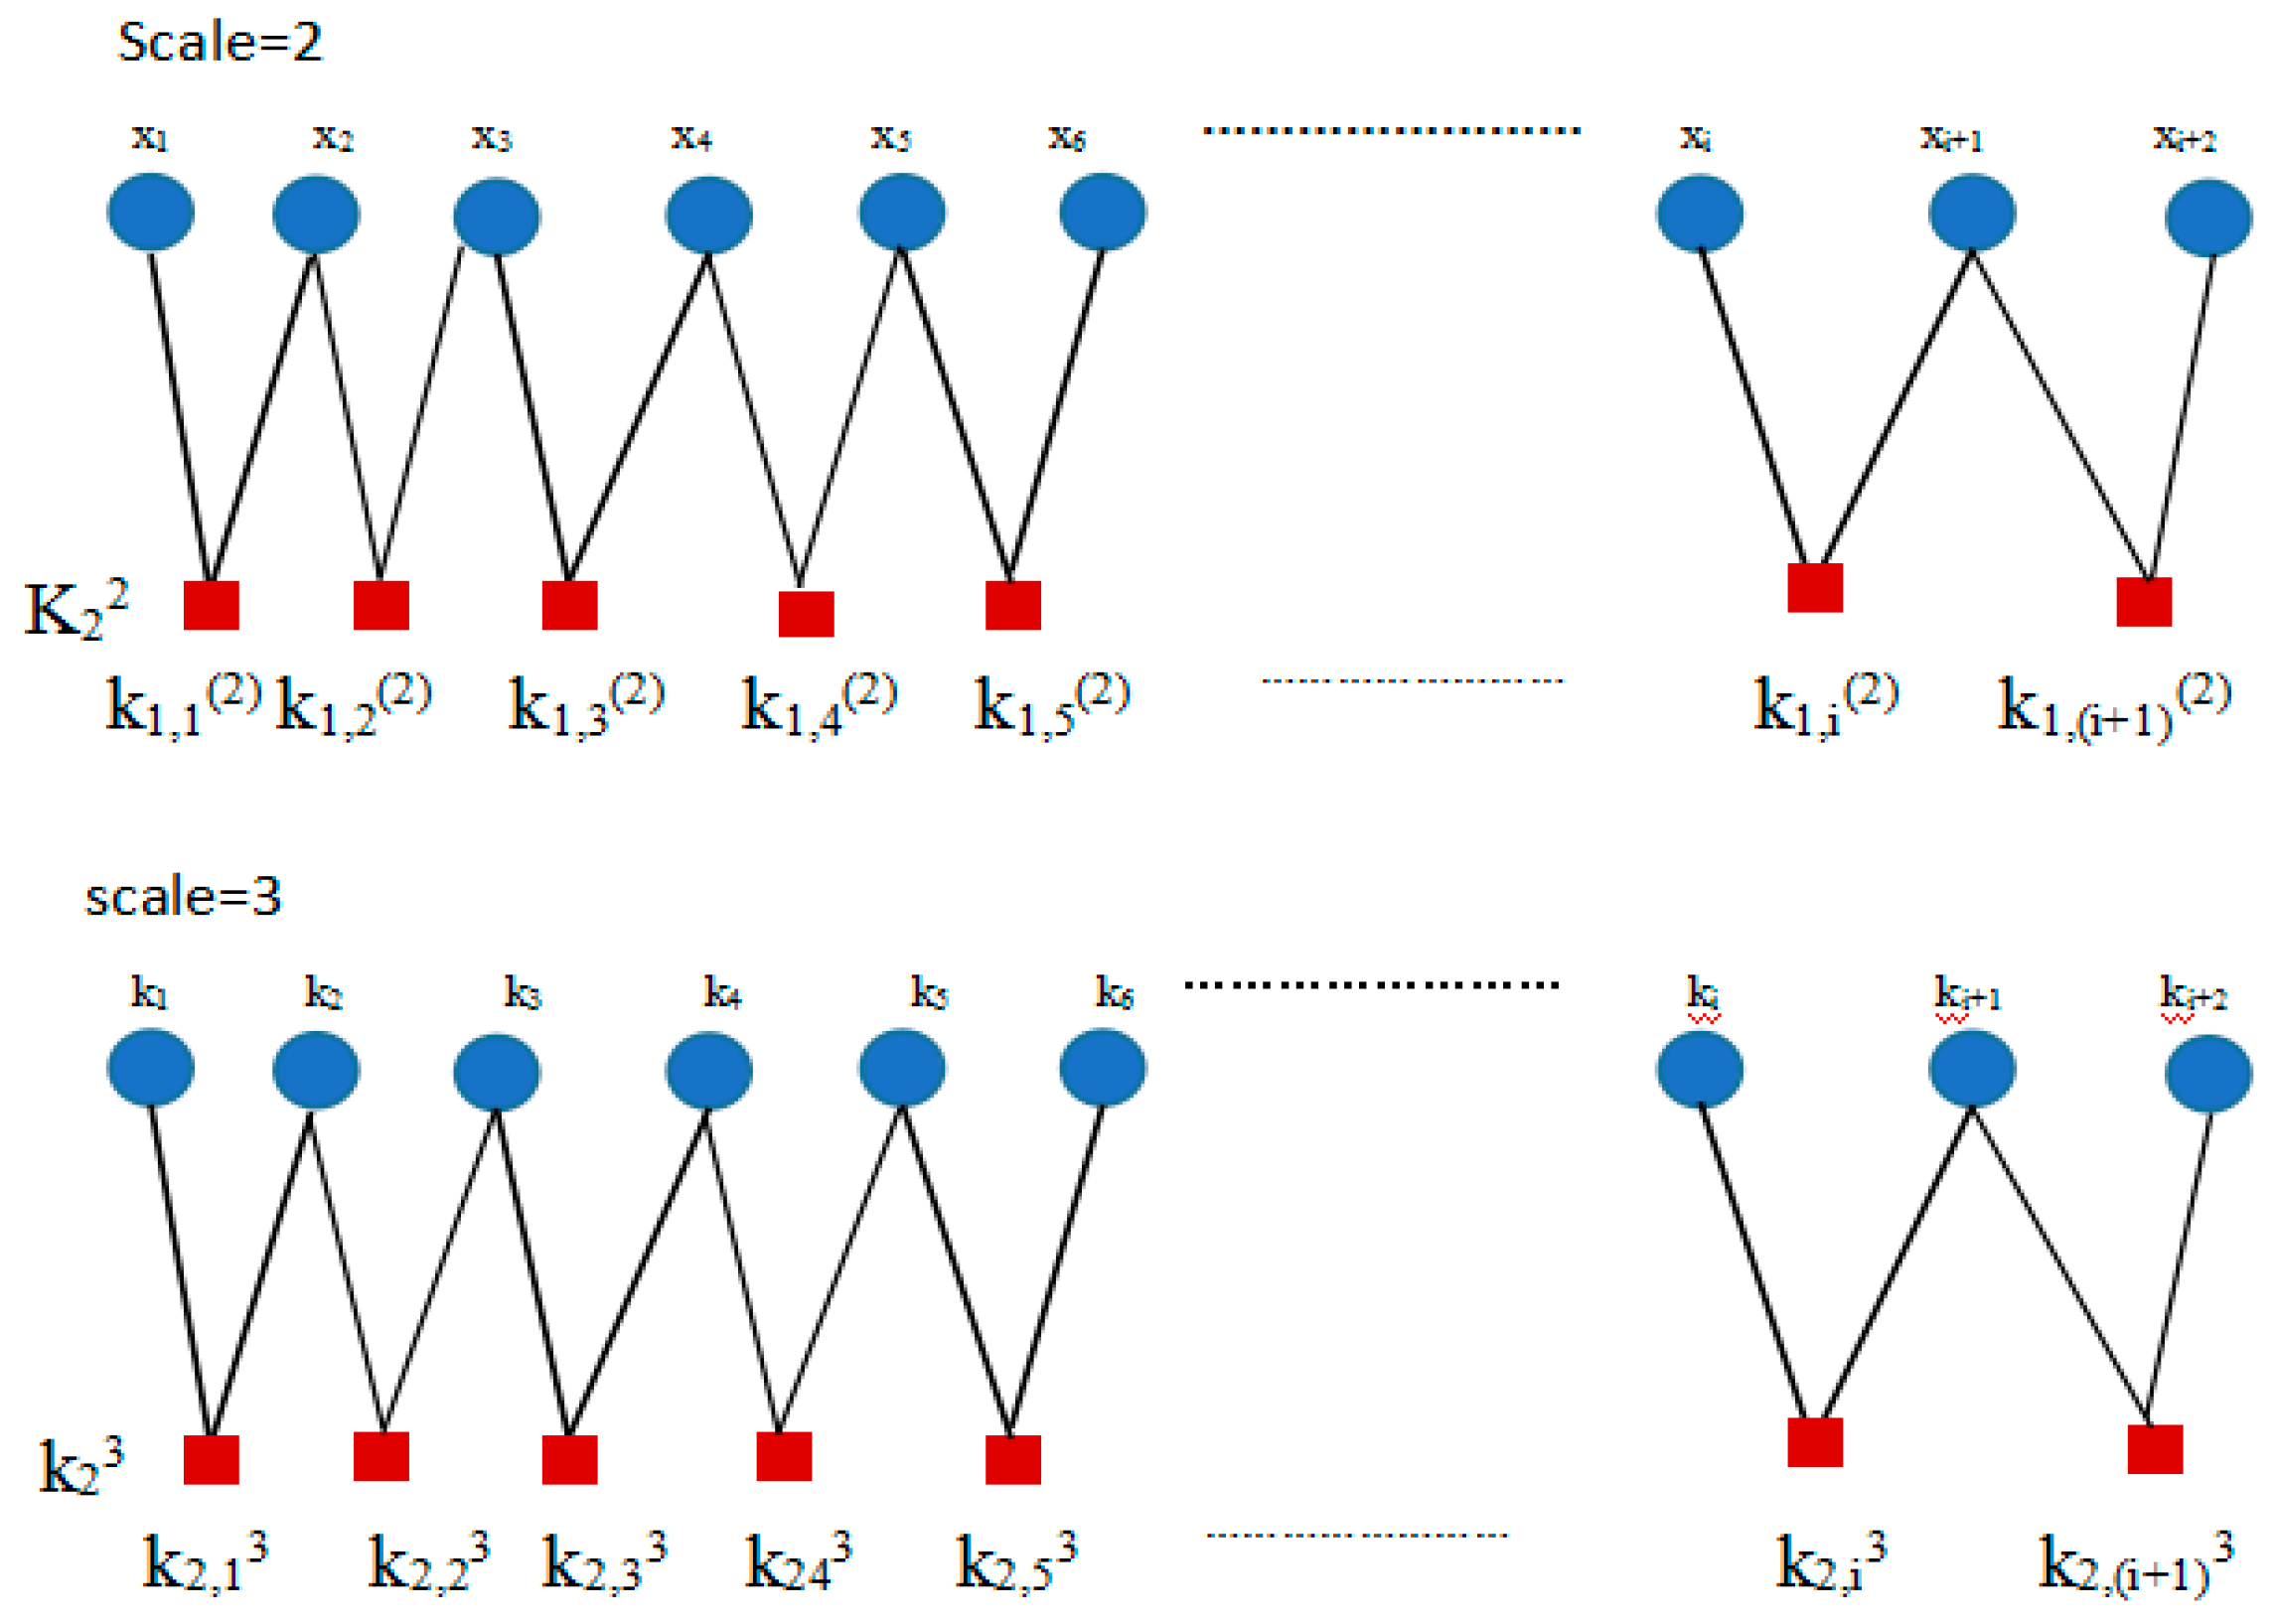
2.2. Composite Interpolation-Based Multiscale Fuzzy Entropy
3. Comparison Analysis of CIMFE, MSE, CMSE and MFE
3.1. Parameter Selection
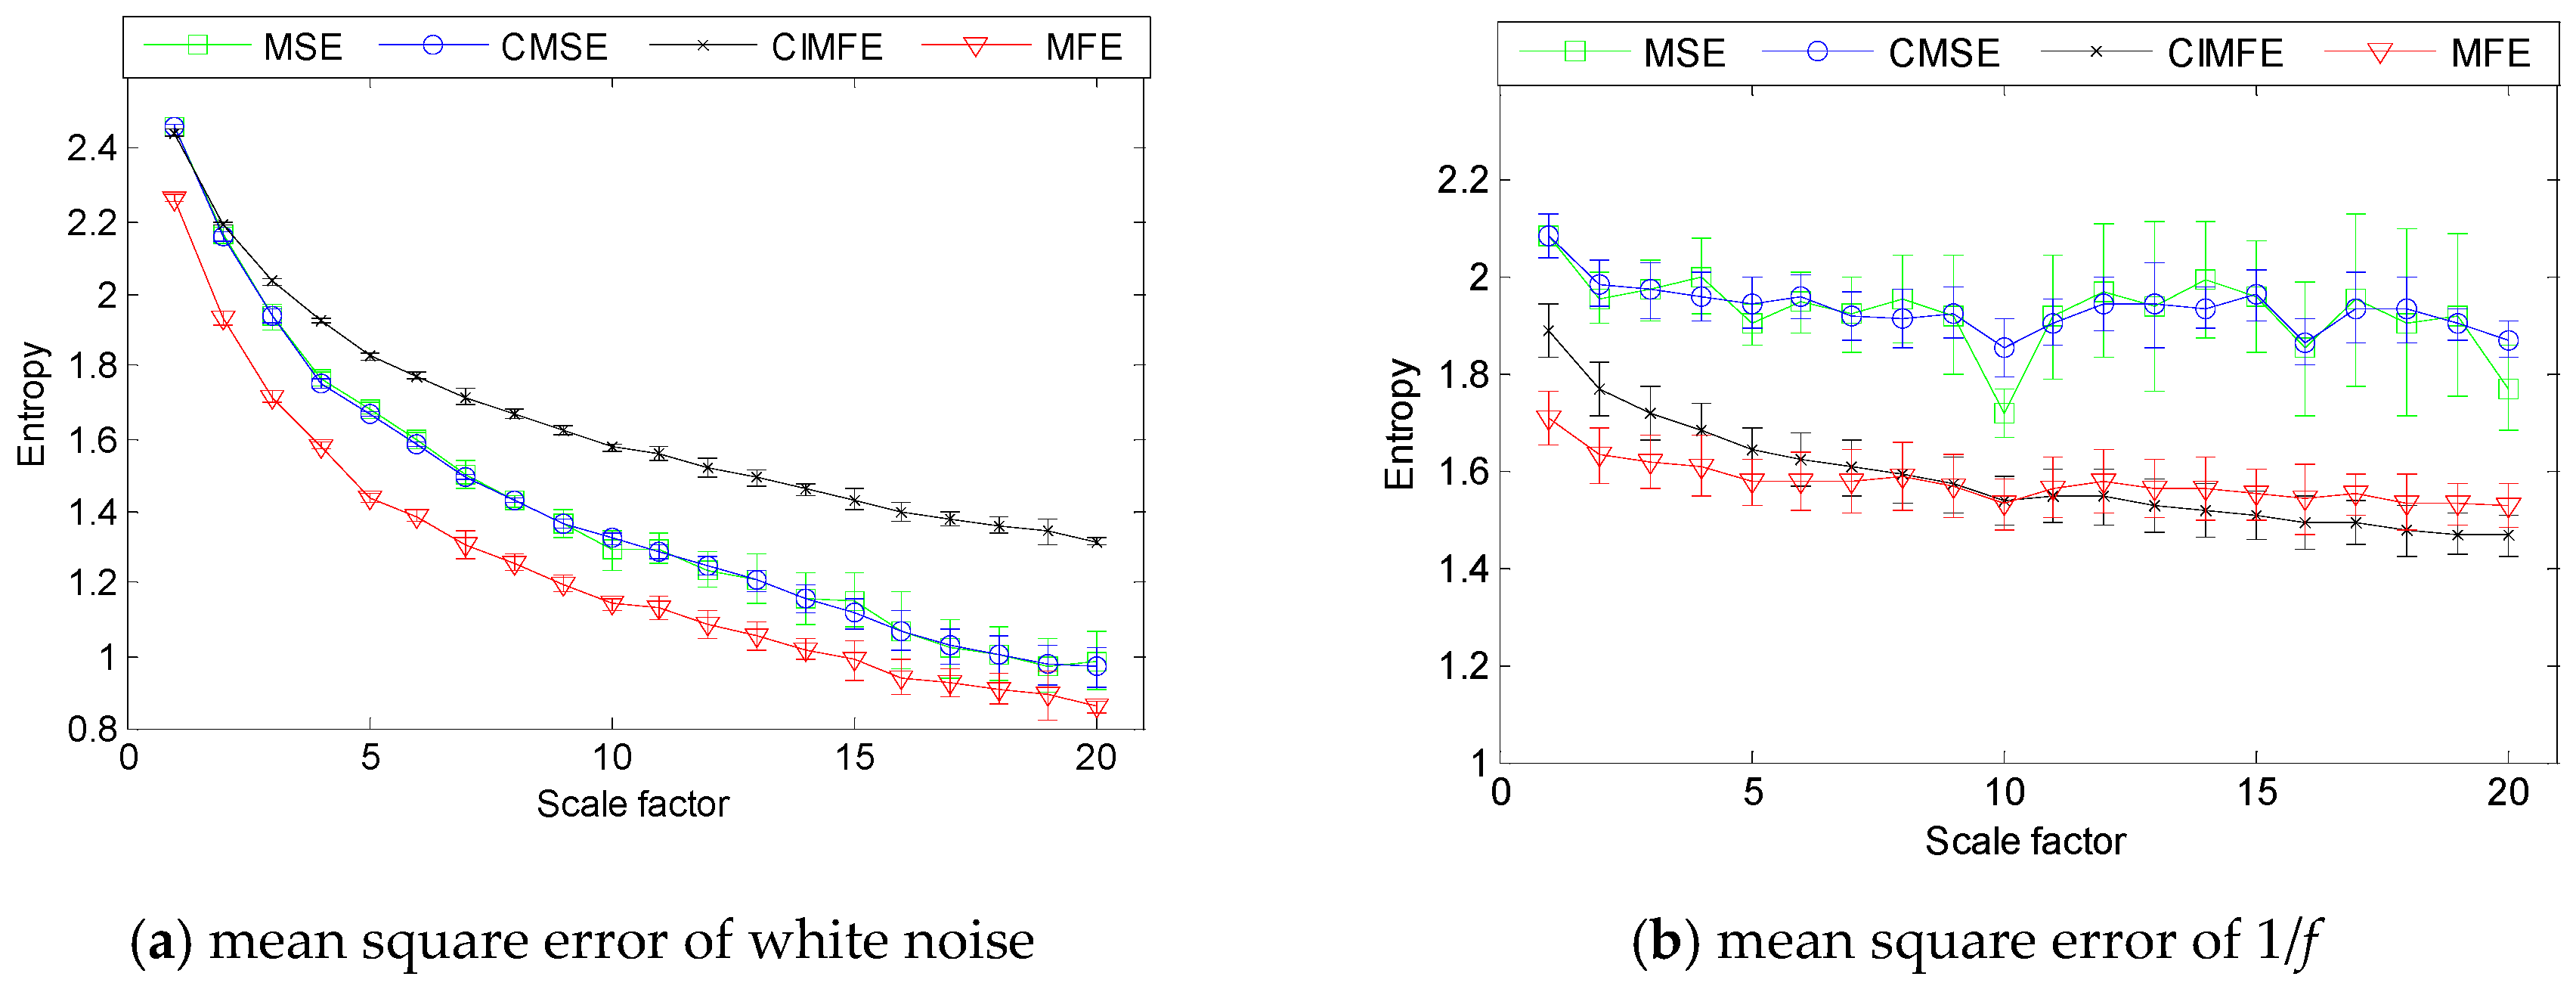
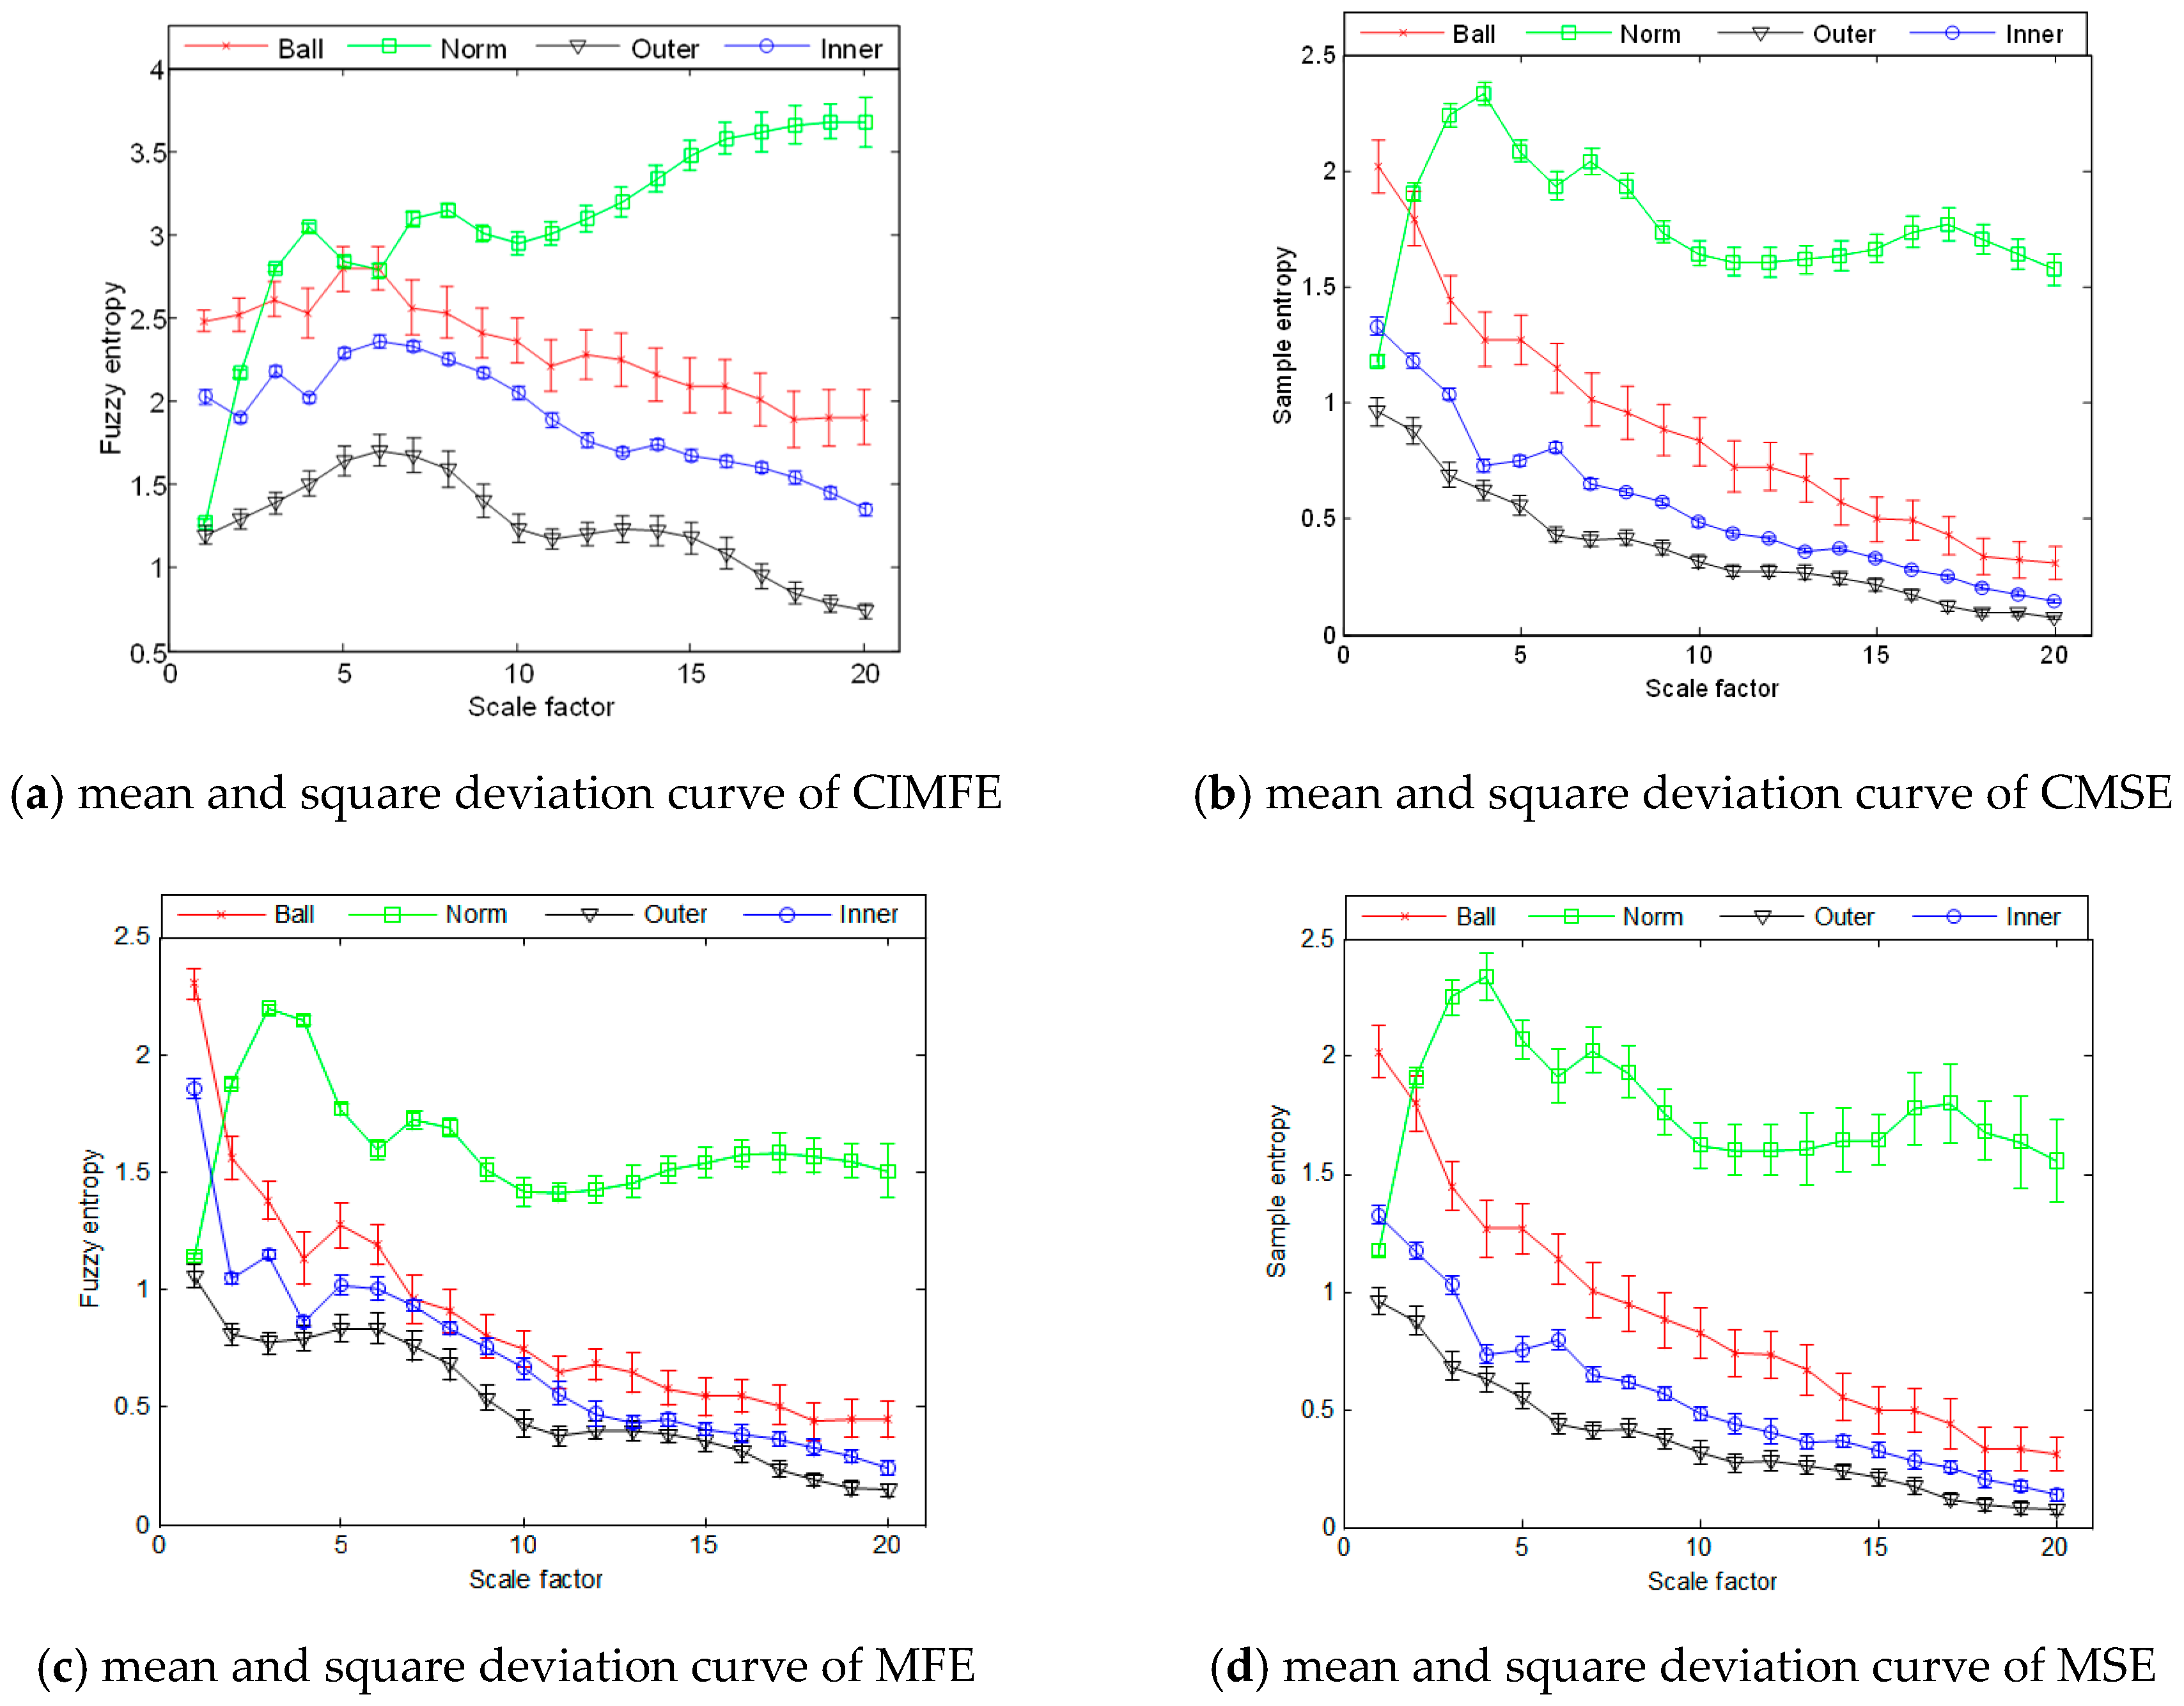
3.2. Comparison Analysis
4. CIMFE Based Fault Diagnosis Method of Rolling Bearing
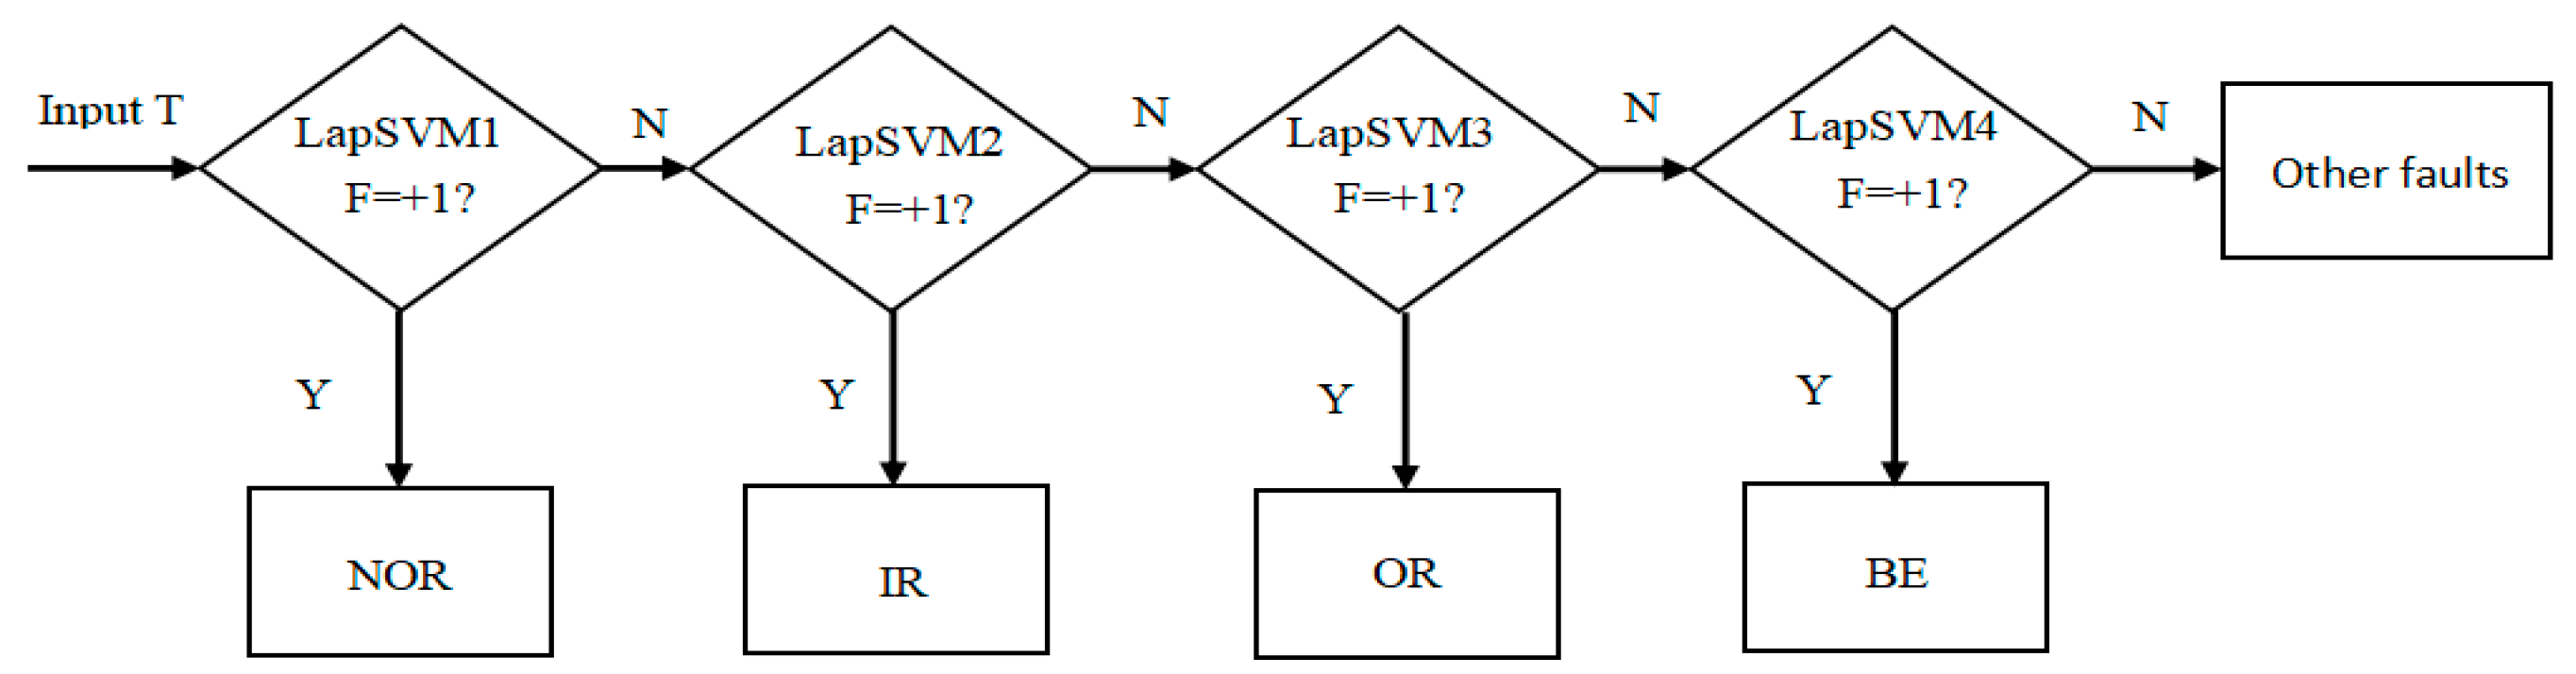
4.1. The Proposed Fault Diagnosis Method
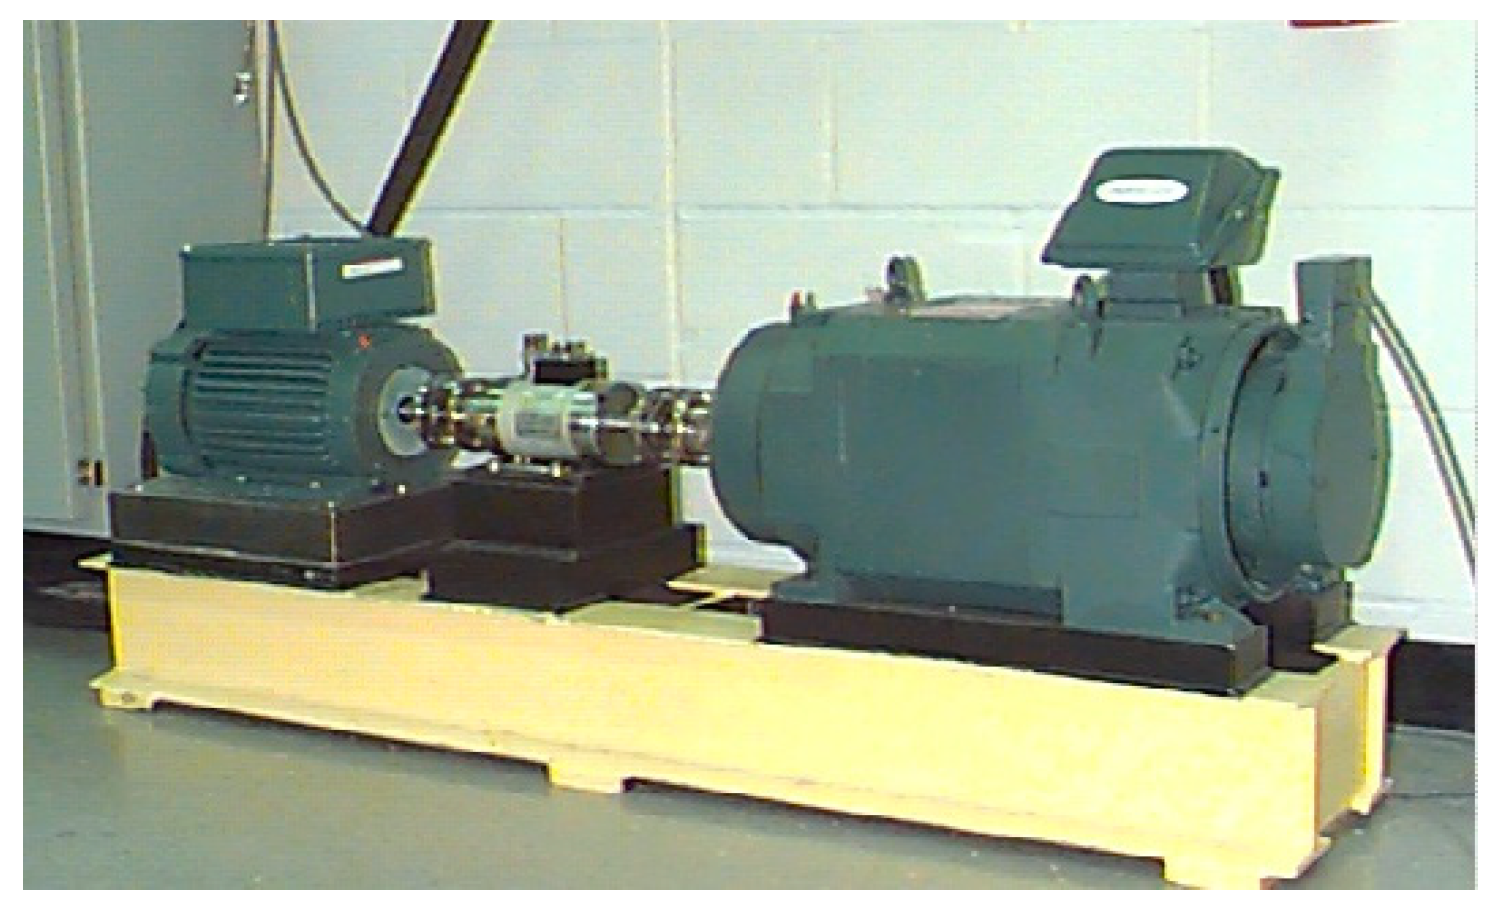
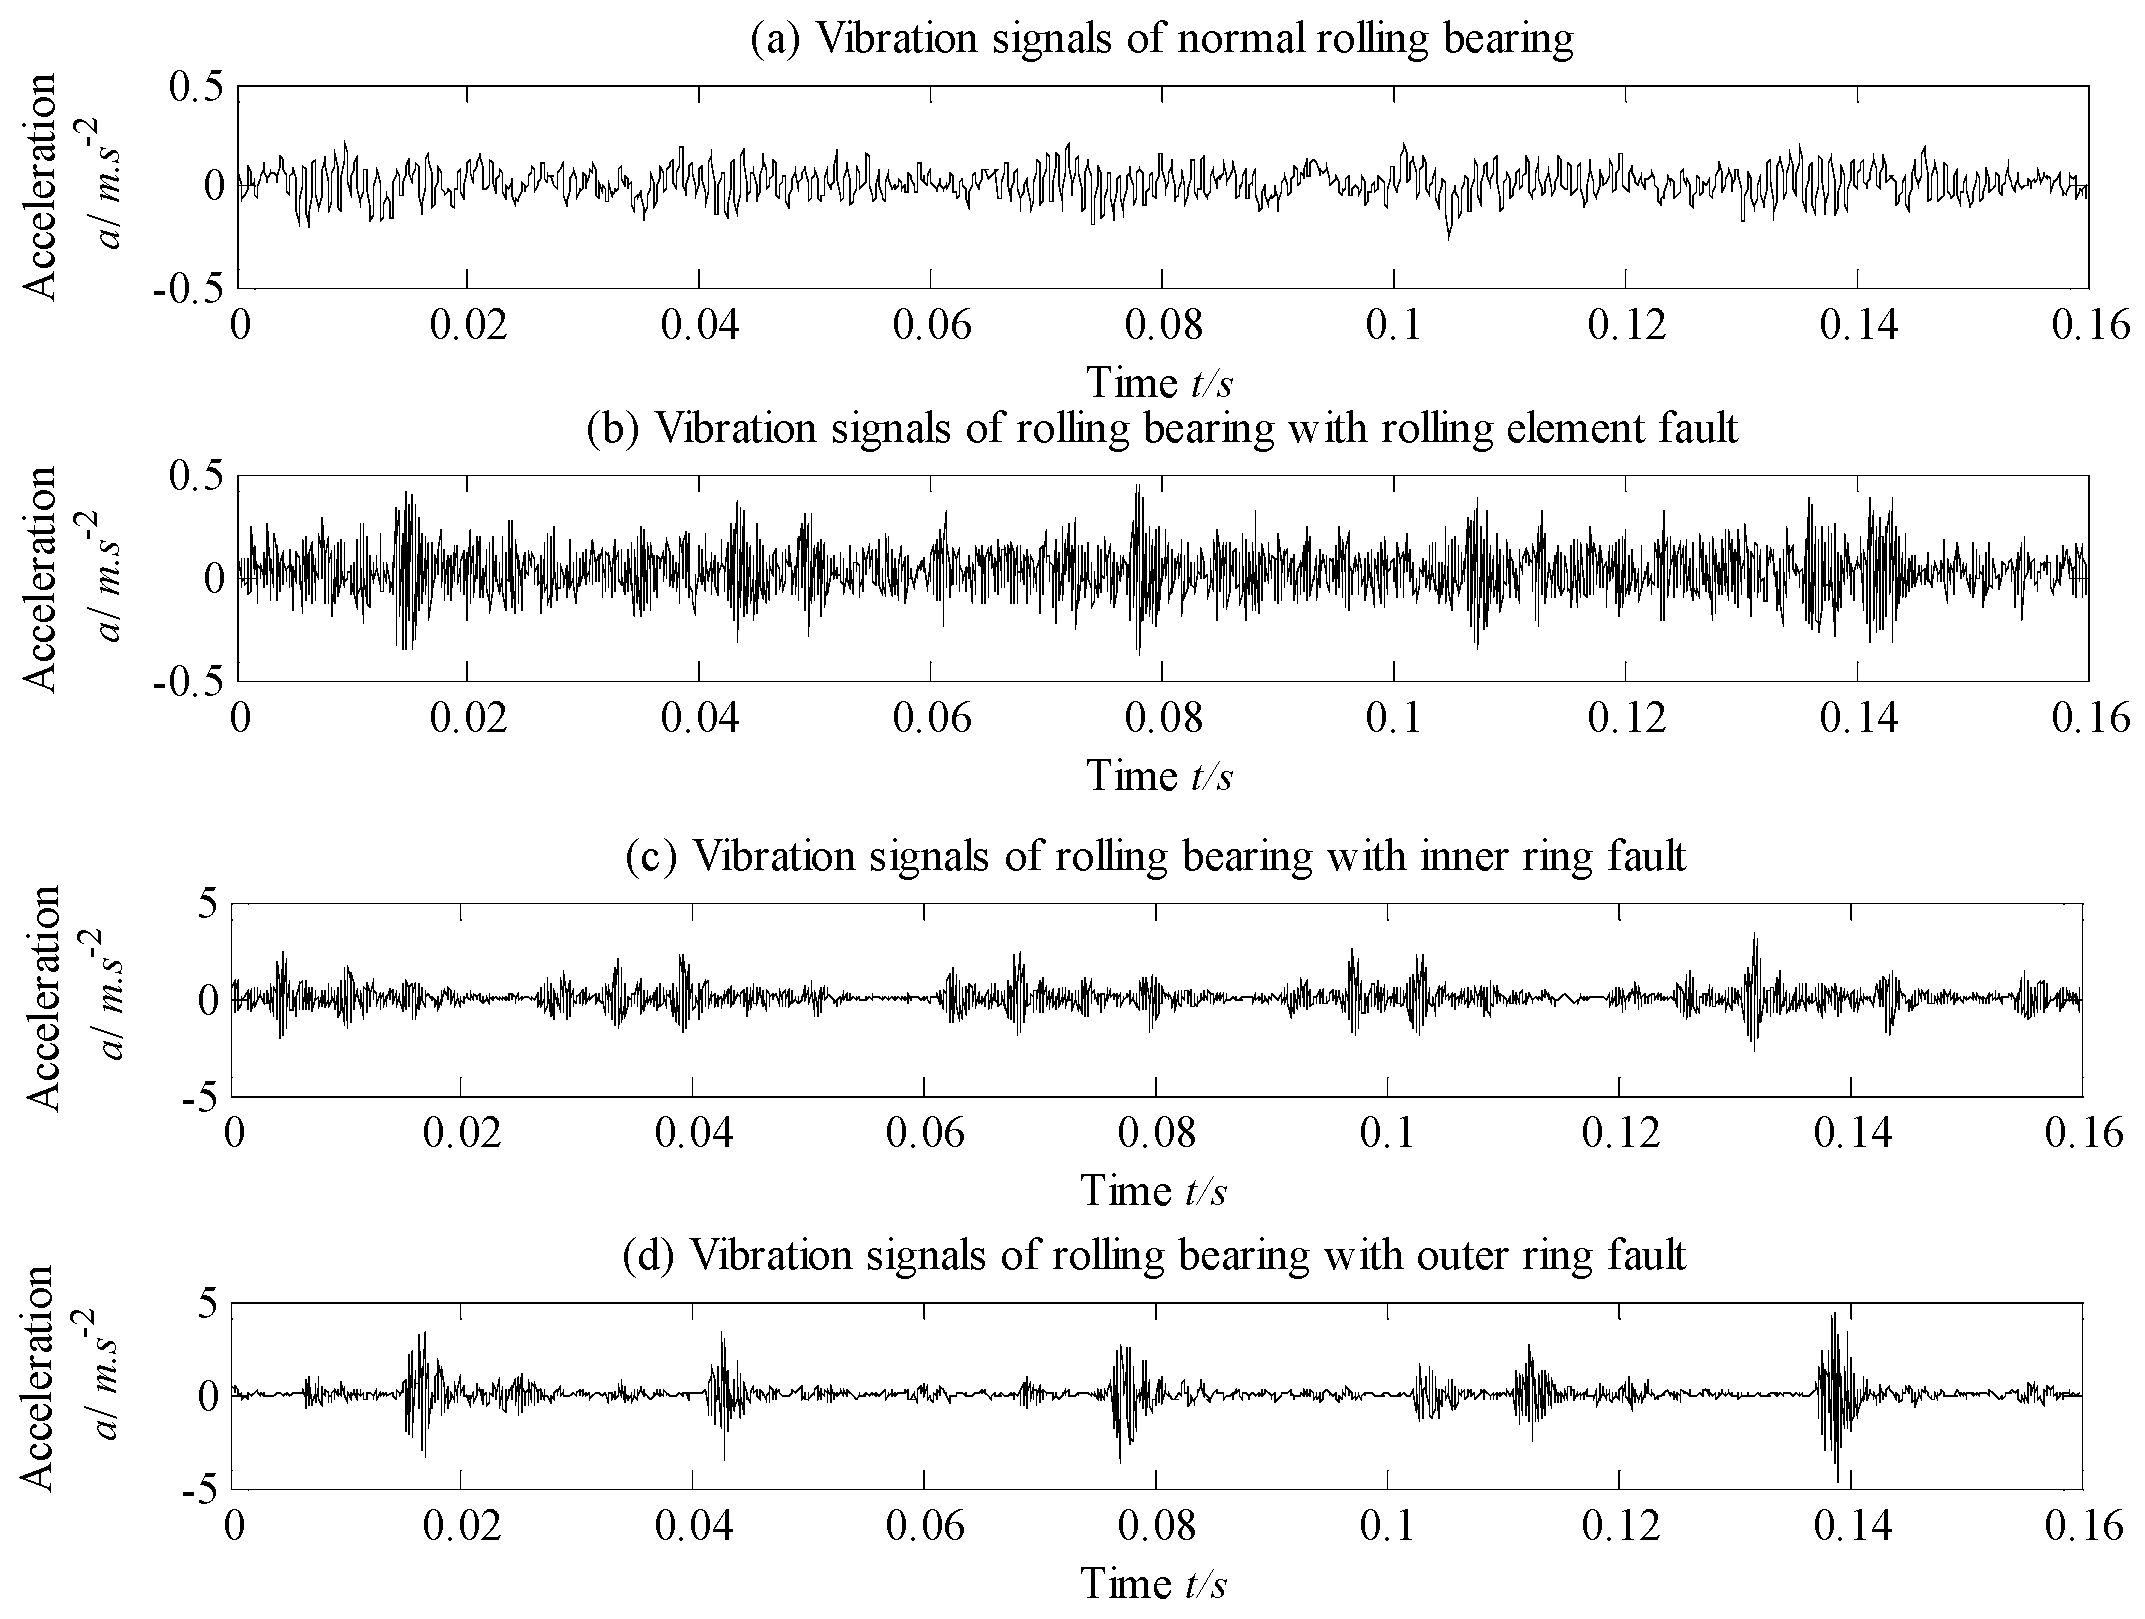
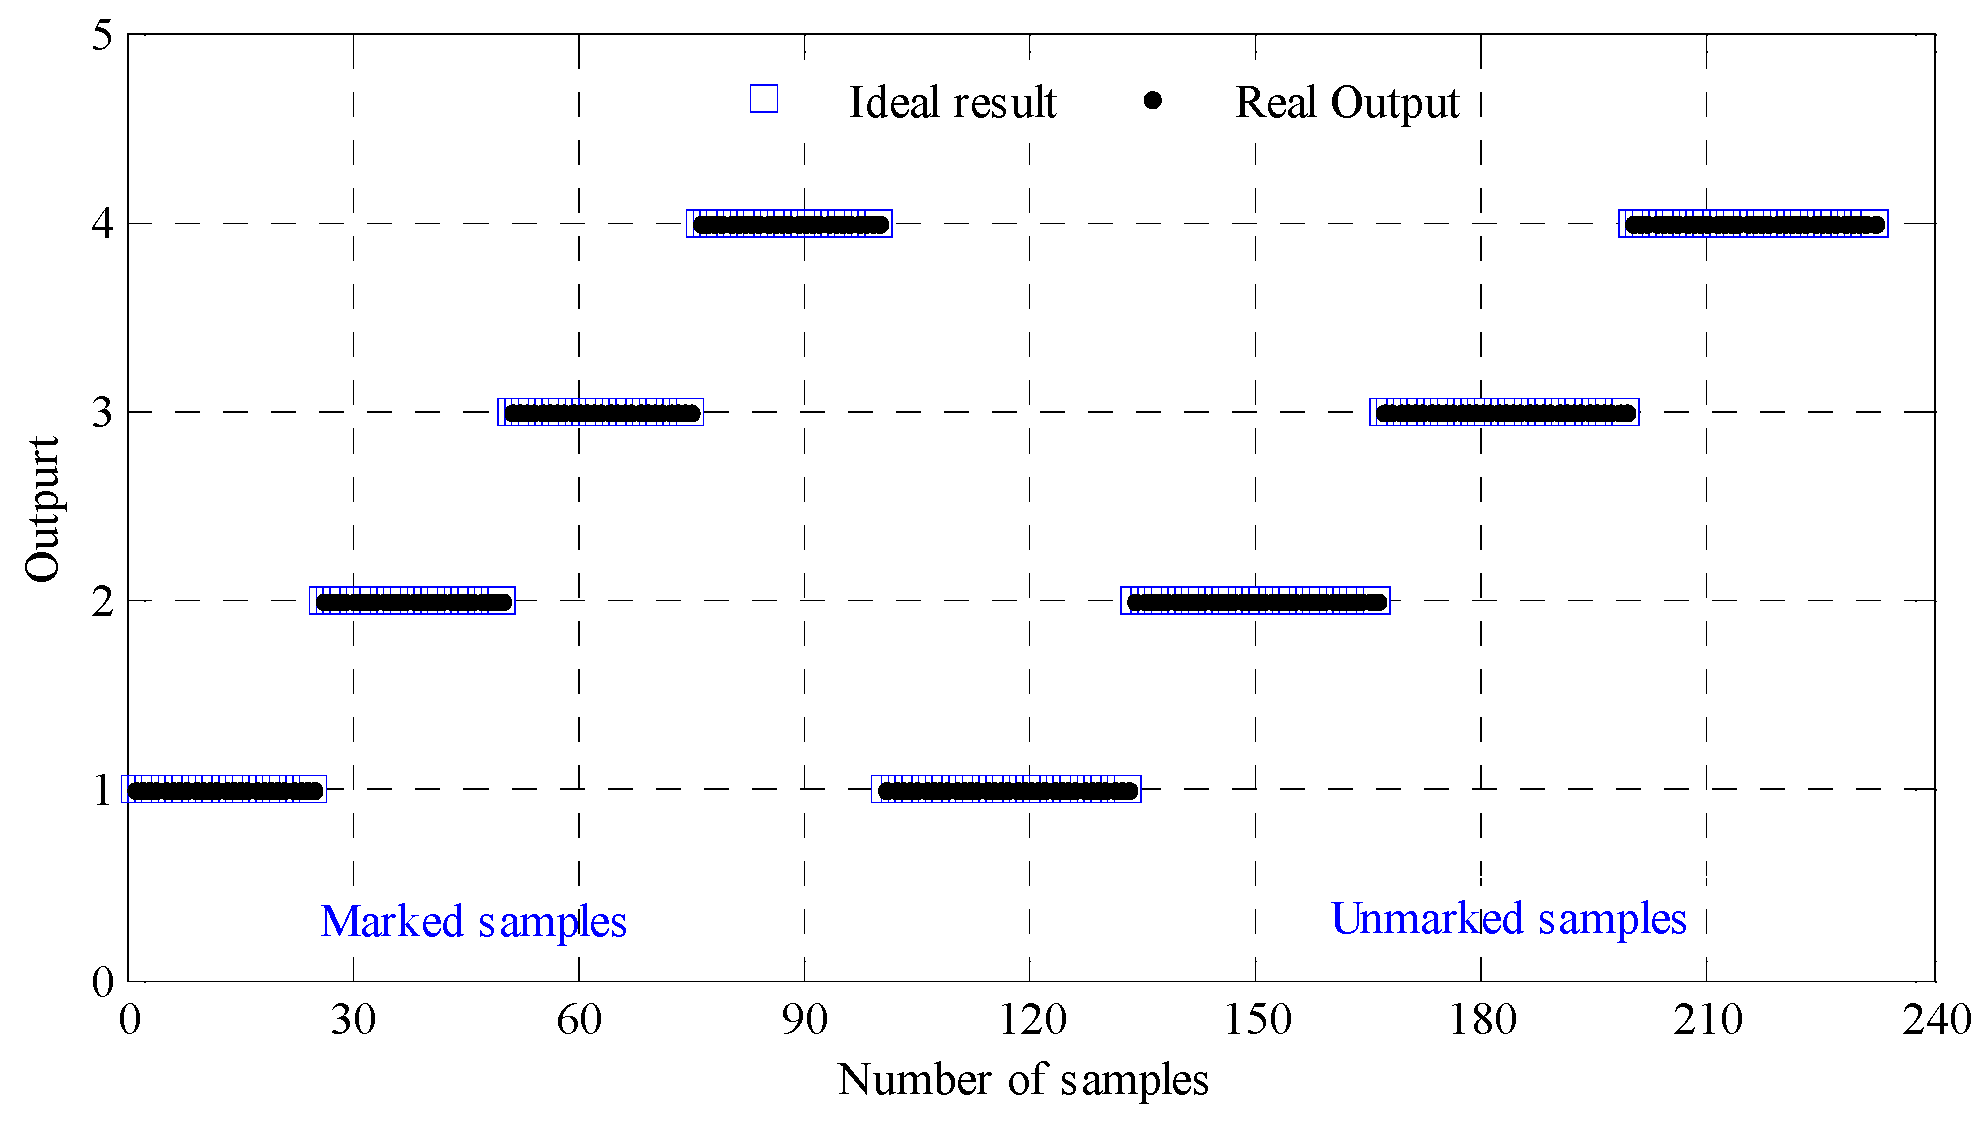
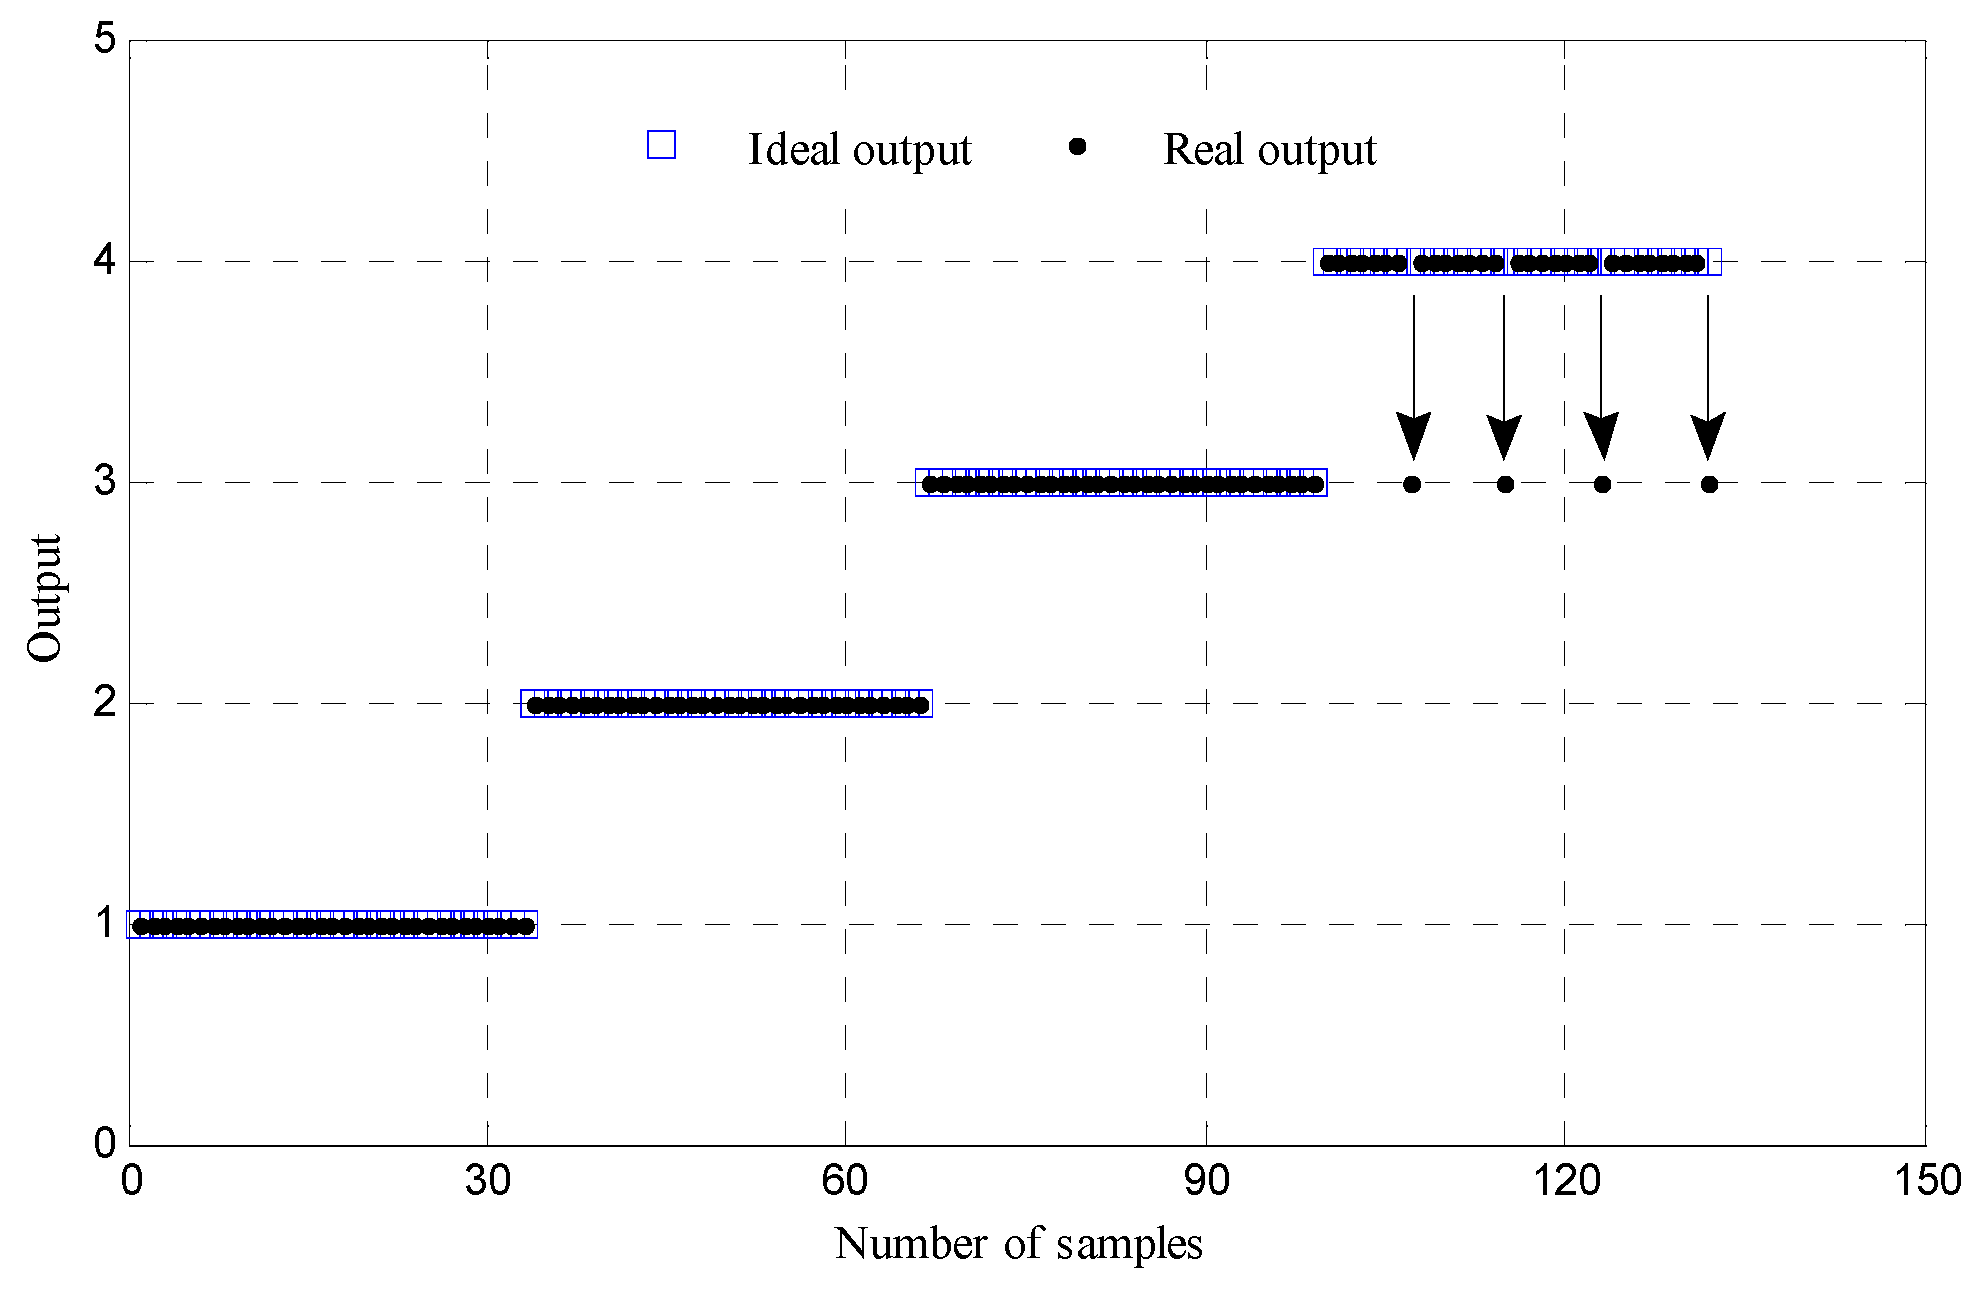
4.2. Experiment Data Analysis
5. Conclusions
Author Contributions
Funding
Conflicts of Interest
References
- Li, B.; Chow, M.Y.; Tipsuwan, Y.; Huang, J.C. Neural-network-based motor rolling bearing fault diagnosis. IEEE. Trans. Ind. Electron. 2002, 47, 1060–1069. [Google Scholar] [CrossRef]
- Aleksandar, B.; Dragoljub, G.; Jovan, G.; Ivana, S.; Olga, G.; Stefano, D.G. Early fault detection and diagnosis in bearings for more efficient operation of rotating machinery. Energy 2017, 136, 63–71. [Google Scholar]
- Lu, Z.; Xu, J.; Zhai, X. Fractal dimension and its application in fault diagnosis of rolling bearing. Chin. J. Mech. Eng. 1999, 35, 88–91. [Google Scholar]
- Yang, J.; Zhang, Y.; Zhu, Y. Intelligent fault diagnosis of rolling element bearing based on SVMs and fractal dimension. Mech. Syst. Signal Process. 2007, 21, 2012–2024. [Google Scholar] [CrossRef]
- Yan, R.; Gao, R.X. Approximate entropy as a diagnostic tool for machine health monitoring. Mech. Syst. Signal Process. 2007, 21, 824–839. [Google Scholar] [CrossRef]
- Mostafa, R.; Mohammad, R.A.; Hamed, A. Application of dispersion entropy to status characterization of rotary machines. J. Sound Vib. 2019, 438, 291–308. [Google Scholar]
- Yeragani, V.K.; Sobolewski, E.; Jampala, V.C.; Kay, J.; Yeragani, S.; Igel, G. Fractal dimension and approximate entropy of heart period and heart rate: Awake versus sleep differences and methodological issues. Clin. Sci. 1998, 95, 295–301. [Google Scholar] [CrossRef] [PubMed]
- Han, M.; Pan, J. A fault diagnosis method combined with LMD, sample entropy and energy ratio for roller bearings. Measurement 2015, 76, 7–19. [Google Scholar] [CrossRef]
- Richman, J.S.; Moorman, J.R. Physiological time-series analysis using approximate entropy and sample entropy. Am. J. Physiol.-Heart. Circ. Physiol. 2000, 278, H2039. [Google Scholar] [CrossRef]
- Costa, M.; Goldberger, A.L.; Peng, C.K. Multiscale entropy analysis of biological signals. Phys. Rev. E 2005, 71, 021906. [Google Scholar] [CrossRef]
- Costa, M.; Goldberger, A.L.; Peng, C.K. Multiscale entropy analysis of complex physiologic time series. Phys. Rev. Lett. 2002, 89, 705–708. [Google Scholar] [CrossRef]
- Zhang, L.; Xiong, G.; Liu, H.; Zou, H.; Guo, W. Bearing fault diagnosis using multi-scale entropy and adaptive neuro-fuzzy inference. Expert. Syst. Appl. 2010, 37, 6077–6085. [Google Scholar] [CrossRef]
- Zheng, J.; Cheng, J.; Yang, Y.; Luo, S. A rolling bearing fault diagnosis method based on multi-scale fuzzy entropy and variable predictive model-based class discrimination. Mech. Mach. Theory 2014, 78, 187–200. [Google Scholar] [CrossRef]
- Wu, S.D.; Wu, C.W.; Lin, S.G.; Wang, S.S.; Lee, K.Y. Time Series Analysis Using Composite Multiscale Entropy. Entropy 2013, 15, 1069–1084. [Google Scholar] [CrossRef] [Green Version]
- Zheng, J.; Pan, H.; Cheng, J. Rolling bearing fault detection and diagnosis based on composite multiscale fuzzy entropy and ensemble support vector machines. Mech. Syst. Signal Process. 2017, 85, 746–759. [Google Scholar] [CrossRef]
- Nibaldo, R.; Pablo, A.; Lida, B.; Guillermo, C. Combining Multi-Scale Wavelet Entropy and Kernelized Classification for Bearing Multi-Fault Diagnosis. Entropy 2019, 21, 152. [Google Scholar]
- Nibaldo, R.; Guillermo, C.; Carolina, L.; Enrique, C. Stationary Wavelet Singular Entropy and Kernel Extreme Learning for Bearing Multi-Fault Diagnosis. Entropy 2017, 19, 541. [Google Scholar] [Green Version]
- Yan, X.A.; Jia, M.P. Intelligent fault diagnosis of rotating machinery using improved multiscale dispersion entropy and mRMR feature selection. Knowl.-Based Syst. 2019, 163, 450–471. [Google Scholar] [CrossRef]
- Yang, Y.; Pan, H.Y.; MA, L.; Cheng, J.S. A roller bearing fault diagnosis method based on the improved ITD and RRVPMCD. Measurement 2014, 55, 255–264. [Google Scholar] [CrossRef]
- Drucker, H.; Wu, D.; Vapnik, V.N. Support vector machines for spam categorization. IEEE. Trans. Neural Netw. 2002, 10, 1048–1054. [Google Scholar] [CrossRef] [PubMed]
- Zheng, J.; Cheng, J.; Yang, Y. Multiscale Permutation Entropy Based Rolling Bearing Fault Diagnosis. Shock. Vib. 2014, 2014, 1–8. [Google Scholar] [CrossRef]
- Yuan, S.F.; Chu, F.L. Support vector machines-based fault diagnosis for turbo-pump rotor. Mech. Syst Signal Process. 2006, 20, 939–952. [Google Scholar] [CrossRef]
- Lim, G.M.; Bae, D.M.; Kim, J.H. Fault diagnosis of rotating machine by thermography method on support vector machine. J. Mech. Sci. Technol. 2014, 28, 2947–2952. [Google Scholar] [CrossRef]
- Li, Y.; Xu, M.; Zhao, H.; Huang, W. Hierarchical fuzzy entropy and improved support vector machine based binary tree approach for rolling bearing fault diagnosis. Mech. Mach. Theory 2016, 98, 114–132. [Google Scholar] [CrossRef]
- Wu, J.; Diao, Y.B.; Li, M.L.; Fang, Y.P.; Ma, D.C. A semi-supervised learning based method: Laplacian support vector machine used in diabetes disease diagnosis. Interdiscip. Sci. Comput. Sci. 2009, 1, 151–155. [Google Scholar] [CrossRef] [PubMed]
- Dai, J.X.; Zheng, J.D.; Pan, H.; Pan, Z. Rolling Bearing Fault Diagnosis Method Based on Composite Multiscale Entropy and Laplacian SVM. Chin. Mech. Eng. 2017, 28, 1339–1346. [Google Scholar]
- Xie, H.B.; Chen, W.T.; He, W.X.; Liu, H. Complexity analysis of the biomedical signal using fuzzy entropy measurement. Appl. Soft. Comput. 2011, 11, 2871–2879. [Google Scholar] [CrossRef]
- Chen, W.; Wang, Z.; Xie, H.; Yu, W. Characterization of surface EMG signal based on fuzzy entropy. IEEE Trans. Neural Syst. Rehabil. Eng. 2007, 15, 266–272. [Google Scholar] [CrossRef]
- Belkin, M.; Niyogi, P.; Sindhwani, V. Manifold Regularization: A Geometric Framework for Learning from Labeled and Unlabeled Examples. J. Mach. Learn. Res. 2006, 7, 2399–2434. [Google Scholar]
- Yang, Y.; Pan, H.; Ma, L.; Cheng, J. A fault diagnosis approach for roller bearing based on improved intrinsic timescale decomposition de-noising and kriging—Variable predictive model-based class discriminate. J. Vib. Control. 2014, 22, 1431–1446. [Google Scholar] [CrossRef]
- Yuan, S.F.; Chu, F.L. Fault diagnostics based on particle swarm optimisation and support vector machines. Mech. Syst. Signal Process. 2007, 21, 1787–1798. [Google Scholar] [CrossRef]


| Samples | State | LapSVM1 | LapSVM2 | LapSVM3 | LapSVM4 | Result |
|---|---|---|---|---|---|---|
| T1~T58 | Norm | +1(58) | Norm | |||
| T59~T116 | IR | −1(58) | +1(58) | IR | ||
| T117~T174 | OR | −1(58) | −1(58) | +1(58) | OR | |
| T175~T232 | BE | −1(58) | −1(58) | −1(58) | +1(58) | BE |
| Samples | State | SVM1 | SVM2 | SVM3 | SVM4 | Result |
|---|---|---|---|---|---|---|
| T1~T33 | Norm | +1(33) | Norm | |||
| T34~T66 | IR | −1(33) | +1(33) | IR | ||
| T67~T99 | OR | −1(33) | −1(33) | +1(37) | OR | |
| T100~T132 | BE | −1(33) | −1(33) | −1(29) | +1(29) | BE |
| Number of Marked Samples/Method | 5 | 10 | 15 | 20 | 25 |
|---|---|---|---|---|---|
| MSE | 97.41 | 97.84 | 97.41 | 97.84 | 98.28 |
| CMSE | 98.71 | 98.71 | 98.71 | 98.71 | 98.71 |
| MFE | 98.71 | 99.14 | 98.71 | 98.71 | 98.71 |
| CIMFE | 98.71 | 98.71 | 98.71 | 98.71 | 100 |
| Method/Number of Training Samples | 5 | 10 | 15 | 20 | 25 |
|---|---|---|---|---|---|
| MSE | 96.70 | 96.35 | 95.93 | 95.39 | 96.21 |
| CMSE | 96.70 | 96.75 | 95.93 | 95.39 | 96.21 |
| MFE | 97.17 | 96.88 | 96.51 | 96.05 | 96.97 |
| CIMFE | 98.11 | 97.91 | 96.67 | 97.37 | 98.48 |
© 2019 by the authors. Licensee MDPI, Basel, Switzerland. This article is an open access article distributed under the terms and conditions of the Creative Commons Attribution (CC BY) license (http://creativecommons.org/licenses/by/4.0/).
Share and Cite
Liu, Q.; Pan, H.; Zheng, J.; Tong, J.; Bao, J. Composite Interpolation-Based Multiscale Fuzzy Entropy and Its Application to Fault Diagnosis of Rolling Bearing. Entropy 2019, 21, 292. https://doi.org/10.3390/e21030292
Liu Q, Pan H, Zheng J, Tong J, Bao J. Composite Interpolation-Based Multiscale Fuzzy Entropy and Its Application to Fault Diagnosis of Rolling Bearing. Entropy. 2019; 21(3):292. https://doi.org/10.3390/e21030292
Chicago/Turabian StyleLiu, Qingyun, Haiyang Pan, Jinde Zheng, Jinyu Tong, and Jiahan Bao. 2019. "Composite Interpolation-Based Multiscale Fuzzy Entropy and Its Application to Fault Diagnosis of Rolling Bearing" Entropy 21, no. 3: 292. https://doi.org/10.3390/e21030292
APA StyleLiu, Q., Pan, H., Zheng, J., Tong, J., & Bao, J. (2019). Composite Interpolation-Based Multiscale Fuzzy Entropy and Its Application to Fault Diagnosis of Rolling Bearing. Entropy, 21(3), 292. https://doi.org/10.3390/e21030292