Abstract
Land Use/Cover Change (LUCC) has gradually became an important direction in the research of global changes. LUCC is a complex system, and entropy is a measure of the degree of disorder of a system. According to land use information entropy, this paper analyzes changes in land use from the perspective of the system. Research on the entropy of LUCC structures has a certain “guiding role” for the optimization and adjustment of regional land use structure. Based on the five periods of LUCC data from the year of 1990 to 2010, this paper focuses on analyzing three types of LUCC entropies among counties in China—namely, Shannon, Renyi, and Tsallis entropies. The findings suggest that: (1) Shannon entropy can reflect the volatility of the LUCC, that Renyi and Tsallis entropies also have this function when their parameter has a positive value, and that Renyi and Tsallis entropies can reflect the extreme case of the LUCC when their parameter has a negative value.; (2) The entropy of China’s LUCC is uneven in time and space distributions, and that there is a large trend during 1990–2010, the central region generally has high entropy in space.
1. Introduction
Land Use/Cover Change (LUCC) has gradually became an important direction in global change research. More and more attention has been given to LUCC by related scholars in recent years [1,2,3,4,5]. LUCC is a complex system that is composed of nature, society and economy, the structure and function of the system show different patterns and combinations in space, and evolution processes in time [6,7]. Land use systems are dissipative structure systems, and the degree of order can be described by entropic procedures as data transmission and information theory [8,9,10].
Many different entropic measures have been developed in the context of LUCC. For example, entropic measures were used to analyze the joint information uncertainty in simulations of past and future scenarios of rural activity expansion and urban sprawl [11,12]. The maximum entropic approach was used to assess the biodiversity loss [13] and assess land suitability [14]. Entropy combination weighted method was used to assess the risk of flood [15], land use ecological security patterns [16], and spatial vulnerability from urbanization [17,18,19].
In addition, land use structure can be analyzed at different scales using entropy [20,21,22,23]. For example, Pavanaguru and Latha proposed Shannon’s entropy as an indicator to assess the degree of landscape fragmentation [24]. Tewolde and Cabral took Shannon’s Entropy as an urban sprawl index to measure the urban sprawl [25]. Shen et al. introduced a hybrid Entropy-McKinsey Matrix method for evaluating sustainable urbanization [26]. Fan and Ding introduced the “Entropy Model” to analyze the whole land use change at a county scale [27]. Shanon’s entropy was incorporated into cluster analysis through entropy layers for each period of analysis which [28]. Comprehensive measurement has been deployed for China’s urbanization between 1981 and 2006, based on the entropy method and the results showed that the integrated evolution of urbanization has a profound effect on the resources, energy, and the environment [29]. However, there is limited research on the entropy of LUCC. Rare instances adopt a Shannon entropy-related measurement [30] to quantify the robustness of the evolving LUCC, and propose a statistical visualization model to quantify the Chinese LUCC space-time structure at different scales. The volatility and extreme case of the LUCC are needed to quantify the evolving of Chinese LUCC organization.
In this paper, we propose a new idea in order to research land use changes. We focus on analyzing the properties of the three types of entropies of the LUCC—namely, Shannon, Renyi, and Tsallis entropies [31,32,33,34]—mainly to compare the differences between the three kinds of entropy with respect to the research results. The LUCC entropies analyzed in this paper include Renyi and Tsallis entropies, in addition to Shannon entropy. In this paper, we found that it is suitable to employ entropies to investigate the volatility and extreme cases of the Chinese LUCC from 1990 to 2010. The remainder of this paper is organized as follows. After the introduction, Section 2 describes the methodology and data. Section 3 presents the main results. Section 4 is Discussion, and Section 5 provides conclusions.
2. Methods and Materials
2.1. LUCC Entropy
As a concept in physics, entropy is used to measure system complexity and balance. In general, the higher the information entropy, the lower the order of system. Information entropy of land use structures is a comprehensive reflection of dynamic changes and transformation degrees of various land use types of the study area in a certain period, and, to some degree, it can guide the optimization and adjustment of regional land use structures.
Setting the total area of a region with a fixed boundary as A, land use types in the area are divided into n classes, A(xi) is the area of various land use types, and the formula of the occurrence probability of a land use type is as follows:
p(xi) = A(xi)/A, i = 1,2, …., n,
Obviously, ∑p(xi) = 1, satisfies the normalization condition; the entropy of land use structures of this region can be defined as:
It is concluded that: The more land use types and the more harmonious various kinds of land areas there are, the greater the entropy; Conversely, less land use types, and having a type of land, is the main factor, which lowers the entropy.
We introduce Tsallis entropy and Renyi entropy so as to make the information measuring method more generic and flexible. Tsallis entropy and Renyi entropy are the generalized forms with an adjustment parameter [30]; it is a new information measuring method of statistical physics, which can provide satisfactory physical interpretations for a mixed system. The definition is as follows:
In the above-mentioned formula, HT(x) represents Tsallis entropy, HR(x) represents Renyi entropy, and q represents the adjustment parameter.
2.2. Data and Processing
2.2.1. Data Sources
- Land use data: The classifications of the land use system include cropland, woodland, grassland, water body, built-up land, and undeveloped land (Table 1). The spatial resolution for the land use data was 1 km × 1 km. Five temporal Land use data were acquired in 1990, 1995, 2000, 2005, and 2010 [35].
 Table 1. The land use classification system.
 - Administrative division data: The administrative division data contains 2363 districts and counties in China at a scale of 1:4,000,000 [35].
2.2.2. Data Processing
The processing platform of land use data and administrative division data is ArcGIS software in this study. The first step is the projection transformation, where we have unified the land use data and the administrative data projection; the second step is the conversion of the format, which converts the land use grid data into a vector, and then overlaying the vector of land use and the administrative layer in order to obtain the county land use map. Finally, we calculate the various types of land area and the entropy model according to the land use distribution map of the districts and land use information entropy.
3. Results and Analysis
3.1. Chinese LUCC in Different Periods
It can be seen in Figure 1 that the spatial variation of LUCC in China is significant. Overall distribution characteristics are: There are various land types in China, the land types in the densely-populated southeastern part of China are more than those in the sparsely-populated northwestern region. The land types in southeastern China are higher than those in the middle and western parts of China. Specific partition view: The area of Huang-Huai-Hai and the southeastern coastal areas, and the Sichuan Basin, showed significant expansion. The North China mountainous region, the Loess Plateau, the Qinling Mountains, and the Inner Mongolia Farming-Pastoral Zone have mainly been reforested to forest and grasslands and grassland afforestation. The eastern part of Inner Mongolia, Northwestern China, and the arid oasis in the western part of the edge of the agricultural area have been reclaimed as arable land; the Qinghai-Tibet Plateau land use change is very small, and the main performance of the local area is due to the expansion of water areas. This phenomenon is highly correlated with the findings of relevant scholars [36,37,38].
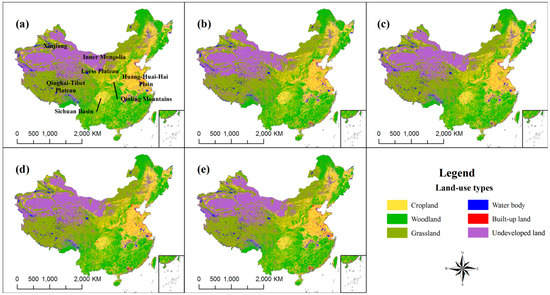
Figure 1.
The sequence of Chinese LUCC (Land Use/Cover Change) maps in 1990 (a); 1995 (b); 2000 (c); 2005 (d); 2010 (e).
Through Figure 1 and Table 2, we can see that most construction lands are converted from cultivated land. The eastern coastal area has prominent changes relative to China’s rapid economic development. These changes caused the eastern urban construction land area to increase rapidly from 1990 to 2010. The area of water bodies decreased, but this is not obvious. The area of woodlands increased, and a small part of croplands and grasslands were converted to woodlands. These have increased by nearly 4% from 1990 to 2010, which may be related to the policy of reverting croplands to forests. Grassland area changed little, and some of it has been converted to croplands. At the same time, a small amount of woodland and undeveloped land was converted into grasslands. The overall area of unused land has not changed a great deal, which was mainly restricted by geographical conditions and land development difficulties.
Table 2.
The change matrix of Chinese LUCC from 1990 to 2010.
3.2 Three Kinds of LUCC Entropy
3.2.1. Shannon Entropy
To further analyze the variation tendencies of entropy, according to the land-use information entropy calculated, ranking the entropy of countries at a provincial scale, in the environment of Sigma Plot 10.0, the entropy statistical data were sorted by running average, and then we can get the provincial chart of the change of in Shannon entropy in 1990, 1995, 2000, and 2010, as shown in Figure 2.
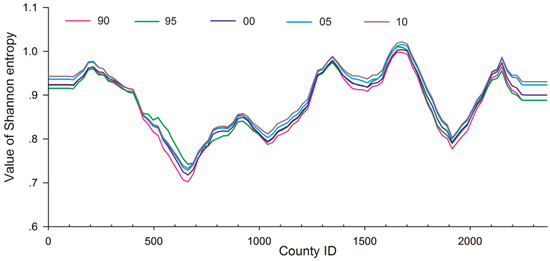
Figure 2.
Evolution of Chinese LUCC Shannon entropy from 1990 to 2010. Sort the data based on the province ID, the counties included in the provinces are: Anhui:1–80, Macao: 81, Beijing: 82–90, Fujian: 91–160, Gansu: 161–240, Guangdong: 241–334, Guangxi: 335–423, Guizhou: 424–505, Hainan: 506–523, Hebei: 524–672, Henan: 673–798, Heilongjiang: 799–876, Hubei: 877–956, Hunan: 957–1058, Jilin: 1059–1104, Jiangsu: 1105–1178, Jiangxi: 1179–1267, Liaoning: 1268–1325, Inner Mongolia: 1326–1412, Ningxia: 1413–1432, Qinghai: 1433–1473, Shandong: 1474–1583, Shanxi: 1584–1689, Shanxi: 1690–1786, Shanghai: 1787–1795, Sichuan: 1796–1954, Taiwan: 1955, Tianjin: 1956–1961, Tibet: 1962–2038, Hong Kong: 2039, Xinjiang: 2040–2124, Yunnan: 2125–2249, Zhejiang: 2250–2325, and Chongqing: 2326–2363.
From Figure 2, we can see that the Shannon entropy changes slightly in all periods, and it shows that the regional land development is stabilized as a whole over this period. The county land entropy increased overall over time, land-use types are diversified in countries. It can be concluded that there are obvious differences in land entropy from the entropy fluctuations of counties. However, the entropy curve is relatively smooth, which indicates the spacial consistency of regional land entropy from countries to provinces—the country land entropy has no obvious differences within the scope of a province. From the analysis of extreme value distributions of the running average, the lowest province is Hebei, and Shaanxi Province is the highest.
The smallest entropy appeared in Henan Province, which indicates the relative balance of various types of land development in Henan Province during the period. This may be related to the development policy of agriculture in Henan Province; Henan is a major agricultural province. Grain production and agricultural production has been supported by the national policy. The highest entropy is in Shanghai, which shows that the structure of land use in Shanghai City changed greatly during this period, which is related to the rapid development of China’s economy in the last 20 years. Shanghai is the most developed economic area in China, and national economic development has a greater impact on the land changes. The smallest changes in entropy occurred in Anhui Province and Chongqing City; they show that the land structure is relatively balanced.
3.2.2. Tsallis Entropy
As can be seen in Figure 3, although the Tsallis entropy can react to changes in land entropy, the overall trend is not as conspicuous as that of Shannon entropy. However, Tsallis entropy is more sensitive when the parameter is 0.5 (Figure 3b) and the distinction degree of extreme changes in Tsallis entropy in each period is larger than that of Shannon entropy.
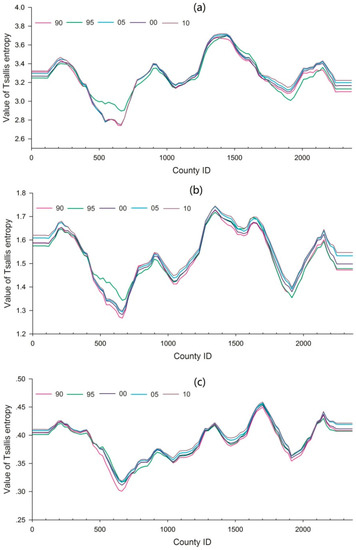
Figure 3.
Evolution of Chinese LUCC Tsallis entropy from 1990 to 2010. (a) is the corresponding results when q = 0.1; (b) q = 0.5; (c) q = 2.5 [30]. The type of Country ID is the same as in Figure 2.
3.2.3. Reny Entropy
From Figure 4, we can see that Reny entropy can also react to changes in land entropy; the overall trend is inferior to those of Shannon and Tsallis entropies. When the parameter is 0.5, Reny entropy also shows sensitive characteristics, but the overall discrimination is inferior to those of Tsallis and Shannon entropies.
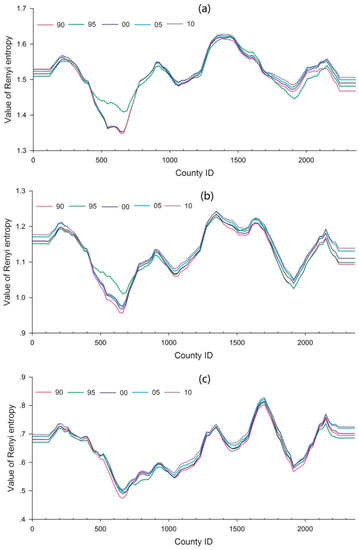
Figure 4.
Evolution of Chinese LUCC Renyi entropy from 1990 to 2010. (a) is the corresponding results when q = 0.1; (b) q = 0.5; (c) q = 2.5 [30]. The type of Country ID is as in Figure 2.
In conclusion, Shannon entropy can better reflect the change of China’s land structures as a whole over this period. If the parameter is 0.5, the very large maximum discrimination of land entropy is influenced by Reny and Tsallis entropies. If the parameters are 0.1, 0.5, and 2.5, Tsallis entropy is superior to Reny entropy. In short, it is reasonable to analyze the changes in regional land-use structures using Shannon entropy.
3.3. The Spatial Analysis of LUCC Entropy
According to the entropy of the county land use in 1990, 1995, 2000, 2005, and 2010, and by visual processing of the map, we can acquire land-use entropy from 1990 to 2010 of Shannon’ entropy, as shown in Figure 5.
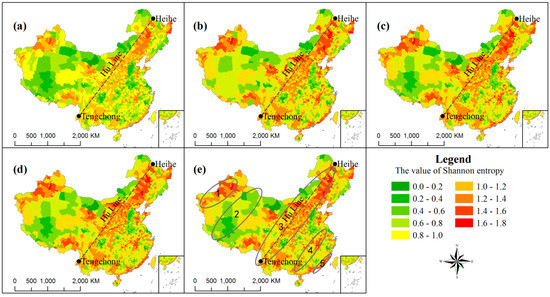
Figure 5.
The change map of Chinese LUCC Shannon entropy in 1990 (a); 1995 (b); 2000 (c); 2005 (d); 2010 (e).
Figure 5 shows that the distribution of Chinese LUCC entropy is unbalanced in time and space. There is a large trend for Chinese LUCC entropy during 1990–2010 which is reflected in the value of Shannon entropy. Showing the characteristics of the gradual transitional alternations along the longitude in space, that is, with increases in the longitude, the land use entropy becomes more diversified. Using the Hu-Huanyong Line [39] as a boundary, the types of LUCC entropies in the densely-populated eastern part of China are more diverse, and, on the whole, the entropy is higher than in the sparsely-populated northwestern region.
Combined with the geographic locations and the changes of entropy, Chinese LUCC entropy can be divided into five types; The Northwest Higher Entropy Region, Western Low Entropy Region, Middle High Entropy Region, South Mixed Entropy Region (hybrid entropy staggered distribution entropy), and the Southeast Coastal High Entropy Area. However, there are special circumstances under this law; for instance, the entropy of the Huang-Huai-Hai Plain is totally lower and relatively stable. This may be related to the regional land structure, economic development level, and other factors. The entropy of Xinjiang is high and shows significant growth, which is probably driven by its policies and technology. For example, with respect to the success of modern agricultural technology and the popularization of it, the close cooperation between leading agricultural enterprises and farmers and some other factors, all contribute to the rapid growth of the land. Regarding the characteristics of the temporal and spatial variations of entropy, we need to combine the regional land structure, land policy, population, GDP (Gross Domestic Product), and other related factors; which should depend on the situation.
4. Discussion
The article selected 1 km × 1 km national land use raster data. Raster has a low resolution in the study of land use changes on a county scale. It has certain influence on the evaluation results of information entropy. The choice of land use type may affect the calculation of information entropy of land use. Land use types in the paper include six types of the first class of land use, which are cultivated lands, woodlands, grasslands, water areas, residential lands, and unused lands. More subdivisions of land use types of data for the calculation of land information entropy are yet to be further explored.
There are many methods to evaluate the model of land use change, such as Land Use Intensity [39], CLUE-S (conversion of land use and its effects at a small region extent) [40], Landscape Fragmentation Index [5], etc. Many evaluation methods are mainly focused on a certain aspects in order to analyze the land-use change in specific regions. In this paper, the method of land use information entropy was used to analyze the changes in land use from the perspective of the entire system. Land use information entropy can reflect dynamic changes in land use types and the degree of transformation in a certain period of time. This is a new attempt, and exploration of the methods of land use change are researched. The method of land use information entropy has some uncertainties in the information entropy model and the selection of the threshold. The choice of an optimal threshold value has a great influence on the evaluation of land use change. For accurate results, we have selected different thresholds and tried to use different land information entropy models in a number of experimental explorations. Finally, we found that Shannon entropy can reflect the volatility of LUCC, and that Renyi and Tsallis entropies also have this function when their parameters have a positive value.
The detailed characterization of LUCC is the key in monitoring the driving factors of social environmental impacts on land use changes, and identify the changes in land use intensity. The descriptions of the temporal and spatial variations of land use changes in this paper are consistent with the general trends of related scholars [36]. In this paper, the information entropy method is used to analyze the spatial pattern of LUCC in China. The paper not only reveals the pattern change process of LUCC but also reflects the phased regional difference regarding the processes and characteristics of land use changes over two decades in China.
5. Conclusions
In this paper, the concept of information entropy was introduced into the study of land use. We used three kinds of land use information entropy models (Shannon entropy, Renyi entropy, and Tsallis entropy) and selected different parameters and performed a number of experiments. In addition, the calculation results were compared and analyzed. Through analyses, we determined the ideal information entropy model and the optimal parameters for optimal land use. Then, we analyzed the changes in land use at a county scale in China. The conclusions are as follows:
- Shannon entropy can reflect the volatility of the Chinese LUCC, that Renyi and Tsallis entropies also have this function when their parameter has a positive value, and that Renyi and Tsallis entropies can reflect the extreme case of the LUCC when their parameter has a negative value.
- In the case of q = 2.5, Renyi and Tsallis entropies can also reflect the volatility of the LUCC. Renyi and Tsallis entropies of the LUCC can reflect the extreme cases of the LUCC in the case of q = 0.1/q = 0.5.
- Through the analysis of Shannon entropy, the entropy of China’s LUCC is uneven in time and space distribution; there is a large trend from 1990 to 2010, and the central region generally has high entropy in space, especially near the Hu line.
Additionally, it is necessary to put forward specific partition results for the distribution types of land entropy in China, based on the quantitative analysis model. Understanding the change driving mechanisms of LUCC entropy needs to be combined with the actual situations in the region. This is a problem we need to pay attention to in the next research phase.
Acknowledgments
This work was supported by the Foundation of Human and Social Sciences of the Chinese Ministry of Education, No. 14YJCZH028 and NSFC (Natural Science Foundation of China), No. 41201387 and No. 41571400. The data set is provided by Data Center for Resources and Environmental Sciences, Chinese Academy of Sciences (RESDC) (http://www.resdc.cn).
Author Contributions
Yong Fan conceived of and designed the methodology of calculation entropy, and realized the entropy information computation tools. Zongyi He and Guangming Yu advised on the method of entropy information content, Hailong Yu, Linru Yang, Rui Bai, and Di Wu performed part of the experimental analyses. All authors have read and approved the final manuscript.
Conflicts of Interest
The authors declare no conflict of interest.
References
- Lambin, E.F.; Turner, B.L.; Geist, H.J.; Agbola, S.B.; Angelsen, A.; Bruce, J.W.; Coomes, O.T.; Dirzo, E.; Fischer, G.; Folke, C.; et al. The causes of land-use and land-cover change: Moving beyond the myths. Glob. Environ. Chang. 2001, 11, 261–269. [Google Scholar] [CrossRef]
- Geist, H.J.; Lambin, E.F. What Drives Tropical Deforestation? A Meta-Analysis of Proximate and Underlying Causes of Deforestation Based on Subnational Case Study Evidence; LUCC International Project Office: Louvain-la-Neuve, Belgium, 2001. [Google Scholar]
- Munroe, D.K.; Müller, D. Issues in spatially explicit statistical land-use/cover change (LUCC) models: Examples from western Honduras and the central highlands of Vietnam. Land Use Policy 2007, 24, 521–530. [Google Scholar] [CrossRef]
- Deng, X.Z.; Zhao, C.H.; Lin, Y.C.; Zhang, T.; Qu, Y.; Zhang, F.; Wang, Z.; Wu, F. Downscaling the impacts of Large-Scale LUCC on surface temperature along with IPCC RCPs: A global perspective. Energies 2014, 7, 2720–2739. [Google Scholar] [CrossRef]
- Yang, J.; Su, J.; Chen, F.; Xie, P.; Ge, Q. A local land use competition cellular automata model and its application. ISPRS Int. J. Geo-Inf. 2016, 5, 106. [Google Scholar] [CrossRef]
- Lin, Z.M.; Xia, B.; Dong, W.J. Analysis on temporal-spatial changes of land-use structure in Guangdong province based on information entropy. Trop. Geogr. 2011, 31, 266–270. [Google Scholar]
- Qian, X.S.; Yu, J.Y.; Dai, R.W. A new field of science: Open complex giant system and its methodology. Nat. Mag. 1990, 13, 2–10. [Google Scholar]
- Tan, Y.Z.; Wu, Z.F. The laws of the information entropy values of land use composition. J. Nat. Resour. 2003, 18, 112–117. (In Chinese) [Google Scholar]
- Wang, Y.M. The analysis of entropy changes on the evolutional tendency of geographical environment. Acta Geogr. Sin. 2011, 66, 1508–1517. (In Chinese) [Google Scholar]
- Zhou, Z.Y.; Duan, J.N.; Liang, C.F. Temporal-spatial changes analysis of land use structure in Changsha city based on information entropy. Econ. Geogr. 2012, 32, 124–129. (In Chinese) [Google Scholar]
- Maeda, E.E.; Almeida, C.M.D.; Ximenes, A.D.C.; Formaggio, A.R.; Shimabukuro, Y.E.; Pellikka, P. Dynamic modeling of forest conversion: Simulation of past and future scenarios of rural activities expansion in the fringes of the Xingu National Park, Brazilian Amazon. Int. J. Appl. Earth Obs. Geoinf. 2011, 13, 435–446. [Google Scholar] [CrossRef]
- Murgante, B.; Amato, F.; Pontrandolfi, P. Supporting planning activities with the assessment and the prediction of urban sprawl using spatiotemporal analysis. Ecol. Inf. 2015, 30, 365–378. [Google Scholar]
- Pérez-Vega, A.; Mas, J.F.; Ligmann-Zielinska, A. Comparing two approaches to land use/cover change modeling and their implications for the assessment of biodiversity loss in a deciduous tropical forest. Environ. Model. Softw. 2012, 29, 11–23. [Google Scholar] [CrossRef]
- Zhao, J.; Shi, L.; Chun, X. Human settlement evaluation in mountain areas based on remote sensing, GIS and ecological niche modeling. J. Mt. Sci. 2013, 10, 378–387. [Google Scholar] [CrossRef]
- Guo, E.; Zhang, J.; Ren, X.; Zhang, Q.; Sun, Z. Integrated risk assessment of flood disaster based on improved set pair analysis and the variable fuzzy set theory in central Liaoning Province, China. Nat. Hazards 2014, 74, 947–965. [Google Scholar] [CrossRef]
- Mao, X.; Meng, J.; Xiang, Y. Cellular automata-based model for developing land use ecological security patterns in semi-arid areas: A case study of Ordos, Inner Mongolia, China. Environ. Earth Sci. 2012, 70, 269–279. [Google Scholar] [CrossRef]
- Dai, X.; Li, Z.; Lin, S.; Xu, W. Assessment and zoning of eco-environmental sensitivity for a typical developing province in China. Stoch. Environ. Res. Risk Assess. 2012, 26, 1095–1107. [Google Scholar] [CrossRef]
- Zhang, J.; Wang, K.; Chen, X.; Zhu, W. Combining a fuzzy matter-element model with a geographic information system in eco-environmental sensitivity and distribution of land use planning. Int. J. Environ. Res. Public Health 2011, 8, 1206–1221. [Google Scholar] [CrossRef] [PubMed]
- Wang, S.; Ma, H.; Zhao, Y.B. Exploring the relationship between urbanization and the eco-environment—A case study of Beijing-Tianjin-Hebei region. Ecol. Indic. 2014, 45, 171–183. [Google Scholar] [CrossRef]
- Zhao, J.; Xu, J.H.; Mei, A.X. Fractal study on land use structure and form change: The case of central areas in Shanghai. J. East China Normal Univ. 2005, 1, 78–84. (In Chinese) [Google Scholar]
- Zhang, J.; Fu, M.; Zhang, Z.; Tao, J.; Fu, W. A trade-off approach of optimal land allocation between socio-economic development and ecological stability. Ecol. Model. 2014, 272, 175–187. [Google Scholar] [CrossRef]
- Chen, Y.G.; Liu, J.S. An index of equilibrium of urban land-use structure and information dimension of urban form. Geogr. Res. 2001, 5, 146–152. (In Chinese) [Google Scholar]
- Hu, L.; He, Z.; Liu, J.; Zheng, C. Method for measuring the information content of terrain from digital elevation models. Entropy 2015, 17, 7021–7051. [Google Scholar] [CrossRef]
- Pavanaguru, R.; Latha, A. Entropy as an indicator of fragmented landscape. Curr. Sci. 2006, 91, 10. [Google Scholar]
- Tewolde, M.G.; Cabral, P. Urban sprawl analysis and modeling in Asmara, Eritrea. Remote Sens. 2011, 3, 2148–2165. [Google Scholar] [CrossRef]
- Shen, L.; Zhou, J.; Skitmore, M.; Xia, B. Application of a hybrid Entropy-McKinsey Matrix method in evaluating sustainable urbanization A China case study. Cities 2015, 42, 186–194. [Google Scholar] [CrossRef]
- Fan, Q.; Ding, S. Landscape pattern changes at a county scale: A case study in Fengqiu, Henan Province, China from 1990 to 2013. Catena 2016, 137, 152–160. [Google Scholar] [CrossRef]
- Carmona, A.; Nahuelhual, L. Combining land transitions and trajectories in assessing forest cover change. Appl. Geogr. 2012, 32, 904–915. [Google Scholar] [CrossRef]
- Tan, Y.; Xu, H.; Zhang, X. Sustainable urbanization in China: A comprehensive literature review. Cities 2016, 55, 82–93. [Google Scholar] [CrossRef]
- Li, S.; He, J.; Song, K. Network entropies of the Chinese financial market. Entropy 2016, 18. [Google Scholar] [CrossRef]
- Li, Y.; Fan, X.P. A new image threshold segmentation algorithm. Comput. Simul. 2008, 25, 229–232. (In Chinese) [Google Scholar]
- Shannon, C.E.; Weaver, W. The Mathematical Theory of Communication; University of Illinois Press: Urbana, IL, USA, 1949. [Google Scholar]
- Renyi, A. Probability Theory; Dover: New York, NY, USA, 1970. [Google Scholar]
- Tsallis, C.; Mendes, R.S.; Plastino, A.R. The role of constraints within generalized non extensive statistics. Physica A 1998, 261, 534–554. [Google Scholar] [CrossRef]
- Data Center for Resources and Environmental Sciences, Chinese Academy of Sciences (RESDC). Available online: http://www.resdc.cn (accessed on 23 January 2017).
- Liu, J.Y.; Kuang, W.H.; Zhang, Z.X.; Xu, X.L.; Qin, Y.; Ning, J.; Zhou, W.; Zhang, S.; Li, R.; Yan, C.; et al. Spatiao temporal characteristics, patterns and causes of land-use changes in China since the late 1980s. J. Geogr. Sci. 2014, 24, 195–210. (In Chinese) [Google Scholar] [CrossRef]
- Liu, J.Y.; Zhang, Z.X.; Xu, X.L.; Kuang, W.; Zhou, W.; Zhang, S.; Li, R.; Yan, C. Spatial patterns and driving forces of land use change in China during the early 21st century. J. Geogr. Sci. 2010, 20, 483–494. (In Chinese) [Google Scholar] [CrossRef]
- Liu, F.; Yan, H.; Liu, J.; Xiao, X.; Qin, Y. Spatial pattern of land use intensity in China in 2000. Acta Geogr. Sin. 2016, 71, 1130–1143. (In Chinese) [Google Scholar]
- Lu, D.D.; Wang, Z.; Feng, Z.M.; Zeng, G.; Fang, C.L.; Dong, X.F.; Liu, S.H.; Jiao, S.F.; Fang, Y.P.; Meng, G.W.; et al. Academic debates on Hu Huanyong population line. Geogr. Res. 2016, 35, 505–824. (In Chinese) [Google Scholar]
- Hu, Y.; Zheng, Y.; Zheng, X. Simulation of land-use scenarios for Beijing using CLUE-S and Markov composite models. Chin. Geogr. Sci. 2013, 23, 92–100. [Google Scholar] [CrossRef]
© 2017 by the authors. Licensee MDPI, Basel, Switzerland. This article is an open access article distributed under the terms and conditions of the Creative Commons Attribution (CC BY) license ( http://creativecommons.org/licenses/by/4.0/).