3.1. Flow Structures and Temperature Distribution
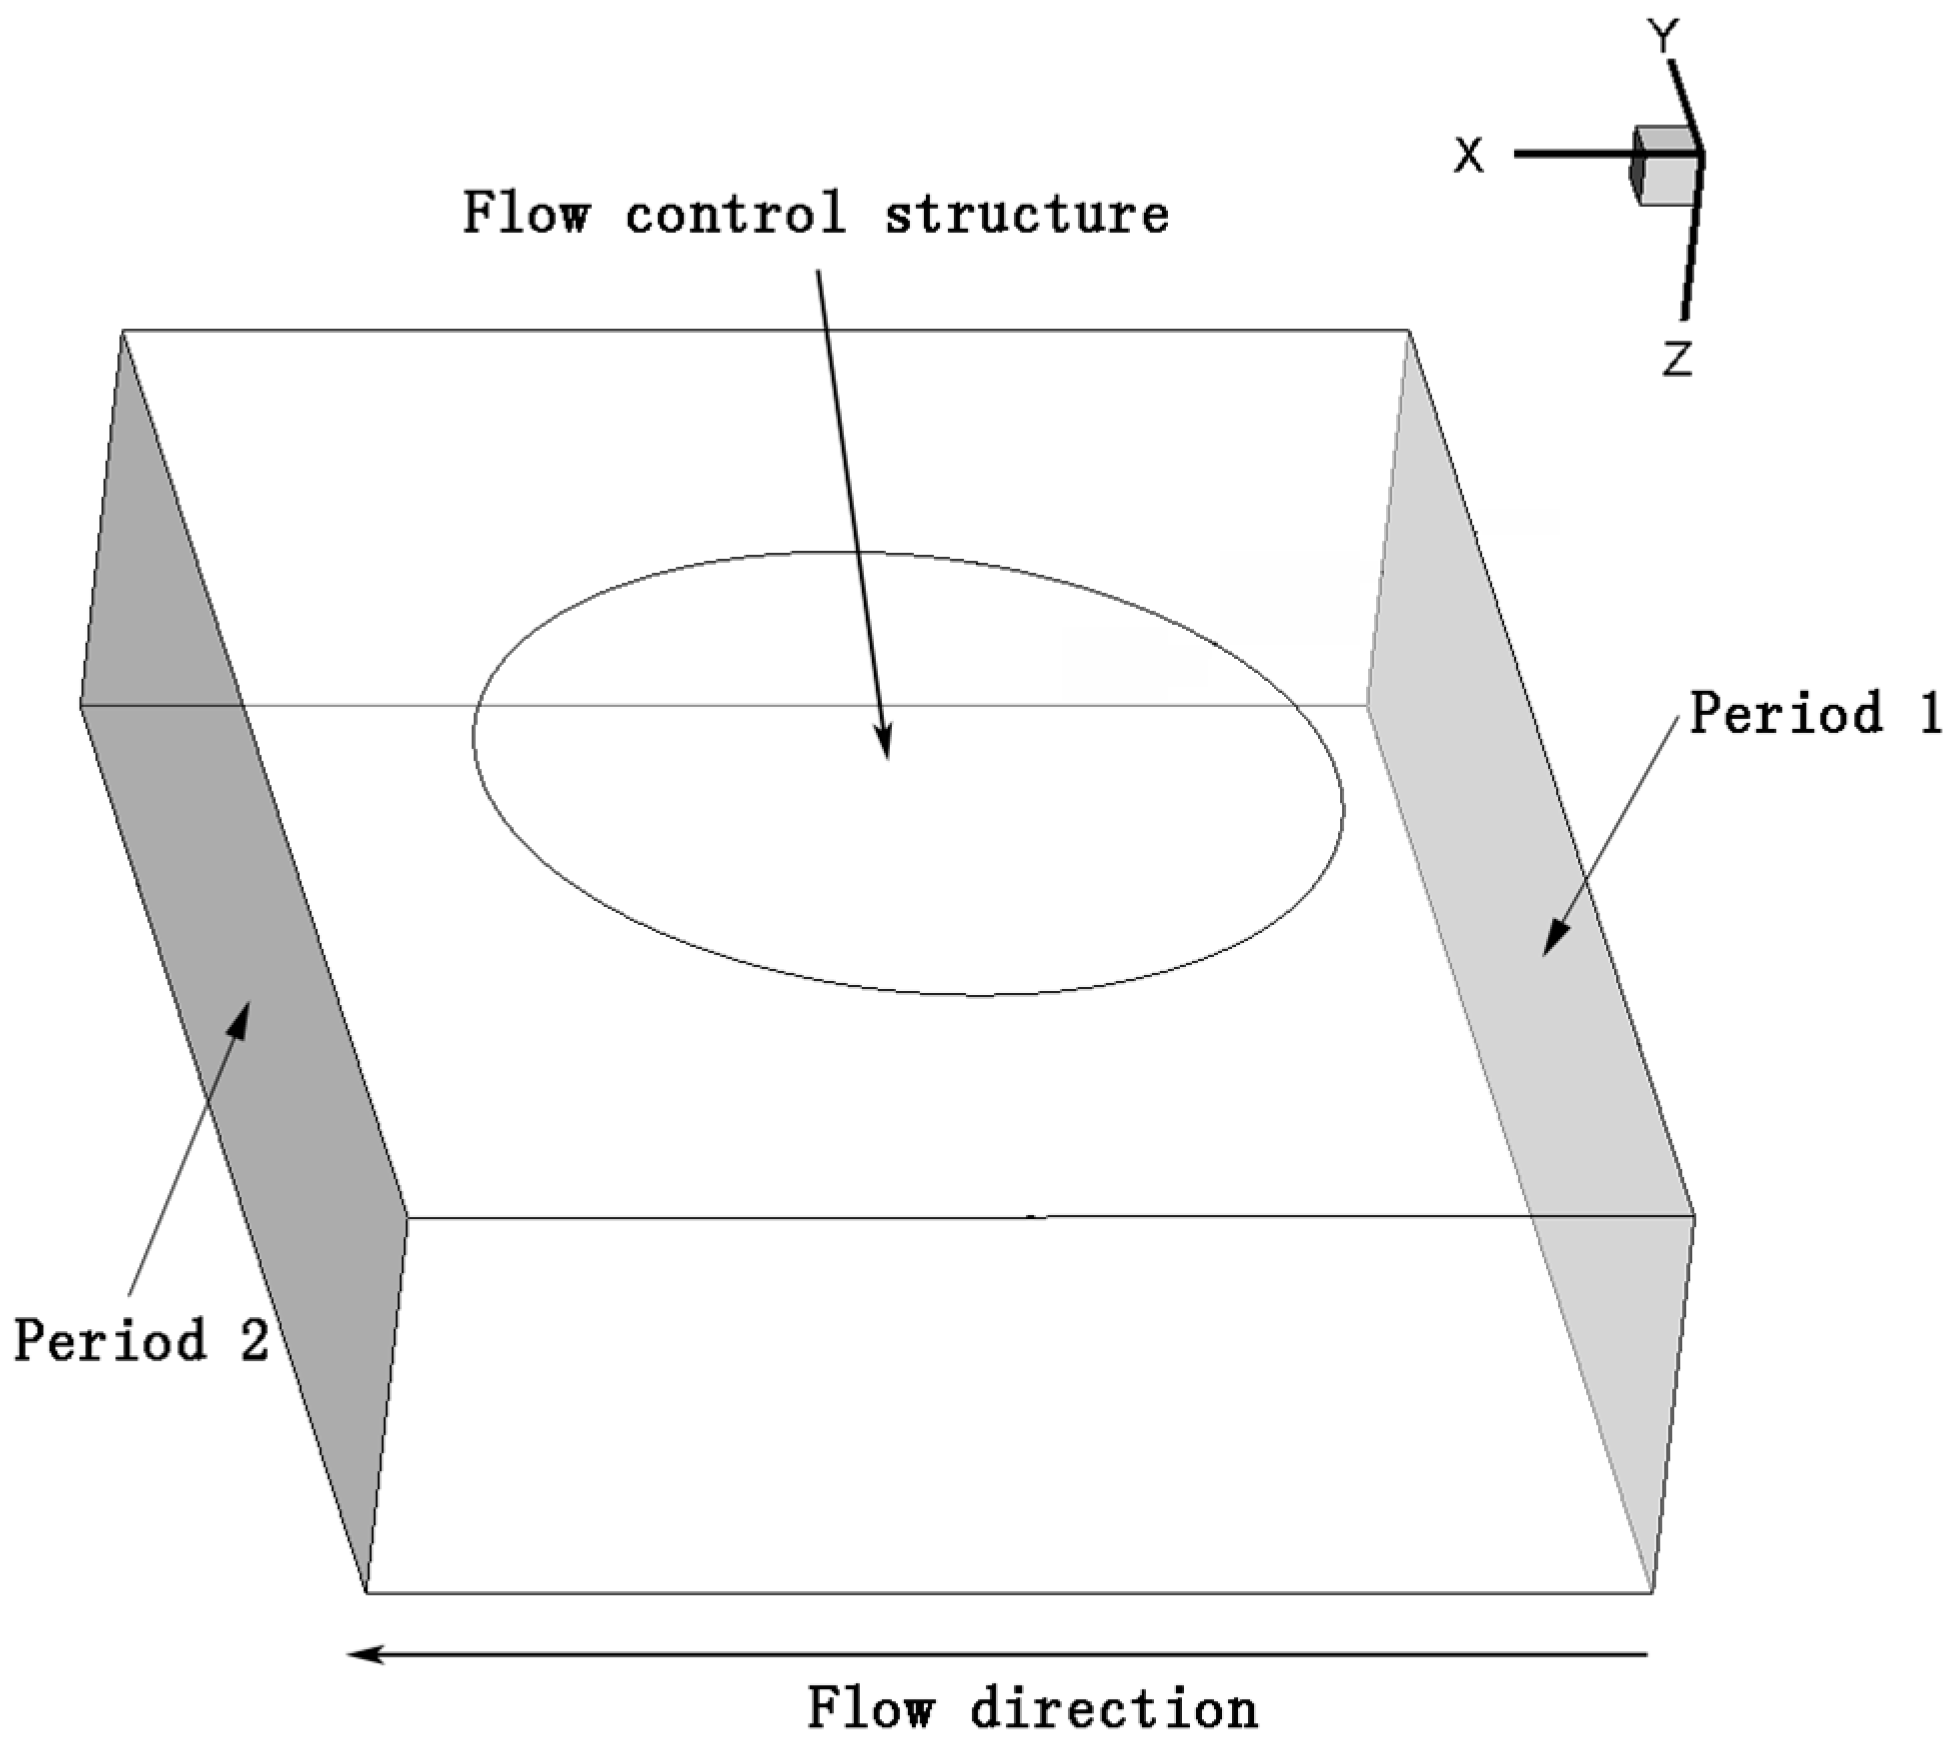
In this paper, the detailed flow structures and temperature distribution are analyzed utilizing limiting streamlines and temperature contours on the walls with flow control structures, as well as the dynamic viscosity distribution and streamlines on the stream-wise and span-wise middle section.
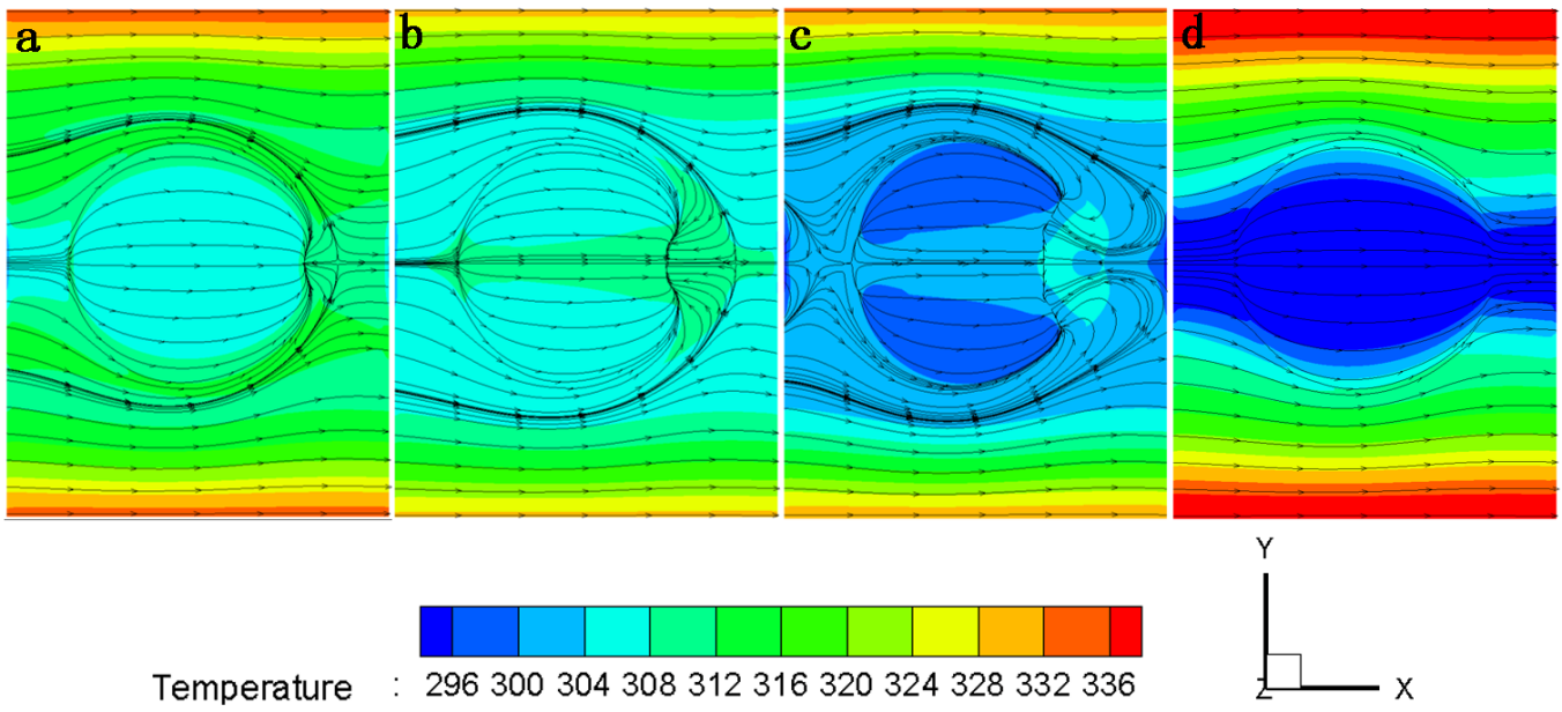
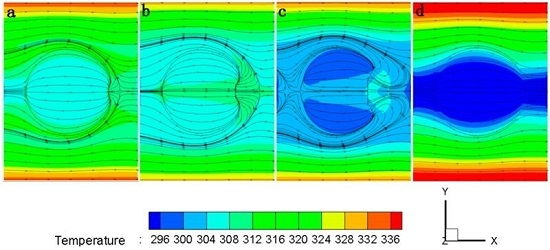
The flow structures and temperature distribution in the microchannel with the four flow control structures are obviously different. Firstly, the temperature distribution and limiting streamlines of protrusion with different CMC concentrations at flow rate equaling 4 × 10
−5 kg·s
−1 are shown in
Figure 3. It can be easily found that the CMC concentration has some influence on the flow structures. In detail, flow separation occurs in the cases of CMC100, CMC500 and CMC2000, which means for cases with low CMC concentration, flow separates near the trailing edge of the protrusion and reattaches quickly, and also, when CMC concentration increases individually, the positions of separation and reattachment move along the anti-flow direction and flow direction, respectively, therefore, the separation bubble grows larger gradually (
Figure 3a,b). As the CMC concentration increases further, flow slows down before it impinges on the wall in the front of protrusion, forming a separation bubble, and fluid separates at the tail of protrusion again when flow meet the re-circulated flow near the trailing edge of the protrusion, then the mixed flow reattached on the two sides of the flow direction (
Figure 3c), the complex vortices effectively enhance the mass and heat transfer in the flow domain near the protruded wall, but the separation bubble is not observed in the flow domain in the cases of CMC4000, just leaving curved streamlines on the protruded walls, which is due to that the initial dynamic viscosity is so large that viscous force is relatively higher compared with the inertia force than that of most other fluids, so the vortices are not intense, which can also be observed in
Figure 4. Furthermore, the temperature distribution is much different with each other among the four cases. The first three cases have a relatively uniform temperature distribution and the difference of maximum and minimum temperature is smaller than that of the last one, which is due to the flow separation and reattachment enhance the mixing of main flow and near-wall flow in the microchannel.
It must be noted that flow separation may not occur in some other cases with lower flow rate and lower CMC concentration, such as the case of CMC100 with flow rate equaling 4 × 10
−5 kg·s
−1, the fluid flows slowly in the channel and can’t stir up intense vortices in the fluid domain. The temperature gradient in these cases is relatively larger than that in the cases with separated flow, but smaller than the cases with large CMC concentration without separated flow such as
Figure 3d. The temperature distribution is more uniform in the fluid domain when flow separation occurs, so combined with the above analysis, the CMC concentration could be adjusted to a proper value at which the separation occurs, namely, “y” in the
Table 4, to enhance the heat and mass transfer performance when flow rate and flow control structure are confirmed. As are shown in
Table 4, separation flows in microchannel with protruded walls for all the cases are concluded and compared, in which “n” represents no separation flow, “y” represents separation bubbles are observed in the flow domain.
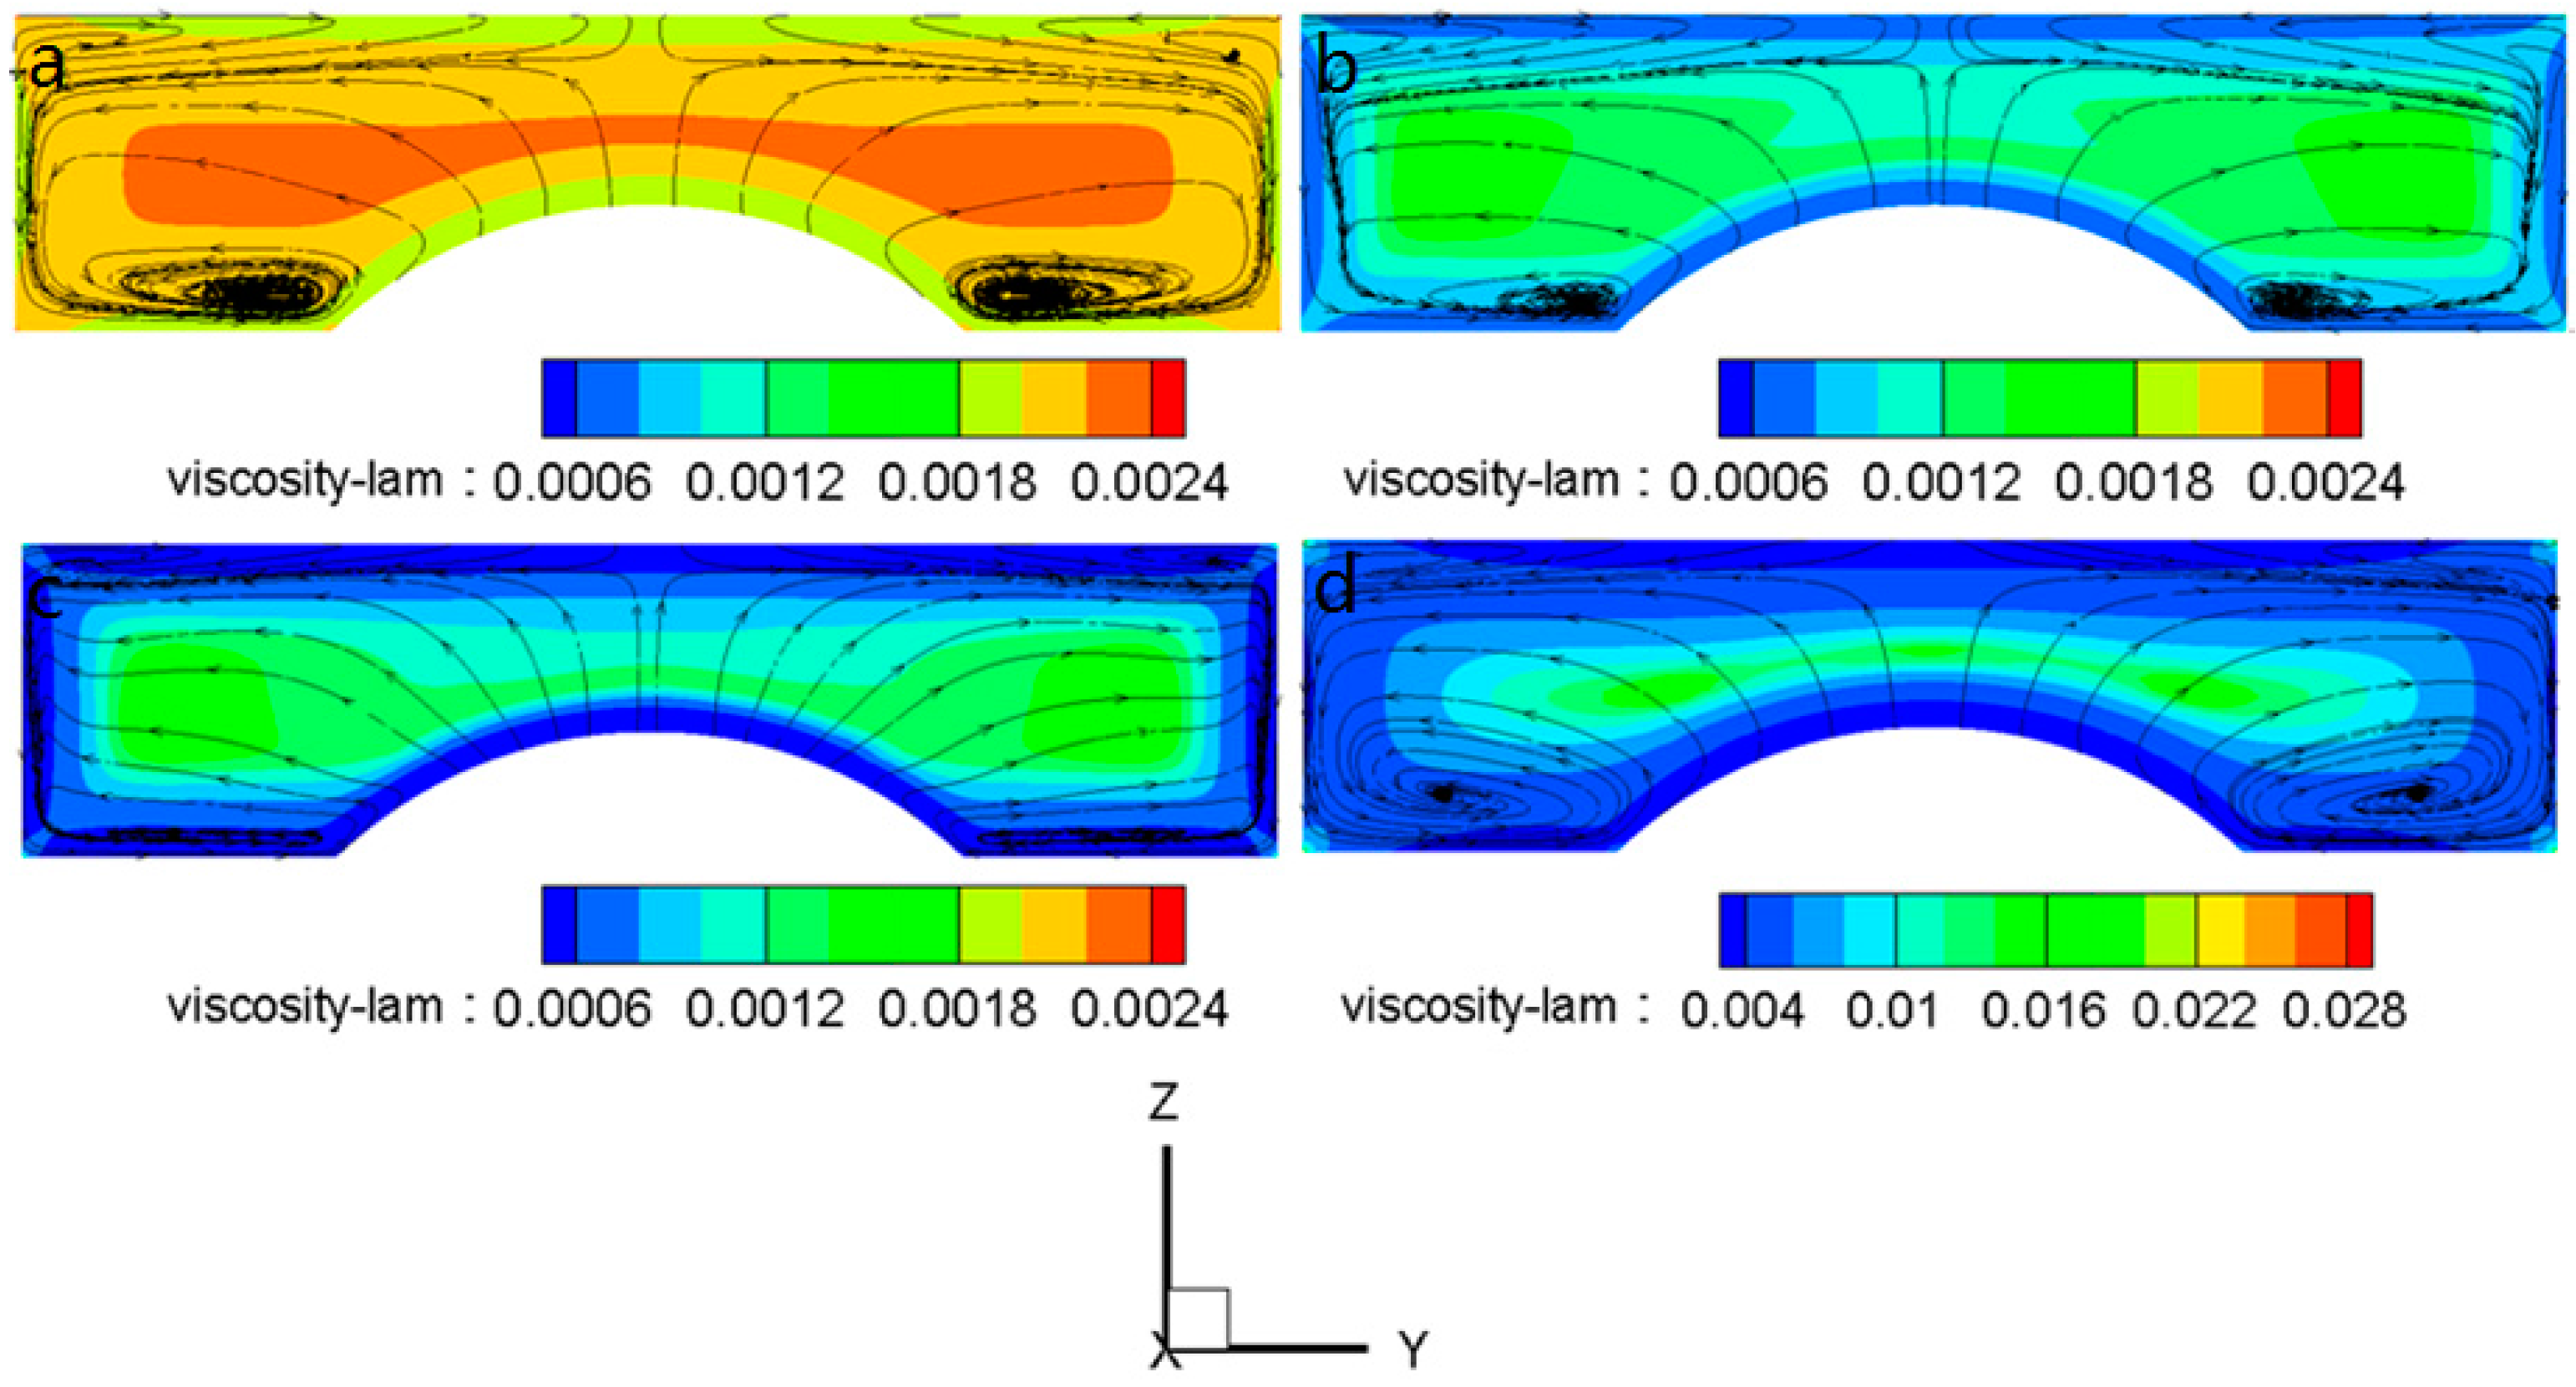
Figure 4 shows the dynamic viscosity distributions and streamlines on the stream-wise middle sections for the corresponding cases of
Figure 3. They have the same legend except the last case in which the dynamic viscosity is much larger than that in the first three cases. It can be easily found that the dynamic viscosity decreases gradually when the CMC concentration increases from 100 ppm to 2000 ppm in the flow domain, and then has a sudden raise when CMC concentration further increases to 4000 ppm, which means the shear-thinning effect in the first three cases is so obviously that the effect of slowly increasing initial dynamic viscosity is suppressed, but in the last case, the initial dynamic viscosity increases to more than twenty times that of the CMC2000, which can be seen in
Table 2, while
n decreases slowly as before, so the sharp increase of initial dynamic viscosity is more effective. Further, the combined results show that in the flow regions where dynamic viscosity is lower, the fluid velocity is relatively higher and the mass and heat transfer is more intense. So the wall-temperature near these regions is low. While in the regions where separation occurs, the temperature is higher than the temperature near flow reattachment regions (
Figure 4a), which is because that the reattachment brings the center cold fluid to the region near the wall and produces higher heat transfer, but after the fluid chill down the heated wall, its temperature is relatively higher and then meet the fluid which are heated just by the upstream heating wall. Then, the mixed flow of the upstream and downstream separates from the wall in the separation region where the fluid flows from the hotter wall to colder core flowing, the small temperature difference can produce little heat transfer from the wall to the fluid. Moreover, from other cases that flow rate varies from 4 × 10
−5 kg·s
−1 to 8 × 10
−5 kg·s
−1 in the same concentration of CMC aqueous solution, it can be easily found that the separation bubble grows larger and wall temperature decreases gradually while the flow rate increases, which means the increase of the scale and intensity of separation bubble enhances the mixture of fluid between main flow and near-wall region, so the temperature of near-wall fluid decreases, and then the heat transfer between fluid and walls is improved, making the temperature of walls lower. What’s more, in each case separately, the dynamic viscosity is lower in the regions near the up no-slip walls and in the front of the protrusion where fluid impinges on the protruded wall, the central plane of the flow domain has a higher dynamic viscosity. The flow separation region has the highest dynamic viscosity in the fluid domain, especially in the case of CMC100 (
Figure 4a). The dynamic viscosity in the flow recirculation region is lower than the adjacent region (
Figure 4c), which reflects the velocity gradient in the recirculation region is lower than the adjacent region where the flow direction is different, especially in the region near the tail of the protrusion. At last, it can be obviously observed that the separation bubble grows larger and larger as the CMC concentration increases in the first three cases, but disappears in the case of CMC4000 (
Figure 4d) because of the high dynamic viscosity in the whole fluid domain.
Figure 5 shows the dynamic viscosity distributions and streamlines in the perpendicular to stream-wise middle sections for the corresponding cases of
Figure 3. The intense complex three-dimensional flow feature of separation flow can be observed here. The flow vortices become flatter in this section as the concentration increase from 100 ppm to 2000 ppm, so the flow vortices become more intense in the thin region near the structured wall. But the dynamic viscosity is so high that only two large gentle vortices are formed near the two side corner in this section and no separation occurs in this case of CMC4000. Further, it can be seen from each case individually that the main flow is compressed to both sides of the protrusion and generates
y-direction and
z-direction velocities around the protrusion, and then forms circular surface streamlines. The flow near the upper wall is also compressed to both sides of the protrusion and form two small recirculation region in the upper two corners. Moreover, the dynamic viscosity near the surrounding no-slip walls is the lowest in the whole flow domain because of the high shear stress in these regions except the two upper recirculation corners.
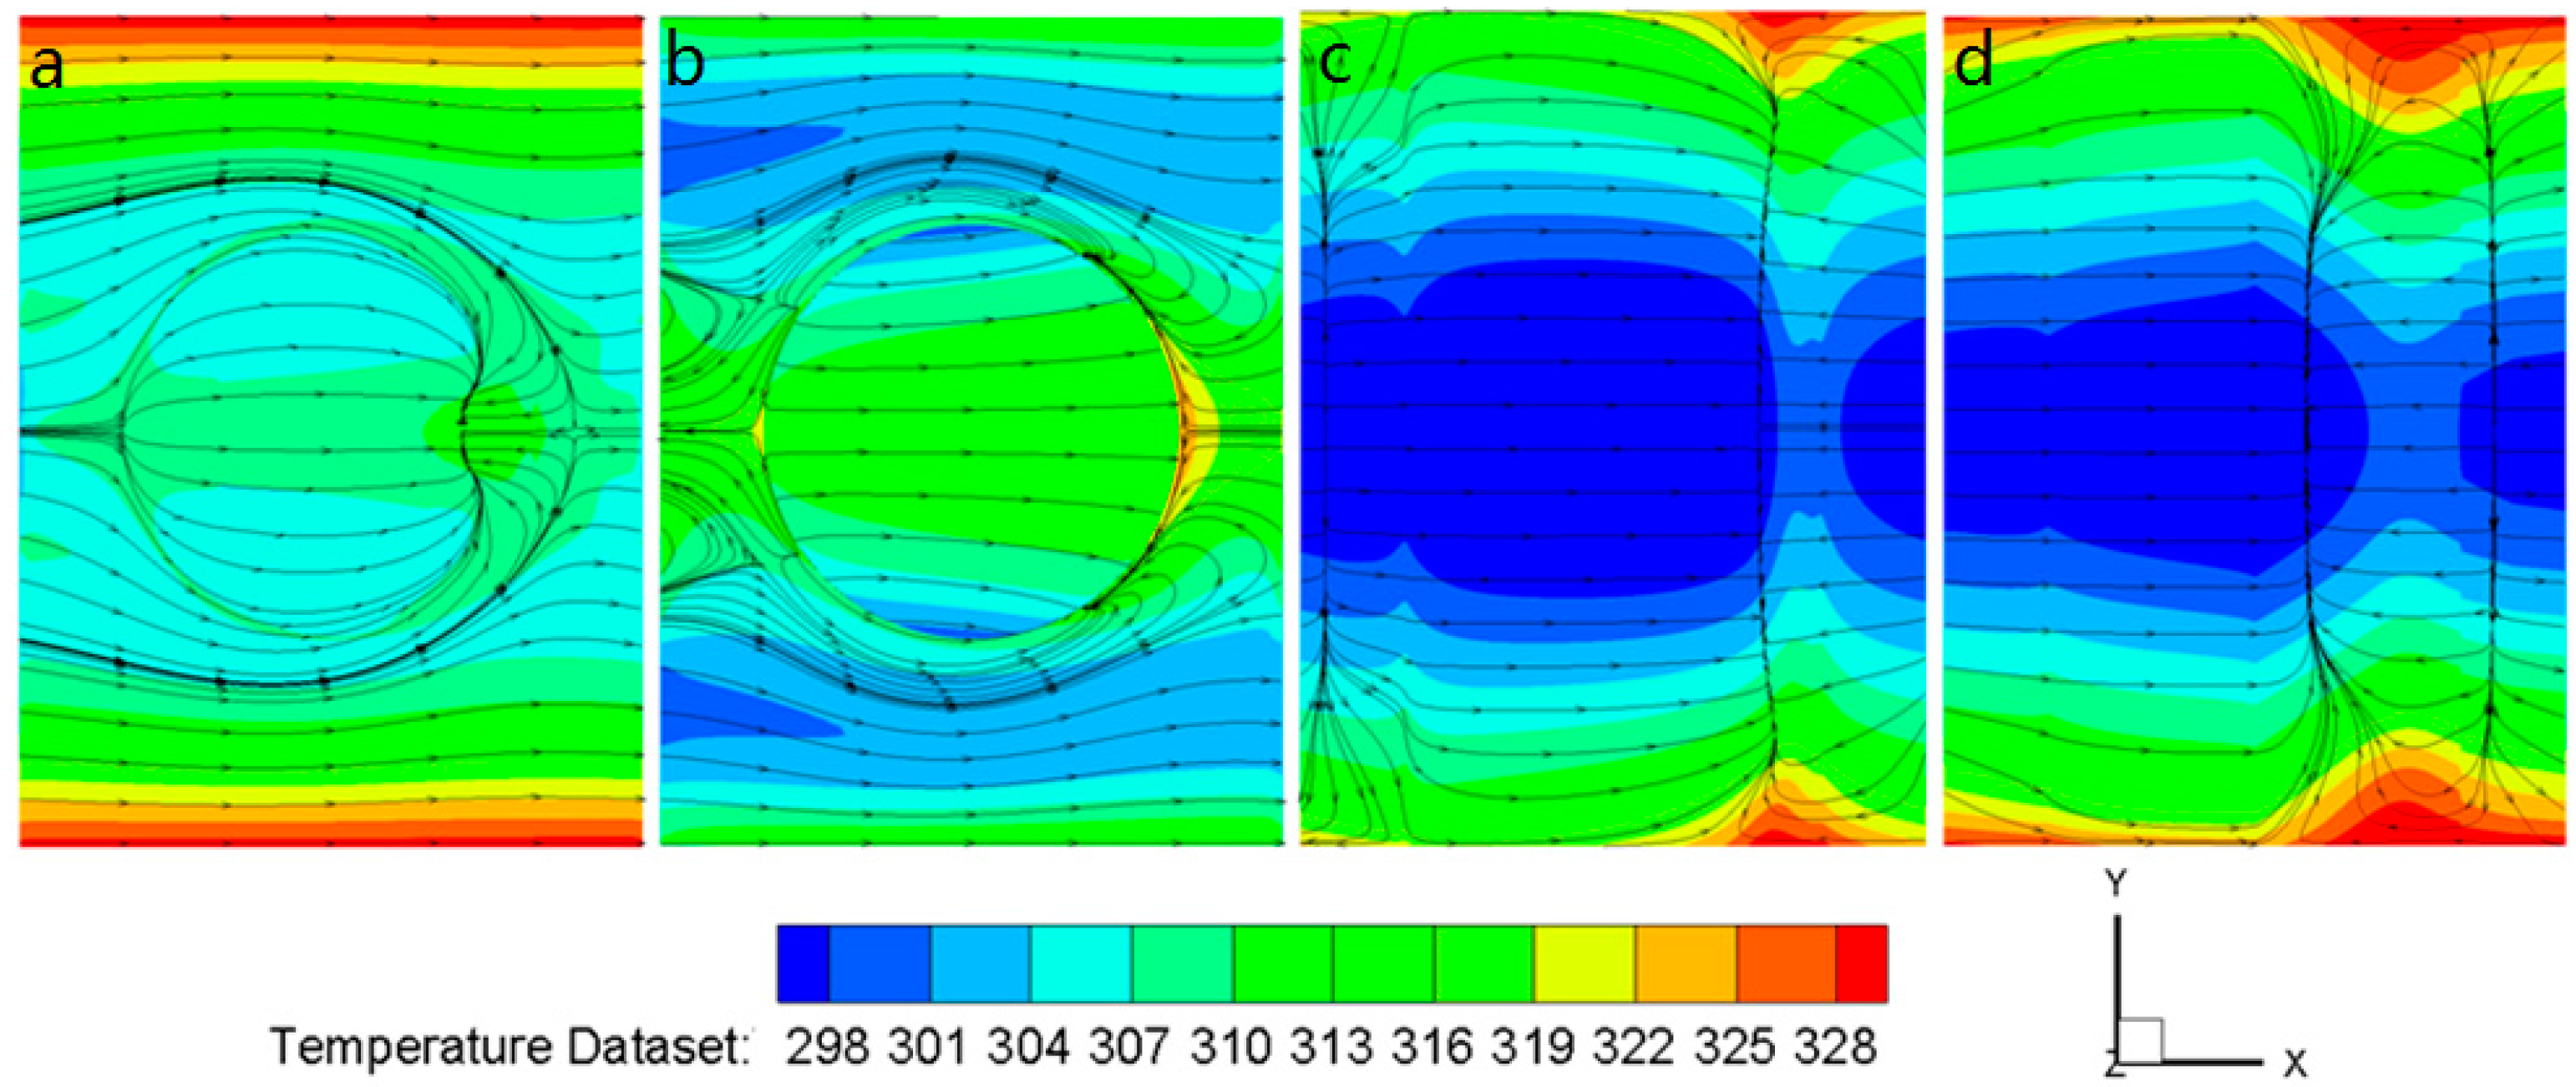
Figure 6 shows the temperature distributions and limiting streamlines on the structured walls of microchannel with protrusions, pin-fins, cylinder-ribs, and V-grooves, respectively. The flow rate and CMC concentration are all the same in the four cases. Firstly, it can be easily found that the maximum temperature on the wall with pin-fin is obviously lower than that of the other structures; the average temperatures on the external walls for the four structures are 312.1 K, 309.8 K, 309.4 K and 311.5 K, respectively, cylinder-rib has the minimum average temperature because of the large low temperature area near the center plane of span-wise direction. Further, the temperature gradient on pin-fin walls is the smallest in both the span-wise direction and the flow direction, so the pin-fin configuration has the most uniform temperature distribution at
Q = 2 × 10
−5 kg·s
−1 and CMC500 in the four different structures, which means heat transfer in the span-wise direction is much intense in the microchannel with pin-fin because of the non-uniform structure, in other words, the sudden change of the structure in the channel. Secondly, the flow structures in the microchannel with the four flow control structures are different from each other, the microchannel with pin-fins and protrusions change the flow structures greatly near the middle section of the span-wise direction, leaving curved limiting streamlines near the up and down no-slip walls, where the flow structure is little different from smooth rectangular microchannel. There is a recirculation region between two protrusions/pin-fins in the stream-wise direction, and the recirculation region almost fully fills the space between the two structures in pin-fin channel. Meanwhile, in the cylinder-rib channel, the separation bubbles almost fully cross the span-wise direction, and the difference of flow structures in span-wise direction is smaller than that of the first two cases, this cause a larger temperature gradient in this direction. Moreover, flow separates near the end of the cylinder-rib, and then reattaches in the front of next cylinder-rib, which is different from that in the V-groove channel in which the flow separates near and after the peak of the V-groove and reattaches quickly after the end of V-groove. The recirculation region in the V-groove channel is much smaller than that of the cylinder-rib channel in the flow direction. Thirdly, considering the temperature distribution near the sidewall of the microchannel, it can be found that the wall temperature near the downstream of the separation region is much higher than the temperature near the downstream of the reattachment region, which is consistent with the analysis of
Figure 4 that wall temperature is higher near flow separation regions than that near reattachment regions.
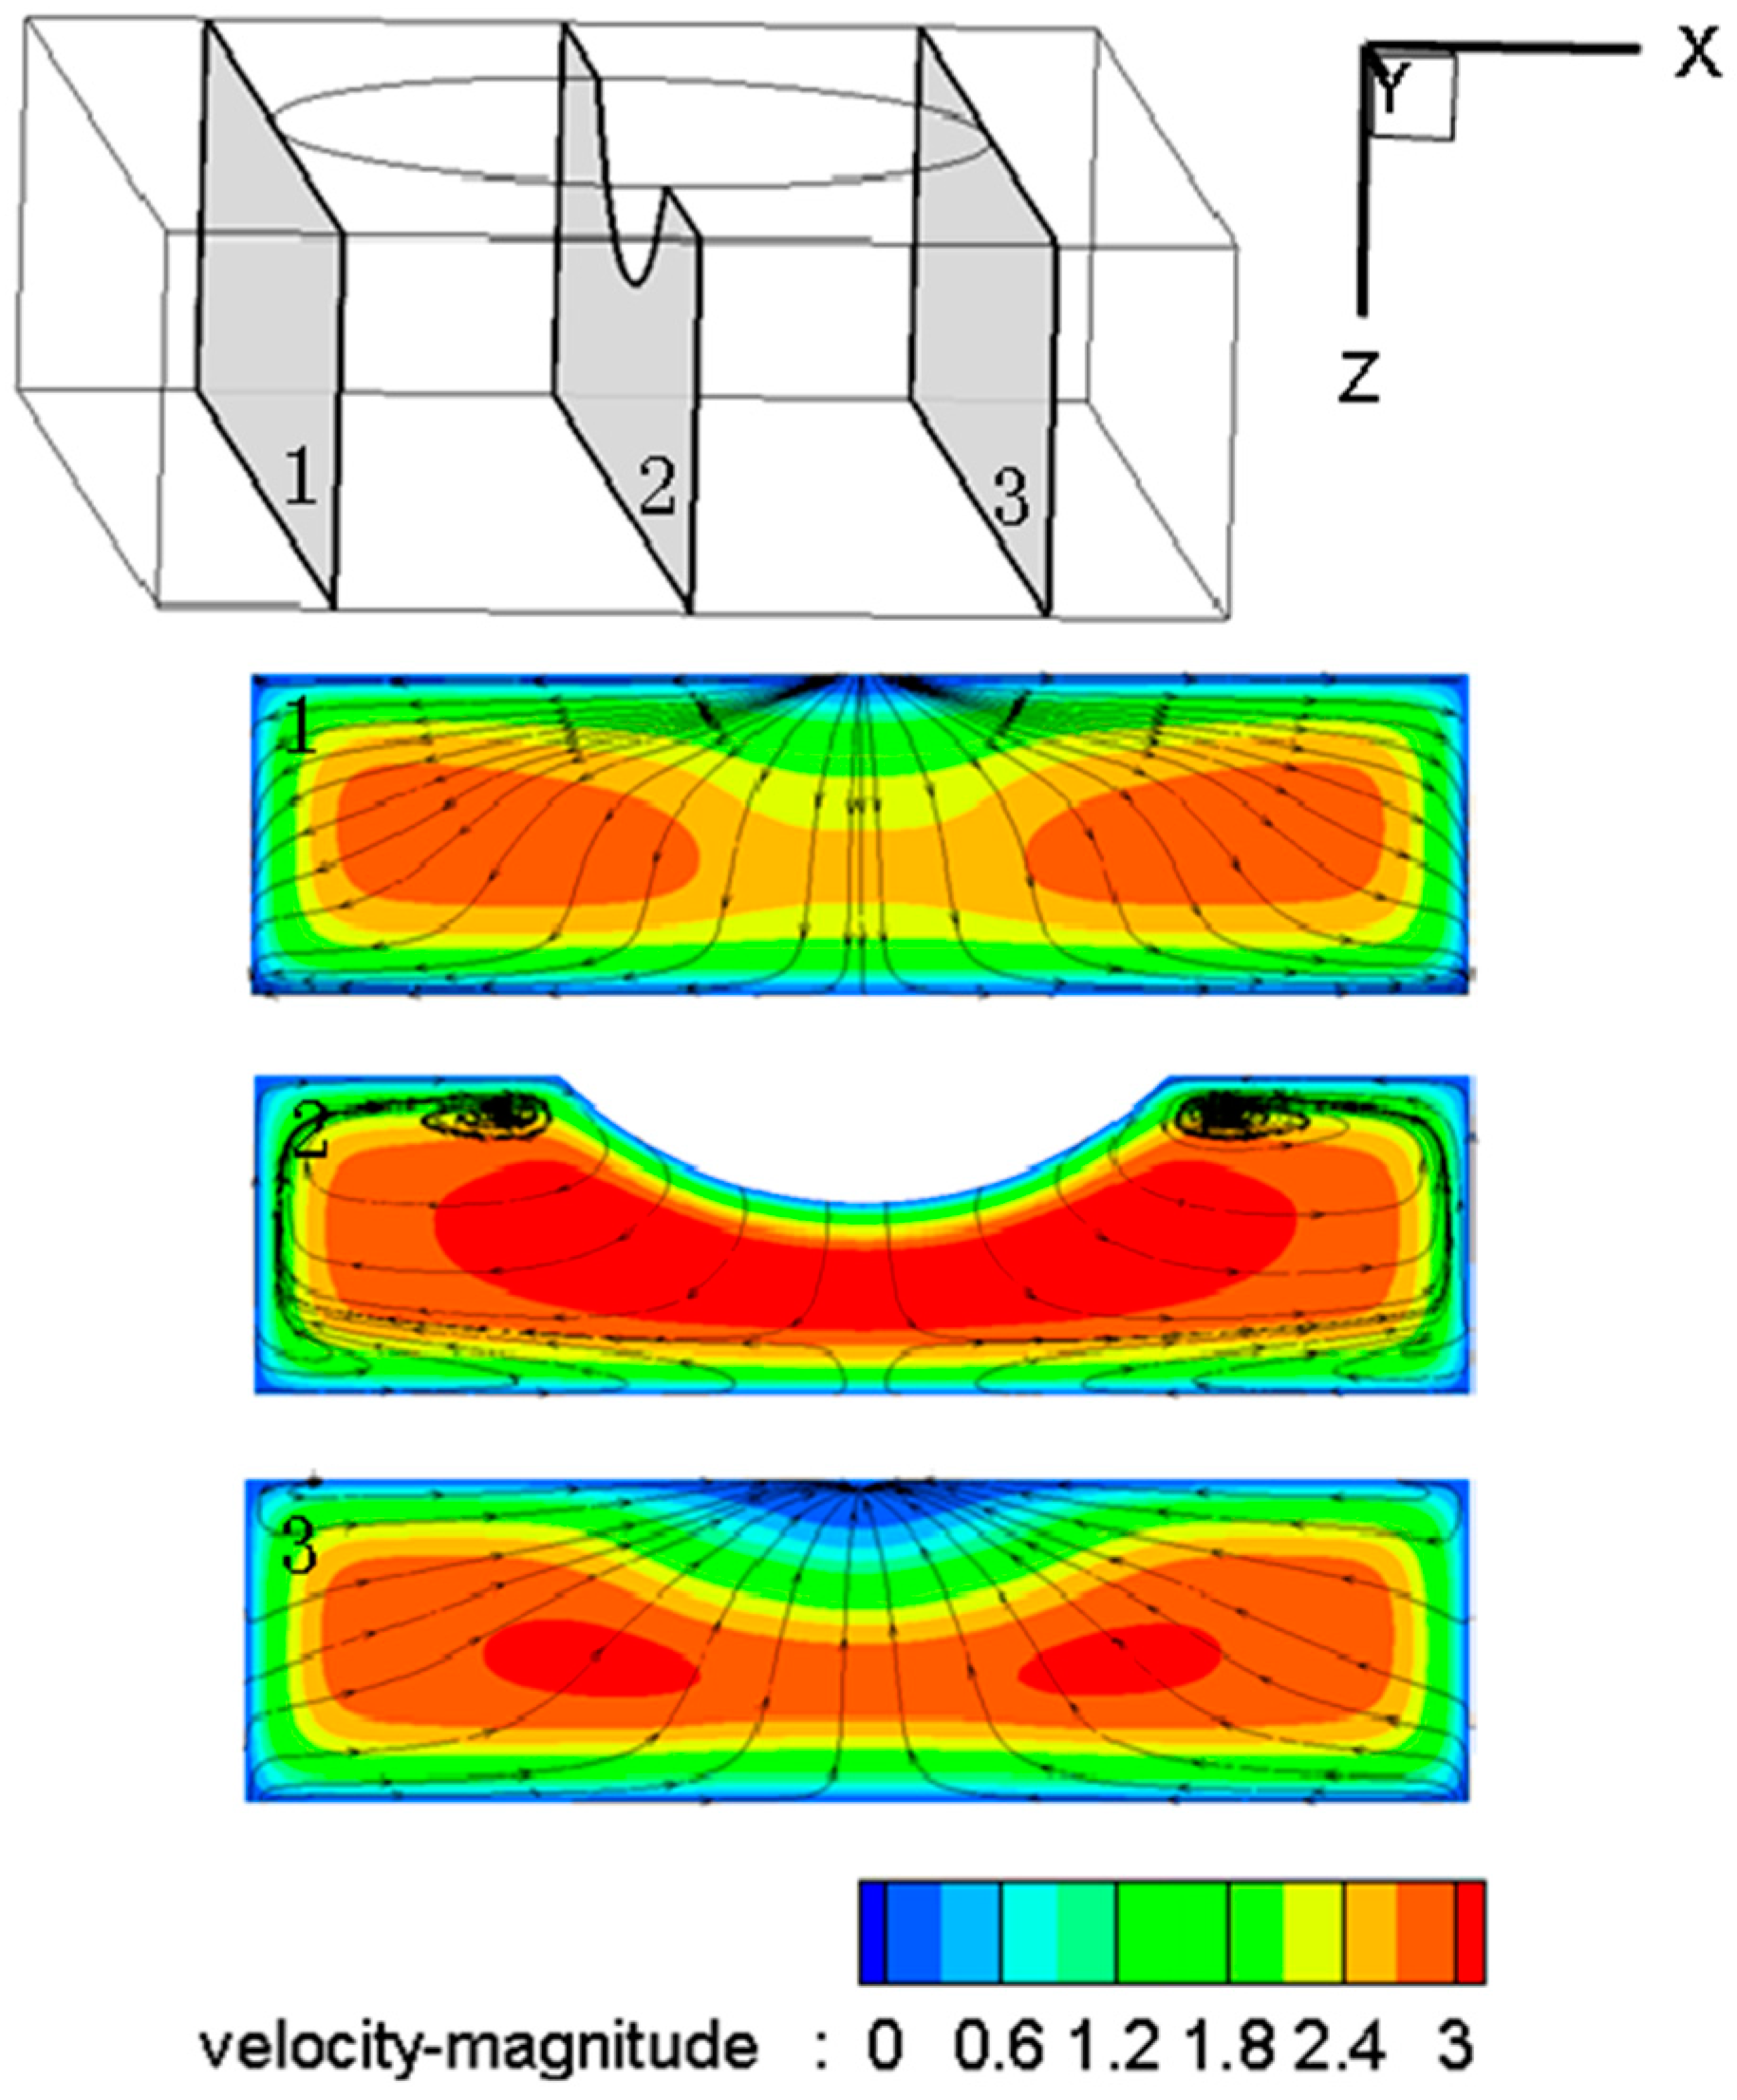
Figure 7 shows the velocity magnitude distribution and streamlines in the three sections for the corresponding case of
Figure 6a, the three sections are located in the front edge, the middle and the trailing edge of protrusion, respectively. It can be easily seen from the streamlines that the flow is compressed to both sides of the microchannel (section 1 in
Figure 7) in the front of the protrusion, then forms two vortices on the two sides of protrusion (section 2 in
Figure 7), at last, the fluid flows to the center of the microchannel near the trailing edge of the protrusion (section 3 in
Figure 7). The highest velocity region is separated in the section 1 and section 3 while they are connected in section 2 because the section area is suppressed by the protrusion in this section. In the other corresponding cases of
Figure 6b–d, the fluid flows around the structured walls just like the case of
Figure 6a, but have more complicated vortex flow structures because of the large change of the sectional area in the flow direction.
In the other cases that have different flow rates (2 × 10⁻⁵, 4 × 10⁻⁵, 6 × 10⁻⁵ and 8 × 10⁻⁵ kg·s−1) and CMC concentrations (100, 500, 2000 and 4000 ppm) of the microchannel with the four different flow control structures, the laminar flow structures change little when compared with the cases mentioned above. The statistic data of heat and mass transfer of all the cases are analyzed in the following context.
3.2. Flow Friction and Heat Transfer Performance Analysis
To quantitatively evaluate the flow friction of shear-thinning power-law fluid in the microchannel with the four different flow control structures, the relative Fanning friction factor
f/
f0 is comparative analyzed firstly, in which
f is defined as:
where ∆
p is the pressure drop and
L is the periodic length. The analytical solutions of baseline Fanning friction factor
f0 [
32] for smooth rectangular microchannel with water as working substance are used to normalize the Fanning friction factor in this research, similar with our previous research [
33], as the
L, Dh, and
Uave are all the same in each
f/
f0, so:
where ∆
p0 is the pressure drop of smooth rectangular microchannel with water as working substance. The value of ∆
p0 is calculated and listed in the
Table 5, from which we can easily find that ∆
p0 is proportional to flow rate.
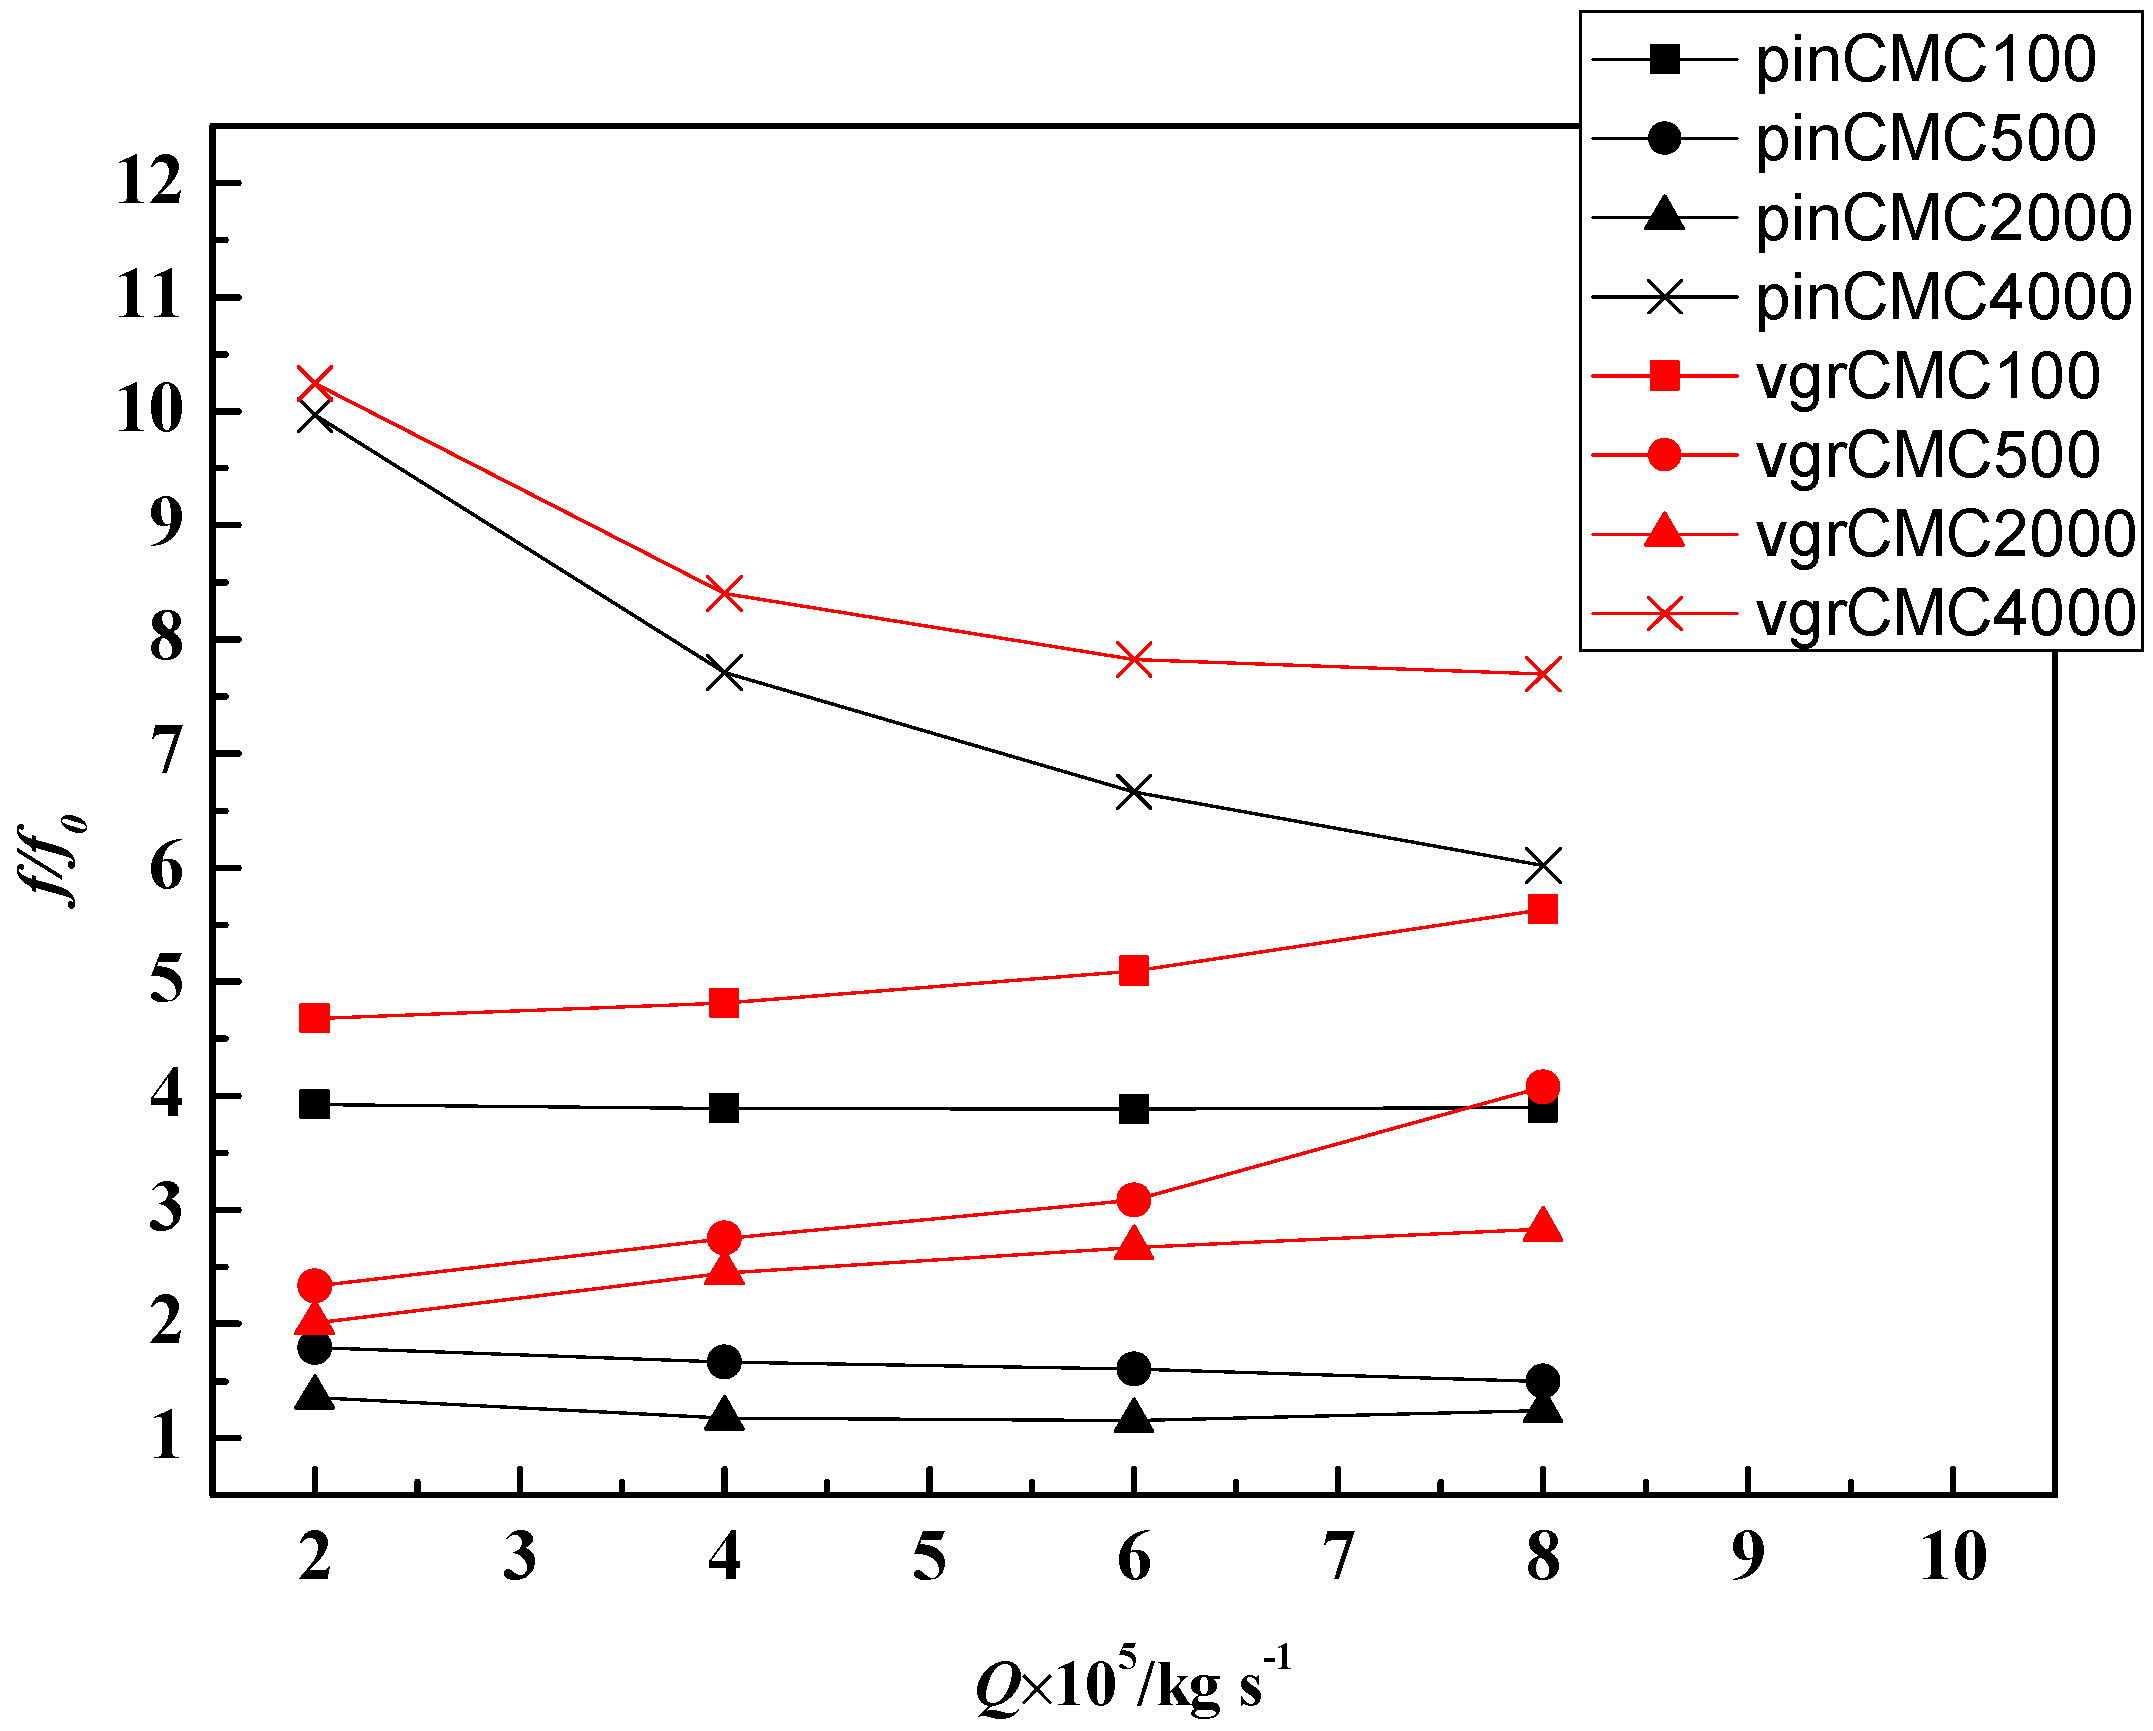
As is shown in
Figure 8 and
Figure 9, the prefixes pro-, pin-, cyl-, and vgr- represent the microchannels with protrusion, pin-fin, cylinder-rib, and V-groove, respectively.
f/
f0 doesn’t similarly increase or decrease with the flow rate. The value of
f/
f0 should be a constant if Newtonian fluid is chosen as working substance, but CMC aqueous solution is a typical shear-thinning power-law fluid, its dynamic viscosity decreases with the increase of shear strain rate, and a larger mass flow rate could produce a larger shear strain rate in the fluid domain (the volume-weighted average strain rates are 149,593, 298,824, 449,414 and 588,012 (unit: s
−1) for cases of protrusion channel with CMC4000 at flow rate equaling 2 × 10
−5, 4 × 10
−5, 6 × 10
−5 and 8 × 10
−5 (unit: kg·s
−1), respectively), so this can cause lower dynamic viscosity in some flow regions, lower dynamic viscosity needs less pressure drop to drive the fluid to flow in the microchannel, and then cause the
f/
f0 is smaller than that of Newtonian fluid, the final result is
f/
f0 decreases with the increase of flow rate. This trend is more obvious in these cases of CMC4000 in all microchannel with different flow control structures, because of the lower power of the exponential function of the viscosity, as Equation (8) shows. In some other cases such as CMC500 and CMC2000 in V-grooved microchannels (
Figure 9), the value of
f/
f0 increases with the increase of flow rate, which is mainly due to the initial dynamic viscosity and shear-thinning behavior of CMC aqueous solutions (
Table 2) and separation flow induced by flow control structures on the walls. On the other hand, the flow control structure has great impact on the relationship between
f/
f0 and flow rate, which is because that the flow separations in microchannel with the four flow control structures are quite different. Moreover, the value of
f/
f0 decreases with the increase of the concentration of CMC solution firstly, after reach a minimum point, and then increases with the concentration, which means there is a minimum value of
f/
f0 when varying the concentration of the CMC aqueous solution, the concentration is 2000 ppm in all the cases of different flow rate and different flow control structures in this research.
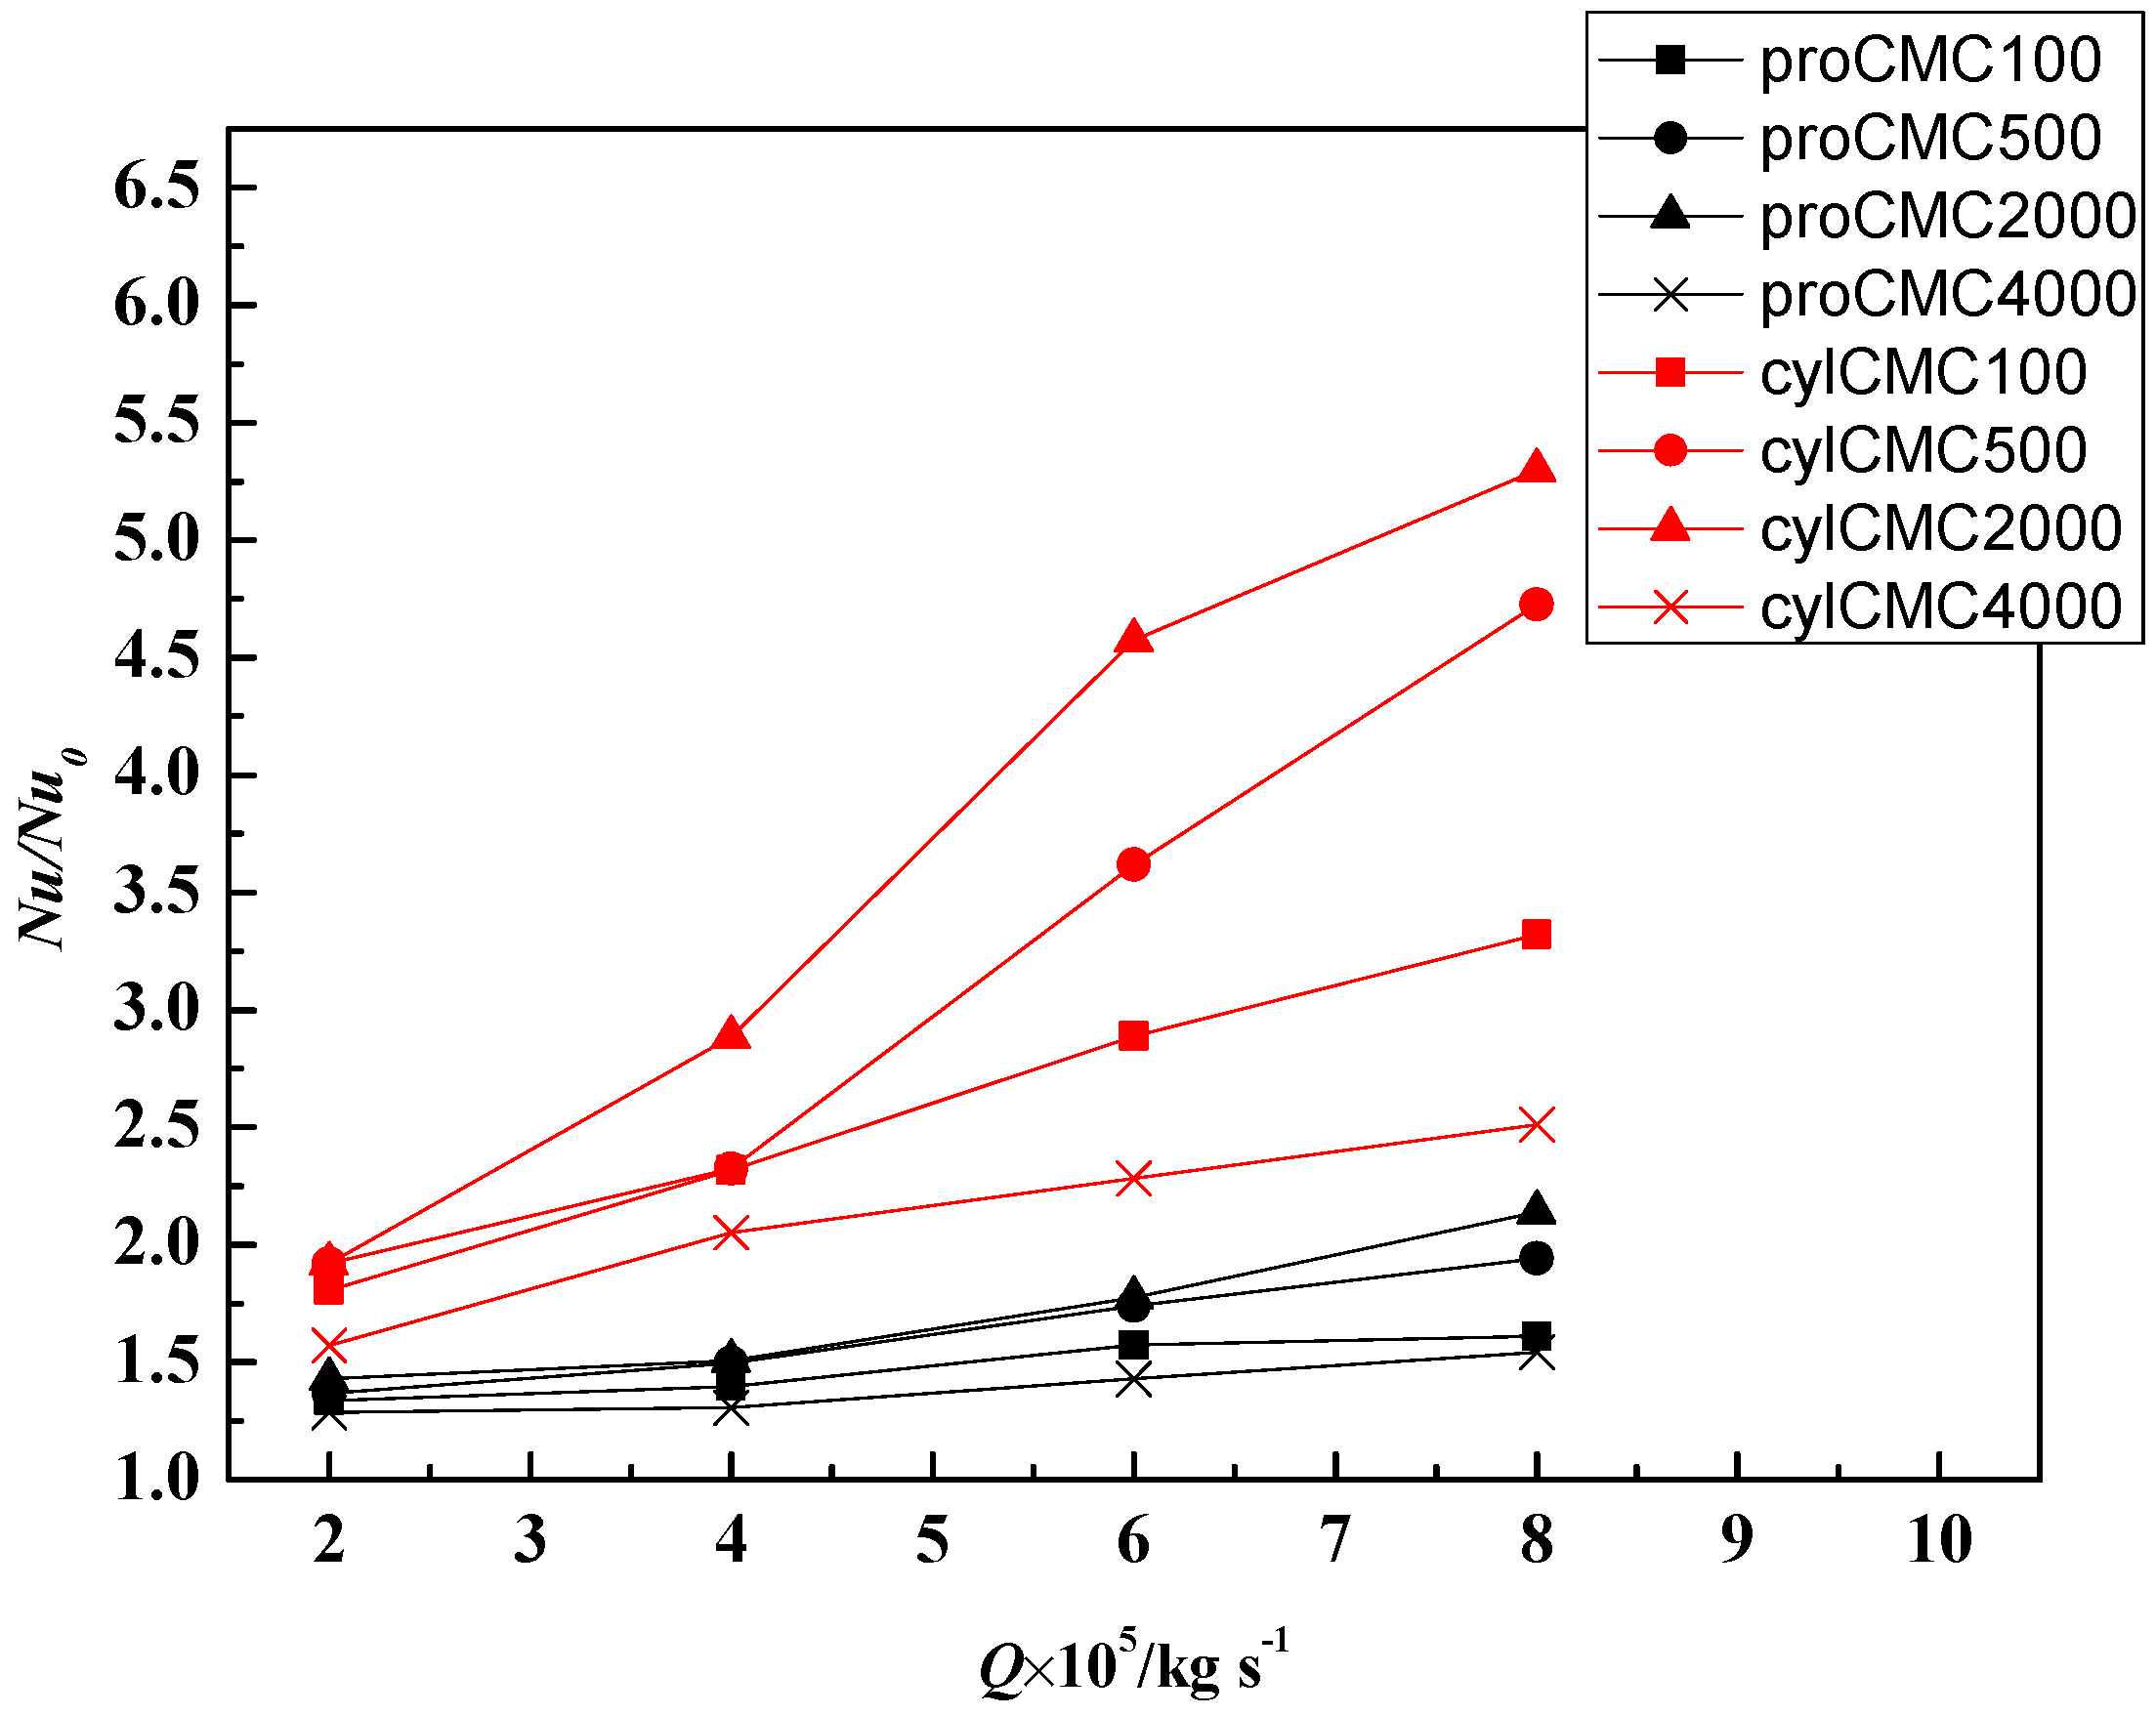
The heat transfer performance can be reasonably analyzed by means of Nusselt number. The value of
Nu/
Nu0 is obtained and showed in
Figure 10 and
Figure 11, in which
Nu0 is the Nusselt number of smooth rectangular microchannel with water as working substance.
Nu/
Nu0 continuously increases with the increases of flow rate. The microchannel with protrusion has the minimum value of
Nu/
Nu0 in the four flow control structures. What’s more,
Nu/
Nu0 increases as CMC concentration increases from 100 ppm to 2000 ppm, which is because of the more intense separation flow caused by the more obvious shear-thinning effect. As CMC concentration further increases to 4000 ppm, larger dynamic viscosity fluid forms thicker thermal boundary layer, then streamlines just curves at most cases in protruded microchannels, at last, a minimum value is obtained at the CMC concentration equaling 4000 ppm, so the minimum
Nu/
Nu0 are reached in the case of proCMC4000 at
Q = 2 × 10
−5 kg·s
−1 (
Figure 10), which is slightly different from that of the case vgrCMC4000 at
Q = 2 × 10
−5 kg·s
−1 (
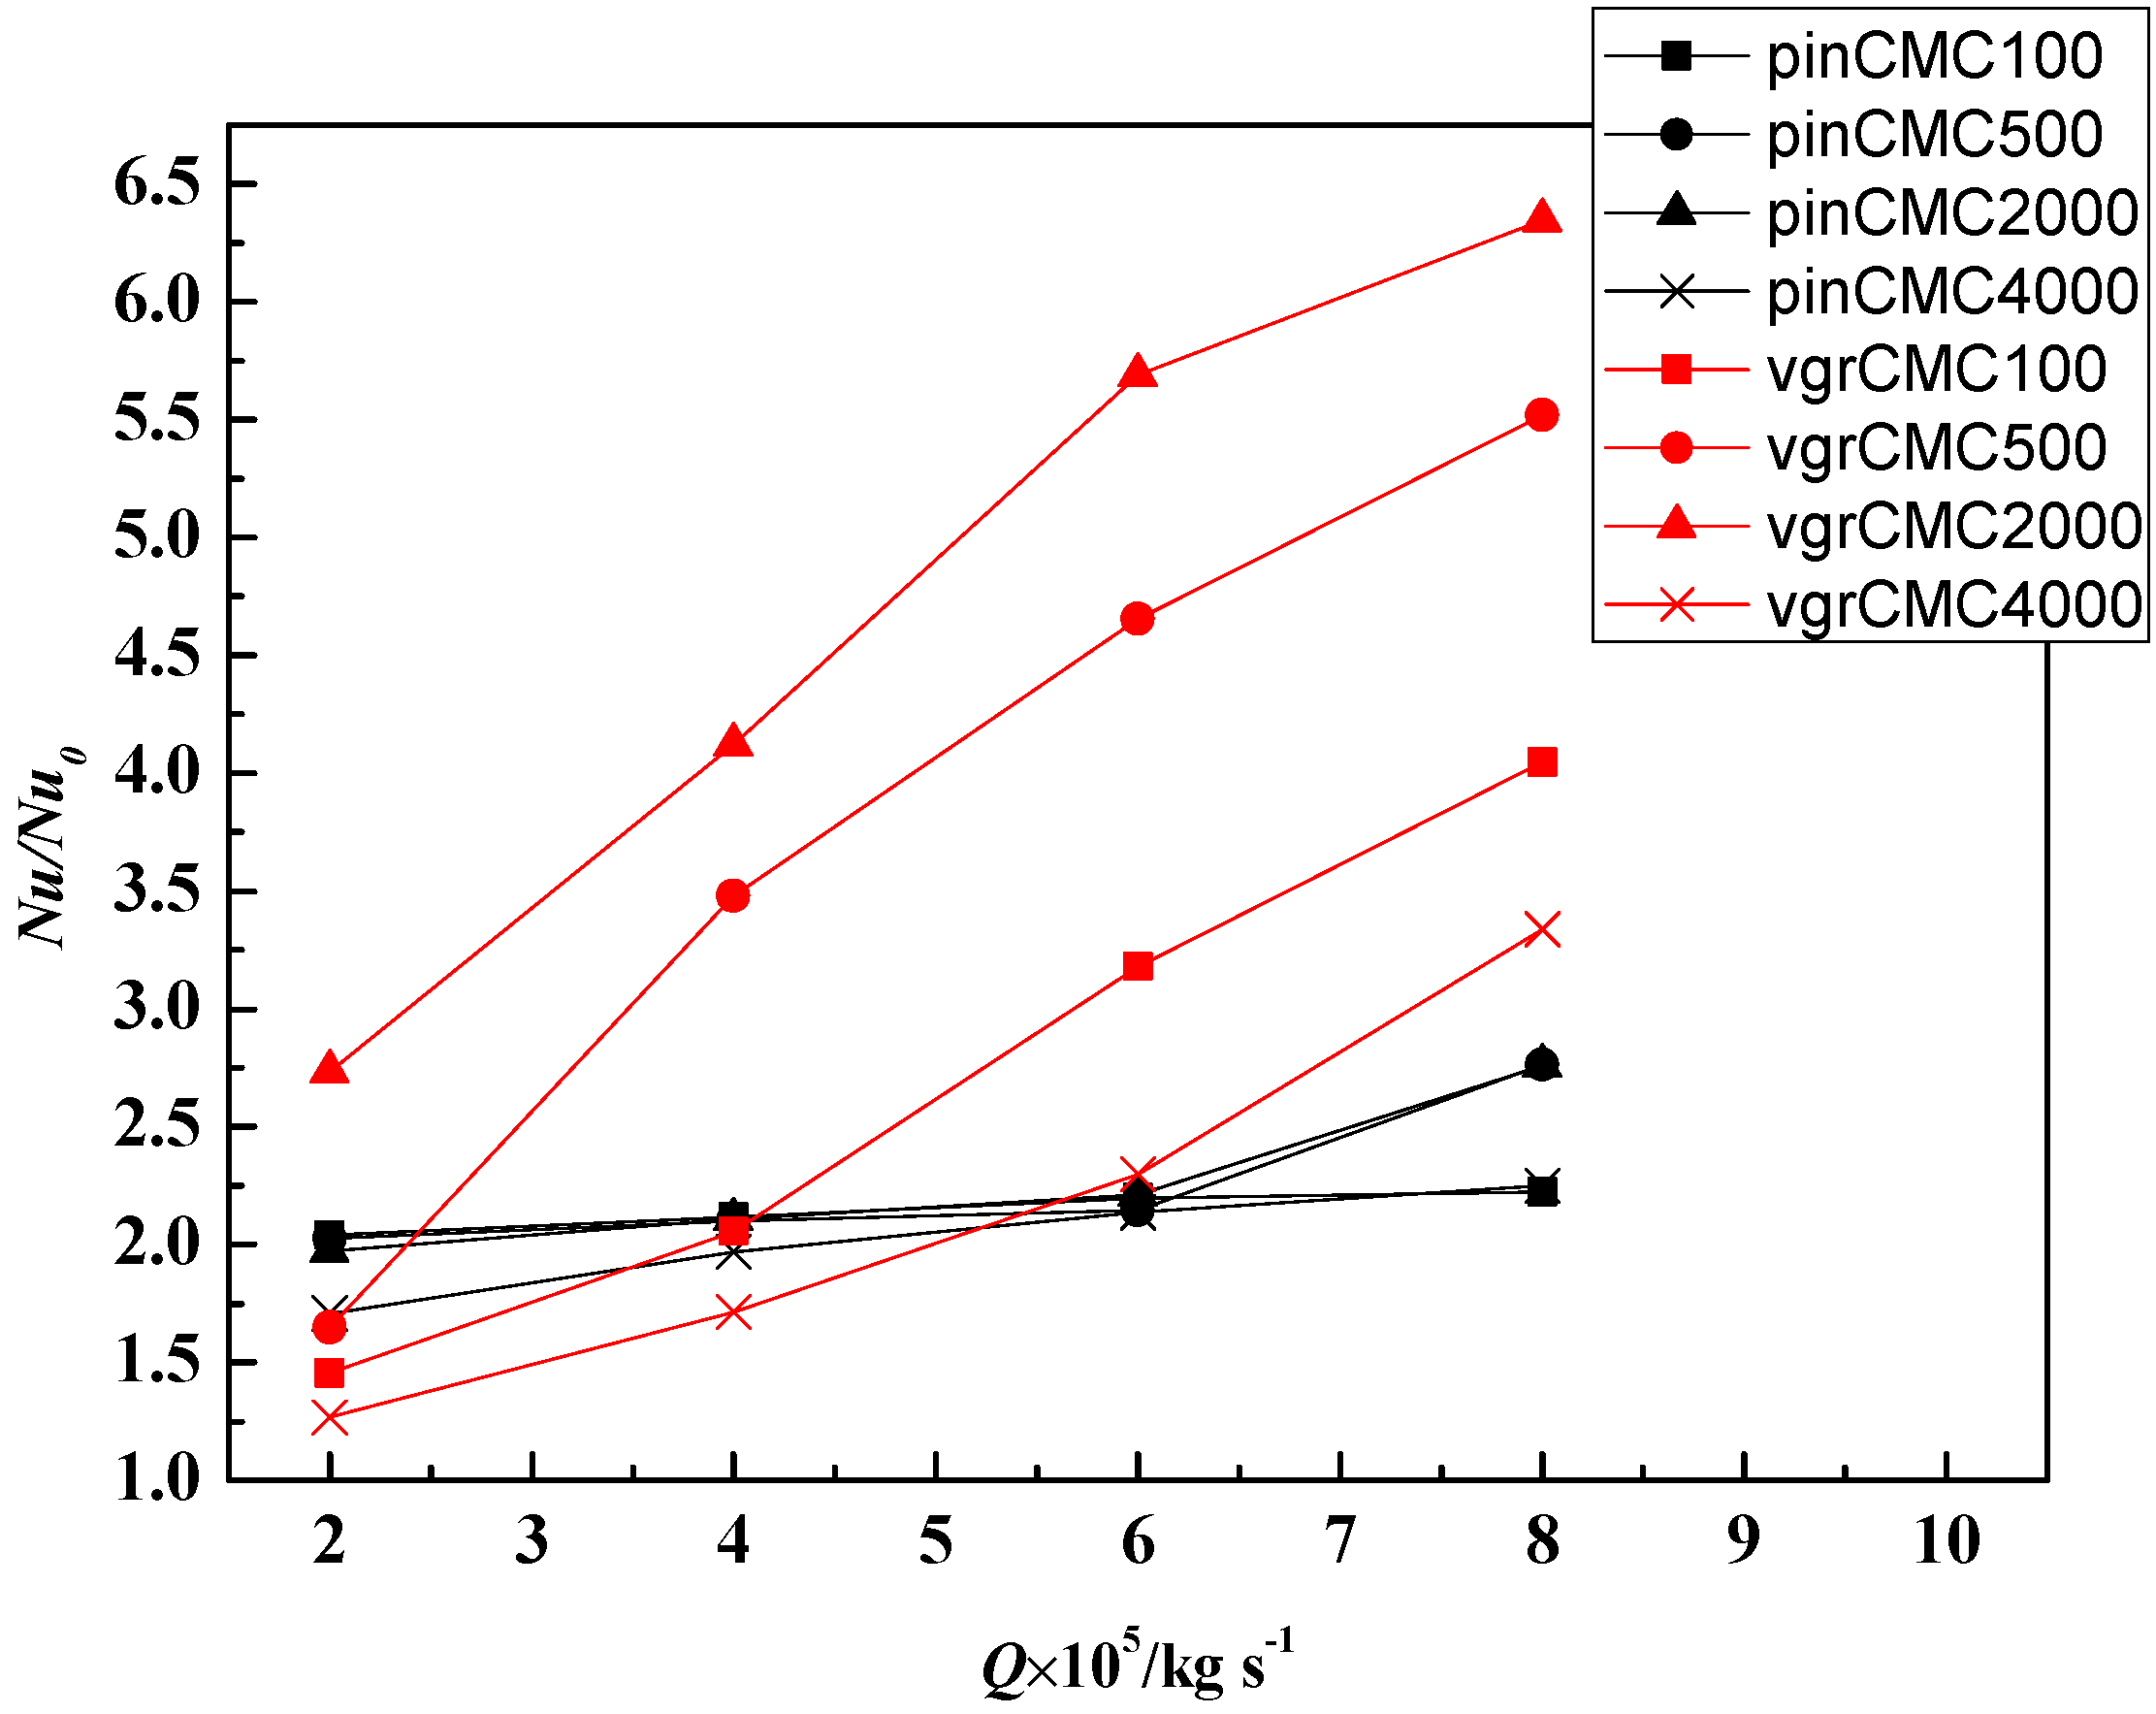
Figure 11). Moreover, in the cases of CMC500, the
Nu/
Nu0 of V-groove microchannel at
Q = 2 × 10
−5 kg·s
−1 is much lower than the other cases, which is because no separation bubble forms in the flow domain and the heat quantity transferred in span-wise direction and flow direction are both very small, while in the other cases, such as in the cylinder-rib microchannel, flow separation bubbles are more easily to form because the greater sudden change of structured wall, so the heat transfer is enhanced, and in the pin-fin microchannel, the heat transferred in both the span-wise direction and flow direction is larger. The variation of
Nu/
Nu0 is decided by the CMC concentration, flow rate and flow control structure. For cases in
Figure 3a–c,
Nu/
Nu0 is enlarged by separation flow due to the enhanced heat transfer between near-wall fluid and main fluid, while the last case in
Figure 3 has no separation flow observed in the domain, and the structure of thermal boundary is not destroyed, which results in a small temperature gradient on the protruded wall, then the
Nu/
Nu0 is smallest in the four cases.
What’s more, it can be easily found that the
Nu/
Nu0 increases more quickly with the increases of flow rate in V-grooved channel than that in pin-finned and protruded channels, so it can be predicted that in lower flow rate cases, pin-fin and protrusion should have better heat transfer characteristics, which can also be seen from the thermal performance
TP from the following context. Moreover, cylinder-ribbed and V-grooved microchannel has larger
Nu/
Nu0 in large flow rate confirms the conclusion in Li’s research [
21] that the microchannels with cylinder and V-groove have better heat transfer performance compared with the protruded microchannel, especially at larger Re cases.
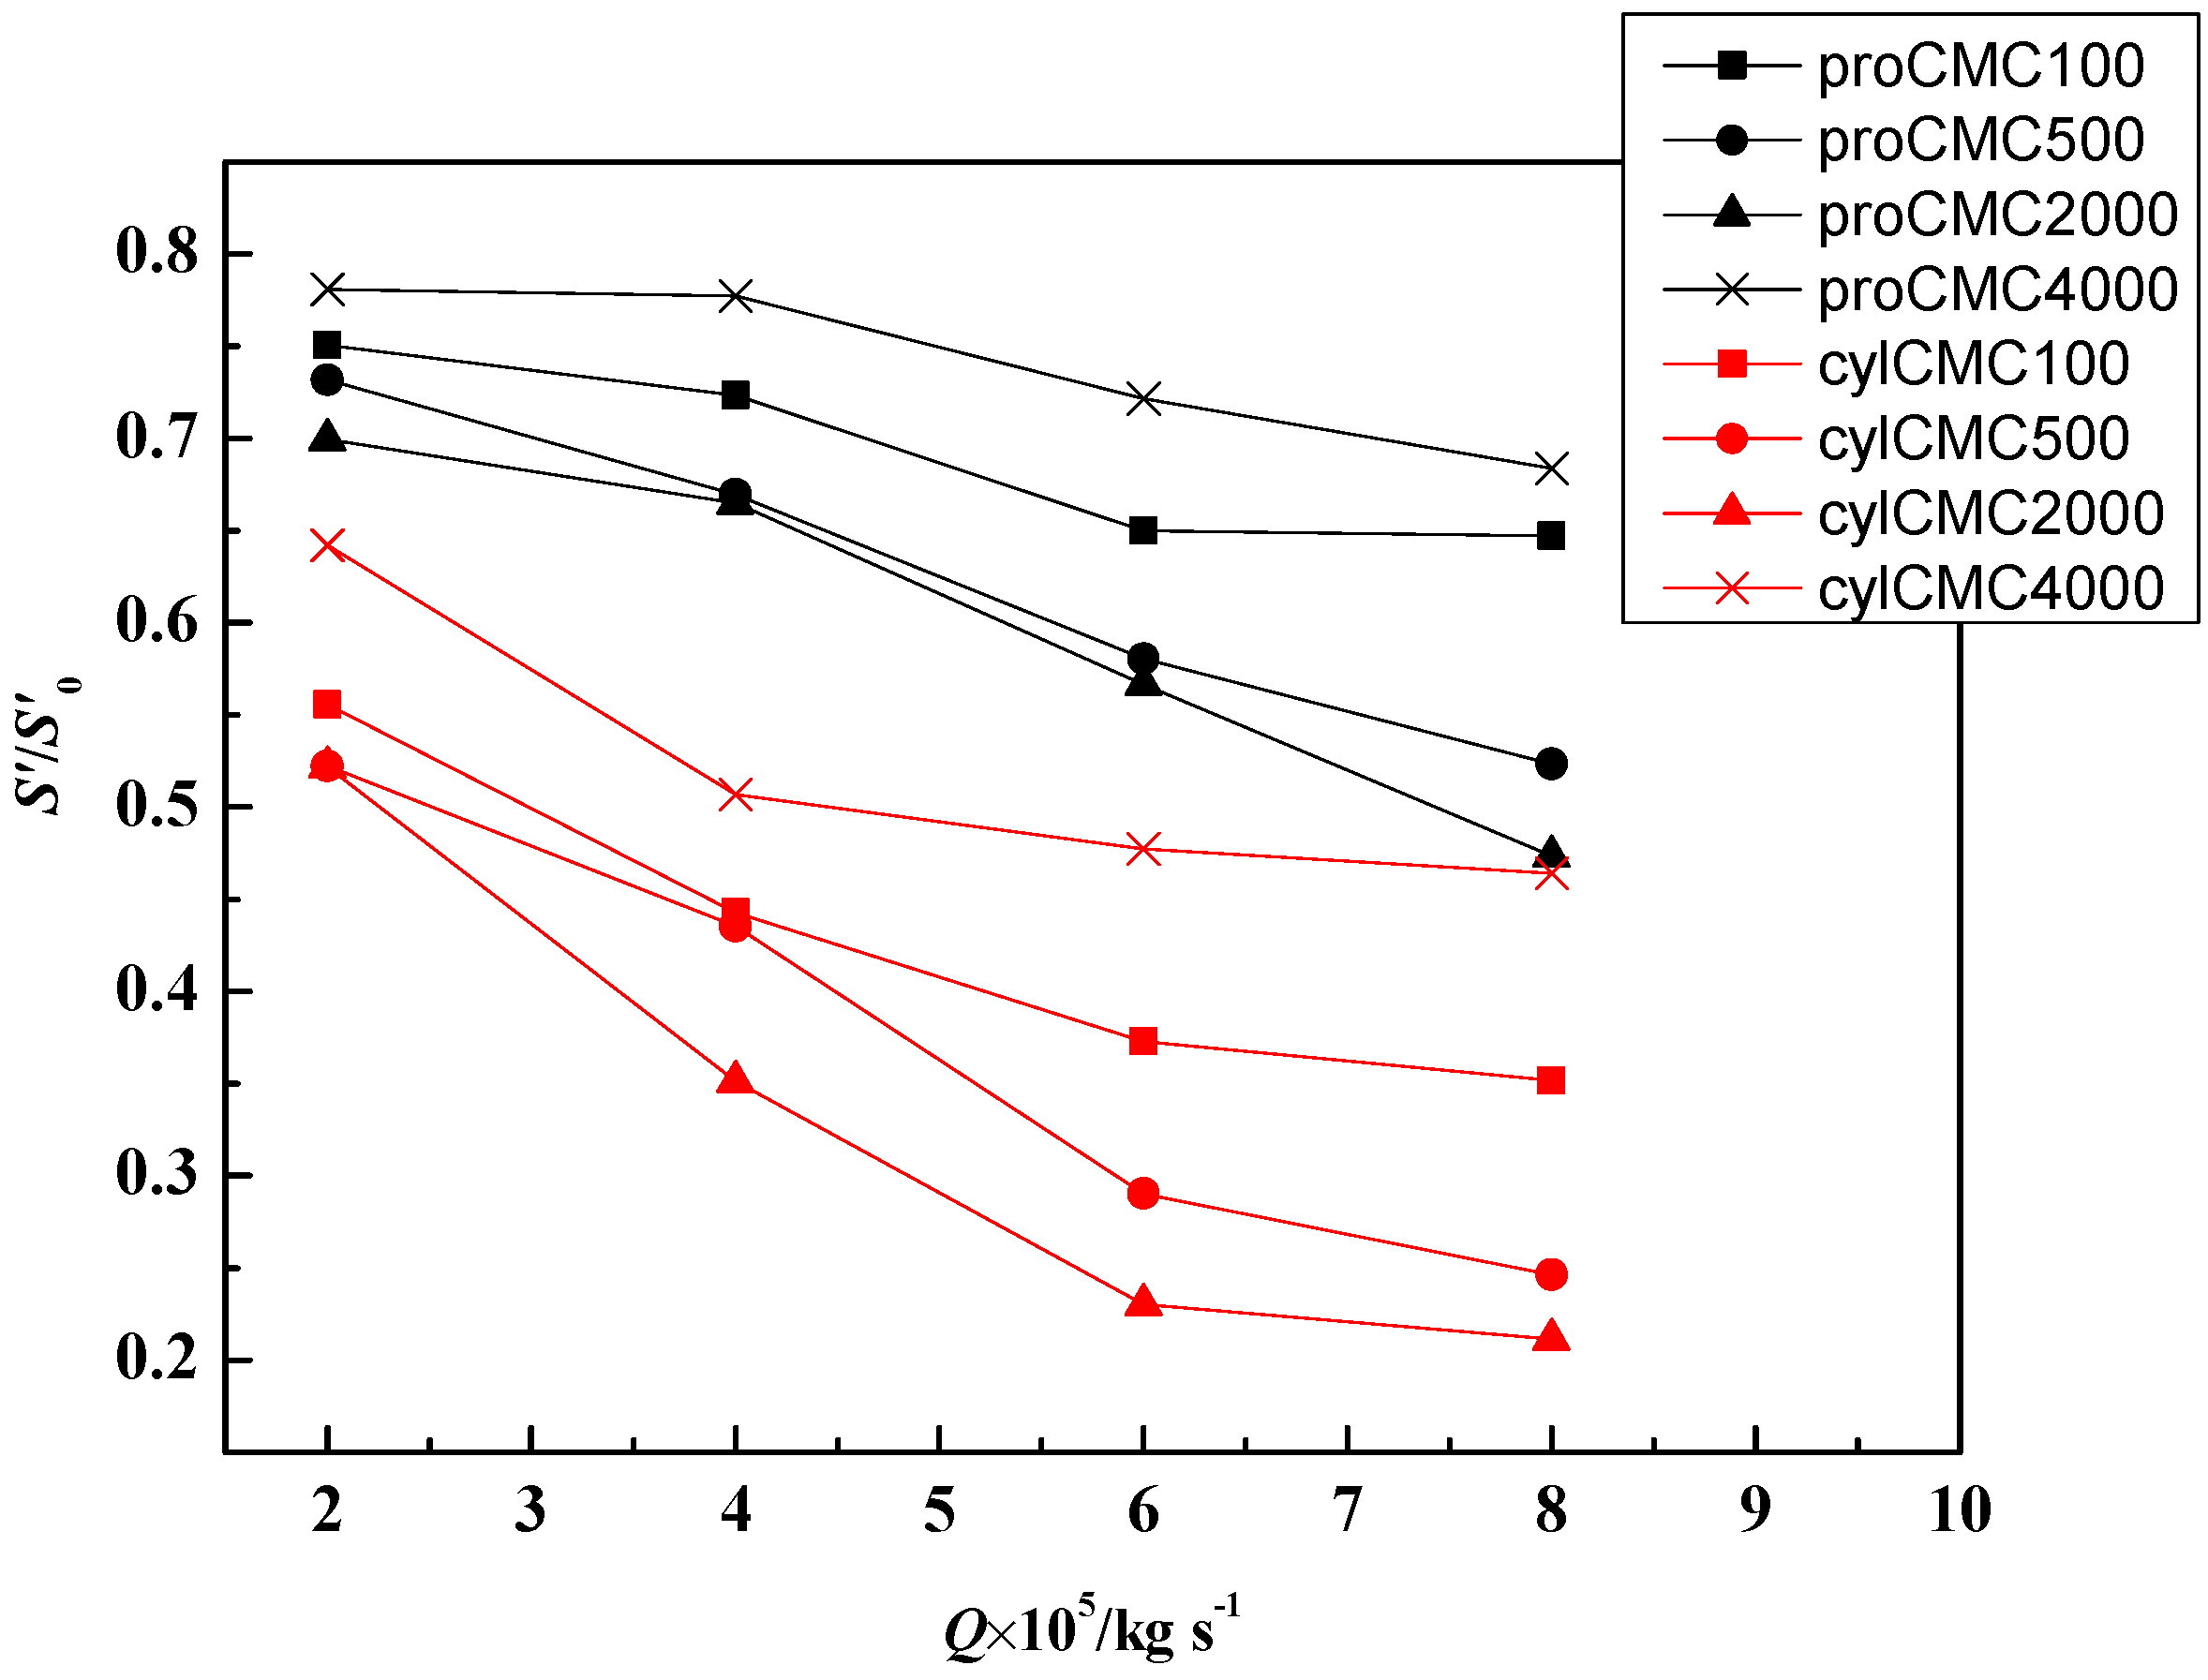
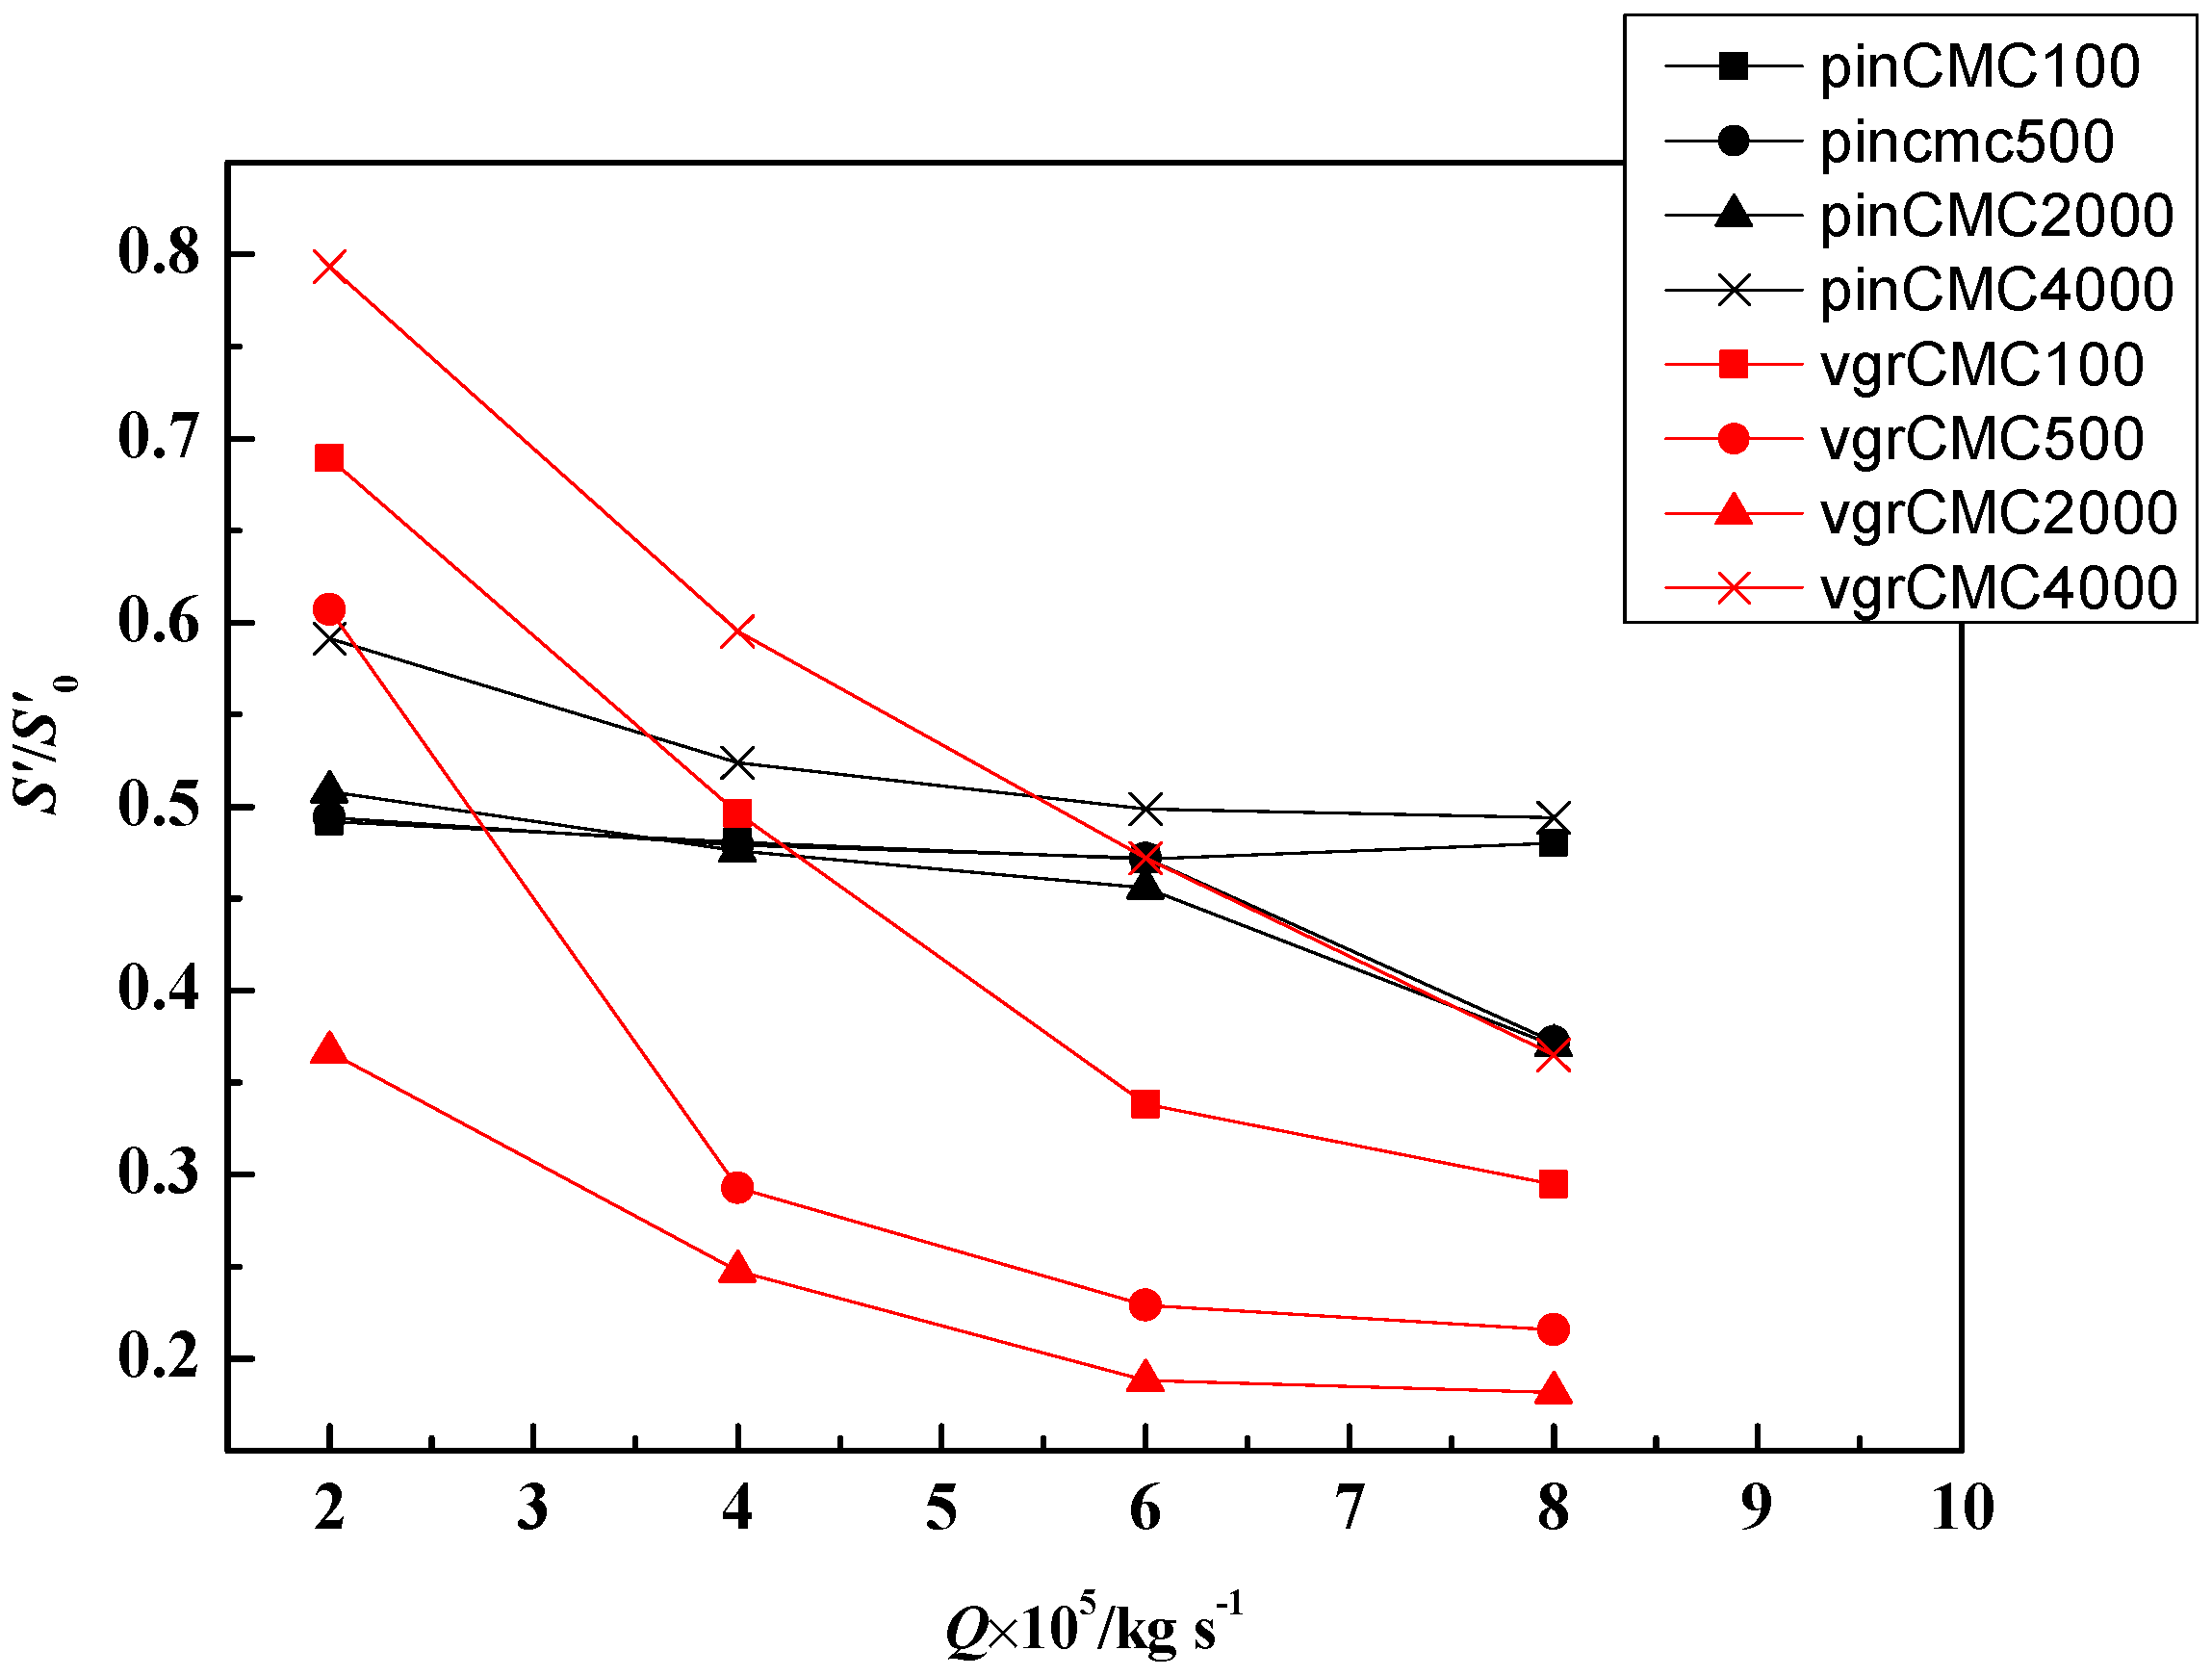
Figure 12 and
Figure 13 show the variation of relative entropy generation of the structured microchannel based on the Equation (17) which are normalized similar as the above parameters. It can be seen that
S’/
S0’ decreases with the increase of the flow rate in all the cases. While in the pin-finned microchannels, the decreasing trend is not obvious as in the other microchannels, which is mainly because that entropy generation contributed by Nusselt number is much larger than the friction factor in these cases, especially at low flow rates. The ratio of
SF’/
ST’ is smaller than 0.121 in all the pin-finned cases, and its average value is 0.046 in all the cases. Therefore, the entropy generation is dominant by the part of Nusselt number and slightly influenced by friction factor. In low flow rate,
S’/
S0’ are relatively large in pin-finned microchannel compared with other cases. Protruded microchannel always has large
S’/
S0’ because of the poor heat transfer performance. The smallest
S’/
S0’ is reached in the V-grooved microchannel at CMC2000, so V-grooved microchannel at CMC2000 has favorable entropy generation performance, which is consistent with the result of
TP that are showed below.
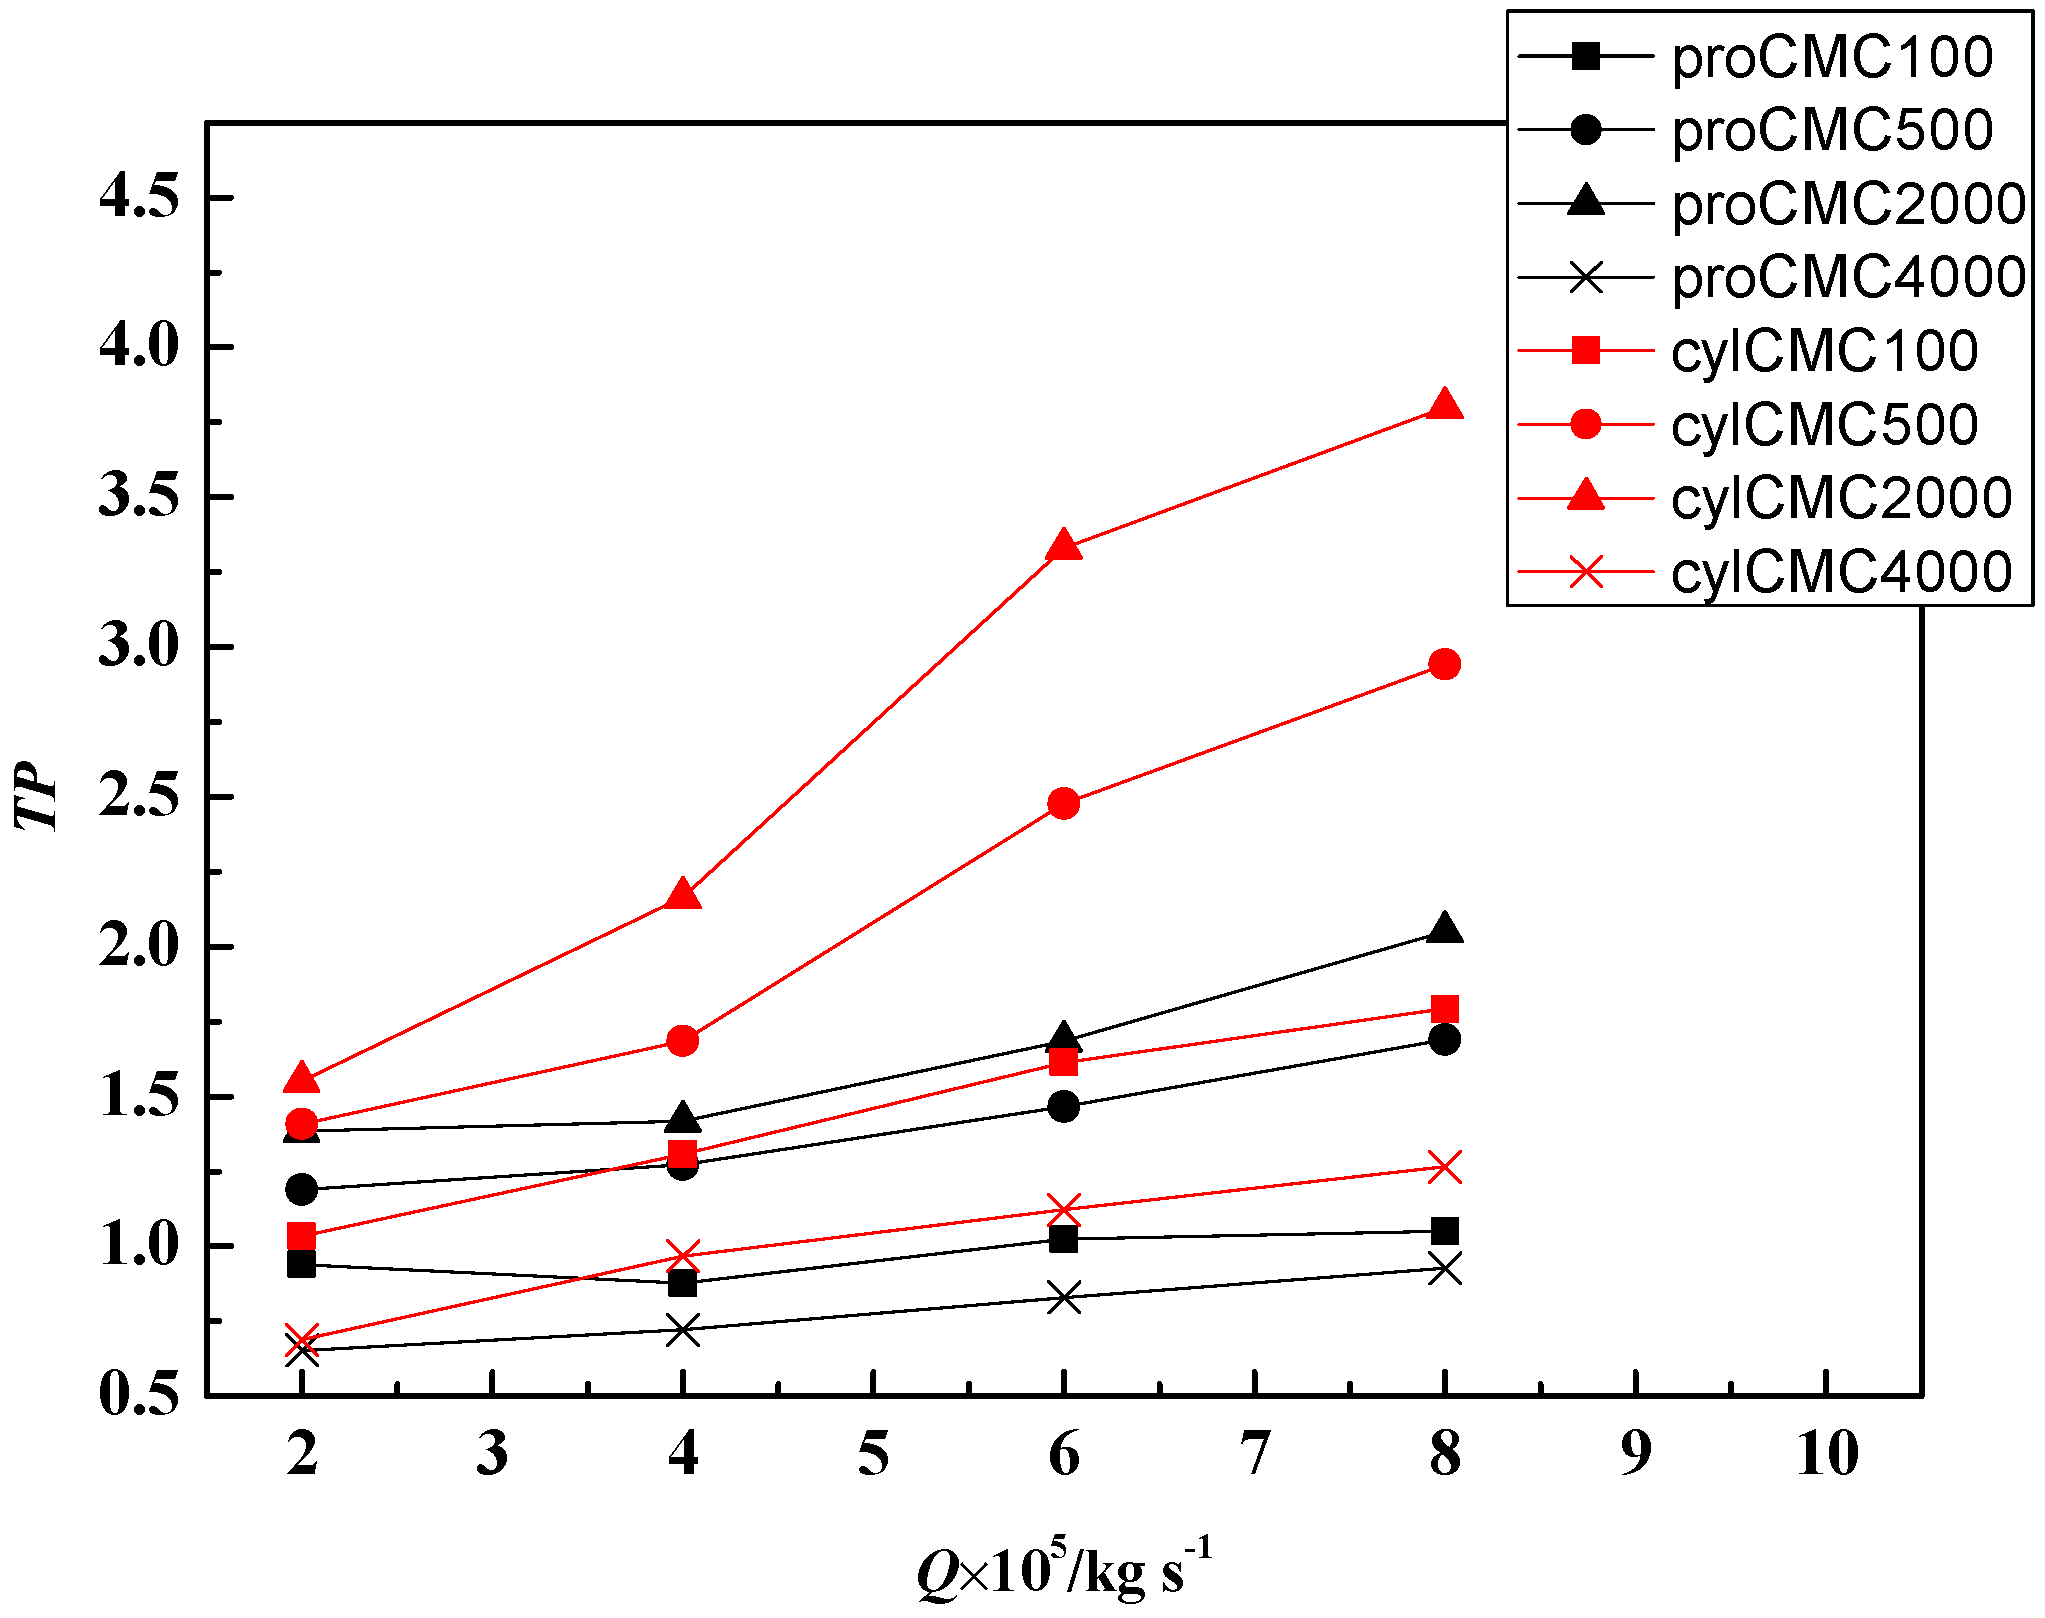
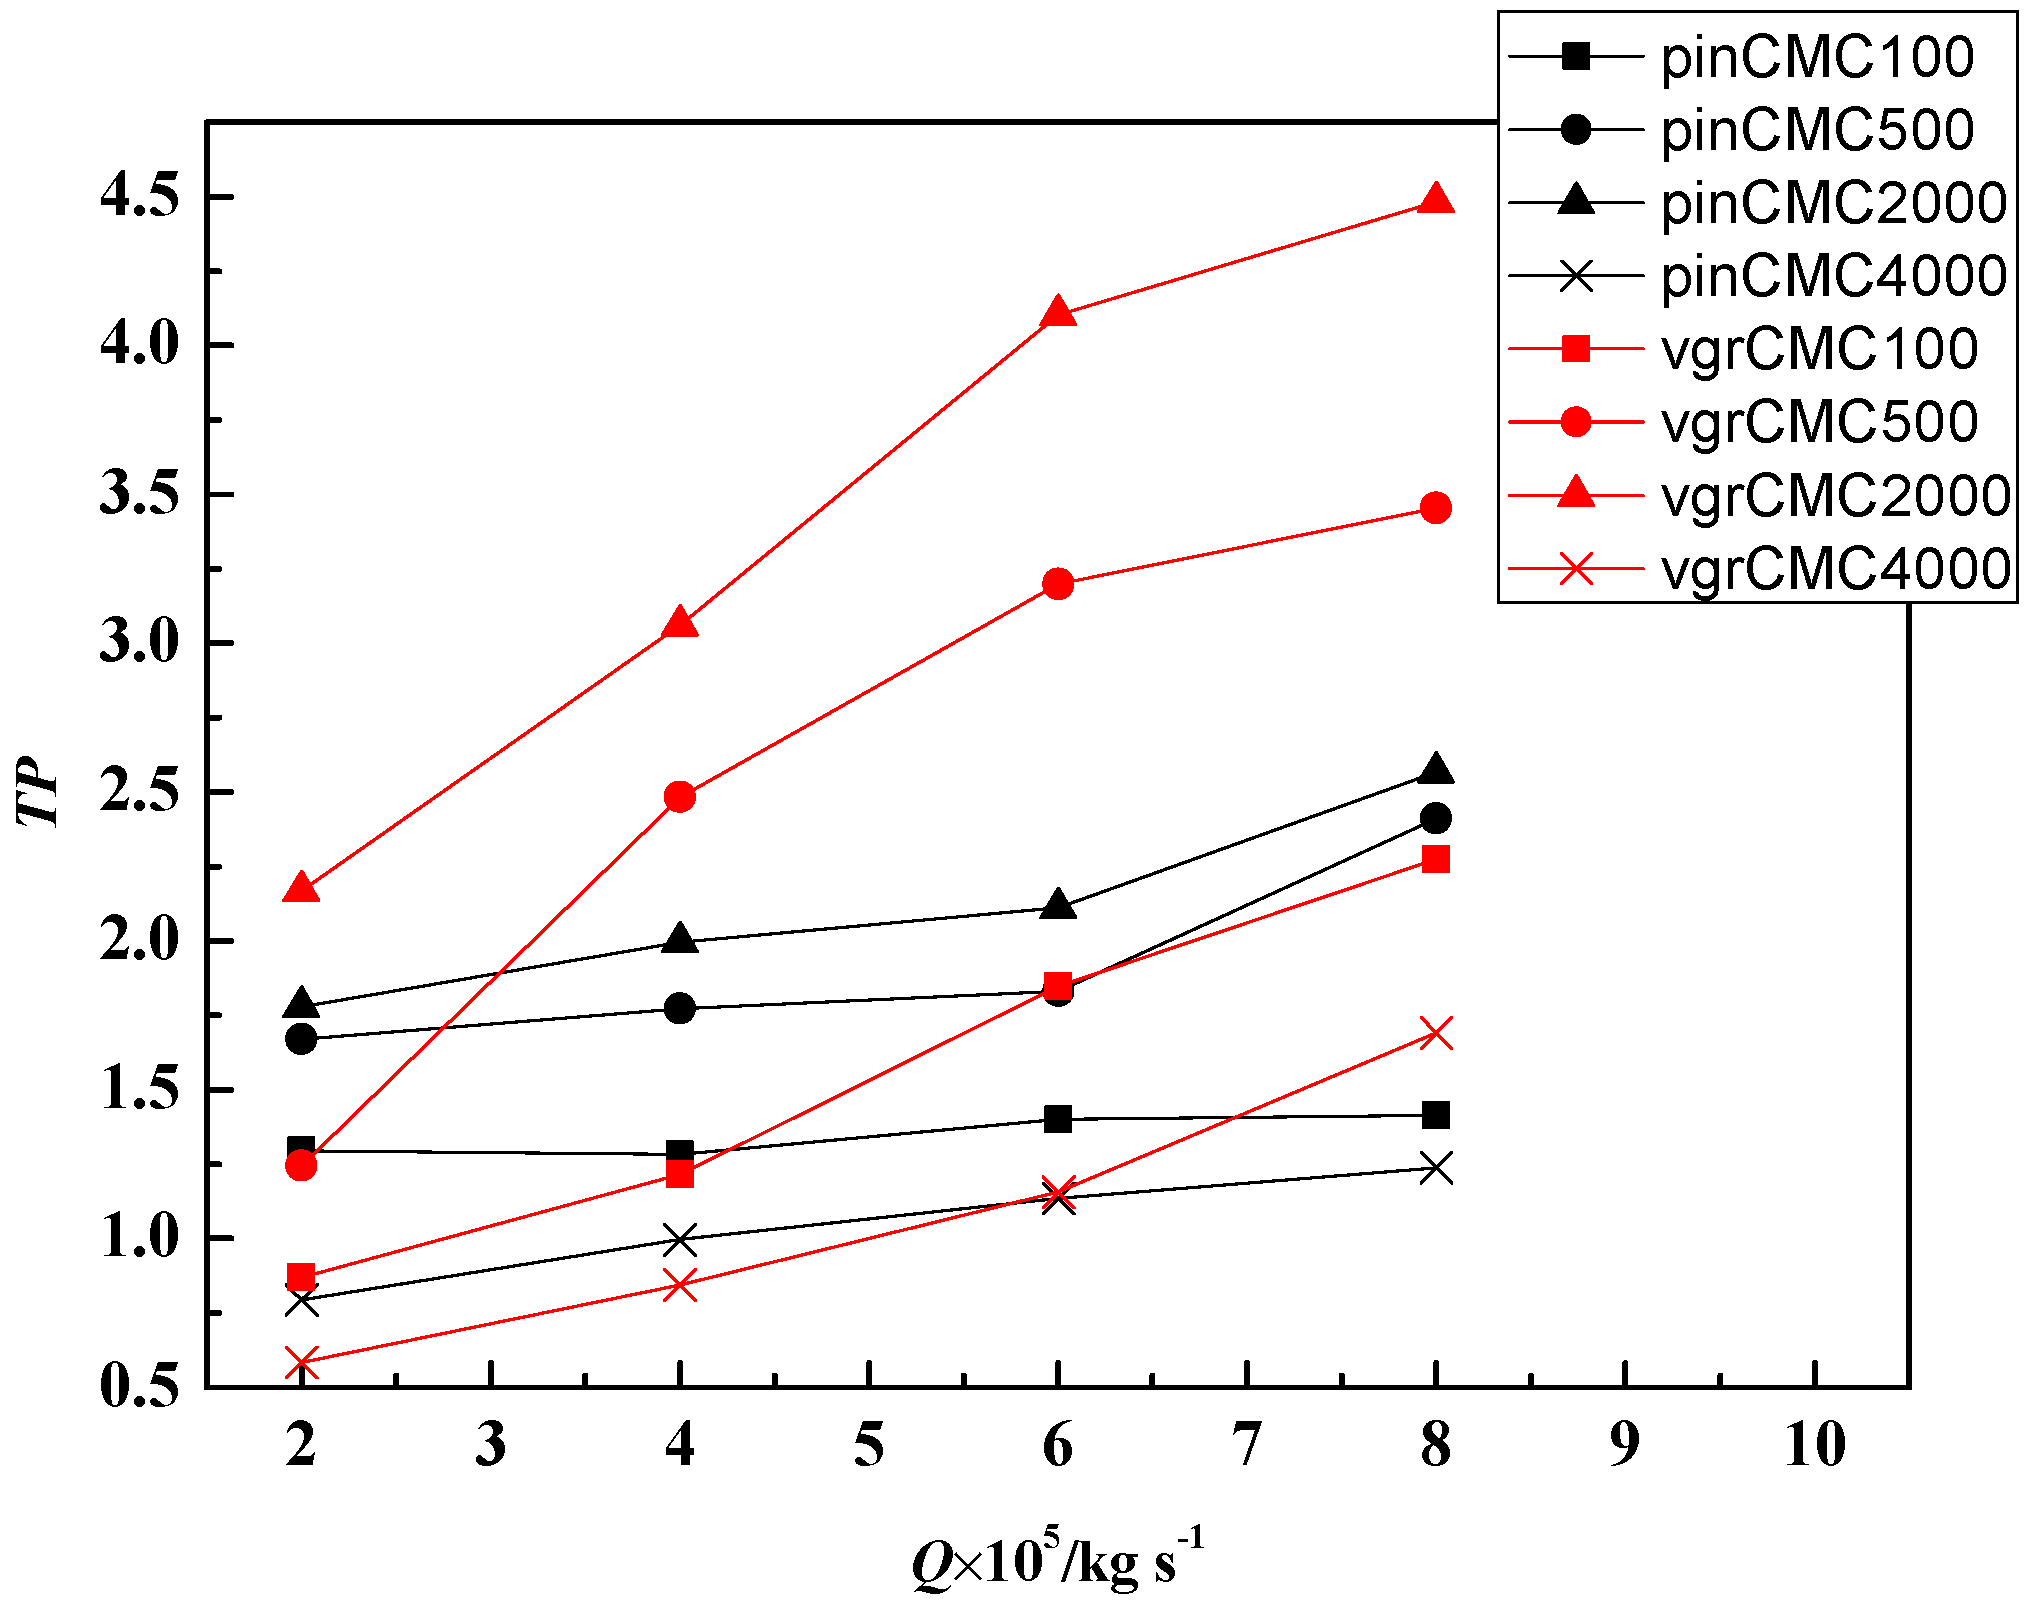
The whole thermal performance
TP considers both the heat transfer and friction resistance, which is described as:
The variation of
TP for different cases is shown in
Figure 14 and
Figure 15.
TP has a similar trend with
Nu/
Nu0 when flow rate and CMC concentration increases. In cases of vgrCMC500 (
Figure 15),
TP grows faster when flow rate increases from 2 × 10
−5 kg·s
−1 to 4 × 10
−5 kg·s
−1, which is because not only the vortices become more intense, but also more complex flow vortices are generated in the flow domain, when the flow rate further increases to 8 × 10
−5 kg·s
−1, the structure of the vortices keep the same but only become more intense. In cases of cylCMC500 and cylCMC2000 (
Figure 14), this change delayed and comes when flow rate increases from 4 × 10
−5 kg·s
−1 to 6 × 10
−5 kg·s
−1. Similar to this, the
TP in cases of vgrCMC2000 and cylCMC2000 increases more slowly when the flow rate increases from 6 × 10
−5 kg·s
−1 to 8 × 10
−5 kg·s
−1, which is because no more vortex forms in the flow domain but only the existing vortices become more intense.
It should be noted that TP in the microchannel with cylinder-rib and V-groove increases faster than that in the other two microchannels, because the flow vortices in the pin-finned and protruded microchannel is small and the section area in the stream-wise direction are not changed so large as the cylinder-rib and V-groove channel, which can cause much larger vortices in the fluid domain that almost fully fill the span-wise direction. In the cases of flow rate smaller than or equals to 2 × 10⁻⁵ kg/s, pin-finned microchannel has the largest TP and is the best flow control structures in the four microchannels. The largest TP is reached in V-grooved microchannel at CMC2000 and the smallest is in protruded microchannel at CMC4000 when flow rate is larger than 2 × 10⁻⁵ kg·s−1. But considering the cost and benefit, the f/f0 and Nu/Nu0 are larger at some cases, resulting in a relative larger TP, however, which are not suitable for practical applications with limited pressure drops between inlet and outlet, so the selection of working conditions should also consider the practical conditions.


