
Detection of Left-Sided and Right-Sided Hearing Loss via Fractional Fourier Transform


Abstract
:1. Introduction
2. Materials
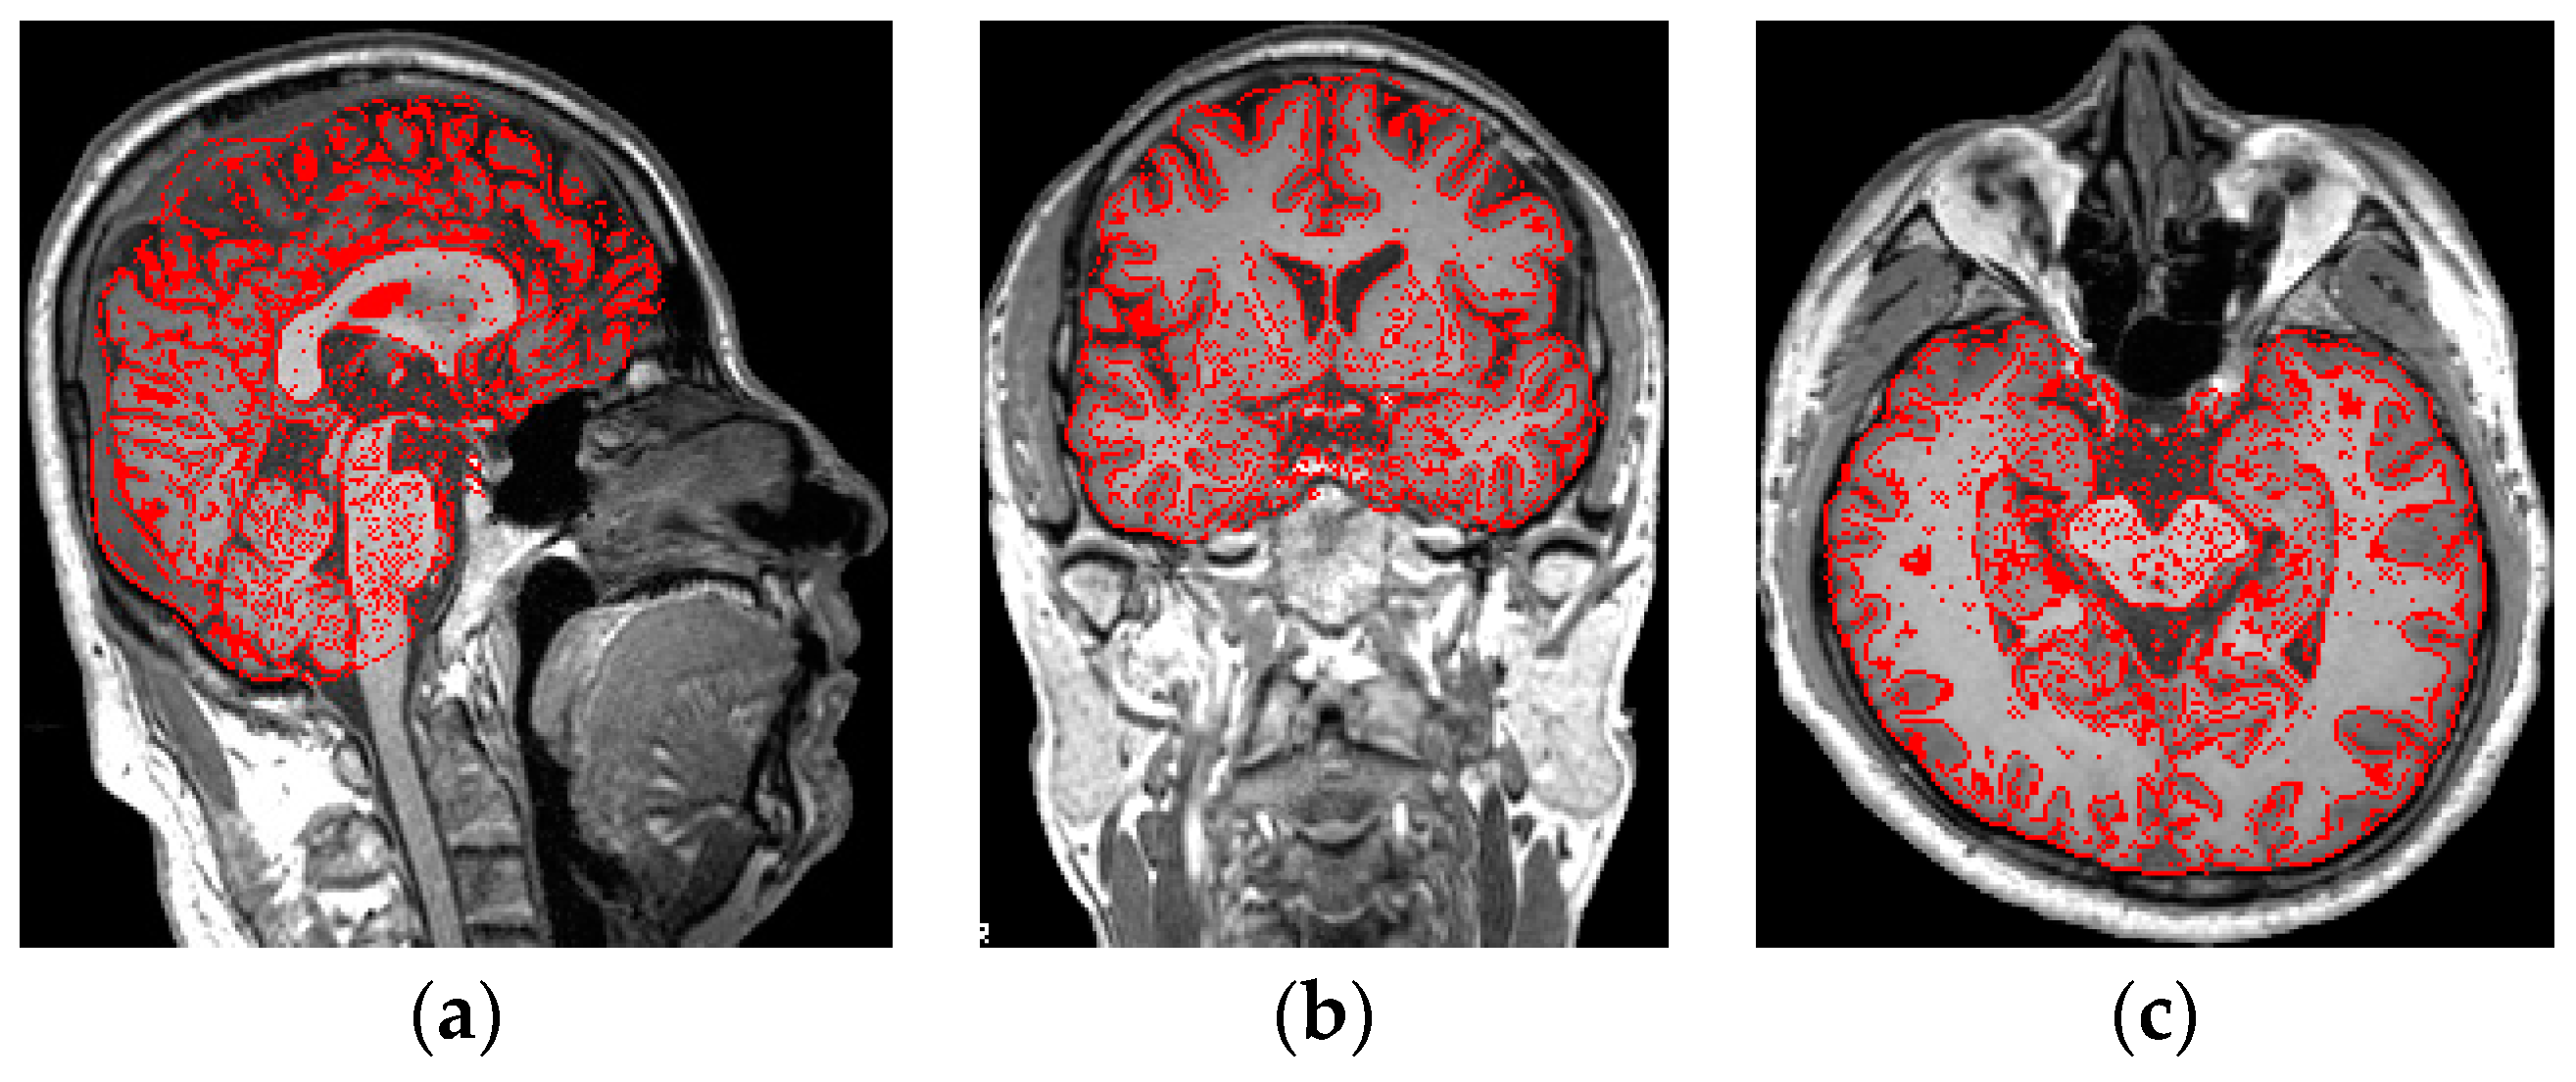
3. Preprocessing
4. Methodology
5. Results and Discussion
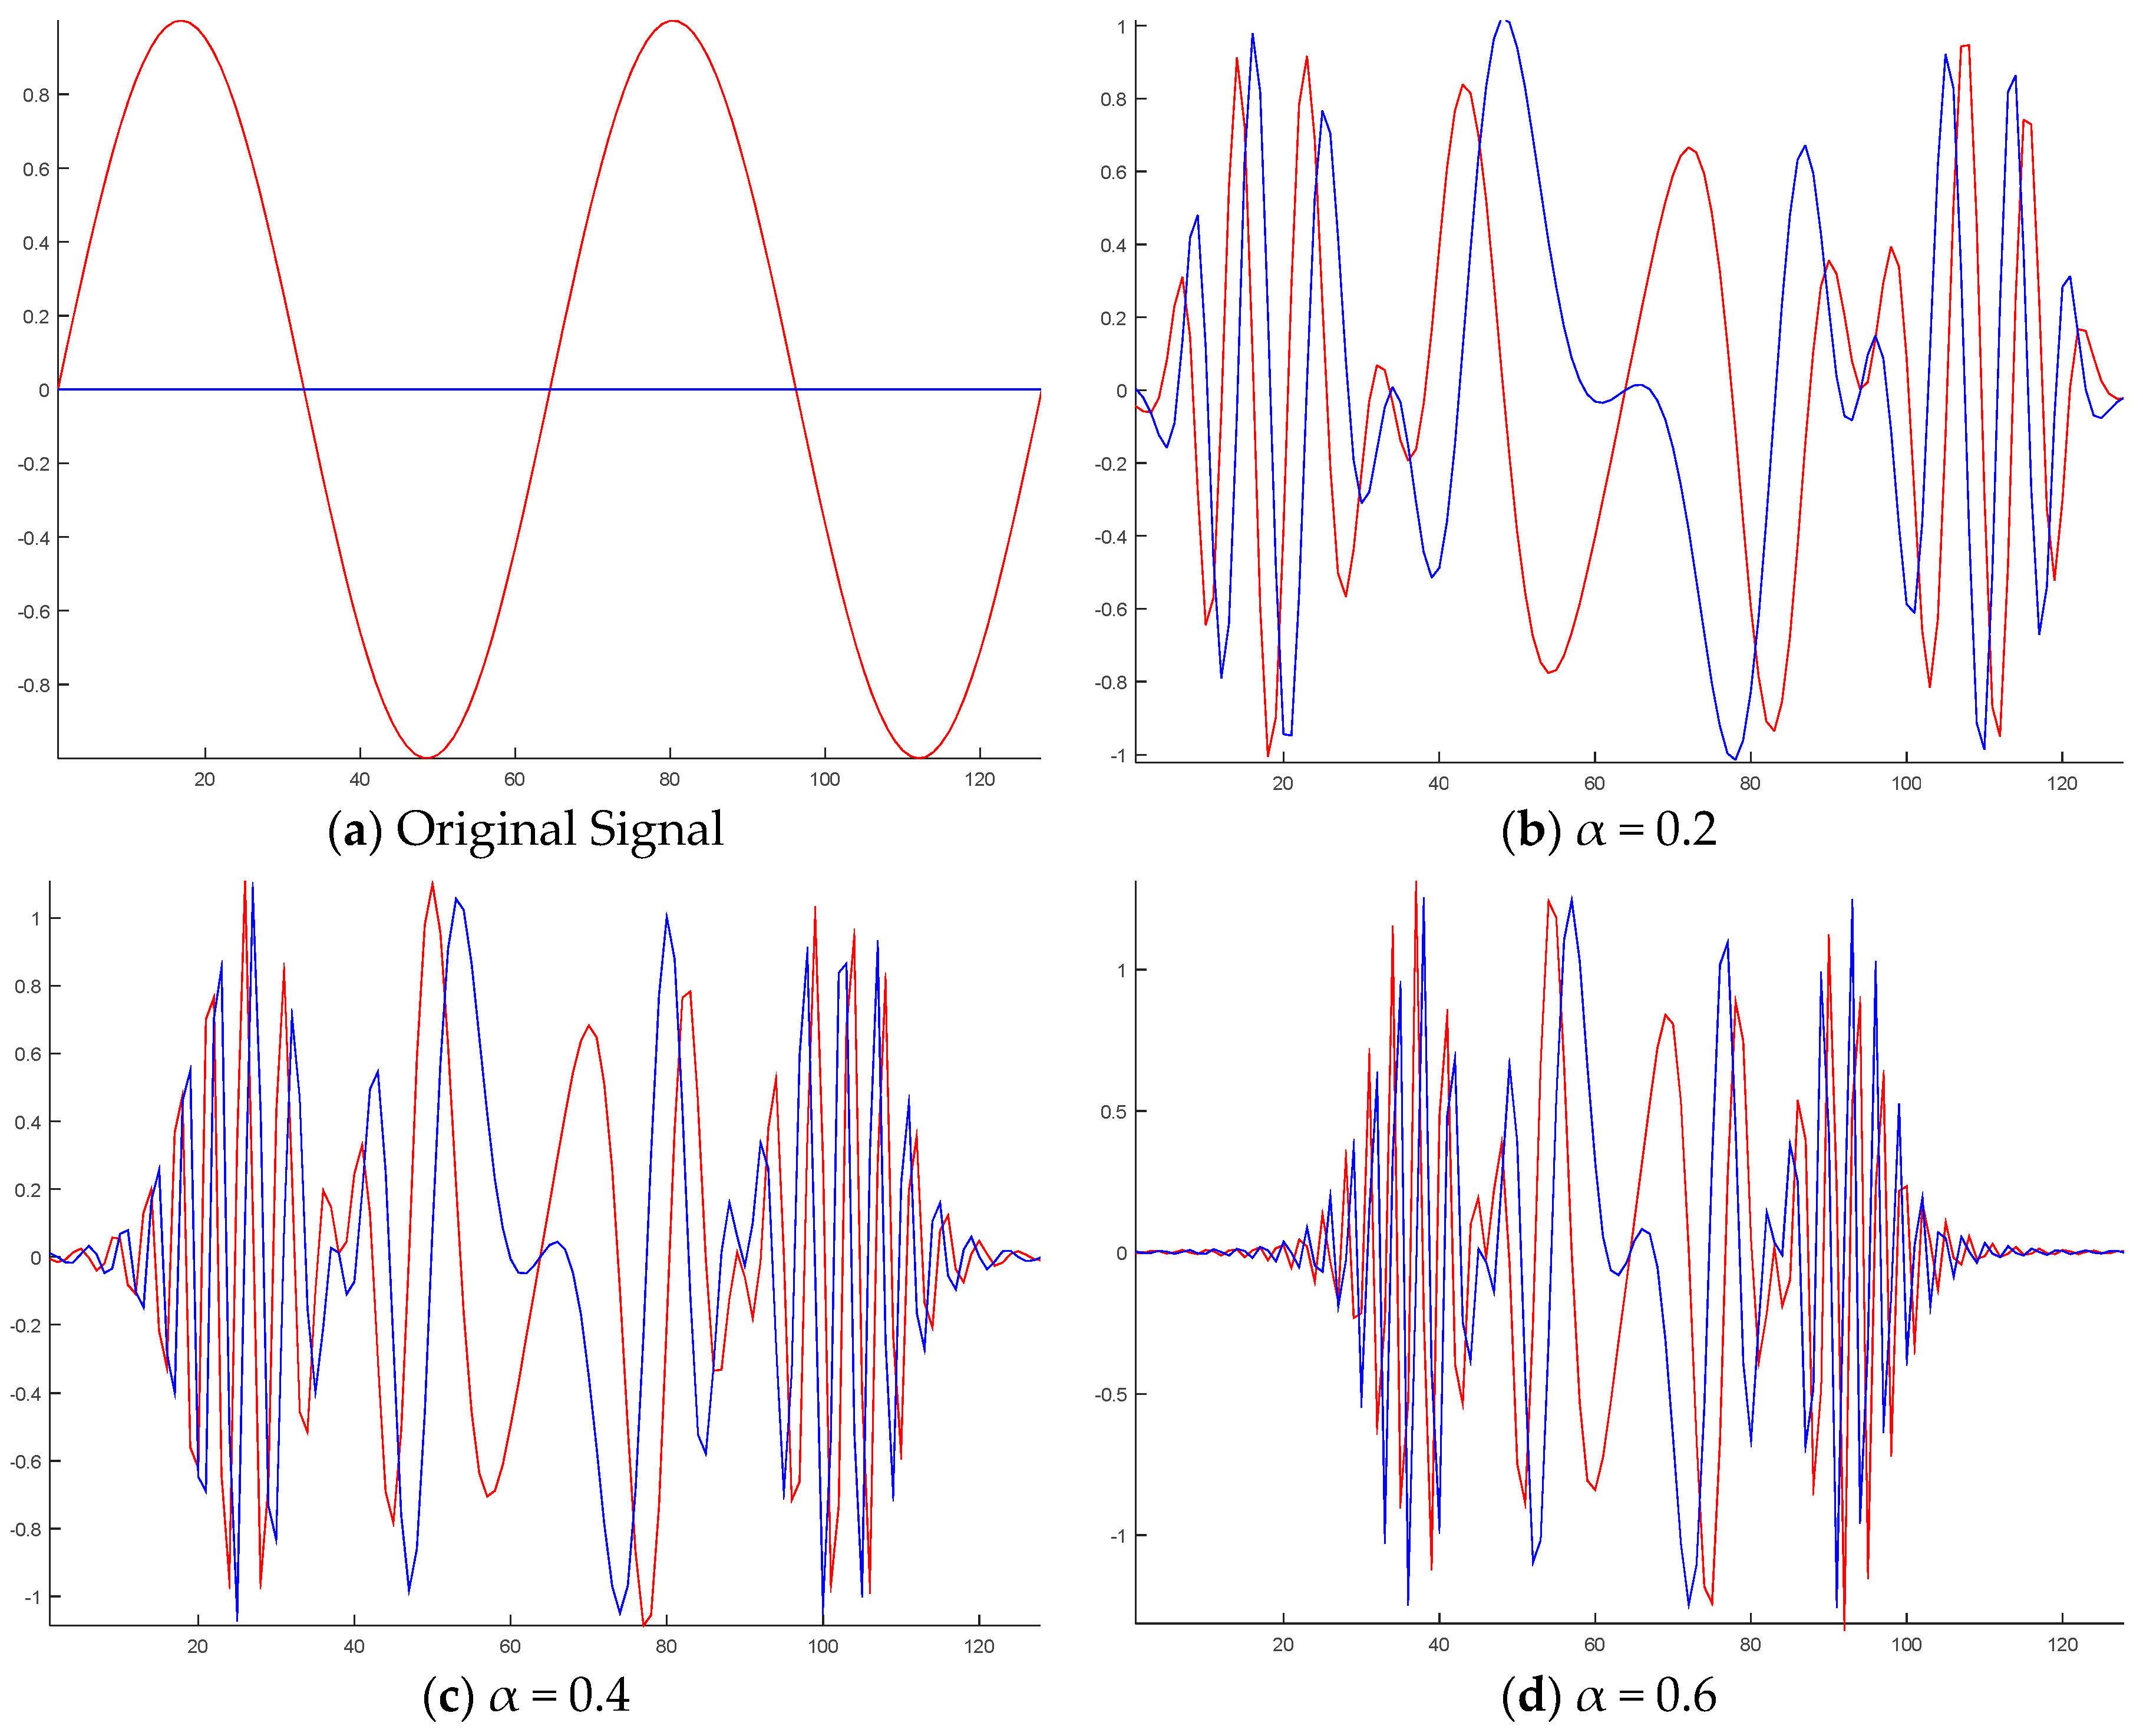
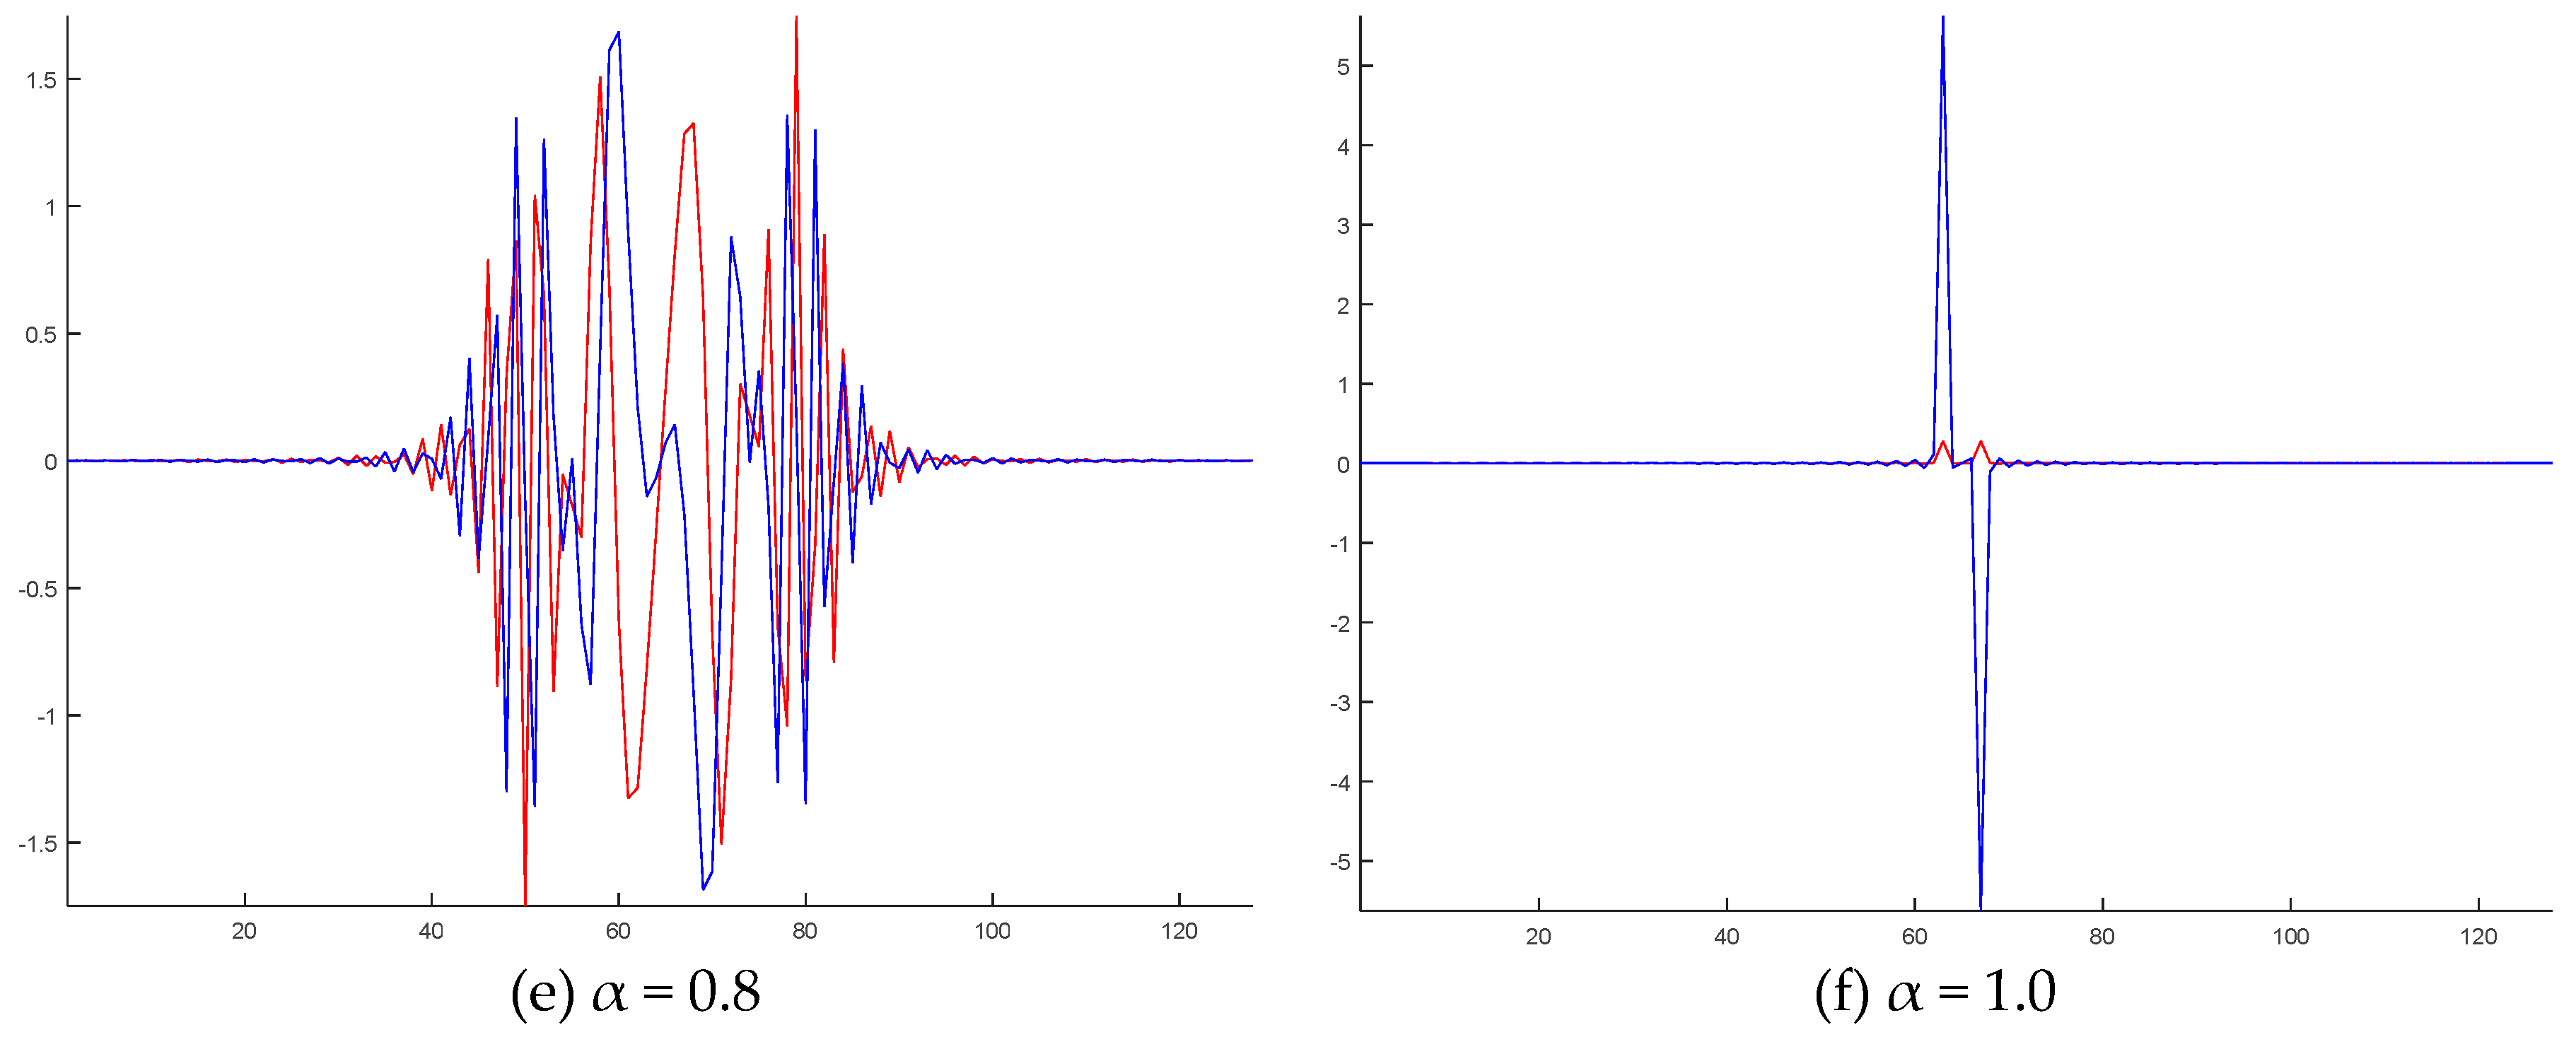
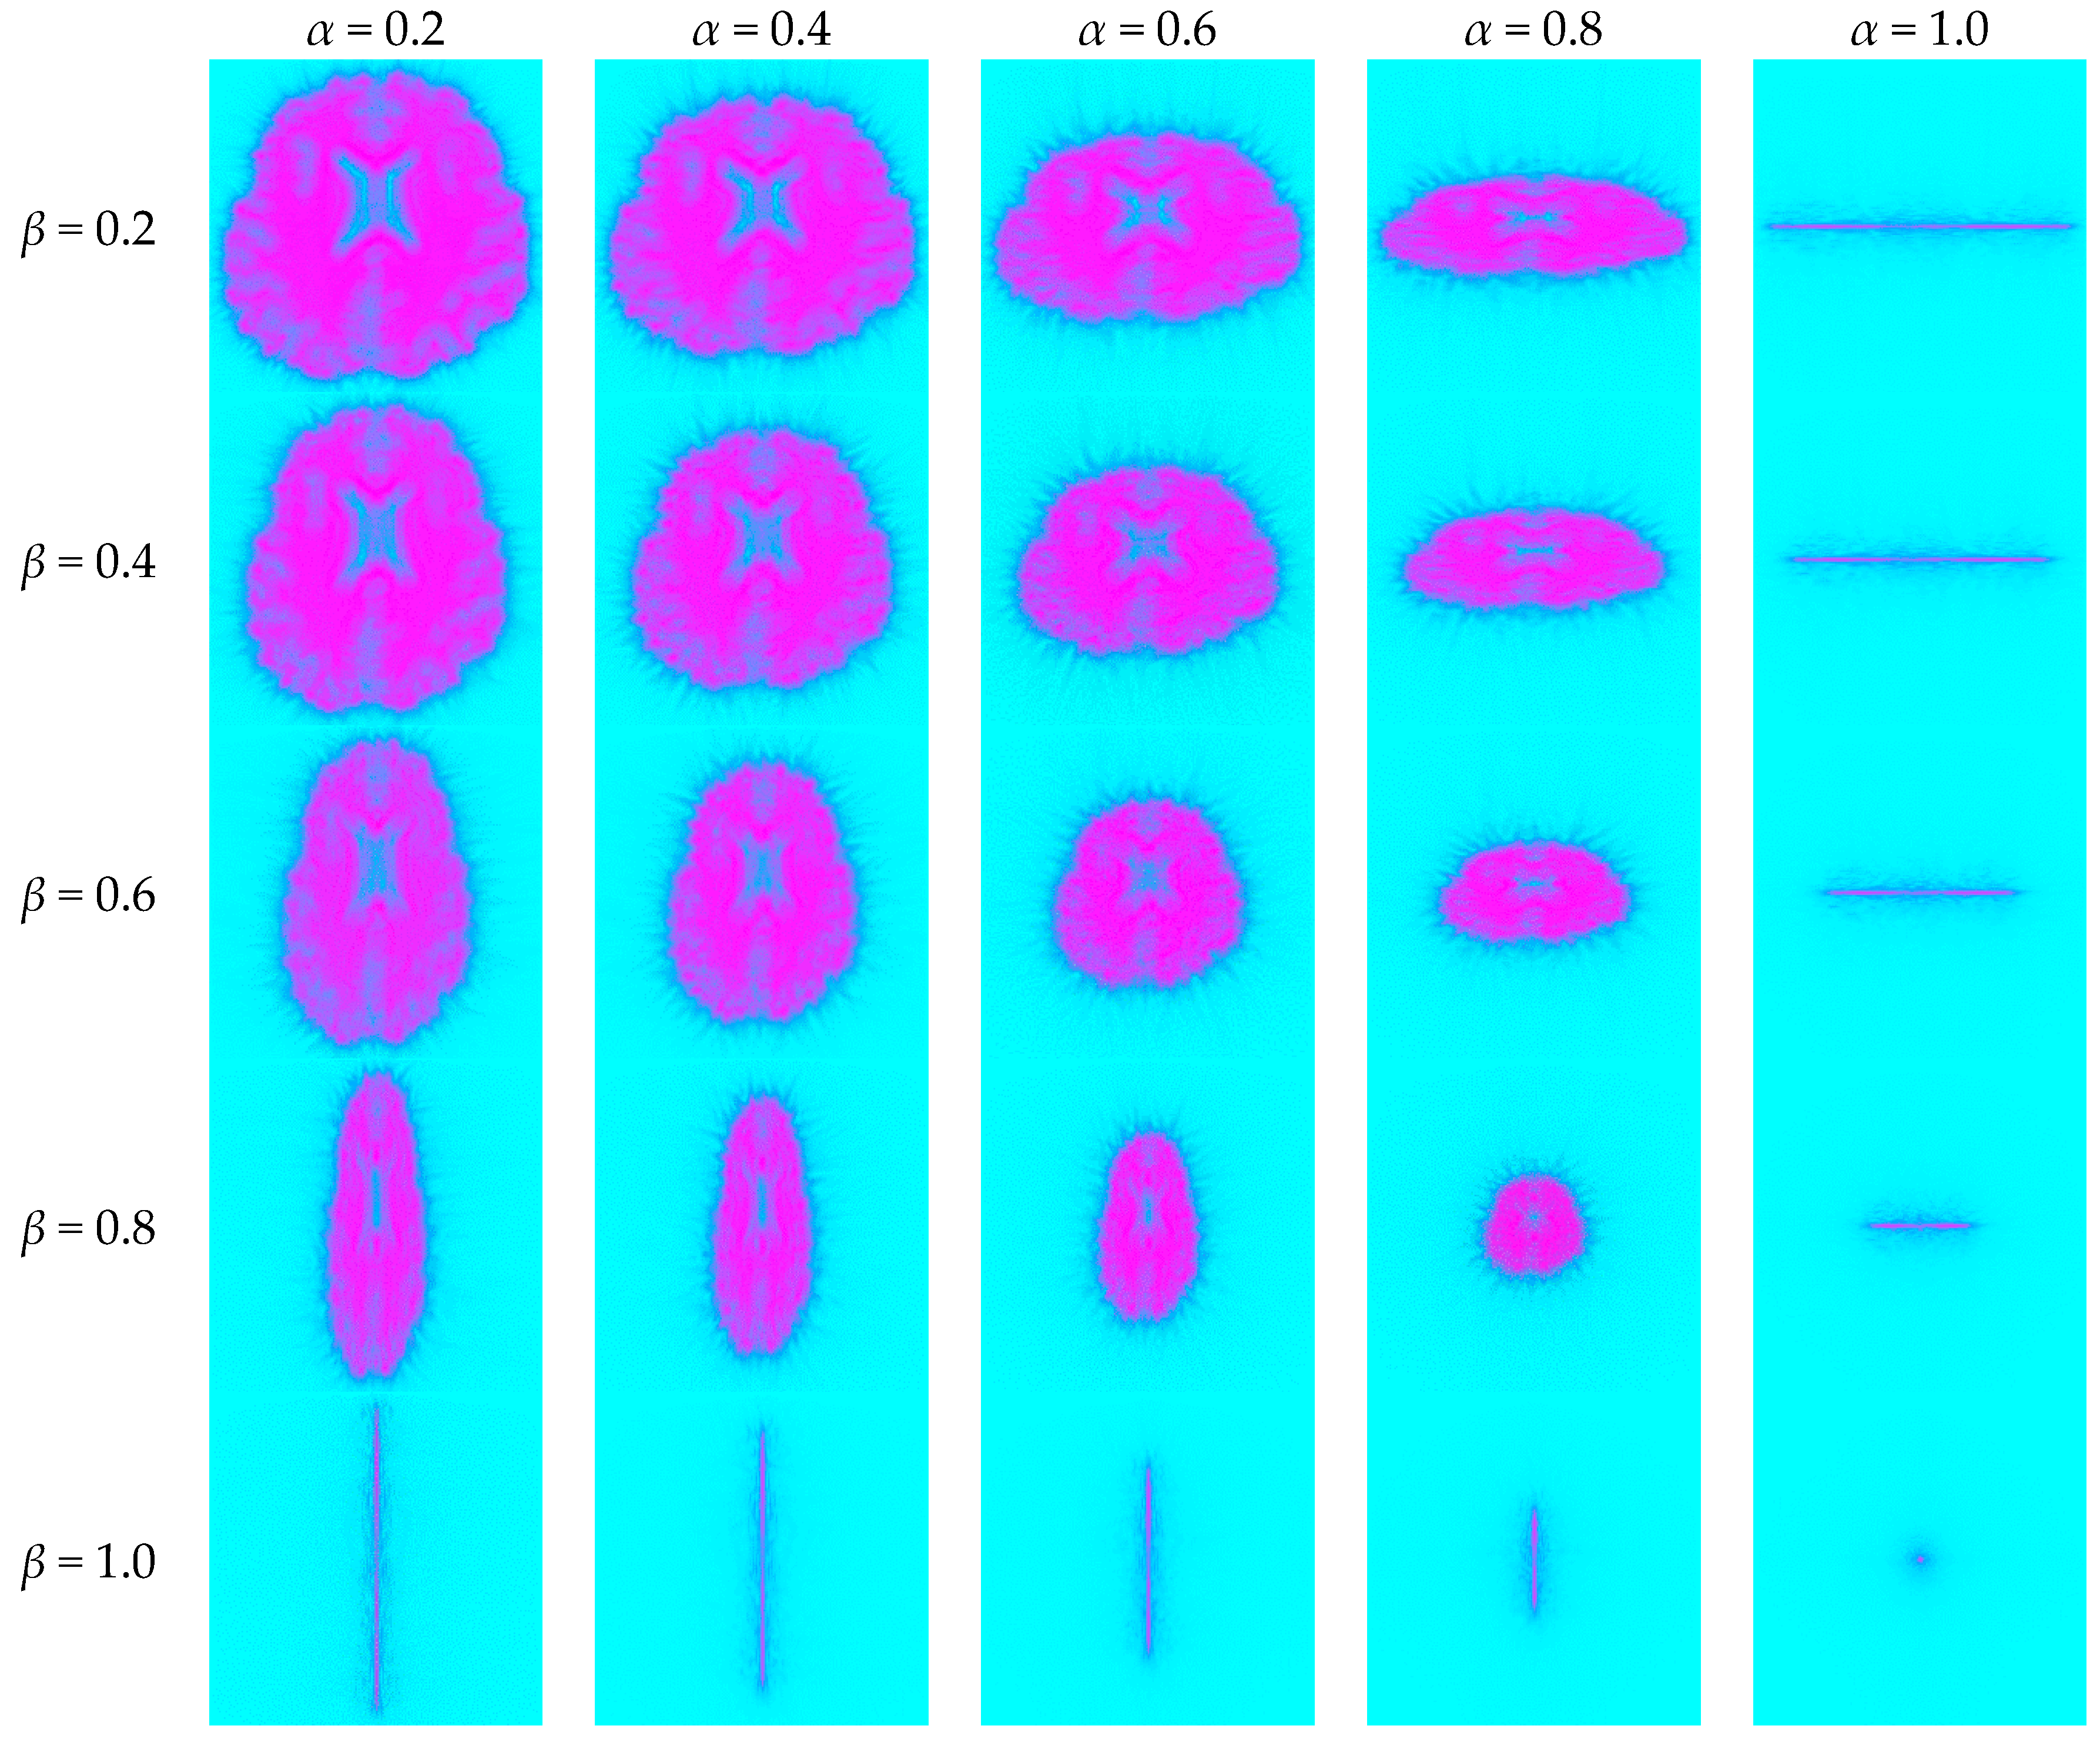
5.1. Unified Time-Frequency Domain
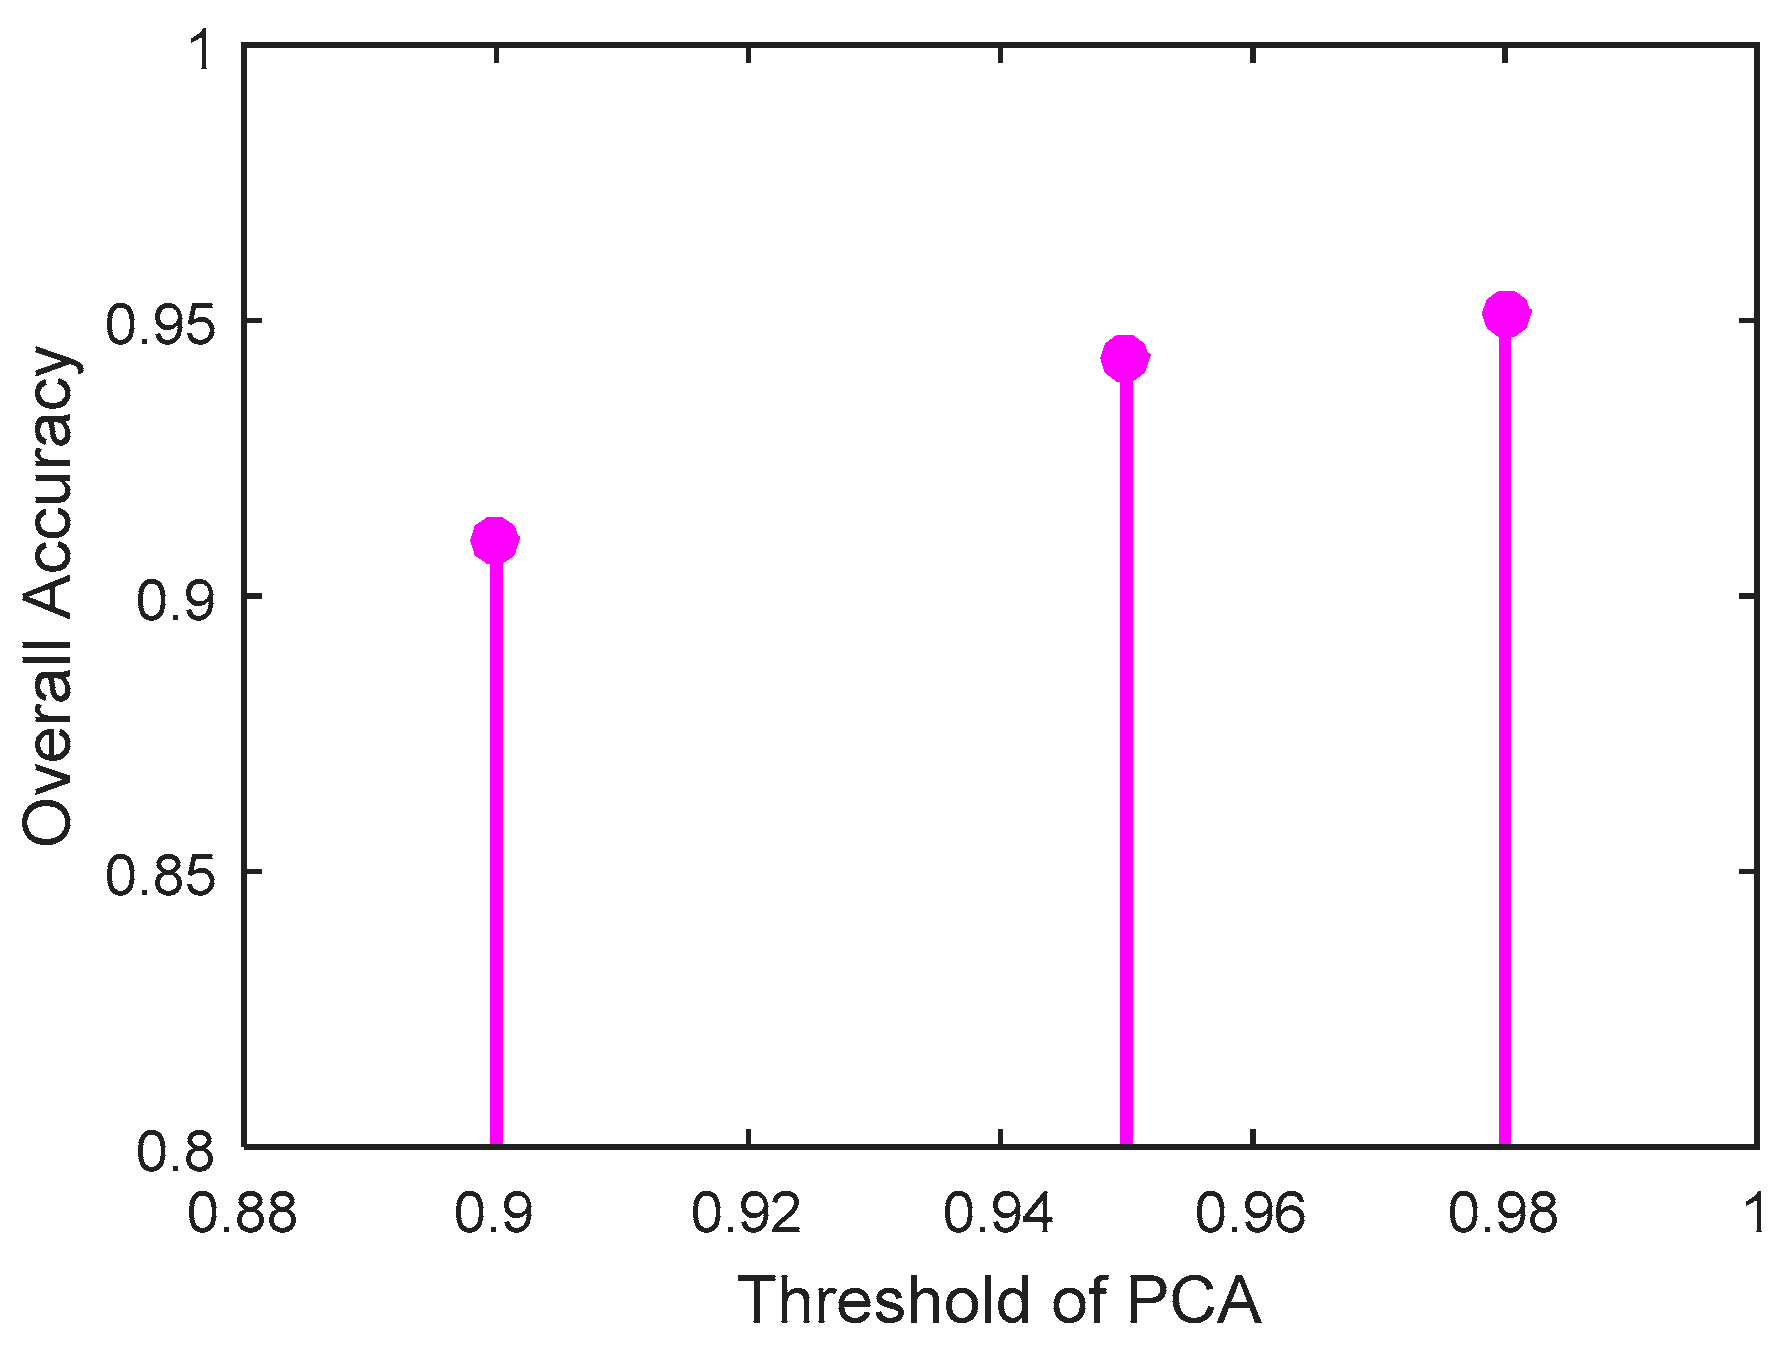
5.2. Optimal Threshold of PCA
5.3. Evaluation
6. Conclusions
Acknowledgments
Author Contributions
Conflicts of Interest
Abbreviations
| SNHL | Sensorineural hearing loss |
| UHL | Unilateral hearing loss |
| LHL | Left-sided hearing loss |
| RHL | Right-sided hearing loss |
| HC | Healthy control |
| MRI | Magnetic resonance imaging |
| PTA | Pure tone average |
| MNI | Montreal neurologic institute |
| UTFD | Unified time-frequency domain |
References
- Tseng, C.-C.; Hu, L.-Y.; Liu, M.-E.; Yang, A.C.; Shen, C.-C.; Tsai, S.-J. Risk of depressive disorders following sudden sensorineural hearing loss: A nationwide population-based retrospective cohort study. J. Affect. Disord. 2016, 197, 94–99. [Google Scholar] [CrossRef] [PubMed]
- Kitoh, R.; Nishio, S.Y.; Ogawa, K.; Okamoto, M.; Kitamura, K.; Gyo, K.; Sato, H.; Nakashima, T.; Fukuda, S.; Fukushima, K.; et al. SOD1 gene polymorphisms in sudden sensorineural hearing loss. Acta Oto-Laryngol. 2016, 136, 465–469. [Google Scholar] [CrossRef] [PubMed]
- Kim, T.S.; Yoo, M.H.; Lee, H.S.; Yang, C.J.; Ahn, J.H.; Chung, J.W.; Park, H.J. Short-term changes in tinnitus pitch related to audiometric shape in sudden sensorineural hearing loss. Auris Nasus Larynx 2016, 43, 281–286. [Google Scholar] [CrossRef] [PubMed]
- Aarhus, L.; Tambs, K.; Nafstad, P.; Bjorgan, E.; Engdahl, B. Childhood sensorineural hearing loss: Effects of combined exposure with aging or noise exposure later in life. Eur. Arch. Oto-Rhino-Laryn. 2016, 273, 1099–1105. [Google Scholar] [CrossRef] [PubMed]
- Komara, M.; John, A.; Suleiman, J.; Ali, B.R.; Al-Gazali, L. Clinical and molecular delineation of dysequilibrium syndrome type 2 and profound sensorineural hearing loss in an inbred Arab family. Am. J. Med. Genet. A 2016, 170, 540–543. [Google Scholar] [CrossRef] [PubMed]
- Geng, Z.J.; Zhang, Q.; Li, W.; Zhang, J. Auditory cortical responses evoked by pure tones in healthy and sensorineural hearing loss subjects: Functional MRI and magnetoencephalography. Chin. Med. J. 2006, 119, 1548–1554. [Google Scholar]
- Fan, W.L.; Zhang, W.J.; Li, J.; Zhao, X.Y.; Mella, G.; Lei, P.; Liu, Y.; Wang, H.H.; Cheng, H.M.; Shi, H.; et al. Altered contralateral auditory cortical morphology in unilateral sudden sensorineural hearing loss. Otol. Neurotol. 2015, 36, 1622–1627. [Google Scholar] [CrossRef] [PubMed]
- Fatemizadeh, E.; Shooshtari, P. Roi-based 3D human brain magnetic resonance images compression using adaptive mesh design and region-based discrete wavelet transform. Int. J. Wavelets Multiresolut. Inf. Process. 2010, 8, 407–430. [Google Scholar] [CrossRef]
- Gareis, I.; Gentiletti, G.; Acevedo, R.; Rufiner, L. Feature Extraction on Brain Computer Interfaces using Discrete Dyadic Wavelet Transform: Preliminary Results. J. Phys. Conf. Ser. 2011, 313, 012011. [Google Scholar] [CrossRef]
- Arizmendi, C.; Vellido, A.; Romero, E. Classification of human brain tumours from MRS data using Discrete Wavelet Transform and Bayesian Neural Networks. Expert Syst. Appl. 2012, 39, 5223–5232. [Google Scholar] [CrossRef]
- Vivas, E.L.A.; Garcia-Gonzalez, A.; Figueroa, I.; Fuentes, R.Q. Discrete Wavelet Transform and ANFIS Classifier for Brain-Machine Interface based on EEG. In Proceedings of the 6th International Conference on Human System Interactions, Sopot, Poland, 6–8 June 2013; Paja, W.A., Wilamowski, B.M., Eds.; IEEE: New York, NY, USA, 2013; pp. 137–144. [Google Scholar]
- Nayak, D.R.; Dash, R.; Majhi, B. Brain MR image classification using two-dimensional discrete wavelet transform and AdaBoost with random forests. Neurocomputing 2016, 177, 188–197. [Google Scholar] [CrossRef]
- Saber, A.; Emam, A.; Amer, R. Discrete wavelet transform and support vector machine-based parallel transmission line faults classification. IEEJ Trans. Electr. Electron. Eng. 2016, 11, 43–48. [Google Scholar] [CrossRef]
- Yang, G.; Nawaz, T.; Barrick, T.R.; Howe, F.A.; Slabaugh, G. Discrete Wavelet Transform-Based Whole-Spectral and Subspectral Analysis for Improved Brain Tumor Clustering Using Single Voxel MR Spectroscopy. IEEE Trans. Biomed. Eng. 2015, 62, 2860–2866. [Google Scholar] [CrossRef] [PubMed]
- Sharma, R.; Pachori, R.B.; Acharya, U.R. An Integrated Index for the Identification of Focal Electroencephalogram Signals Using Discrete Wavelet Transform and Entropy Measures. Entropy 2015, 17, 5218–5240. [Google Scholar] [CrossRef]
- Sours, C.; Chen, H.; Roys, S.; Zhuo, J.; Varshney, A.; Gullapalli, R.P. Investigation of Multiple Frequency Ranges Using Discrete Wavelet Decomposition of Resting-State Functional Connectivity in Mild Traumatic Brain Injury Patients. Brain Connect. 2015, 5, 442–450. [Google Scholar] [CrossRef] [PubMed]
- Wang, S.; Du, S.; Atangana, A.; Liu, A.; Lu, Z. Application of stationary wavelet entropy in pathological brain detection. Multimed. Tools Appl. 2016. [Google Scholar] [CrossRef]
- Hemmati, F.; Orfali, W.; Gadala, M.S. Roller bearing acoustic signature extraction by wavelet packet transform, applications in fault detection and size estimation. Appl. Acoust. 2016, 104, 101–118. [Google Scholar] [CrossRef]
- Asgarian, B.; Aghaeidoost, V.; Shokrgozar, H.R. Damage detection of jacket type offshore platforms using rate of signal energy using wavelet packet transform. Mar. Struct. 2016, 45, 1–21. [Google Scholar] [CrossRef]
- Poularikas, A.D. Transforms and Applications Handbook; CRC Press: Boca Raton, FL, USA, 2010. [Google Scholar]
- Atangana, A.; Alkahtanil, B.S.T. New model of groundwater flowing within a confine aquifer: Application of Caputo-Fabrizio derivative. Arabian J. Geosci. 2016, 9. [Google Scholar] [CrossRef]
- Cattani, C.; Pierro, G. On the Fractal Geometry of DNA by the Binary Image Analysis. Bull. Math. Biol. 2013, 75, 1544–1570. [Google Scholar] [CrossRef] [PubMed]
- Atangana, A.; Baleanu, D.; Alsaedi, A. New properties of conformable derivative. Open Math. 2015, 13, 889–898. [Google Scholar] [CrossRef]
- Jian-Kai, L.; Cattani, C.; Wan-Qing, S. Power Load Prediction Based on Fractal Theory. Adv. Math. Phys. 2015, 2015, 827238. [Google Scholar] [CrossRef]
- Zhang, Y.-D.; Chen, S.; Wang, S.-H.; Yang, J.-F.; Phillips, P. Magnetic resonance brain image classification based on weighted-type fractional Fourier transform and nonparallel support vector machine. Int. J. Imaging Syst. Technol. 2015, 25, 317–327. [Google Scholar] [CrossRef]
- Yang, R.Q.; Bai, Z.Y.; Yin, L.G.; Gao, H. Detecting of Copy-Move Forgery in Digital Images Using Fractional Fourier Transform. In Proceedings of the Seventh International Conference on Digital Image Processing, Los Angeles, CA, USA, 9–10 April 2015.
- Ozaktas, H.M.; Kutay, M.A.; Mendlovic, D. Introduction to the Fractional Fourier Transform and Its Applications. Adv. Imaging Electron Phys. 1999, 106, 239–291. [Google Scholar]
- Healy, J.J.; Kutay, M.A.; Ozaktas, H.M.; Sheridan, J.T. Linear Canonical Transforms; Springer: New York, NY, USA, 2016. [Google Scholar]
- Ozaktas, H.M.; Zalevsky, Z.; Kutay, M.A. The Fractional Fourier Transform; Wiley: Chichester, UK, 2001. [Google Scholar]
- Ran, T.; Feng, Z.; Yue, W. Research progress on discretization of fractional Fourier transform. Sci. China Ser. F Inf. Sci. 2008, 51, 859–880. [Google Scholar]
- Deng, B.; Tao, R. The Analysis of Resolution of the Discrete Fractional Fourier Transform. In Proceedings of the First International Conference on Innovative Computing, Information and Control, Beijing, China, 30 August–1 September 2006; pp. 10–13.
- Zhang, Y.D.; Wang, S.H.; Liu, G.; Yang, J.Q. Computer-aided diagnosis of abnormal breasts in mammogram images by weighted-type fractional Fourier transform. Adv. Mech. Eng. 2016, 8. [Google Scholar] [CrossRef]
- Pan, C.Y.; Dai, L.L.; Yang, Z.X. Unified Time-Frequency OFDM Transmission with Self Interference Cancellation. IEICE Trans. Fundam. Electron. Commun. Comput. Sci. 2013, E96A, 807–813. [Google Scholar] [CrossRef]
- Zhu, Q.J.; Yang, S.W.; Yao, R.L.; Huang, M.; Nie, Z.P. Unified Time- and Frequency-Domain Study on Time-Modulated Arrays. IEEE Trans. Antennas Propag. 2013, 61, 3069–3076. [Google Scholar] [CrossRef]
- Tripathy, L.N.; Samantaray, S.R.; Dash, P.K. A fast time-frequency transform based differential relaying scheme for UPFC based double-circuit transmission line. Int. J. Electric. Power Energy Syst. 2016, 77, 404–417. [Google Scholar] [CrossRef]
- Zhang, Y.; Yang, X.; Cattani, C.; Rao, R.; Wang, S.; Phillips, P. Tea Category Identification Using a Novel Fractional Fourier Entropy and Jaya Algorithm. Entropy 2016, 18, 77. [Google Scholar] [CrossRef]
- Azoug, S.E.; Bouguezel, S. A non-linear preprocessing for opto-digital image encryption using multiple-parameter discrete fractional Fourier transform. Opt. Commun. 2016, 359, 85–94. [Google Scholar] [CrossRef]
- Goel, N.; Singh, K. Convolution and correlation theorems for the offset fractional Fourier transform and its application. AEU Int. J. Electron. Commun. 2016, 70, 138–150. [Google Scholar] [CrossRef]
- Ozaktas, H.M.; Arik, S.O.; Coskun, T. Fundamental structure of Fresnel diffraction: Longitudinal uniformity with respect to fractional Fourier order. Opt. Lett. 2012, 37, 103–105. [Google Scholar] [CrossRef] [PubMed]
- Oktem, F.S.; Ozaktas, H.M. Equivalence of linear canonical transform domains to fractional Fourier domains and the bicanonical width product: A generalization of the space-bandwidth product. J. Opt. Soc. Am. A 2010, 27, 1885–1895. [Google Scholar] [CrossRef] [PubMed]
- Yang, X.; Sun, P.; Dong, Z.; Liu, A.; Yuan, T.-F. Pathological Brain Detection by a Novel Image Feature—Fractional Fourier Entropy. Entropy 2015, 17, 8275–8296. [Google Scholar]
- Elhoseny, H.M.; Faragallah, O.S.; Ahmed, H.E.H.; Kazemian, H.B.; El-sayed, H.S.; Abd El-Samie, F.E. The Effect of Fractional Fourier Transform Angle in Encryption Quality for Digital Images. Optik 2016, 127, 315–319. [Google Scholar] [CrossRef]
- Tang, L.L.; Huang, C.T.; Pan, J.S.; Liu, C.Y. Dual watermarking algorithm based on the Fractional Fourier Transform. Multimed. Tools Appl. 2015, 74, 4397–4413. [Google Scholar] [CrossRef]
- Calculation of the Fractional Fourier Transform. Available online: http://nalag.cs.kuleuven.be/research/software/FRFT/ (accessed on 18 May 2016).
- Zhang, Y.; Wang, S.; Ji, G.; Phillips, P. Fruit classification using computer vision and feedforward neural network. J. Food Eng. 2014, 143, 167–177. [Google Scholar] [CrossRef]
- Lahmiri, S. Interest rate next-day variation prediction based on hybrid feedforward neural network, particle swarm optimization, and multiresolution techniques. Physica A 2016, 444, 388–396. [Google Scholar] [CrossRef]
- Simsir, M.; Bayjr, R.; Uyaroglu, Y. Real-Time Monitoring and Fault Diagnosis of a Low Power Hub Motor Using Feedforward Neural Network. Comput. Intell. Neurosci. 2016, 2016, 7129376. [Google Scholar] [CrossRef] [PubMed]
- Zhang, Y.; Wu, L.; Naggaz, N.; Wang, S.; Wei, G. Remote-sensing Image Classification Based on an Improved Probabilistic Neural Network. Sensors 2009, 9, 7516–7539. [Google Scholar] [CrossRef] [PubMed]
- Celik, O.; Teke, A.; Yildirim, H.B. The optimized artificial neural network model with Levenberg-Marquardt algorithm for global solar radiation estimation in Eastern Mediterranean Region of Turkey. J. Clean. Prod. 2016, 116, 1–12. [Google Scholar] [CrossRef]
- Prado, D.R.; Alvarez, J.; Arrebola, M.; Pino, M.R.; Ayestaran, R.G.; Las-Heras, F. Efficient, Accurate and Scalable Reflectarray Phase-Only Synthesis Based on the Levenberg-Marquardt Algorithm. Appl. Comput. Electromagn. Soc. J. 2015, 30, 1246–1255. [Google Scholar]
- Seal, A.; Bhattacharjee, D.; Nasipuri, M.; Basu, D.K. UGC-JU face database and its benchmarking using linear regression classifier. Multimed. Tools Appl. 2015, 74, 2913–2937. [Google Scholar] [CrossRef]
- Naganawa, S.; Kawai, H.; Taoka, T.; Suzuki, K.; Iwano, S.; Satake, H.; Sone, M.; Ikeda, M. Heavily T2-Weighted 3D-FLAIR Improves the Detection of Cochlear Lymph Fluid Signal Abnormalities in Patients with Sudden Sensorineural Hearing Loss. Magn. Reson. Med. Sci. 2016, 15, 203–211. [Google Scholar] [CrossRef] [PubMed]
- Atangana, A.; Alqahtani, R.T. Modelling the Spread of River Blindness Disease via the Caputo Fractional Derivative and the Beta-derivative. Entropy 2016, 18, 40. [Google Scholar] [CrossRef]


| – | LHL | RHL | Control | F/x2/t | p Value |
|---|---|---|---|---|---|
| Gender (m/f) | 8/7 | 6/8 | 8/12 | – | – |
| Age (year) | 51.7 ± 9.6 | 53.9 ± 7.6 | 53.6 ± 5.4 | 0.305 | 0.739 |
| Education level (year) | 12.5 ± 1.7 | 12.1 ± 2.4 | 11.5 ± 3.2 | 0.487 | 0.618 |
| Disease duration (year) | 17.6 ± 17.3 | 14.2 ± 14.9 | – | 0.517 | 0.610 |
| PTA of left ear (dB) | 78.1 ± 17.9 | 21.8 ± 3.2 | 22.2 ± 2.1 | 156.427 | 0.00 |
| PTA of right ear (dB) | 20.4 ± 4.2 | 80.9 ± 17.4 | 21.3 ± 2.2 | 167.796 | 0.00 |
| Class | Sensitivity | Specificity | Precision | Accuracy |
|---|---|---|---|---|
| HC | 96.50% | 97.93% | 96.98% | 97.35% |
| LHL | 94.00% | 97.35% | 94.00% | 96.33% |
| RHL | 94.29% | 97.43% | 93.62% | 96.53% |
| Overall | – | – | – | 95.10% |
© 2016 by the authors; licensee MDPI, Basel, Switzerland. This article is an open access article distributed under the terms and conditions of the Creative Commons Attribution (CC-BY) license (http://creativecommons.org/licenses/by/4.0/).
Share and Cite
Wang, S.; Yang, M.; Zhang, Y.; Li, J.; Zou, L.; Lu, S.; Liu, B.; Yang, J.; Zhang, Y. Detection of Left-Sided and Right-Sided Hearing Loss via Fractional Fourier Transform. Entropy 2016, 18, 194. https://doi.org/10.3390/e18050194
Wang S, Yang M, Zhang Y, Li J, Zou L, Lu S, Liu B, Yang J, Zhang Y. Detection of Left-Sided and Right-Sided Hearing Loss via Fractional Fourier Transform. Entropy. 2016; 18(5):194. https://doi.org/10.3390/e18050194
Chicago/Turabian StyleWang, Shuihua, Ming Yang, Yin Zhang, Jianwu Li, Ling Zou, Siyuan Lu, Bin Liu, Jiquan Yang, and Yudong Zhang. 2016. "Detection of Left-Sided and Right-Sided Hearing Loss via Fractional Fourier Transform" Entropy 18, no. 5: 194. https://doi.org/10.3390/e18050194
APA StyleWang, S., Yang, M., Zhang, Y., Li, J., Zou, L., Lu, S., Liu, B., Yang, J., & Zhang, Y. (2016). Detection of Left-Sided and Right-Sided Hearing Loss via Fractional Fourier Transform. Entropy, 18(5), 194. https://doi.org/10.3390/e18050194