Article

Correlation between the Increasing Conductivity of Aqueous Solutions of Cation Chlorides with Time and the “Salting-Out” Properties of the Cations

Faculty of Chemistry and Chemical Technology, University of Ljubljana, Večna pot 113, 1000 Ljubljana, Slovenia
*
Author to whom correspondence should be addressed.
Entropy 2016, 18(3), 66; https://doi.org/10.3390/e18030066
Submission received: 12 September 2015 / Revised: 25 January 2016 / Accepted: 14 February 2016 / Published: 24 February 2016

Abstract

:
The time-dependent role of cations was investigated by ageing four different aqueous solutions of cation chlorides. A linear correlation was found between the cations’ Setchenov coefficient for the salting-out of benzene and the increase in the conductivity with time. The conductivity of the structure-breaking cations or the chaotropes increased more significantly with time than the conductivity of the kosmotropes. Since larger water clusters accelerate the proton or hydroxyl hopping mechanism, we propose that the structuring of the hydration shells of the chaotropes might be spontaneously enhanced over time.

1. Introduction

The Hofmeister series is a ranking of ions according to how strongly they influence the solubility of hydrophobes. Small ions cause “salting-out”, so reducing the solubilities of hydrophobes in water, whereas large ions cause “salting-in”, and hence increase the solubilities of non-polar molecules. The position of ions in the Hofmeister series is not, however, perfectly correlated with their ionic charge density. It is directly proportional to the concentration of the salt and is well modelled by the Setchenov Equation [1]:
l n c i c i 0 = k s × c s
where the molar solubility of the hydrophobe in a salt solution is ci and its solubility in water is ci0. In addition, cs denotes the molar concentration of the salt and ks is the salt’s Setchenov coefficient for salting-out.
The first explanation for the Hofmeister series introduces the concept of “structure-making” and “structure-breaking” ions. According to this idea, large, low-charge ions such as Cs+ and NH4+ disrupt the “water structure”, and as a consequence they are called “structure breakers”. In contrast, small or highly charged ions such as F and Mg2+ order the hydrogen-bonded network, and so they are called “structure makers”. Salting-out results from the competition for solvation between the salt and the hydrophobe, as a result of which the hydrophobe is depleted of hydration water, meaning that it precipitates [2].
However, experimental studies of the structure of electrolyte solutions show no direct evidence that, in the presence of ions, significant changes to the hydrogen-bonded network of water occur. According to the available evidence, simple ions have little or no effect on the “water structure” beyond the first or second hydration shell [2,3,4,5,6,7]. Only a few studies suggest otherwise [8,9,10,11,12,13,14,15,16].
In a previous study [10] we continued the work of Elia and coworkers [17,18], who explored the physico-chemical properties of aqueous solutions of NaHCO3 that were treated mechanically by iterating dilution and succussion (i.e., vigorous shaking). After a certain amount of time they compared the electrical conductivity, the pH and the heat of mixing for aged and chemically analogous fresh solutions. They found increased conductivity values, pH values and heats of mixing for the aged solutions. However, the increased values could not be simply attributed to the chemical impurities from the leaching out of glass vials during ageing. It was suggested that their unusual results could be explained by the water’s self-organizing abilities, by which the order in the hydrogen-bonded network is increased. In other words, in aqueous hydrogen carbonate solutions the transfer of protons predominates [19]. The protons are transferred through the water either by the formation or cleavage of hydrogen and covalent bonds, i.e., the so-called hopping mechanism [20], with this hopping being accelerated when the water`s hydrogen-bonded network is more organized [21].
However, we [10] found no significant differences between the conductivities of aged, mechanically treated solutions and aged, untreated solutions, although the conductivity values of all the aged solutions (treated and untreated) were significantly higher than those of the freshly prepared, chemically analogous solutions. Surprisingly, our results [10] resembled a phenomenon in liquid water that may develop when the water is left to stand for some time in closed vessels. This has been referred to as the “autothixotropy of water” [22]. The phenomenon is weak and develops spontaneously over time, with the ions appearing to play an important role. Thixotropy is a property of certain gels and liquids, which under normal conditions are highly viscous; however, when they are subjected to mechanical processing, their viscosity diminishes. We suggested that the increased conductivity values in the aged solutions might be due to the phenomenon of thixotropy, where the ions and hydrophilic surfaces could play important roles [9].
In this work we study the effect of cations with different positions in the Hofmeister series on the increase of the conductivity values with time. We showed that the cations have a different effect on the increase of the conductivity, depending on their tendency to salt-out a simple hydrophobe, i.e., benzene.

2. Experimental Section

2.1. Materials

The solutes were J. T. Baker (Avantor Performance Materials, Center Valley, PA, USA), Acros-Organics (Thermo Fisher Scientific, Geel, Belgium) and Fluka and Emsure (Merck, Darmstadt, Germany) products of the highest purity commercially available. The solutions were made using freshly prepared, twice-distilled, Milli-Q (Mq) water (Milli-Q water purification system, Millipore Corp., Waltham, MA, USA) with ~1 µS/cm, and for preparation in inert conditions a Mq with 0.06 μS/cm conductivity.

2.2. Methods

2.2.1. Conductivity Measurements

Systematic measurements of the electrical conductivity (μS/cm) were performed with a Stanford SR720 LCR impedance meter (Rohde & Schwartz, Munich, Germany) with five frequencies of alternating current, i.e., 100, 120, 1000, 10,000 and 100,000 Hz. A grey, platinized, two-pole Microsamples CDC749 measuring cell (Radiometer Analytical, Lyon, France) was used in the conductivity range 1–1000 μS/cm with a constant of 1.55 cm−1. For more details, see the Supplementary Materials and reference [10]. The conductivity was measured in transparent, 2.5 mL flasks (neoLab, Heidelberg, Germany), in which the solutions of 2 mL were stored with a surface-to-volume ratio (S/V) equal to 4.0 cm−1. In our previous experiments in order to find structural effects, the ratio of the glass contact surface and volume (S/V) proved to be important [10].
The conductivity measurements were performed at 25 °C. A VB13H thermostat (Kambič Laboratory Equipment d.o.o, Semič, Slovenia) with an accuracy of ± 0.1 °C and a thermostatic bath of distilled water were used. When the conductivity was measured in an inert atmosphere the SR720 LCR impedance meter was transferred into a glove-bag filled with N2.

2.2.2. Analytical Determination of the Impurities

The concentrations of the Na, K, Mg, Ca and Si in the aged solutions were determined using an inductively coupled plasma optical emission spectrometry (ICP-OES) instrument (model 715-ES, Varian, Agilent Technologies, Santa Clara, CA, USA). For the solutions aged in an inert atmosphere, the concentrations of Na, K, Ca, Si, Mg, Li, Al, B, Ba, As, Sr and Zn were determined using an inductively coupled plasma mass spectrometry (ICP-MS) instrument (7500ce, Agilent Technologies, Santa Clara, CA, USA) (for more details see [10]) and Na, Si and Ca using ICP-OES. Where the values differed, the ICP-OES results were chosen.

2.3. Course of the Work

The starting-point solutions with defined concentrations of CsCl, KCl, LiCl and MgCl2 were prepared. The conductivities of all the treatments were measured directly after the preparation and after a certain amount of time. The solutions were stored in 2.5 mL flasks (neoLab) of transparent glass that were used for the first time, cleaned with Mq water and ethanol and left to dry completely before use. Plastic flasks were not used due to the leaching of small quantities of organic acids during ageing that are difficult to determine quantitatively. The conductivity was measured in the same flasks as the solutions were kept. After the starting-point conductivity was measured the flasks were closed tightly and stored on a laboratory shelf that was unprotected from light or in a N2 atmosphere at 24.2 °C.
The conductivity was measured at five frequencies. Since at higher frequencies, 10 and 100 kHz, the content of the thermostatic bath can influence the conductivity measurements, only the values at 1 kHz were compared. However, the conductivity measurements at all frequencies gave similar results.
For the first and second series, fresh Mq water with an equilibrium amount of CO2 (aq) was used as the solvent. The third series was performed in a N2 and/or Ar atmosphere. In the first series, the conductivities of 0.05 mmol/L CsCl and KCl were measured repeatedly until the thirty-fifth day of ageing. No thermostatic bath was used for this series; therefore, the conductivity was adjusted to 25 °C with a coefficient of 2%/°C. The differences in the conductivity values were compared. In the second series, the molar concentration of the anion (chloride) was equal in all the solutions and the conductivity was measured on the first and the fourteenth or sixteenth day of ageing. Here, a thermostatic bath was used. For this series, the preparation of the solutions and the conductivity measurements were repeated twice. The concentrations of the CsCl, KCl or LiCl were c = 0.1 mmol/L with an ionic strength of 0.1 mmol/L, and for MgCl2, c = 0.05 mmol/L with an ionic strength of 0.15 mmol/L. After the conductivity measurements were completed, the solutions were analysed for the microelements Na, K, Mg, Ca and Si by means of ICP-OES. From the ICP-OES analyses the ionic strength on the fourteenth or sixteenth day (Iaged) was calculated. It was proposed that in the KCl and MgCl2 solutions, the leaching of K and Mg, respectively, was similar as in the other flasks. The influence of Si on the conductivity was disregarded since the conductivity of 0.05 mmol/L NaCl solutions at pH 7 with and without 0.05 mmol/L ortho silicic acid proved to be equal.
In the third series the solutions of CsCl, LiCl, KCl and MgCl2 were prepared under a N2 and/or Ar atmosphere in a glove-bag (AtmosBag, Aldrich®, Merck, Darmstadt, Germany). Every flask that was introduced into the glove-bag was previously purged with Ar. The water used as solvent had 0.06 μS/cm conductivity, i.e., the same value as specified in the Milli-Q operation manual. The solutions were prepared and their conductivities and pH values were measured inside the glove-bag. The whole experiment was performed inside an air-conditioned laboratory. The ionic strength was calculated by adding up all the ions. In contrast, for the theoretical increase in conductivity (∆σt) all the ions, minus the ions released after one day (see Table 1), were considered. In order to accurately measure the pH, KCl was added to the solutions in order to prepare final solutions of 1 mmol/L KCl. Due to the increase in the pH, the increase in the conductivity was substantial after the first day.

3. Results and Discussion

This study was performed in order to better understand the phenomenon of the increased conductivity values in aged, aqueous solutions found in our previous experiments [10]. We attributed the change in the properties to the self-organizing abilities of water molecules in the presence of ions and hydrophilic surfaces. According to our hypothesis, the causes of the increased conductivities in the aged aqueous solutions are the thixotropic properties of the aqueous solutions that develop spontaneously when the solutions are left to stand undisturbed for some time and where the ions and hydrophilic surfaces play important roles.
We tested our hypothesis by comparing the conductivity values of freshly prepared and 14–35-days-aged solutions for four different cation chlorides, chosen according to the value of their salting-out Setchenov coefficient (ks). The experimental ks of a simple hydrophobic molecule, i.e., benzene, in the presence of CsCl, LiCl, KCl and MgCl2, was used because the Hofmeister ions uniformly obey the Setchenov equation for the salting-out of benzene from an aqueous solution. All of the cation chlorides studied can salt-out benzene; therefore, they have a positive ks [1,23]. A small, divalent cation like Mg2+ can strongly salt-out the hydrophobe. In contrast, larger ions like Cs+ lead to less salting-out. In this way, a correlation between the increase in conductivity with time and the salting-out properties of the cation chlorides was investigated. For the first and second series, fresh Mq water with an equilibrium concentration of dissolved CO2 and ~1 μS/cm conductivity was used as a solvent. For the third series, water with 0.06 μS/cm conductivity (at 25 °C) was used and aqueous solutions were prepared, aged and their conductivities and pH values were measured in an inert N2 and/or Ar atmosphere.
At first, the long-term dependence of the conductivity for 0.05 mmol/L CsCl and KCl was measured for 35 days (see Figure 1). After 35 days of ageing the conductivity for the aqueous solutions of CsCl (ks(CsCl) = 0.088 L/mol) increased more than the conductivity for KCl (ks(KCl) = 0.166 L/mol); see Figure 1.
In order to provide more information about this topic, a second series of experiments was performed in which 0.1 mmol/L of CsCl, LiCl and KCl, and 0.05 mmol/L of MgCl2 (ks = 0.088, 0.141, 0.166 and 0.350 L/mol, respectively) were prepared. These two preparations were statistically compared in terms of the average conductivity increase per cation. Since the variances were homogenous and both preparations were normally distributed, a simple t-test was used (see Tables S2 and S6 in the Supplementary Materials). According to the t-test, the increases in the conductivity of the two preparations of cation chloride solutions are similar (p = 0.152). The starting-point conductivities (σ0) are presented in Figure 2; the increases in conductivity per cation chloride after ageing, in Figure 3; and the ICP-OES analyses and conductivity measurement results, in Table 2 and Table 3.
The starting-point conductivities (σ0) of CsCl, LiCl, KCl and MgCl2 for the preparations aged for 14 days were 17.9, 14.3, 17.9 and 15.8 μS/cm, and for 16 days aged, they were 16.9, 12.3, 16.5 and 14.1 μS/cm, respectively (see Figure 2). The chloride concentration was the same in all the solutions; the concentrations of Cs+, Li+, K+ and Mg2+ were 0.1, 0.1, 0.1 and 0.05 mmol/L, respectively. The difference in the conductivity values for the two preparations was approximately 1.5 μS/cm, because the 14-days-aged solutions were measured on the second day after the preparation, not on the first. The RSE of the 14-days-aged solutions were increased even though the conductivity was measured in a thermostatic bath. Namely, due to the high value of S/V (4 cm−1) in the 2.5 mL flasks, leaching out of the glass in two days already influenced the conductivity results. The limiting ionic molar conductivities of the cation series in water at 298 K were 78, 38.7, 73.5 and 106.2 S·cm2/mol, respectively [24]. The starting-point conductivities of the different cation chlorides differed mainly due to the lower limiting ionic molar conductivity of the Li+ ion. In order to avoid further errors, for the third series the number of parallel solutions was increased to 14.
When calculating ionic strength of the aged solutions Iaged, the equilibrium concentration of dissolved CO2 (calculated in [10]) was taken into account. However, when calculating Δσt an approximation was made, since the contribution of dissolved CO2, i.e., present in the initial and final solutions, was neglected.
The increase in the conductivity vs. Iaged (∆σ/Iaged) and ks are linearly correlated for the 14- and 16-days-aged solutions (see Figure 3). The ∆σ/Iaged of the CsCl, LiCl, KCl and MgCl2 solutions are 41.2, 35.8, 34.5 and 22.0 S.cm2/mol after 14 days and 52.0, 54.0, 39.3 and 27.0 S·cm2/mol after 16 days, respectively. The dots in Figure 3 at pH 7 are the averages of eight measurements of four to thirteen replicate solutions. After 14 days of ageing the deviation from linearity (R2) is 0.99 and the correlation is:
Δσ/Iaged = −71 ks + 50
Hence, ks of the tested cation chlorides seems to be directly proportional to the increase of the conductivity with time. In the solutions of less salting-out cations (chaotropes) the measured conductivity increased more with time compared to the solutions of kosmotropes (see Figure 1 and Figure 3).
The aged solutions consist of a Hofmeister solute, i.e., cation chloride, chemical impurities in forms of various sodium silicates at comparable concentrations to the investigated chlorides in the final solutions and, where CO2 was present, carbonate-bicarbonate species at variable concentrations. All salts, including bicarbonates and silicates, behave as Hofmeister salts and their effect should be taken into account. Therefore the maximum difference in the approximate theoretical conductivity was calculated by multiplying the maximum differences between the concentrations of the chemical impurities obtained by ICP-OES (see Table 2 and Table 3), with limiting molar conductivities of Na+, K+, Mg2+ and Ca2+ at 25 °C [24]. For the 14-days-aged solution at pH 7 it was ((80.9 − 72.0) × 50.1 + (9.2 − 6.0) × 73.5 + (4.5 − 4.1) × 106.2 + (8.2 − 5.7) × 119)/1000 = 1.0 μS/cm, and for the 16-days-aged solution it was 0.7 μS/cm, smaller than the differences in the conductivity increases between the cation chloride solutions. For this reason the differences cannot be simply attributed to the chemical impurities leaching out of the glass.
In our previous work [10] the influence of carbon dioxide on the increase of conductivity was disregarded since similar excess conductivity values were measured in aged 2 mL volume solutions with either 0.5 mL or 18 mL air volume above. However, to exclude all doubts, the third series was tested in an inert atmosphere, without the presence of CO2.
In the presence of CO2, which exerts a buffering effect, the following main reaction due to the dissolution of glass occurs:
Na+ + H3SiO4 + H2O + CO2(aq)       H4SiO4 + Na+ + HCO3
Silicic acid at neutral pH is a very weak acid, mostly present in its neutral form. Hence, it has no significant effect on the conductivity. The main ions that contribute to the conductivity at neutral pH are Na+ and HCO3. According to reaction Equation (3) the concentration of HCO3 increases with Na+ release during dissolution. Nevertheless, the calculation of the theoretical increase in conductivity was simplified by neglecting the hydrogen carbonate anions due to their presence in fresh and in aged solutions.
In an inert atmosphere, the following equation is the dominant one:
H4SiO4 + Na+ + OH       Na+ + H3SiO4 + H2O
Here, the main ions contributing to the conductivity are OH, Na+, and at pH 9 also H3SiO4 (Henderson–Hasselbalch approximation for weak acids). The reactions Equations (3) and (4) are reversible, thus the arrows in the equations only show the equilibrium displacements.
In Table 4 the ICP-OES analyses, and in Table 5 the increases in the measured and theoretical conductivities of the solutions aged for 15 days in an inert atmosphere, are presented. The values reported in Figure 3 at pH 9 represent the averages of eight measurements of fourteen replicate solutions. The relative standard errors (RSEs) are listed in Table 5.
The increase in the conductivity vs. Iaged between the 1- and 15-days-aged solutions under an inert atmosphere (pH 9 in both cases) is linearly correlated with the cation’s Setchenov coefficient for salting-out (see Figure 3). The equation with R2 0.95 is Δσ/Iaged = −60ks + 50, similar to the 14- and 16-days-aged solutions at pH 7 with dissolved CO2. For this reason the influence of dissolved CO2 on the different increase in Δσ/Iaged for the cation chlorides was disregarded. The content of the chemical impurities due to leaching out of glass are approximately similar in solutions with and without dissolved CO2 (see Table 2, Table 3 and Table 4). The conductivity values after 1 day in an inert atmosphere are approximately 5.5 μS/cm higher than after preparation (see σ0 and σ1 in Table 5). This is mainly due to the pH increase to 9 already after 1 day.
The limiting molar conductivities of the proton and hydroxyl ions in water at room temperature are much higher than the limiting molar conductivities of typical cations, like Li+, Na+ and K+, and anions, like Cl and HCO3. For example, at 25 °C the limiting molar conductivity of H+ is 349.8 S·cm2/mol, and the limiting conductivity of Na+ is seven times less [24]. This difference can be explained by the proton hopping mechanism. Using the Grotthuss mechanism the proton transfers through the hydrogen bond network of the water molecules or other hydrogen-bonded liquids by formation and cleavage of covalent and hydrogen bonds that involve neighboring molecules. Dilute aqueous solutions, like LiCl and KCl, have a pH of 7 and the same concentration of H+ and OH (10−7 mol/L). Thus, in the case of a cation effect on the water’s structure in aqueous solutions that contain saturated CO2 with a pH of approximately 7 the structural effect of conductivity change should be less than 0.05 µS/cm. Despite this, we report on excess conductivities of the chaotropes equal to ~3 μS/cm.
Since our reported data have no direct connection with the theoretical explanation we propose, the following theory should be regarded only as a possibility until further experiments on this topic are presented. Somehow, water molecules spontaneously self-organize with time in the presence of the chaotropes to form “exclusion zones” (EZs). Such EZ water was found previously by Pollack and colleagues [8]. EZ water has a negative charge, whereas at its borders with bulk water high concentrations of protons were found [25]. In this way the proton or hydroxyl hopping mechanism is enhanced, and due to the enhanced proton or hydroxyl transfer, the conductivity increases.
Interestingly, our results show similarities with the observations based on the use of a magnetic field [26,27,28,29,30], which found that water and aqueous solutions can be magnetized and stay magnetized much longer than is generally accepted [26,27,28,29,30,31,32,33,34,35,36,37], although the magnetization effect is very weak. Exposure to a magnetic field induces changes in some of the properties of water or aqueous solutions, including surface tension [31], optical features [32], an increase in the vaporization rate [30,33], the melting point [34] and the electrical conductivity [30] compared with those of untreated aqueous solutions. Similar to our results, the conclusions of Higashitani et al. [26,27,28,29] and Holysz et al. [30] were that due to the influence of the magnetic field, the structuring of the hydration shells of the chaotropes increases. Additionally, an increase in the viscosity was measured during the treatment time with the magnetic field [37]. We propose that the magnetic field only accelerates the structuring of the hydration shells of the chaotropic cations that would otherwise structure spontaneously over time.

4. Conclusions

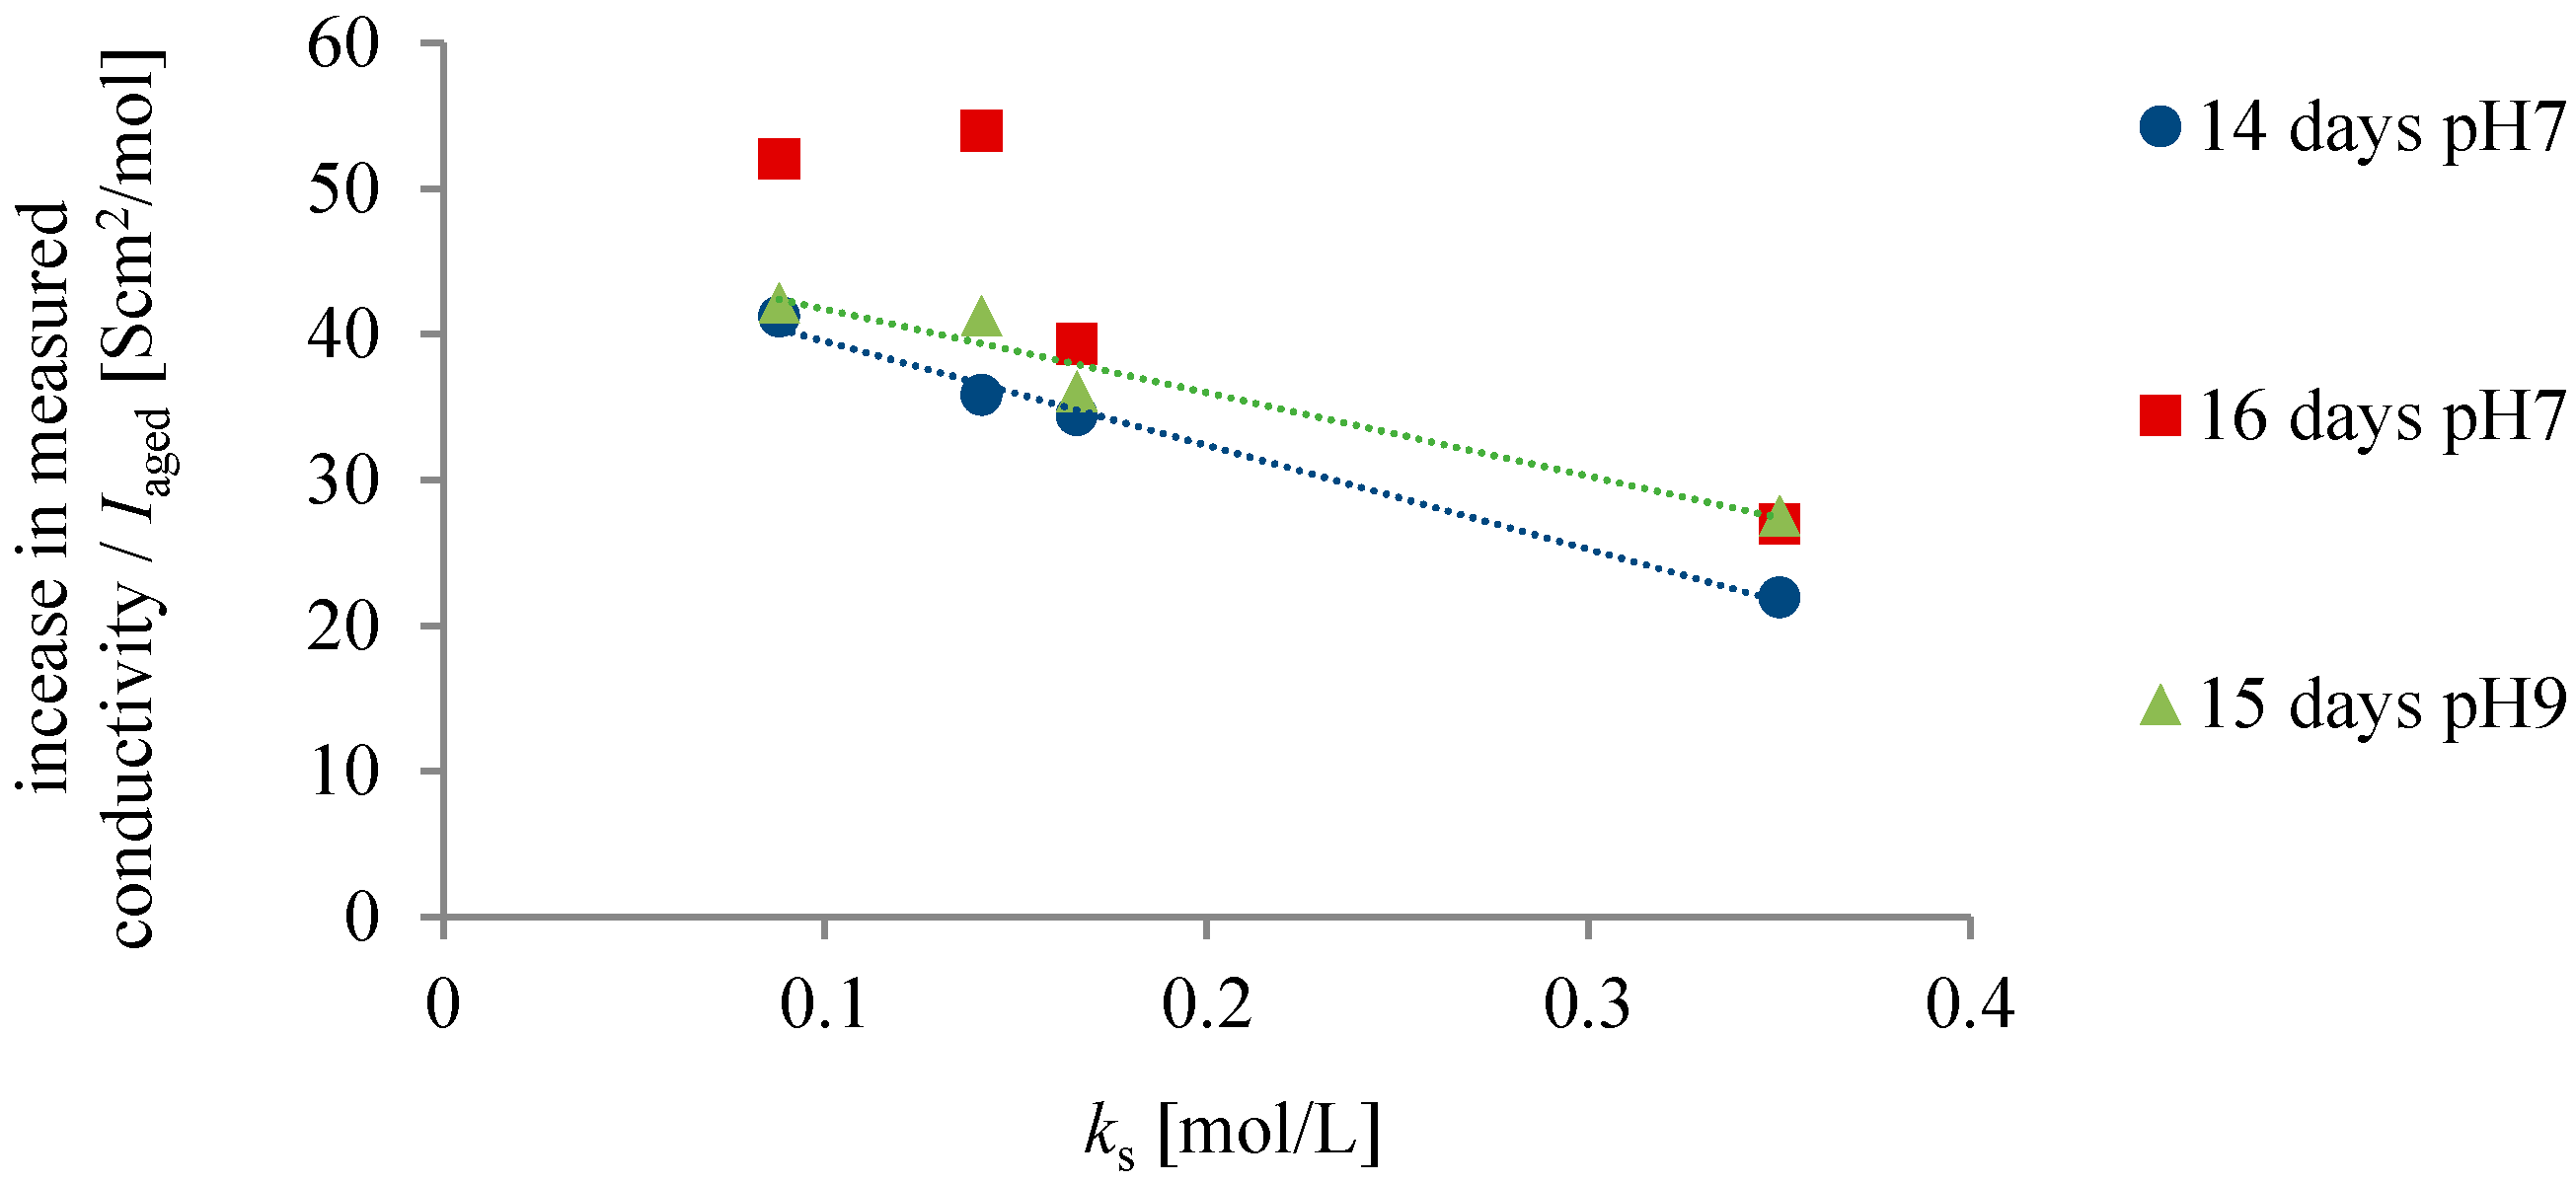
  • The highest increase in conductivity at 25 °C with time was measured in chloride solutions of cations with the weakest salting-out effect. A linear correlation between the increase in the conductivity with time and the salting-out effect of the cation was found. The increase in the conductivity values with time cannot be simply attributed to the chemical impurities from leaching out of the glass during ageing or the dissolution of CO2.
  • We might ascribe the differences in the increase of the conductivity of cation chloride solutions to the ability of liquid water to spontaneously self-organize into so-called exclusion zones, where the cations with a weak salting-out effect (chaotropes) seem to play a more important role than those that strongly salt-out hydrophobes (kosmotropes).
  • The observed increase in the conductivity of long-term-stored solutions of Hofmeister solutes is a thought-provoking finding. The explanation offered, i.e., that the phenomenon is based on the formation of self-organized water forms and the appearance of exclusion zones, should be treated just as one possibility, since there is no direct link between the reported data and the theory.
  • In this study the precise time course of the conductivity increase was not studied, and the reported data give no explanation as to why the change would need such a long time to be observed.
  • Additionally, the concentration of silica species (mainly sodium silicates) that build up in the vessels during ageing is comparable to that of the salts whose effects are being investigated. Therefore further experiments on the time dependence and with increasing concentration of cation chlorides in order to minimize the influence of the ions that dissolve from glass during ageing are encouraged.

Supplementary Materials

The following are available online at www.mdpi.com/1099-4300/18/3/66/s1, Table S1: Example of eight conductivity measurements of 0.1 mmol/L LiCl at 0.120, 1, 10 and 100 kHz and 25 °C in a thermostat bath of distilled water. Descriptive statistics: averages (AVG), standard deviations (SD), standard errors (SE) and relative standard errors (RSE), Table S2: Repeatability of ageing according to increase in conductivity (Δσ); statistical data, Table S3: Repeatability of the conductivity of 10 replicate solutions of 0.5 mmol/L NaHCO3 measured at 25 °C and four frequencies in 20 mL flasks. Descriptive statistics of conductivity with AVG, SD, SE, N and RSE is added, Table S4: Conductivity of 0.05 mmol/L CsCl and KCl at 0.12, 1, 10 and 100 kHz and 25 °C in dependence of time; σ measured without a thermostat bath, T adjusted to 25 °C with coefficient 2 %/°C, Table S5: Repeatability of the conductivity of 13 replicate solutions of 14-days aged 0.1 mmol/L CsCl measured at 25 °C and 1 kHz in a thermostat bath of distilled water. Descriptive statistics of conductivity with AVG, SD, SE and RSE, Table S6: Repeatability of ageing—σ and increase in conductivity (Δσ) with descriptive statistics for the cation chloride aged solutions, σ measured at 25 °C and 1 kHz, Table S7: Repeatability of the conductivity of 14 replicate solutions of 1 and 15 days aged 0.1 mmol/L MgCl2 measured at 25 °C and 1 kHz. Descriptive statistics of conductivity with AVG, SD, SE and RSE, Figure S1: Conductivity values after ageing vs. Setchenov coefficient for salting-out of benzene of the cation chloride (ks); conductivity measured at 25 °C and 1 kHz. RSE 1.0%, 2.5% and 1.8% for 15 days pH9, 14 days pH7 and 16 days pH 7, respectively.

Acknowledgments

The authors thank Samo Andrenšek for fruitful conversations, Marija Zupančič for help and the ICP-MS analyses and Barbara Malič for generously providing the glove-bag.

Author Contributions

Nada Verdel and Peter Bukovec conceived and designed the experiments; Nada Verdel performed the experiments; Nada Verdel and Peter Bukovec analyzed the data; Peter Bukovec contributed reagents and analysis tools; Nada Verdel wrote the paper. Both authors have read and approved the final manuscript.

Conflicts of Interest

The authors declare no conflict of interest.

References

  1. Baldwin, R.L. How Hofmeister ion interactions affect protein stability. Biophys. J. 1996, 71, 2056–2063. [Google Scholar] [CrossRef]
  2. Ball, P. Water as an active constituent in cell biology. Chem. Rev. 2008, 108, 74–108. [Google Scholar] [CrossRef] [PubMed]
  3. Omta, A.W.; Kropman, M.F.; Woutersen, S.; Bakker, H.J. Negligible effect of ions on the hydrogen-bond structure in liquid water. Science 2003, 301, 347–349. [Google Scholar] [CrossRef] [PubMed]
  4. Paesani, F.; Yoo, S.; Bakker, H.J.; Xantheas, S.S. Nuclear quantum effects in the reorientation of water. J. Phys. Chem. Lett. 2010, 1, 2316–2321. [Google Scholar] [CrossRef]
  5. Cappa, C.D.; Smith, J.D.; Wilson, K.R.; Messer, B.M.; Gilles, M.K.; Cohen, R.C.; Saykally, R.J. Effects of alkali metal halide salts on the hydrogen bond network of liquid water. J. Phys. Chem. B 2005, 109, 7046–7052. [Google Scholar] [CrossRef] [PubMed]
  6. Cappa, C.D.; Smith, J.D.; Messer, B.M.; Cohen, R.C.; Saykally, R.J. Effects of cations on the hydrogen bond network of liquid water: New results from X-ray absorption spectroscopy of liquid microjets. J. Phys. Chem. B 2006, 110, 5301–5309. [Google Scholar] [CrossRef] [PubMed]
  7. Krekeler, C.; Delle Site, L. Solvation of positive ions in water: The dominant role of water-water interaction. J. Phys. Condens. Matter 2007, 19, 192101. [Google Scholar] [CrossRef]
  8. Chai, B.H.; Zheng, J.M.; Zhao, Q.; Pollack, G.H. Spectroscopic studies of solutes in aqueous solution. J. Phys. Chem. A 2008, 112, 2242–2247. [Google Scholar] [CrossRef] [PubMed]
  9. Verdel, N.; Jerman, I.; Bukovec, P. The “Autothixotropic” phenomenon of water and its role in proton transfer. Int. J. Mol. Sci. 2011, 12, 7481–7494. [Google Scholar] [CrossRef] [PubMed]
  10. Verdel, N.; Jerman, I.; Krašovec, R.; Bukovec, P.; Zupančič, M. Possible time-dependent effect of ions and hydrophilic surfaces on the electrical conductivity of aqueous solutions. Int. J. Mol. Sci. 2012, 13, 4048–4068. [Google Scholar] [CrossRef] [PubMed]
  11. Verdel, N.; Bukovec, P. Possible Further Evidence for the Thixotropic Phenomenon of Water. Entropy 2014, 16, 2146–2160. [Google Scholar] [CrossRef]
  12. Sedlák, M. Real-time monitoring of the origination of multimacroion domains in a polyelectrolyte solution. J. Chem. Phys. 2005, 122, 151102. [Google Scholar] [CrossRef] [PubMed]
  13. Sedlák, M. Large-scale supramolecular structure in solutions of low molar mass compounds and mixtures of liquids: I. Light scattering characterization. J. Phys. Chem. B 2006, 110, 4329–4338. [Google Scholar] [CrossRef] [PubMed]
  14. Sedlák, M. Large-scale supramolecular structure in solutions of low molar mass compounds and mixtures of liquids: II. Kinetics of the formation and long-time stability. J. Phys. Chem. B 2006, 110, 4339–4345. [Google Scholar] [CrossRef] [PubMed]
  15. Sedlák, M. Large-scale supramolecular structure in solutions of low molar mass compounds and mixtures of liquids. III. Correlation with molecular properties and interactions. J. Phys. Chem. B 2006, 110, 13976–13984. [Google Scholar] [CrossRef] [PubMed]
  16. Sedlák, M.; Rak, D. Large-scale inhomogeneities in solutions of low molar mass compounds and mixtures of liquids: Supramolecular structures or nanobubbles? J. Phys. Chem. B 2013, 117, 2495–2504. [Google Scholar] [CrossRef] [PubMed]
  17. Elia, V.; Niccoli, M. Thermodynamics of extremely diluted aqueous solutions. Ann. N. Y. Acad. Sci. 1999, 879, 241–248. [Google Scholar] [CrossRef] [PubMed]
  18. Elia, V.; Napoli, E.; Niccoli, M.; Marchettini, N.; Tiezzi, E. New physico—Chemical properties of extremely diluted solutions. A conductivity study at 25 °C in relation to ageing. J. Solut. Chem. 2008, 37, 85–96. [Google Scholar] [CrossRef]
  19. Elia, V.; Elia, L.; Montanino, M.; Napoli, E.; Niccoli, M.; Nonatelli, L. Conductometric studies of the serially diluted and agitated solutions on an anomalous effect that depends on the dilution process. J. Mol. Liq. 2007, 135, 158–165. [Google Scholar] [CrossRef]
  20. Xantheas, S.S. Computational chemistry: Dances with hydrogen cations. Nature 2009, 457, 673–674. [Google Scholar] [CrossRef] [PubMed]
  21. Han, J.; Zhou, X.; Liu, H. Ab initio simulation on the mechanism of proton transport in water. J. Power Sources 2006, 161, 1420–1427. [Google Scholar] [CrossRef]
  22. Vybíral, B. The Comprehensive Experimental Research on the Autothixotropy of Water. In Water and the Cell; Pollack, G.H., Cameron, I.L., Wheatley, D.N., Eds.; Springer: New York, NY, USA, 2006; pp. 299–314. [Google Scholar]
  23. Hribar, B.; Southall, N.T.; Vlachy, V.; Dill, K.A. How ions affect the structure of water. J. Am. Chem. Soc. 2002, 124, 12302–12311. [Google Scholar] [CrossRef] [PubMed]
  24. MacInnes, D.A. Principles of Electrochemistry; Reinhold Publishing Corporation: New York, NY, USA, 1939. [Google Scholar]
  25. Zheng, J.M.; Chin, W.C.; Khijniak, E.; Khijniak, E., Jr.; Pollack, G.H. Surfaces and interfacial water: Evidence that hydrophilic surfaces have long-range impact. Adv. Colloid Interface Sci. 2006, 127, 19–27. [Google Scholar] [CrossRef] [PubMed]
  26. Higashitani, K.; Okuhara, K.; Hatade, S. Effects of magnetic fields on stability of nonmagnetic ultrafine colloidal particles. J. Colloid Interface Sci. 1992, 152, 125–131. [Google Scholar] [CrossRef]
  27. Higashitani, K.; Iseri, H.; Okuhara, K.; Kage, A.; Hatade, S. Magnetic effects on zeta potential and diffusivity of nonmagnetic colloidal particles. J. Colloid Interface Sci. 1995, 172, 383–388. [Google Scholar] [CrossRef]
  28. Higashitani, K.; Oshitani, J.; Ohmura, N. Effects of magnetic field on water investigated with fluorescent probes. J. Colloids Surfaces A Physicochem. Eng. Asp. 1996, 109, 167–173. [Google Scholar] [CrossRef]
  29. Higashitani, K.; Oshitani, J. Magnetic effect on the interface between aqueous solution and solid. J. Surf. Sci. Soc. Jpn. 1999, 20, 764–769. [Google Scholar] [CrossRef]
  30. Holysz, L.; Szczes, A.; Chibowski, E. Effects of a static magnetic field on water and electrolyte solutions. J. Colloid Interface Sci. 2007, 316, 996–1002. [Google Scholar] [CrossRef] [PubMed]
  31. Amiri, M.C.; Dadkhah, A.A. On reduction in the surface tension of water due to magnetic treatment. Colloids Surf. A Physicochem. Eng. Asp. 2006, 278, 252–255. [Google Scholar] [CrossRef]
  32. Deng, B.; Pang, X.F. The variations of optical features of water after action of static magnetic-field. Chin. Sci. Bull. 2007, 52, 3179–3182. [Google Scholar] [CrossRef]
  33. Guo, Y.Z.; Yin, D.C.; Cao, H.L.; Shi, J.Y.; Zhang, C.Y.; Liu, Y.M.; Huang, H.H.; Liu, Y.; Wang, Y.; Guo, W.H.; et al. Evaporation rate of water as a function of a magnetic field and field gradient. Int. J. Mol. Sci. 2012, 13, 16916–16928. [Google Scholar] [CrossRef] [PubMed]
  34. Inaba, H.; Saitou, T.; Tozaki, K.; Hayashi, H. Effect of the magnetic field on the melting transition of H2O and D2O measured by a high resolution and supersensitive differential scanning calorimeter. J. Appl. Phys. 2004, 96, 6127–6133. [Google Scholar] [CrossRef]
  35. Szcześ, A.; Chibowski, E.; Hołysz, L.; Rafalski, P. Effects of static magnetic field on water at kinetic condition. Chem. Eng. Process. 2011, 50, 124–127. [Google Scholar] [CrossRef]
  36. De Ninno, A.; Congiu Castellano, A. Influence of magnetic fields on the hydration process of amino acids: Vibrational spectroscopy study of L-phenylalanine and L-glutamine. Bioelectromagnetics 2014, 35, 129–135. [Google Scholar] [CrossRef] [PubMed]
  37. Cai, R.; Yang, H.; He, J.; Zhu, W. The effects of magnetic fields on water molecular hydrogen bonds. J. Mol. Struct. 2009, 938, 15–19. [Google Scholar] [CrossRef]
Figure 1. Differences in the conductivities for 0.05 mmol/L CsCl (ks = 0.088 L/mol) and KCl (ks = 0.166 L/mol) at 1 kHz as a function of time; relative standard error (RSE) was 3.0% and 3.6% for CsCl and KCl, respectively.
Entropy 18 00066 g001
Figure 2. Starting-point conductivities of aqueous solutions of LiCl, KCl, CsCl and MgCl2 at 25 °C and 1 kHz as a function of ks; two sets of solutions with RSE equal to 2.6% and 1.0% were aged for 14 and 16 days, respectively; each dot denotes an average of eight measurements of three replicates.
Entropy 18 00066 g002
Figure 3. Increase in measured conductivity of CsCl, LiCl, KCl and MgCl2 solutions at 25 °C and 1 kHz divided by ionic strength after ageing at pH 7 or 9 (∆σ/Iaged) as a function of ks.
Entropy 18 00066 g003
Table 1. Inert atmosphere—ICP-MS and ICP-OES analysis results after 1 day of ageing of Mq.
IonNaKMgCaSiAlpH
μmol/Lμmol/Lμmol/Lμmol/Lμmol/Lμmol/L/
Average263.91.52.526.60.39
Standard Deviation/0.90.08//0.04/
Table 2. ICP-OES analysis results after 14 days of ageing, increase in measured conductivity in a thermostatic bath at 25 °C and 1 kHz (Δσ), approximate theoretical conductivity (Δσt) and excess conductivity (σE) for preparation aged for 14 days at pH 7.
IonNaKMgCaSiΔσmΔσtσEσ/Iaged
μmol/Lμmol/Lμmol/Lμmol/Lμmol/LμS/cmμS/cmμS/cmS cm2/mol
CsCl80.96.94.58.2807.36.01.341
LiCl76.46.04.47.7856.25.70.536
KCl75.96.94.17.0695.95.60.335
MgCl272.09.24.55.7654.85.4−0.622
Table 3. ICP-OES analysis results after 16 days ageing, increase in measured conductivity in a thermostatic bath at 25 °C and 1 kHz (Δσ), approximate theoretical conductivity (Δσt) and excess conductivity (σE) for preparation aged for 16 days at pH 7.
IonNaKMgCaSiΔσmΔσtσEσ/Iaged
μmol/Lμmol/Lμmol/Lμmol/Lμmol/LμS/cmμS/cmμS/cmS cm2/mol
CsCl78.804.17.7758.85.33.652
LiCl78.804.17.0859.15.24.054
KCl76.604.17.2796.65.11.539
MgCl270.104.15.5605.74.61.127
Table 4. Inert atmosphere—ICP-MS and ICP-OES analyses after 15 days of ageing at pH 9.
IonNaKMgCaSiAlpHOHSi-ions *
μmol/Lμmol/Lμmol/Lμmol/Lμmol/Lμmol/L/μmol/Lμmol/L
CsCl69.610.24.57.5834.38.97.96.6
LiCl69.66.64.57.5964.78.97.97.7
KCl74.08.44.57.5934.78.97.97.4
MgCl265.37.24.510.0703.48.64.02.8
* Si-ions consider estimated (H3SiO4) calculated by Henderson–Hasselbalch Equation; H3SiO4 is taken as the main ionized species present.
Table 5. Inert atmosphere—conductivity results with RSE of 14 parallel cation chloride solutions measured at 25 °C and 1 kHz after preparation (σ0), one (σ1) and fifteen days of aging (σ15). Ionic strength value taken at day 15 (Iaged). Increase in the measured (Δσ) and increase in theoretical conductivity (Δσt), the excess conductivity (σE) calculated from the values at day 15 and day 1 and ∆σ/Iaged.
Ionσ0σ1σ15σ *∆σt **σEIaged ***σ/Iaged
μS/cmμS/cmμS/cmμS/cmμS/cmμS/cmμmol/LS cm2/mol
Cs15.620.9 ± 0.229.1 ± 0.38.24.73.419442
Li11.216.3 ± 0.224.4 ± 0.58.14.83.319641
K14.821.1 ± 0.228.2 ± 0.37.14.72.319636
Mg12.817.8 ± 0.124.3 ± 0.26.54.22.323628
* σ = σ15σ1; ** ∆σt = (theoretical conductivity of all ions in 15 days aged) − (theoretical conductivity of ions after 1 day of ageing of Mq water (see Table 1)); *** Iaged considers all ions in 15 day-aged solutions.

