Article

Analyses of Heart Rate, Respiration and Cardiorespiratory Coupling in Patients with Schizophrenia

1
Department of Medical Engineering and Biotechnology, University of Applied Sciences Jena, Carl-Zeiss-Promenade 2, 07745 Jena, Germany
2
Department of Psychiatry and Psychotherapy, Pain and Autonomics-Integrative Research (PAIR), University Hospital Jena, Philosophenweg 3, 07743 Jena, Germany
*
Author to whom correspondence should be addressed.
Entropy 2015, 17(2), 483-501; https://doi.org/10.3390/e17020483
Submission received: 28 October 2014 / Accepted: 20 January 2015 / Published: 23 January 2015
(This article belongs to the Special Issue Entropy and Cardiac Physics)

Abstract

:
Schizophrenia is a severe mental disorder associated with a significantly increased cardiovascular mortality rate. However, the underlying mechanisms leading to this cardiovascular disease (CVD) are not fully known. Therefore, the objective of this study was to characterize the cardiorespiratory influence by investigating heart rate, respiration and the causal strength and direction of cardiorespiratory coupling (CRC), based mainly on entropy measures. We investigated 23 non-medicated patients with schizophrenia (SZ), comparing them to 23 age- and gender-matched healthy controls (CO). A significantly reduced complexity was found for the heart rate and a significantly increased complexity in respiration and CRC in SZ patients when compared to corresponding measurements from CO (p < 0.001). CRC analyses revealed a clear coupling, with a driver-responder relationship from respiration to heart rate in SZ patients. Moreover, a slight driver-responder relationship from heart rate to respiration could be recognized. These findings lead to the assumption that SZ should be considered to be a high-risk group for CVD. We hypothesize that the varying cardiorespiratory regulation contributes to the increased risk for cardiac mortality. Therefore, regular monitoring of the cardiorespiratory status of SZ is suggested to identify autonomic regulation impairment at an early stage—to develop timely and effective treatment and intervention strategies.

Graphical Abstract

1. Introduction

Schizophrenia is referred to as one of the most severe mental disorders in the world, and patients with this condition are associated with high cardiac mortality rates. These patients have an approximately 15 to 20-year shorter life expectancy and a relatively high risk for attaining cardiovascular disease (CVD); a three-fold increase in comparison to the general population has been reported for all age groups [13]. The largest single cause of death in schizophrenia leading to increased mortality is due to CVD, with CVD mortality ranging from 40% to 50% [4]. Important causal factors are related to lifestyle, the lack of physical activity, smoking, obesity, poor diet, substance abuse, diabetes, hypertension and the cardiac side effects of antipsychotics [1,4,5]. However, there is ample evidence that a dysfunction of the autonomic nervous system (ANS), determined by investigating heart rate variability (HRV), is obviously present in schizophrenia patients. These studies found a vagal withdrawal and a sympathetic predominance for these patients, as well as in part for their healthy first-degree relatives [610].
In addition, recent investigation of respiration and cardiorespiratory coupling (CRC) [1116] has become of great interest for these patients: it is well known that respiration represents an important homeostatic control mechanism (i.e., a sophisticated interplay between the brainstem and higher centers). However, there has until now been no study to our knowledge which has investigated causal coupling, or, along these lines, the causal coupling strength and coupling direction in these patients.
Within the cardiorespiratory system, the effect of heart rate (HR) on breathing rate (BR) is denoted as “respiratory sinus arrhythmia” (RSA). The rhythmic fluctuations of HR in phase to respiration are caused by two major driving mechanisms: (1) the central influence of respiration on vagal cardiac motoneurons; and (2) the impact of respiration on intrathoracic pressure and stroke volume [1720].
For the quantitative analyses of the cardiorespiratory system in univariate and bivariate ways, several linear and nonlinear time series analysis approaches were developed. Studies indeed showed that the coupling between the cardiovascular system and respiration is strongly nonlinear [21]. Therefore, linear methods seem to be inappropriate and not able to fully address physiological regulatory mechanisms within the cardiovascular system. Methods based on entropies have the common feature that they analyze a putative information transfer between time series and address either the uncertainty or predictability of time series. Complexity analysis can be performed by evaluating the entropy and entropy rate. Entropy (e.g., Shannon or Renyi) calculates the degree of complexity of a signal’s sample distribution. The largest entropy is obtained when the distribution is flat (i.e., the samples are identically distributed). On the contrary, if some values are more alike (e.g., the sample distribution is Gaussian), the entropy decreases [22]. However, a limitation of all univariate nonlinear methods is that they are not able to quantify the direct interrelationships such as the nonlinear influence of respiration on HR. Therefore, they have limited power to reveal the underlying physiological mechanisms responsible for changes in cardiorespiratory complexity.
The aim of this study was to characterize HRV, respiratory variability (RESPV) and CRC (strength and direction) as markers of cardiorespiratory function in schizophrenic patients. Therefore, we applied different methods of coupling analyses which could determine causal coupling strength and direction, especially with regard to entropy-based measures. We believe that our results are of great importance since they enhance the understanding of physiological regulation processes in SZ patients and identify at least a subgroup of patients which have a higher risk of developing cardiovascular diseases.

2. Methods

2.1. Data Recordings and Pre-Processing

A high-resolution short-term ECG (at a 1000 Hz sampling frequency) and synchronized calibrated respiratory inductive plethysmography signal [11] (LifeShirt®, Vivometrics, Inc., Ventura, CA, USA) were recorded for 30 min. Investigations were performed between 3 and 6 p.m. in a quiet room which was kept comfortably warm (22–24 °C) and began after subjects had rested in supine position for 10 min. Subjects were asked to relax and to breathe normally to avoid hyperventilation. No further breathing instructions were given. Subjects were explicitly asked not to talk during the recording. The following time series were automatically extracted from the raw data records using in-house software (programming environment Delphi 3):
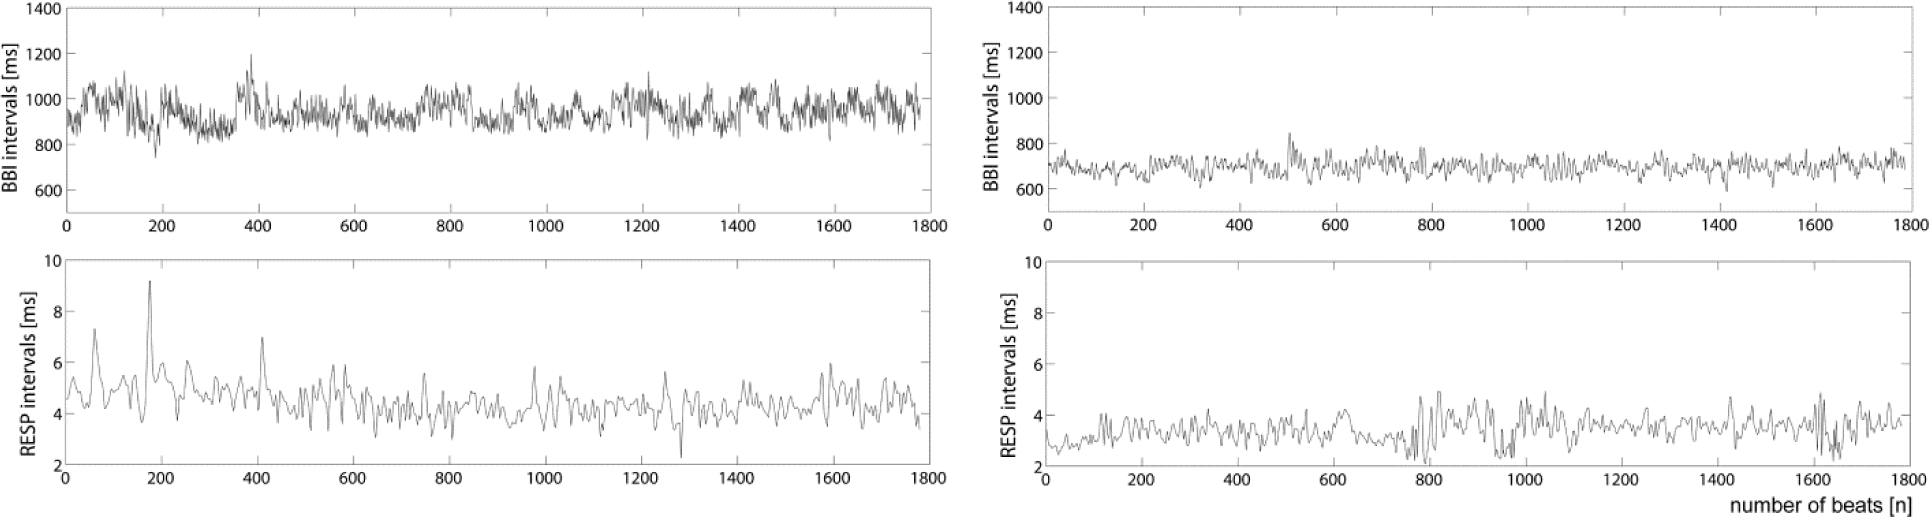
  • – Time series of heart rate consisting of successive beat-to-beat intervals (BBI, tachogram); and
  • – Time series of respiratory frequency (RESP, respirogram) as being the time intervals between consecutive breathing cycles. Figure 1.
For cardiorespiratory coupling analyses, synchronized time series of BBI and RESP were achieved by resampling both time series via a linear interpolation method (2 Hz). All extracted time series were filtered by applying an adaptive variance estimation algorithm to remove and interpolate seldom occurring ventricular premature beats and artefacts (e.g., movement, electrode noise and extraordinary peaks) [23] to obtain normal-to-normal beat time series (NN).

2.2. Methods of Heart Rate Variability and Respiratory Variability

2.2.1. Time and Frequency Domains

Quantification of heart rate variability (HRV) and respiratory variability (RESPV) was performed by calculating several standard parameters from time (TD) and frequency domains (FD) [10]:
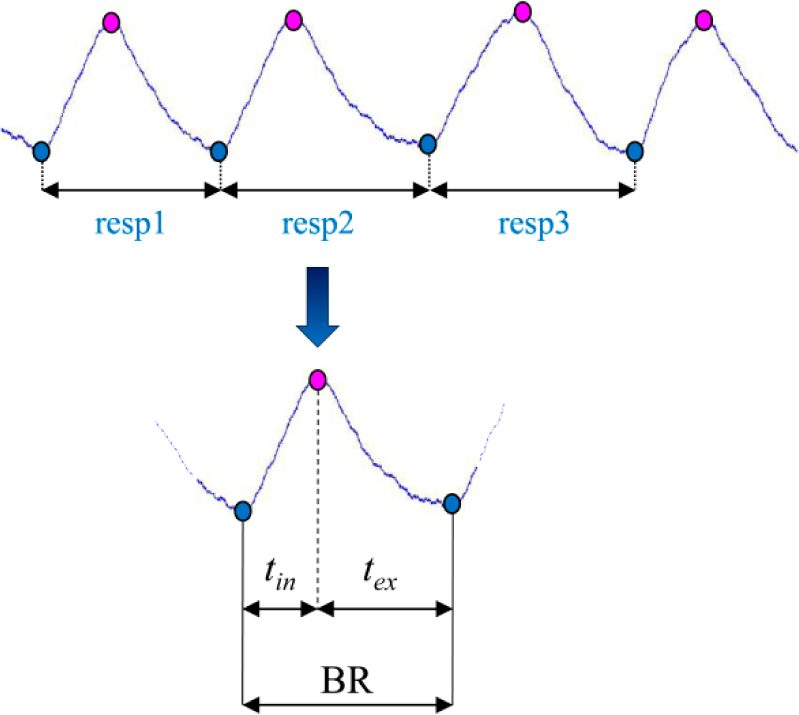
  • – The mean value of the NN intervals (meanNN) of BBI (_BBI, [ms]) and RESP (_RESP, [s]; BR: breathing rate as the number of breaths per minute, [1/min]);
    In addition, inspiration time (tin, [s]) and expiration time (tex, [s]) intervals were determined for each breath (Figure 2).
  • – Standard deviation (sdNN) of the NN intervals of BBI (_BBI, [ms]) and RESP (_RESP, [s]);
  • – Renyi entropy (HRenyi025, [bit]) as generalization of the Shannon entropy quantifies the dispersion of the BBI time series values. The measure of variability is calculated by using the density distribution (histogram) of the NN intervals (class width of 8ms) along with the class probability pi (i = 1, …, k with k as the total number of all classes) (1). The coefficient α determines the manner in which the probabilities of NN intervals of BBI (_BBI) and RESP (_RESP) are weighted (here: α = 0.25) (2).
    H Shannon = i = 1 k p i log 2 p i
    H Renyi ( α ) = 1 1 α log 2 i = 1 k p i α α , α 0
  • – Normalized low-frequency power (0.04–0.15 Hz) [s2] of the NN intervals of BBI LFn_BBI;
  • – Normalized high-frequency power (0.15–0.4 Hz) [s2] of the NN intervals of BBI HFn_BBI;
  • – The ratio between the low- and high-frequency powers of the estimated spectrum LF/HF_BBI [a.u.]. The power spectra of the time series were estimated using the Fast Fourier Transform. To avoid leakage effects, a Blackman Harris window function was applied.

2.2.2. Symbolic Dynamics

The analysis of symbolic dynamics (SD) has been proven to be sufficient for the investigation of complex systems and describes the nonlinear aspects of a time series [24]. First, BBI- and RESP time series were transformed into a symbol sequence of four symbols from the alphabet A = {0, 1, 2, 3} to classify dynamic changes within BBI and RESP. Three successive symbols are defined as a word. The resulting histogram contains the occurrence probability of each single word type within the symbol sequence. Based on these distributions, the Renyi entropy (SDRenyi025, [bit], α = 0.25) of word type probability distribution for BBI (_BBI) and RESP (_RESP) was calculated, the results of which describe the time series’ complexity.

2.2.3. Compression Entropy

1977 Ziv and Lempel [25] introduced a universal algorithm for lossless data compression (LZ77) via string-matching on a sliding window. The compression entropy (HCE) algorithm was introduced as a nonlinear index for describing the complexity of a time series [26]. HCE indicates to which extent time series (BBI, RESP) can be compressed by detecting repetitive sequences. If the length of the compressed text is large (L → ∞), the entropy of the compressed string HCE is determined to be length M of the compressed string divided by the length L of the original time series:
H CE = M L
In this study, we analyzed the NN intervals of BBI and RESP (HCE_BBI, HCE_RESP, [a.u.]) using look-ahead buffer size b = 3 and window length w = 3. HCE = 1 means the highest complexity (i.e., no compression). The lower the HCE value, the lower is the complexity (i.e., a higher compression rate).

2.2.4. Sample Entropy

The term “sample entropy” (SampEn) was introduced by Richman and Moorman [27] as an improvement over the approximate entropy (ApEn), acting as a simple index for the overall complexity and predictability of a time series [28]. SampEn quantifies the conditional probability that two sequences of m consecutive data points being similar to each other (within a given tolerance r) will remain similar when one consecutive point is included. The SampEn algorithm requires the setting of two parameters: the tolerance level r and the pattern length m. In this study SampEn was calculated for the NN intervals of BBI and RESP (SampEn_BBI, SampEn_RESP, [a.u.]); in accordance with previous studies, the tolerance level of r = 0.15 × standard deviation of the time series (BBI, RESP), and m = 2 were selected.

2.3. Methods of Cardiorespiratory Coupling Analyses

2.3.1. High Resolution Joint Symbolic Dynamics Analyses

For nonlinear couplings between BBI and RESP, the high-resolution joint symbolic dynamics (HRJSD, [13]) were applied that are based on the analysis of bivariate dynamic processes using symbols. Thus, the direct analysis of successive signal amplitudes is based on discrete states (symbols) [29]. A bivariate sample vector X of two time series (x: BBI, y: RESP) is transformed into a bivariate symbol vector S with n beat-to-beat values using a priory defined alphabet A = {0, 1, 2}. Increasing values were coded as “2”, decreasing values were coded as “0”, and unchanging (no or little variability) values were coded as “1”, respectively. Subsequently, short words of symbol sequences were formed with a length of three, and the normalized joint probability of the occurrence of each word was estimated from the word distribution density matrix. Based on the word distribution density matrix, the Renyi entropy (HRJSDRenyi025, [bit], α = 0.25), functioning as the measurement of the general complexity of cardiorespiratory coupling, was calculated. High entropy values refer to a higher complexity level in the investigated time series, and vice versa.

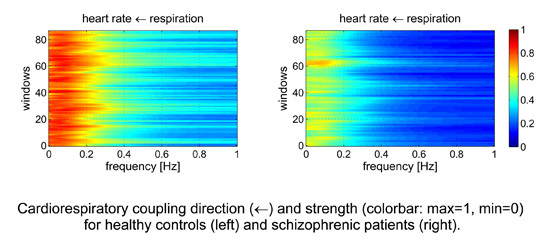
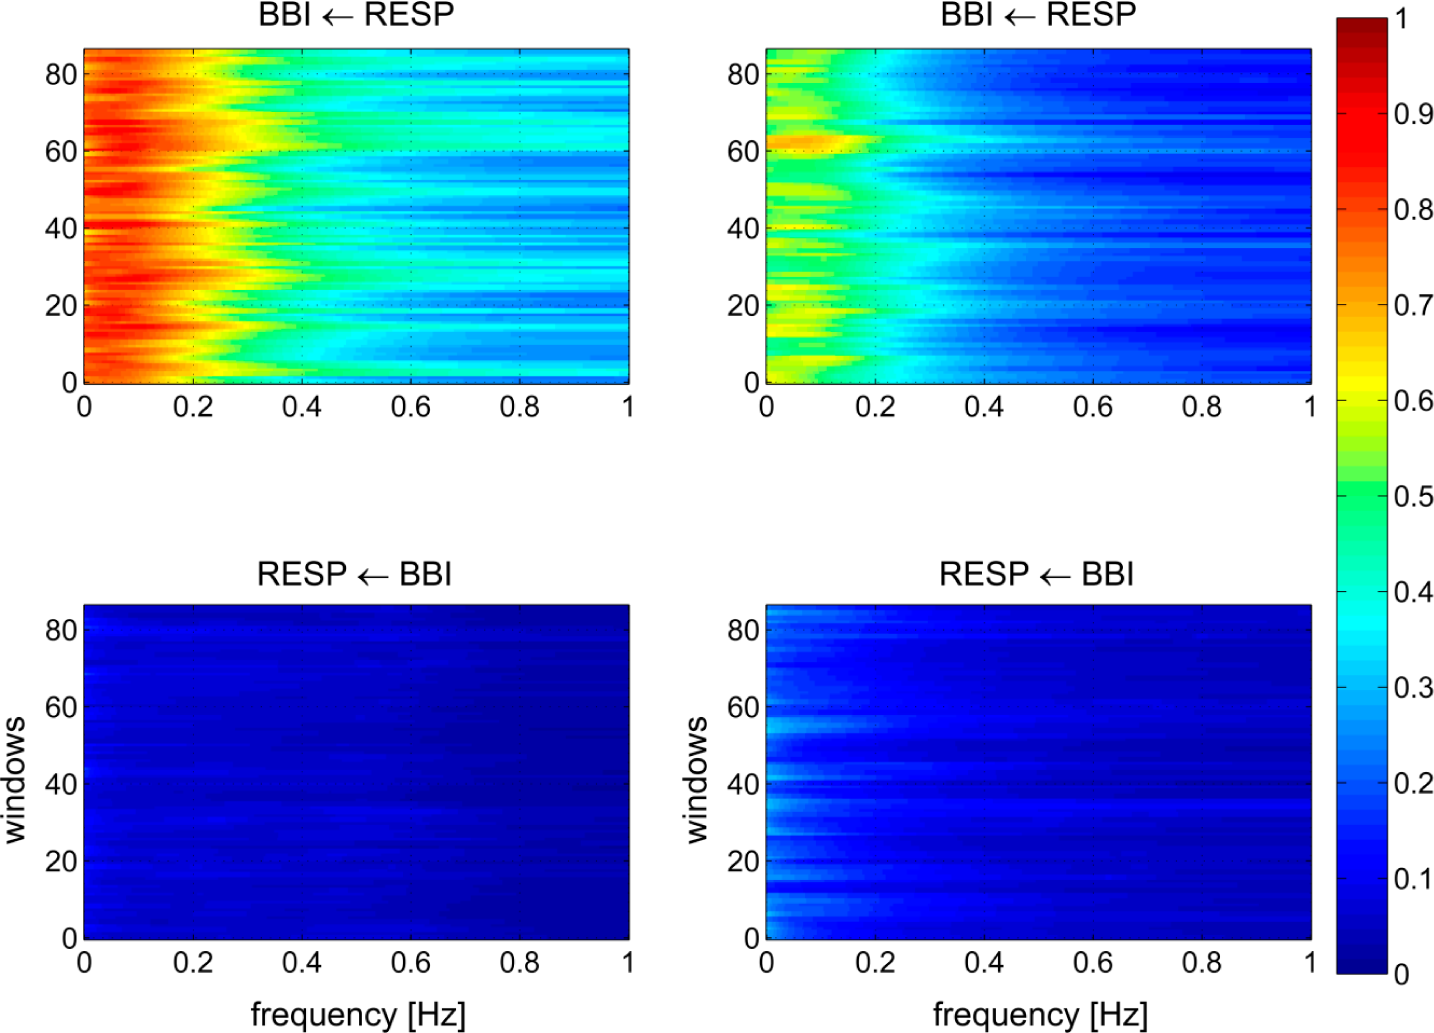
2.3.2. Normalized Short Time Partial Directed Coherence

The partial directed coherence (PDC) method [30] can be used to detect both direct and indirect causal information transfers between complex physiological signals. Due to, that the original introduced PDC method cannot be applied to non-stationary signals a time-variant version is needed providing information about the partial correlative short-time interaction properties. In addition to, Milde et al. [31], the normalized short time partial directed coherence (NSTPDC) was introduced for nonstationary signal to evaluate dynamic coupling changes and to detect the level and direction of couplings in multivariate- and complex dynamic systems [32]. With the view to determining the coupling strength and direction between two time series, x and y, a coupling factor (CF) was proposed. CF was obtained by dividing the mean value of y coupled with x by the mean value of x coupled with y. Afterwards, the results were normalized to a specific set of values leading to the normalized factor (NF). The normalization factor NF determines the strength and the direction of all causal links between a set of multivariate time series as a function of frequency f.
The NF takes the following values: NF = {−2, −1, 0, 1, 2}. Strong unidirectional coupling is indicated if NF is −2 or 2, bidirectional coupling with the determination of the driver-responder relationship if NF = −1 or 1, and equal influence in both directions and no coupling if NF = 0.
In this study, NSTPDC indices were calculated by applying a window (the Hamming window) of lengths l, where l = 80 samples, and a shift of 20 samples (60 samples overlap between each window). In addition to NF, the areas (ABBI→RESP, ARESP→BBI, [a.u.]) for identifying the coupling strength [18] were calculated using a trapezoidal numerical integration function to approximate the areas generated in space by CF values. These indices were used to assess the strength of the cardiorespiratory couplings.
In order to take advantage of the aspect of stationarity for NSTPDC analyses, a normalization (zero mean and unitary variance) of the time series (BBI, RESP) was performed (4). Therefore, each sample i of the BBI- and RESP time series x = {xi, i = 1,…N} and y = {yi i = 1,…N} with N as the maximal number of samples i (temporal index) was first normalized by subtracting the mean of x ¯, then divided by the standard deviation (std) of x or y respectively, thus obtaining the normalized time series xnorm and ynorm with zero mean and unitary variance:
x n o r m ( i ) = x ( i ) x ¯ s t d ( x )

2.3.3. Respiratory Sinus Arrhythmia

Respiratory Sinus Arrhythmia (RSA) represents a measure of cardiac vagal tone characterized by heart rate (BBI) fluctuations that are in phase with inspiration and expiration [33]. RSA is based on the shortening BBI during inspiration and the lengthening of BBI during expiration.
The RSA was quantified in the time domain using the peak-to-valley approach (RSAP2V, [ms]). The LifeShirt® automatically estimated RSA using the peak-to-valley approach for each breathing cycle [34].
In addition, RSA was quantified from the spontaneous respiratory band using an approach based on a complex detrending technique. This approach tends to remove periodic and aperiodic cardiac variations which are unrelated to respiration [34]. This was carried out by filtering the BBI (filtered RSA) in order to remove the variance associated with complex trends and slow sine waves in the supposed respiratory band (0.1–0.6 Hz). These filtered RSA time series were divided in 30 s-epochs for further analyses by applying the Higuchi fractal dimension (HFDRSA) and the Shannon entropy (ShannonRSA). HFD provides a classification of these time series according to their fractal characteristics (morphological structure) and enables the quantification of the complexity level in the underlying rhythm of the investigated signal. For a generated random signal, the fractal dimension tends toward the value of “2”, indicating that the signal is indiscriminately wavering [35]. HFDRSA represents the variation of the dimension of the filtered RSA time series.

2.4. Patients

In this study, 23 non-medicated patients suffering from paranoid schizophrenia (SZ) and 23 healthy control subjects (CO) matching in terms of age and gender (see Table 1) were enrolled. Patients were included only when they had not taken any medication for at least 8 weeks. Serum drug levels were controlled for legal (e.g., antipsychotics, antidepressants, benzodiazepines) and illegal drugs (e.g., cannabis). The diagnosis of paranoid schizophrenia was established when patients fulfilled DSM-IV criteria (Diagnostic and Statistical Manual of Mental Disorders, 4th edition. Psychotic symptoms were quantified using the positive and negative syndrome scale [36]).
A thorough carried out interview and thorough clinical investigation was performed for CO to exclude any potential psychiatric- or other diseases, as well to double-check if there was any interfering medication. The structured clinical interview and a personality inventory (Freiburger Persönlichkeitsinventar) were additionally applied to CO to detect personality traits or disorders which might influence autonomic function [37].
This study complies with the declaration of Helsinki. All participants (SZ, CO) gave written informed consent to a protocol approved by the local ethics committee of the University Hospital Jena.

2.5. Statistics

The nonparametric exact two-tailed Mann-Whitney U-test (SPSS 21.0) was performed to non-normally distributed indices (the significant Kolmogorov-Smirnov test) to evaluate continuous baseline variables as well as differences in autonomic indices between SZ and CO. The significance level was set to p < 0.05 (Bonferroni-Holm adjustment: p < 0.001). In addition, all results were presented as mean ± standard deviation.
Multivariate analysis based on stepwise discriminant analysis in combination with receiver operator characteristic (ROC) curves was applied only to univariate significant indices in order to evaluate differences between SZ and CO. The sensitivity (SENS), specificity (SPEC) and area under the ROC curve (AUC) were determined for univariate significant indices and for sets consisting of two or three significant indices.

3. Results

3.1. Univariate Analyses of Heart Rate Variability, Respiratory Variability and Cardiorespiratory Coupling Analyses

3.1.1. Time- and Frequency Domains

HRV analysis revealed highly significant differences (p < 0.001) in all indices from TD for both groups (see Table 2). Thereby, SZ were characterized by reduced mean basic beat-to-beat intervals (meanNN_BBI) and variability (sdNN_BBI) as well as reduced complexity (HRenyi025_BBI) in comparison to CO. The TD indices achieved values for sensitivity of up to 91.3% (e.g., meanNN_BBI with a value of AUC = 89%), as well as values for specificity of up to 95.7% (HRenyi025_BBI).
All FD indices were significantly different (p < 0.05) between SZ and CO, and revealed values for sensitivity of up to 69.6% (LFn_BBI) and specificity of up to 91.3% (HFn_BBI, LF/HF_BBI) with an AUC of 72%. Variability analyses of RESP in the TD revealed highly significant (p < 0.001) reduced mean breathing rates (meanNN_RESP = 3.2 ± 0.8 s; BR = 18.8 1/min) and highly significant (p < 0.001) reduced inspiration and expiration times in SZ when compared to CO (see Table 2). Inspiration time (tin) revealed values for sensitivity = 78.3%, specificity = 91.3% and AUC = 89%. Expiration time revealed values for sensitivity = 65.2%, specificity = 100% and AUC = 83%.

3.1.2. Nonlinear Domain

SD analysis of BBI revealed highly significantly reduced SDRenyi025_BBI (p < 0.01) in SZ in comparison to CO, whereas with respect to RESP, SDRenyi025_RESP was highly significantly (p < 0.001) increased in SZ in comparison to CO (Table 3). These SD indices achieved values for sensitivity of up to 78.3% (SDRenyi025_RESP) with a maximum value of AUC at 84%, as well as values for specificity of up to 87.0% (SDRenyi025_BBI), with a maximum value of AUC at 73%.
Compression entropy analyses showed only significantly (p < 0.001) reduced values for BBI (HCE_BBI) but not for RESP in SZ. The index HCE_BBI achieved a sensitivity of 69.6%, a specificity of 95.7% and AUC of 84%.
The same characteristics were found for SampEn, whereby SampEn_BBI was highly significantly (p < 0.01) reduced in SZ in comparison to CO with a sensitivity value of 69.6%, a specificity value of 73.9% and a AUC value of 75%.

3.1.3. Cardiorespiratory Coupling Analyses

All cardiorespiratory coupling indices revealed highly significant differences between both groups (see Table 4). HRJSD analysis revealed that SZ were characterized by an increased Renyi entropy (HRJSDRenyi025) value (p < 0.001) when compared to CO. HRJSDRenyi025 achieved values for sensitivity of up to 91.3%, values for specificity = 91.3% and AUC = 95%.
Results of NSTPDC found a highly significant NF (CO: NF = −1.85 ± 0.17; SZ: NF = −1.03 ± 0.80) between both groups. With regard to CO, the NF was nearly −2, indicating a strong unidirectional coupling from RESP → BBI. The NF was nearly −1 for SZ, pointing to a bidirectional coupling with the determination of driver-responder relationship from RESP → BBI. All NSTPDC area indices (ABBI→RESP, ARESP→BBI), functioning as markers for coupling strength, were significantly different (p < 0.001) between SZ and CO. When BBI influenced RESP (ABBI→RESP), SZ revealed an increased value for coupling strength, which was in contrast to CO. On the other hand, when RESP influenced BBI (ARESP→BBI) (RSA mechanisms) SZ revealed a reduced value in comparison to CO (see Figure 3). Using indices from NSTPDC analyses, sensitivity values of 87%, specificity values of 87% and AUC values of 91% could be achieved (NF).
RSA analyses revealed highly significantly decreased RSA (RSAP2V) for SZ when compared to CO. Furthermore, SZ revealed significantly decreased Shannon entropy (ShannonRSA) values and significantly increased fractal characteristics, expressed by the Higuchi fractal dimension (HFDRSA) within the RSA time series. The univariate RSA index RSAP2V reached values of 82.6% for sensitivity, 78.3% for specificity and 87% for AUC.

3.2. Multivariate Analyses of Heart Rate Variability, Respiratory Variability and Cardiorespiratory Coupling Analyses

According to the multivariate discrimination between SZ patients and CO, sets were determined based on univariate indices from HRV, RESPV and CRC analysis which consist of two or three indices each.

3.2.1. Multivariate Discriminant Analysis—Sets of Two Indices

The two optimal sets consisting of two indices were:
  • – meanNN_BBI, SDRenyi025_RESP: sensitivity = 91.3%, specificity = 95.7%, AUC = 97%;
  • – HRJSDRenyi025, meanNN_BBI: sensitivity = 91.3%, specificity = 95.7%, AUC = 96%;
The sets consisting of two indices led to an increase in specificity (+4.3%) and to an increase in AUC (+2%) when compared to the univariate discriminant analysis (best index: HRJSDRenyi025). Sensitivity was not improved.

3.2.2. Multivariate Discriminant Analysis—Sets of Three Indices

The two optimal sets consisting of three indices were:
  • – HRenyi025_BBI, HCE_BBI, ABBI→RESP: sensitivity = 91.3%, specificity = 95.7%, AUC = 98%;
  • – tin, tex, HRJSDRenyi025: sensitivity = 95.7%, specificity = 91.3%, AUC = 97%;
The sets consisting of three indices led only to an increase in sensitivity and specificity (+4.3%) and to an increase in AUC (+3%), in comparison to the single univariate indices (best index: HRJSDRenyi025).
In general, multivariate discriminant analysis only marginally contributed to an enhanced differentiation between SZ and CO regarding sensitivity and specificity.

4. Discussion and Conclusions

In our study, we found a significantly increased heart rate, reduced heart rate variability, increased breathing rates and impaired cardiorespiratory coupling in patients with schizophrenia when compared to healthy subjects. In particular, we could demonstrate the following results using various univariate and bivariate entropy-based measures: heart rate variability was characterized by a reduced complexity level, respiratory variability was characterized by an increased complexity, and cardiorespiratory coupling was reduced in schizophrenic patients.
Our findings are in accordance with other studies that have revealed an altered autonomic tone in schizophrenic patients [6,38]. These results suggest a parasympathetic withdrawal and an ongoing sympathetic predominant activation in cardiac autonomic regulation, highlighted by decreased parasympathetic indices from HRV such as sdNN_BBI, HFn_BBI. Furthermore, it seems that the predominant sympathetic activation (LFn_BBI, LF/HF_BBI) is accompanied by a loss of complexity, as shown by reduced entropy based indices as SDRenyi025_BBI, HCE_BBI and SampEn_BBI. Comparing SampEn with HCE, both have in common that they can be used to determine the complexity of a time series and that they are looking for similar pattern within the time series. However, there are some differences between both methods. Regarding the pattern length for SampEn the length is fixed (m), whereby for HCE the pattern length is flexible according to the look-ahead buffer (b). Moreover, the SampEn algorithm allows a certain tolerance level (r) for pattern matches, whereas HCE looks only for exact pattern matches within the time series. When considering univariate discriminant analysis classification results (see Tables 2 and 3) it could be shown that HRV indices revealed sensitivity of up to 91.3% (meanNN_BBI) with AUC = 89% as well as values for specificity of up to 95.7%, as shown by the complexity indices (HCE_BBI) with a maximum AUC of 84%. One can conclude that basic heart rate and complexity-based HRV indices alone are quite able to differentiate non-medicated schizophrenic patients from healthy subjects.
Porta et al. [39] applied HRV complexity indices (ApEn, SampEn, corrected conditional entropy (CCE)) during a graded head-up tilt test known to produce a gradual shift of the sympathovagal balance toward sympathetic activation and vagal withdrawal in healthy subjects. They found that all indices which measured complexity based on entropy rates (corrected ApEn, SampEn, CCE) revealed a progressive decrease in complexity as a function of the tilt table inclination. This indicates that complexity is under control of the autonomic nervous system. These authors suggested that these indices appear to be suitable global noninvasive indices that indicate a relative balance between parasympathetic and sympathetic modulations. Bär et al. [6] suggested that the reduction in heart rate complexity indicates that heart rate cannot adapt to different requirements arising from posture or exertion, and that the heart is at higher risk of developing arrhythmias in schizophrenic patients. Therefore, it could be assumed that acute psychosis is characterized by a limited capacity to respond to external demands on the autonomic nervous system level. In general, the reduction in cardiac complexity supports the thesis of a changed sympathetic/parasympathetic heart rate control in schizophrenic patients [40]. A reduction of cardiac complexity (i.e., an increase in cardiac regularity) is considered to act as a pathology marker.
Considering respiration and respiratory variability, as well as their complexity, we found, in accordance to previous findings [11,14,15], significantly increased breathing rates and reduced inspiration and expiration times in SZ. Univariate discriminant analysis classification results (see Tables 2 and 3) demonstrate that RESPV indices revealed a sensitivity of up to 78.3% (SDRenyi025_RESP) with AUC = 84% as well values for specificity of up to 100% (tex). A maximum AUC value of 83% is able to differentiate non-medicated schizophrenic patients from healthy subjects.
Homma et al. [41] stated that the final respiratory output involves a complex interaction between the brainstem and higher centers, including the limbic system and cortical structures. Respiration is primarily regulated for metabolic and homeostatic purposes in the brainstem. It also varies in speed in response to changes in emotions, such as happiness, sadness, anxiety or fear. Boiten et al. [42] found that respiration patterns reflect the general dimensions of emotional responses that are linked to the response requirements of emotional situations. The found RESPV alterations can likely be explained in the way that a dysregulation of arousal, as found in paranoid schizophrenia patients’ amygdalae prefrontal circuits, may enhance the correlation of psychopathology and breathing alterations [11]. In contrast to HRV, respiration was characterized by increased entropy indices (SDRenyi025_RESP, SampEn_RESP), describing the complexity and randomness of the respiratory time series. These findings point to an increased respiration irregularity. In this context, Costa et al. [43] showed that pathological dynamics which are associated with an either increased regularity/decreased variability or an increased variability are both characterized by a reduction in complexity due to the loss of correlation properties. It could be shown in any disorder that a small change in respiratory functioning may lead to background symptoms of panic and anxiety. This connection is a result of the link between the central nervous system and the aspect of respiration [44]. It is well proven that schizophrenia is related to panic attacks [45,46], which further supports the altered CRC in SZ. The altered CRC might be at least partly related to panic attacks in the acute psychotic state.
In addition to HRV and RESPV analyses, we could clearly identify a significantly altered cardiorespiratory coupling in patients with schizophrenia (see Table 4). Univariate discriminant analysis classification results demonstrated that CRC indices revealed sensitivity = 91.3% (HRJSDRenyi025) and specificity = 91.3%, with AUC = 95%. These values underscore the ability to differentiate non-medicated schizophrenic patients from healthy subjects.
Furthermore, we found a restricted RSA representing the influence which the respiratory system has on HR regulation, and acting as a measure of impaired cardiac vagal activity. This finding is in accordance with Bär et al. [11], who found impaired cardiorespiratory coupling and reduced RSA in schizophrenia patients. These authors also speculated that decreased vagal activity within the brainstem or vagal activity suppression in higher regulatory centers might account for their findings. The RSA time series were further analyzed by applying the Higuchi fractal dimension (HFDRSA) and the Shannon entropy (ShannonRSA). During this process we found that fractal characteristics (morphological structure) of the RSA signal were increased in schizophrenia. This finding indicates that the underlying rhythm of the RSA signal more randomly fluctuates. This indiscriminately wavering of the RSA time series supports the assumption that the heart rate fluctuations are less in phase with inspiration and expiration in SZ providing the explanation for the lower RSA value (RSAP2V) in SZ in comparison to CO. On the other side, the decreased Shannon entropy (ShannonRSA) value for SZ, pointing toward a lower complexity in the underlying rhythm of the filtered RSA time series. Considering the complexity of CRC we found an increased CRC complexity in the HRJSD results. These findings were characterized by increased Renyi (HRJSDRenyi025) entropy, describing the complexity and randomness of single word types and the deterministic regulatory coupling pattern (HRJSD) occurrences in SZ when compared to CO. In these applications, the Renyi entropy represents a measure of the complexity of a distribution pattern. If in the pattern distribution specific patterns were more frequently presented, or if specific patterns were missing or less frequently presented, a decrease in Renyi entropy with respect to its maximum value, provided by a flat distribution, could be determined [22]. This means that the higher complexity of CRC in schizophrenic patients as compared to healthy subjects is a result of less frequent or missing patterns in bivariate word types and/or coupling patterns. Regarding the results of causal coupling analyses (NSTPDC), we could for the first time demonstrate a different coupling strength and direction for schizophrenic patients in comparison to healthy subjects. We found a NF of approximately −1 in SZ, pointing to a bidirectional coupling, with a driver-responder relationship from RESP → BBI additionally confirming the results of a restricted RSA modulation in schizophrenia. For healthy subjects, we found a NF of approximately −2, indicating a strong unidirectional coupling from RESP → BBI (driver: RESP). This confirms well-working and strongly working RSA mechanisms. When considering coupling strength, SZ reveal a significantly reduced value with regard to coupling direction RESP → BBI (ARESP→BBI) and a significantly increased value with regard to coupling direction BBI → RESP (ABBI→RESP) in comparison to CO. The assumed higher sympathetic drive in SZ were confirmed by findings of Porta et al. [47], who found a reduced cardiopulmonary coupling in healthy subjects that was linked to the degree of sympathetic activation and to a reduction of RSA during a graded head-up tilt protocol. This fact further supports our assumption about a loss of CRC in SZ. The causal coupling from RESP to BBI quantifies the strength of respiratory influences affecting heart rate, independent of arterial pressure changes. Due to this fact, this coupling can be understood as an indication of the central effects of the respiratory drive on the cardiac vagal motor neurons. This reflects a central mechanism underlying respiratory related fluctuations in heart rate [48]. For SZ it means that central respiratory driving mechanisms are diminished with respect to heart rate changes. In contrast to Faes et al. [48] however, we found a significant causal coupling direction BBI → RESP. This characteristic of CRC was also cited by Dick et al. [49], who proposed the reciprocal component of CRC as a bio-marker that complements RSA. This reciprocal interaction between the respiratory and autonomic control systems is manifested by the functioning of gas exchange. This means that, besides the well-recognized respiratory influence on autonomic activity, the autonomic system has an influence on respiratory pattern formation. Whereas the respiratory influence on autonomic activity is breath to breath, the autonomic influence on respiration can be considered in terms of beat to beat [49]. We believe that the manifested alterations in CRC may reflect arousal and a permanent stress situation in acute SZ patients. Riedl et al. [50] could show increased spontaneous cardiorespiratory coordination, the mutual influence of the cardiac and respiratory oscillations on their respective onsets, in epochs of high autonomic stress during sleep apnea.
When considering the multivariate classification results from the discriminant analysis, it could be shown that the optimal set consisting of three indices revealed a slightly higher classification power (AUC = 98%) when compared to the optimal set containing two indices (AUC = 97%) or the univariate indices (AUC = 95%). Based on these results, a clear differentiation between schizophrenic patients and control subjects is possible, particularly due to noninvasive complexity indices of heart rate, respiration and cardiorespiratory coupling. In general, we could successfully demonstrate that a SZ classification is possible based on standard heart rate and respiratory indices (meanNN_BBI: SENS = 91.3%, SPEC = 73.9%, AUC = 89%; tin: SENS = 78.3%, SPEC = 91.3%, AUC = 89%). If CRC complexity indices were used, the classification results could be improved (HRJSDRenyi025: SENS = 91.3%, SPEC = 91.3%, AUC = 95%). This improvement was more obvious when using multivariate discriminant analyses (three indices), which led to an improvement in maximum SENS = 95.7% and maximum SPEC = 95.7% with AUC being 98%. Interestingly, discriminant analyses results revealed a higher influence of respiration (tin, tex) in classifying schizophrenic patients (sensitivity = 95.7%) as opposed to a higher influence of heart rate (HRenyi025_BBI, HCE_BBI) in classifying healthy subjects (specificity = 95.7%). It seems that the classical time- and frequency domain indices, with the exception of meanNN_BBI, played only a minor role in multivariate discriminant analyses sets.
The remaining open questions are: (1) How will antipsychotic medication influence these results; (2) How will psychopathology influence these results; and (3) Which of these schizophrenic patients are at lower or higher risk for cardiovascular disease as their disease progresses?
To conclude, the results of this study lead to the assumption that SZ should indeed be considered as a high risk group for CVD. Entropy based measures from HRV, RESPV and CRC analyses could soon identify those patients who are at a higher risk of developing CVD. Therefore, a regular monitoring of the cardiorespiratory status of SZ is highly recommended to identify a possible impairment of the autonomic regulation process early on, and to develop timely and effective treatment and intervention strategies. At this time, we are just beginning to understand the interrelationship between the cardiorespiratory system in psychotic states and the related brainstem neural networks and control mechanisms.

Acknowledgments

This work was partially supported using grants from the Thuringian Ministry of Economy, Labor and Technology and European fund for regional development (EFRE) 2014KN0018 and by grants from the Ernst-Abbe-Hochschule Jena, University of Applied Sciences.
PACS Codes: 87.18.-h; 87.85.-d; 87.85.Ng; 87.85.fp; 89.70.Cf

Author Contributions

Steffen Schulz analyzed and interpreted the data, drafting the article, final approval of the version to be published. Karl-Jürgen Bär conducted the study, collected and assembled the data, interpreted the data, critically revised the article for significant intellectual content and reread the final version prior to its publication. Andreas Voss interpreted the data, did a critical revision of the article for its significant intellectual content and reread the final version prior to its publication. All authors have read and approved the final manuscript.

Conflicts of Interest

The authors declare that this research was conducted in the absence of any commercial or financial relationships that could be construed as a potential conflict of interest.

References

  1. Hennekens, C.H.; Hennekens, A.R.; Hollar, D.; Casey, D.E. Schizophrenia and increased risks of cardiovascular disease. Am. Heart J 2005, 150, 1115–1121. [Google Scholar]
  2. Laursen, T.M.; Nordentoft, M.; Mortensen, P.B. Excess early mortality in schizophrenia. Ann. Rev. Clin. Psychol. 2014, 10, 425–448. [Google Scholar]
  3. McGrath, J.; Saha, S.; Chant, D.; Welham, J. Schizophrenia: A concise overview of incidence, prevalence, and mortality. Epidemiol. Rev. 2008, 30, 67–76. [Google Scholar]
  4. Ringen, P.A.; Engh, J.A.; Birkenaes, A.B.; Dieset, I.; Andreassen, O.A. Increased mortality in schizophrenia due to cardiovascular disease—A non-systematic review of epidemiology, possible causes, and interventions. Front. Psychiatry. 2014, 5, 137. [Google Scholar]
  5. Straus, S.M.; Bleumink, G.S.; Dieleman, J.P.; van der Lei, J.; ´t Jong, G.W.; Kingma, J.H.; Sturkenboom, M.C.; Stricker, B.H. Antipsychotics and the risk of sudden cardiac death. Arch. Intern. Med. 2004, 164, 1293–1297. [Google Scholar]
  6. Bär, K.J.; Boettger, M.K.; Koschke, M.; Schulz, S.; Chokka, P.; Yeragani, V.K.; Voss, A. Non-linear complexity measures of heart rate variability in acute schizophrenia. Clin. Neurophysiol. 2007, 118, 2009–2015. [Google Scholar]
  7. Bar, K.J.; Letzsch, A.; Jochum, T.; Wagner, G.; Greiner, W.; Sauer, H. Loss of efferent vagal activity in acute schizophrenia. J. Psychiatry Res. 2005, 39, 519–527. [Google Scholar]
  8. Chang, J.S.; Yoo, C.S.; Yi, S.H.; Hong, K.H.; Oh, H.S.; Hwang, J.Y.; Kim, S.G.; Ahn, Y.M.; Kim, Y.S. Differential pattern of heart rate variability in patients with schizophrenia. Prog. Neuropsychopharmacol. Biol. Psychiatry. 2009, 33, 991–995. [Google Scholar]
  9. Valkonen-Korhonen, M.; Tarvainen, M.P.; Ranta-Aho, P.; Karjalainen, P.A.; Partanen, J.; Karhu, J.; Lehtonen, J. Heart rate variability in acute psychosis. Psychophysiology 2003, 40, 716–726. [Google Scholar]
  10. Schulz, S.; Tupaika, N.; Berger, S.; Haueisen, J.; Bär, K.J.; Voss, A. Cardiovascular coupling analysis with high-resolution joint symbolic dynamics in patients suffering from acute schizophrenia. Physiol. Meas. 2013, 34, 883–901. [Google Scholar]
  11. Bär, K.J.; Rachow, T.; Schulz, S.; Bassarab, K.; Haufe, S.; Berger, S.; Koch, K.; Voss, A. The phrenic component of acute schizophrenia—A name and its physiological reality. PLoS One 2012, 7, e33459. [Google Scholar]
  12. Schulz, S.; Bär, K.J.; Voss, A. Cardiovascular and Cardiorespiratory Coupling in Unmedicated Schizophrenic Patients in Comparison to Healthy Subjects, Proceedings of 2012 Annual International Conference of the IEEE Engineering in Medicine and Biology Society (EMBC), San Diego, CA, USA, 28 August–1 September 2012; pp. 3664–3667.
  13. Schulz, S.; Haueisen, J.; Bär, K.J.; Voss, A. Quantification of Cardiorespiratory Coupling in acute Schizophrenia Applying High Resolution Joint Symbolic Dynamics, Proceedings of the Computing in Cardiology Conference (CinC), Zaragoza, Spain, 22–25 September 2013; pp. 101–104.
  14. Schulz, S.; Bär, K.J.; Voss, A. Respiratory variability and cardiorespiratory coupling analyses in patients suffering from schizophrenia and their healthy first-degree relatives. Biomed. Tech. (Berl.) 2012, 57(Suppl. 1), 1044. [Google Scholar]
  15. Peupelmann, J.; Boettger, M.K.; Ruhland, C.; Berger, S.; Ramachandraiah, C.T.; Yeragani, V.K.; Bar, K.J. Cardio-respiratory coupling indicates suppression of vagal activity in acute schizophrenia. Schizophr. Res. 2009, 112, 153–157. [Google Scholar]
  16. Schulz, S.; Haueisen, J.; Bär, K.J.; Voss, A. Changed cardiorespiratory phase-coupling pattern in patients suffering from schizophrenia. Biomed. Tech. (Berl.) 2014, 59, 178. [Google Scholar]
  17. Eckberg, D.L. The human respiratory gate. J. Physiol. 2003, 548, 339–352. [Google Scholar]
  18. Eckberg, D.L. Point: Counterpoint: Respiratory sinus arrhythmia is due to a central mechanism vs. Respiratory sinus arrhythmia is due to the baroreflex mechanism. J. Appl. Physiol. 2009, 106, 1740–1742, discussion 1744. [Google Scholar]
  19. Gilbey, M.P.; Jordan, D.; Richter, D.W.; Spyer, K.M. Synaptic mechanisms involved in the inspiratory modulation of vagal cardio-inhibitory neurones in the cat. J. Physiol. 1984, 356, 65–78. [Google Scholar]
  20. Triedman, J.K.; Saul, J.P. Blood pressure modulation by central venous pressure and respiration. Buffering effects of the heart rate reflexes. Circulation 1994, 89, 169–179. [Google Scholar]
  21. Novak, V.; Novak, P.; de Champlain, J.; le Blanc, A.R.; Martin, R.; Nadeau, R. Influence of respiration on heart rate and blood pressure fluctuations. J. Appl. Physiol. 1993, 74, 617–626. [Google Scholar]
  22. Porta, A.; Guzzetti, S.; Montano, N.; Furlan, R.; Pagani, M.; Malliani, A.; Cerutti, S. Entropy, entropy rate, and pattern classification as tools to typify complexity in short heart period variability series. IEEE Trans. Biomed. Eng. 2001, 48, 1282–1291. [Google Scholar]
  23. Wessel, N.; Voss, A.; Malberg, H.; Ziehmann, C.; Voss, H.; Schirdewan, A.; Meyerfeldt, U.; Kurths, J. Nonlinear analysis of complex phenomena in cardiological data. Z. Herzschr. Elektrophys. 2000, 11, 159–173. [Google Scholar]
  24. Voss, A.; Kurths, J.; Kleiner, H.J.; Witt, A.; Wessel, N.; Saparin, P.; Osterziel, K.J.; Schurath, R.; Dietz, R. The application of methods of non-linear dynamics for the improved and predictive recognition of patients threatened by sudden cardiac death. Cardiovasc. Res. 1996, 31, 419–433. [Google Scholar]
  25. Ziv, J.; Lempel, A. Universal algorithm for sequential data compression. IEEE Trans. Inf. Theory. 1977, 23, 337–343. [Google Scholar]
  26. Baumert, M.; Baier, V.; Haueisen, J.; Wessel, N.; Meyerfeldt, U.; Schirdewan, A.; Voss, A. Forecasting of life threatening arrhythmias using the compression entropy of heart rate. Methods Inf. Med. 2004, 43, 202–206. [Google Scholar]
  27. Richman, J.S.; Moorman, J.R. Physiological time-series analysis using approximate entropy and sample entropy. Am. J. Physiol. Heart Circ. Physiol. 2000, 278, H2039–2049. [Google Scholar]
  28. Pincus, S.M. Approximate entropy as a measure of system complexity. Proc. Natl. Acad. Sci. USA. 1991, 88, 2297–2301. [Google Scholar]
  29. Schulz, S.; Adochiei, F.C.; Edu, I.R.; Schroeder, R.; Costin, H.; Bar, K.J.; Voss, A. Cardiovascular and cardiorespiratory coupling analyses: A review. Philos. Trans. Ser. A Math. Phys. Eng. Sci. 2013, 371, 20120191. [Google Scholar]
  30. Baccala, L.A.; Sameshima, K. Partial directed coherence: A new concept in neural structure determination. Biol. Cybern. 2001, 84, 463–474. [Google Scholar]
  31. Milde, T.; Schwab, K.; Walther, M.; Eiselt, M.; Schelenz, C.; Voss, A.; Witte, H. Time-variant partial directed coherence in analysis of the cardiovascular system. A methodological study. Physiol. Meas. 2011, 32, 1787–1805. [Google Scholar]
  32. Adochiei, F.; Schulz, S.; Edu, I.; Costin, H.; Voss, A. A new normalised short time pdc for dynamic coupling analyses. Biomed. Tech. (Berl.) 2013, 58(Suppl. 1). [Google Scholar] [CrossRef]
  33. Grossman, P.; Stemmler, G.; Meinhardt, E. Paced respiratory sinus arrhythmia as an index of cardiac parasympathetic tone during varying behavioral tasks. Psychophysiology 1990, 27, 404–416. [Google Scholar]
  34. Grossman, P.; van Beek, J.; Wientjes, C. A comparison of three quantification methods for estimation of respiratory sinus arrhythmia. Psychophysiology 1990, 27, 702–714. [Google Scholar]
  35. Doyle, T.L.; Dugan, E.L.; Humphries, B.; Newton, R.U. Discriminating between elderly and young using a fractal dimension analysis of centre of pressure. Int. J. Med. Sci. 2004, 1, 11–20. [Google Scholar]
  36. Kay, S.R.; Fiszbein, A.; Opler, L.A. The positive and negative syndrome scale (panss) for schizophrenia. Schizophr. Bull. 1987, 13, 261–276. [Google Scholar]
  37. LeBlanc, J.; Ducharme, M.B.; Thompson, M. Study on the correlation of the autonomic nervous system responses to a stressor of high discomfort with personality traits. Physiol. Behav. 2004, 82, 647–652. [Google Scholar]
  38. Mujica-Parodi, L.R.; Yeragani, V.; Malaspina, D. Nonlinear complexity and spectral analyses of heart rate variability in medicated and unmedicated patients with schizophrenia. Neuropsychobiology 2005, 51, 10–15. [Google Scholar]
  39. Porta, A.; Gnecchi-Ruscone, T.; Tobaldini, E.; Guzzetti, S.; Furlan, R.; Montano, N. Progressive decrease of heart period variability entropy-based complexity during graded head-up tilt. J. Appl. Physiol. 2007, 103, 1143–1149. [Google Scholar]
  40. Voss, A.; Schulz, S.; Schroeder, R.; Baumert, M.; Caminal, P. Methods derived from nonlinear dynamics for analysing heart rate variability. Philos. Trans. A Math. Phys. Eng. Sci. 2009, 367, 277–296. [Google Scholar]
  41. Homma, I.; Masaoka, Y. Breathing rhythms and emotions. Exp. Physiol. 2008, 93, 1011–1021. [Google Scholar]
  42. Boiten, F.A.; Frijda, N.H.; Wientjes, C.J. Emotions and respiratory patterns: Review and critical analysis. Int. J. Psychophysiol. 1994, 17, 103–128. [Google Scholar]
  43. Costa, M.; Goldberger, A.L.; Peng, C.K. Multiscale entropy analysis of complex physiologic time series. Phys. Rev. Lett. 2002, 89, 068102. [Google Scholar]
  44. Weiden, P.J.; Weiden, M. Schizophrenia and respiratory symptoms: A serious, but overlooked, comorbidity. CNS Spectr 2010, 15, 10–13. [Google Scholar]
  45. Goodwin, R.; Lyons, J.S.; McNally, R.J. Panic attacks in schizophrenia. Schizophr. Res. 2002, 58, 213–220. [Google Scholar]
  46. Buckley, P.F.; Miller, B.J.; Lehrer, D.S.; Castle, D.J. Psychiatric comorbidities and schizophrenia. Schizophr. Bull. 2009, 35, 383–402. [Google Scholar]
  47. Porta, A.; Bassani, T.; Bari, V.; Tobaldini, E.; Takahashi, A.C.; Catai, A.M.; Montano, N. Model-based assessment of baroreflex and cardiopulmonary couplings during graded head-up tilt. Comput. Biol. Med. 2012, 42, 298–305. [Google Scholar]
  48. Faes, L.; Nollo, G.; Porta, A. Information domain approach to the investigation of cardio-vascular, cardio-pulmonary, and vasculo-pulmonary causal couplings. Front. Physiol. 2011, 2. [Google Scholar] [CrossRef]
  49. Dick, T.E.; Hsieh, Y.H.; Dhingra, R.R.; Baekey, D.M.; Galan, R.F.; Wehrwein, E.; Morris, K.F. Cardiorespiratory coupling: Common rhythms in cardiac, sympathetic, and respiratory activities. Prog. Brain Res 2014, 209, 191–205. [Google Scholar]
  50. Riedl, M.; Muller, A.; Kraemer, J.F.; Penzel, T.; Kurths, J.; Wessel, N. Cardio-respiratory coordination increases during sleep apnea. PLoS One 2014, 9, e93866. [Google Scholar]
Figure 1. Examples of extracted 30-min time series: Tachograms (BBI, upper panel) and respirograms (RESP, lower panel) from a control (CO, healthy subject) (left) and a non-medicated patient with paranoid schizophrenia (SZ) (right). Note the typical lower variability in BBI sequences in the patient suffering from paranoid schizophrenia. Healthy control: meanNN_BBI = 942 ± 60 ms, meanNN_RESP = 4.5 ± 0.7 s; schizophrenic patient: meanNN_BBI = 711 ± 36 ms, meanNN_RESP = 3.4 ± 0.5 s.
Entropy 17 00483f1
Figure 2. Extraction of respiratory variability (RESPV) indices from the respiratory raw data file (respirogram: resp1, resp2, resp3,…; BR: breathing rate; tin: inspiration time; tex: expiration time).
Entropy 17 00483f2
Figure 3. NSTPDC plots for cardiorespiratory coupling analyses for schizophrenic patients (right) and healthy subjects (left). Arrows indicating the causal coupling direction from one time series to another time series, e.g., BBI ← RESP, indicating the causal link from RESP to BBI. Coupling strength ranges from blue (no coupling, 0) to red (maximum coupling, 1) where BBI: beat-to-beat intervals, RESP: time intervals between consecutive breathing cycles.
Entropy 17 00483f3
Table 1. Clinical and demographic data of enrolled study participants.
DataHealthy subjects
(CO)
Schizophrenic patients
(SZ)
Number of participants2323
Gender (male/female)13/1012/11
Age (mean ± std in years)30.3 ± 9.530.4 ± 10.3
PANSS, mean (min-max)n.a.85.7 (43–124)
SANS, mean (min-max)n.a.49.6 (14–81)
SAPS, mean (min-max)n.a.60.9 (6–108)
Psychotic symptoms for acute schizophrenia were quantified using the Scale for the Assessment of Positive Symptoms (SAPS) and negative symptoms (SANS) and positive and negative syndrome scales (PANSS); n.a. not applicable.
Table 2. Univariate statistical analysis results of heart rate- and respiratory variability in the time and frequency domains to discriminate between patients suffering from paranoid schizophrenia (SZ) and healthy subjects (CO).
IndexpCOSZSENSSPECAUC
mean±stdmean±std
TD_BBImeanNN_BBI [ms]***954.5±128.0741.2±112.591.373.90.89
sdNN_BBI [ms]**61.3±19.943.0±16.165.291.30.78
HRenyi025_BBI [bit]***5.26±0.564.80±0.5356.595.70.78
FD_BBILFn_BBI [s2]*0.54±0.200.69±0.1269.673.90.72
HFn_BBI [s2]*0.46±0.200.31±0.1252.291.30.72
LF/HF_BBI [a.u.]*1.74±1.572.94±2.2852.291.30.72
TD_RESPmeanNN_RESP [s]***4.53±1.543.20±0.8069.691.30.83
sdNN_RESP [s]n.s.0.92±0.500.87±0.6443.582.60.58
tin [s]***1.87±0.471.35±0.2378.391.30.89
tex [s]***2.50±1.001.65±0.4965.2100.00.83
BBI—beat-to-beat intervals, RESP—time intervals between consecutive breathing cycles, TD—time domain, FD—frequency domain, meanNN—mean value of the NN intervals of BBI and RESP, sdNN—standard deviation of the NN intervals of BBI and RESP, HRenyi025—Renyi entropy, HFn—normalized high frequency power (0.15–0.4 Hz), LFn—normalized low frequency power (0.04–0.15 Hz), tin—inspiration time, tex—expiration time, SENS—sensitivity, SPEC—specificity, AUC—area under the ROC curve, mean value ± standard deviation, p—univariate significance (* p < 0.05, ** p < 0.01, *** p < 0.001, n.s. —not significant, a.u. —arbitrary units).
Table 3. Univariate statistical analysis results of heart rate- and respiratory variability in the nonlinear complexity domain to discriminate between patients suffering from paranoid schizophrenia (SZ) and healthy subjects (CO).
IndexpCOSZSENSSPECAUC
mean±stdmean±std
SDSDRenyi025_BBI [a.u.]**3.74±0.373.47±0.3756.587.00.73
SDRenyi025_RESP [a.u.]***3.23±0.153.47±0.1978.378.30.84
HCEHCE_BBI [a.u.]***0.82±0.100.69±0.1069.695.70.84
HCE_RESP [a.u.]n.s.0.59±0.080.59±0.1256.543.50.45
SampEnSampEn_BBI [bit]**2.29±0.301.96±0.4769.673.90.75
SampEn_RESP [bit]n.s.1.32±0.371.49±0.5056.578.30.62
BBI—beat-to-beat intervals, RESP—time intervals between consecutive breathing cycles, SD—symbolic dynamics, HCE—compression entropy, SampEn—sample entropy, SENS—sensitivity, SPEC—specificity, AUC—area under the ROC curve, mean value ± standard deviation, p—univariate significance (* p < 0.05, ** p < 0.01, *** p < 0.001, n.s.—not significant, a.u.—arbitrary units).
Table 4. Univariate statistical analysis results of cardiorespiratory coupling analyses to discriminate between patients suffering from paranoid schizophrenia (SZ) and healthy subjects (CO).
IndexpCOSZSENSSPECAUC
mean±stdmean±std
HRJSDRenyi025 [bit]***4.06±0.114.37±0.1591.391.30.95
NSTPDCNF [a.u.]***−1.85±0.17−1.03±0.8087.087.00.91
ABBI→RESP [a.u.]***0.05±0.020.09±0.0491.365.20.83
ARESP→BBI [a.u.]***0.47±0.090.29±0.1291.365.20.88
RSARSAP2V [ms]***125.9±74.236.5±25.482.678.30.87
ShannonRSA [bit]***2.41±0.052.36±0.0487.065.20.82
HFDRSA [a.u.]**1.14±0.031.19±0.0560.982.60.75
BBI—beat-to-beat intervals, RESP—time intervals between consecutive breathing cycles, HRJSD—high resolution joint symbolic dynamics, NSTPDC—normalized short time partial directed coherence, NF—normalization factor; Shannon—Shannon entropy, A—Area from NSTPDC for identifying the coupling strength, RSA—respiratory sinus arrhythmia, P2V—peak-to-valley, HFD - Higuchi fractal dimension, SENS—sensitivity, SPEC—specificity, AUC—area under the ROC curve, mean value ± standard deviation, p—univariate significance (* p < 0.05, ** p < 0.01, *** p < 0.001, n.s.—not significant, a.u.—arbitrary units).

