Article

Analysis of EEG via Multivariate Empirical Mode Decomposition for Depth of Anesthesia Based on Sample Entropy

1
School of Mechanical and Electronic Engineering, Wuhan University of Technology, Wuhan 430070, China
2
School of Information Engineering, Wuhan University of Technology, Wuhan 430070, China
3
Department of Anesthesiology, College of Medicine, National Taiwan University, Taipei 100, Taiwan
4
Department of Anesthesiology, Far Eastern Memorial Hospital, Ban-Chiao 220, Taiwan
5
School of Engineering and Design, Brunel University, London UB8 3PH, UK
6
Department of Mechanical Engineering, Yuan Ze University, 135, Yuan-Tung Road, Chung-Li 32003, Taiwan
7
Center for Dynamical Biomarkers and Translational Medicine, National Central University, Chung-Li 32001, Taiwan
*
Author to whom correspondence should be addressed.
Entropy 2013, 15(9), 3458-3470; https://doi.org/10.3390/e15093458
Submission received: 15 July 2013 / Revised: 6 August 2013 / Accepted: 27 August 2013 / Published: 30 August 2013

Abstract

:
In monitoring the depth of anesthesia (DOA), the electroencephalography (EEG) signals of patients have been utilized during surgeries to diagnose their level of consciousness. Different entropy methods were applied to analyze the EEG signal and measure its complexity, such as spectral entropy, approximate entropy (ApEn) and sample entropy (SampEn). However, as a weak physiological signal, EEG is easily subject to interference from external sources such as the electric power, electric knives and other electrophysiological signal sources, which lead to a reduction in the accuracy of DOA determination. In this study, we adopt the multivariate empirical mode decomposition (MEMD) to decompose and reconstruct the EEG recorded from clinical surgeries according to its best performance among the empirical mode decomposition (EMD), the ensemble EMD (EEMD), and the complementary EEMD (CEEMD) and the MEMD. Moreover, according to the comparison between SampEn and ApEn in measuring DOA, the SampEn is a practical and efficient method to monitor the DOA during surgeries at real time.

1. Introduction

Electroencephalography (EEG) is a technique used to evaluate the absence of cerebral cortex function for monitoring the depth of anesthesia (DOA) in clinical surgeries. Furthermore, different methods have been proposed to analyze the EEG signal [1,2,3] that reveal the relationship between the EEG signals and the level of consciousness of patients. Specifically, the development of entropy methods in the last two decades has contributed to the analysis and application of this type of physiological signals. For instance, the bispectral index (BIS), response entropy (RE) and state entropy (SE) of EEG have already been integrated into the monitoring devices for measuring DOA of patients in the operating theatre and intensive care units [4,5,6].
However, the non-invasively detected EEG signals from the forehead of the human body are mixed with signals from external interferences such as the electric power, electric knives and other electrophysiological signal sources like electromyography (EMG), electrocardiography (ECG), electrooculography (EOG), etc. Such interferences cause serious difficulties in obtaining pure EEG signals during surgeries because of their non-linear and non-stationary nature. In view of this characteristic, a series of detection methods based on empirical mode decomposition (EMD) [7,8] were proposed for acquiring the intrinsic structure from the original EEG (oEEG) signals. Since EMD [9] has become a reconstruction tool for the decomposition and time-frequency analysis of non-stationary time series, several extensions of it were developed, such as the ensemble empirical-mode decomposition (EEMD) which largely addresses the mode mixing problem in the EMD method [10]; the complementary ensemble empirical mode decomposition (CEEMD) by which the impact of the residual noise in the EEMD is eliminated [11]; and the multivariate EMD (MEMD) [12] which increases the number of variants for signals detected by the multiple channels. More recently, the noise-assisted MEMD (N-A MEMD) was proposed as a practical tool for extracting the pure EEG signals from the EOG through adding extra channels containing multivariate independent white noise [13].
In previous study [14,15,16,17], the approximate entropy (ApEn) and the sample entropy (SampEn) were proposed to monitor the DOA of patients during surgeries, which showed that the SampEn is more adaptive to the real time detection. Although both methods are disturbed by the interferences mentioned above, the series of extended EMD methods should be sufficient to reconstruct the EEG signals for better determination of DOA. This paper is organized as follows: the various analysis methods such as the ApEn and the SampEn, and the EMD, EEMD, CEEMD and N-A MEMD employed in this study are described in the next section. The third section shows a comparison of the EMD, EEMD, CEEMD and N-A MEMD applied to complex simulated signals and practical EEG signals. Then compared results are presented that ApEn and SampEn of detected and analyzed EEG recordings from patients during general anesthesia are calculated before and after EEG signal filtered via N-A MEMD algorithm. Finally, discussion of the results and future work are presented in section four with the conclusions.

2. Methods

2.1. Approximate Entropy and Sample Entropy

Pincus [18] proposed the ApEn for measuring the signal regularity through the statistical analysis of the presence of similar patterns in the time series with the fixed length N. The regularity parameter in computation of ApEn involves a tolerance r and the regularity of patterns by comparing them within a given pattern of length m, so it is described as ApEn(m, r, N). However, there are some obstacles in the analysis of irregular time series such that: (1) it strongly depends on the record length; (2) it is affected by a bias effect because of self-counting. Therefore, Richman and Moorman [19] developed an improvement of the ApEn algorithm, named SampEn, in order to remove some of the deficiencies mentioned above. Its parameters are the same as ApEn, so it is also expressed as SampEn(m, r, N). The differences with respect to ApEn are: (1) self-matching is deleted; (2) the first N-m vectors of the length are only chosen in time series; and (3) the conditional probabilities are not estimated in a template manner. Thus, the probability measure is computed directly as the logarithm of conditional probability instead of the ratio of the logarithmic sums. Richman and Moorman [19] compared the ApEn with the SampEn in the dependency on the length of time series, the results show that the ApEn is much slower than SampEn in the speed of stability convergence because of its reliance on the length N. Therefore, even though the application of ApEn to clinical recordings often obtains good results, SampEn is more suitable in real time analysis of physiological signals and acquisition of general information about the regularity and the persistence of those signals.

2.2. The Extended EMD Methods

The EMD [3] is an adaptive method for non-linear, non-stationary data analysis based on the intrinsic characteristics of time series. In the EMD method, the original signal X(t) is decomposed in terms of Intrinsic Mode Functions (IMFs), ci , expressed as follows:
X ( t ) = i = 1 n c i + r n
where rn is the residue of X(t). The IMFs are simple oscillatory functions with varying amplitude and frequency. Therefore, they are suitable for analysis in both the time and frequency domains simultaneously. For complicated data, the biggest problem of EMD is the mode mixing caused by the intermittency of signals, which renders the EMD unstable. To alleviate this drawback, the EEMD was proposed [10], in which the corresponding IMFs are the mean of an ensemble of trials, each consisting of the original signal plus a white noise of finite amplitude. With the help of white noise addition, the EEMD provides a great improvement to the EMD and largely eliminates the impact of mode mixing. However, there are deviations from IMFs because the IMFs in EEMD are mean values. Besides, the EEMD bears the noise in the residue while reconstructing the signals. Therefore, the CEEMD utilizes paired positive and negative white noise to add into the original signals, and the final IMFs are the ensemble of both the IMFs with positive and negative noise after processing by the EEMD, which effectively reduces the final white noise residue [11]. Recently, the MEMD was proposed to extend the application of EMD to multivariate time series [12]. It firstly projects the multivariate signal along different directions to generate multiple multidimensional envelopes. These envelopes are then averaged to obtain the local mean, and IMFs are acquired through subtracting the local mean from the projections of the multivariate signal in each direction. Moreover, the noise-assisted method based on the MEMD [13] is a useful approach to alleviate the mode-mixing problem and reconstruct EEG (rEEG) signals. In this study, the EMD, EEMD, CEEMD and N-A MEMD are applied to decompose and reconstruct the EEG signals collected during surgeries for further analysis of DOA.

2.3. Statistical Analysis

The calculated SampEn, ApEn and the values of derived parameters, including EEG and RE/SE index, obtained from the whole surgery were used for statistical analysis. Outcome groups were further dichotomized into oEEG and rEEG by the extended EMD methods, as well as SampEn, ApEn and RE/SE. Statistical analysis was performed using SPSS 13.0 (IBM). Data were expressed as mean ± SD, and compared through Wilcoxon non-parametric test or test of Pearson’s correlation where appropriate. Wilcoxon non-parametric test was used to compare the oEEG with rEEG for each EMD method. P < 0.05 is considered to represent a significant difference. The test of Pearson’s correlation was employed to estimate the linear correlation between SampEn, ApEn and RE/SE. If the significance level (α) is less than 0.05, then the correlation is significant and the two variables are linearly related.

3. Results

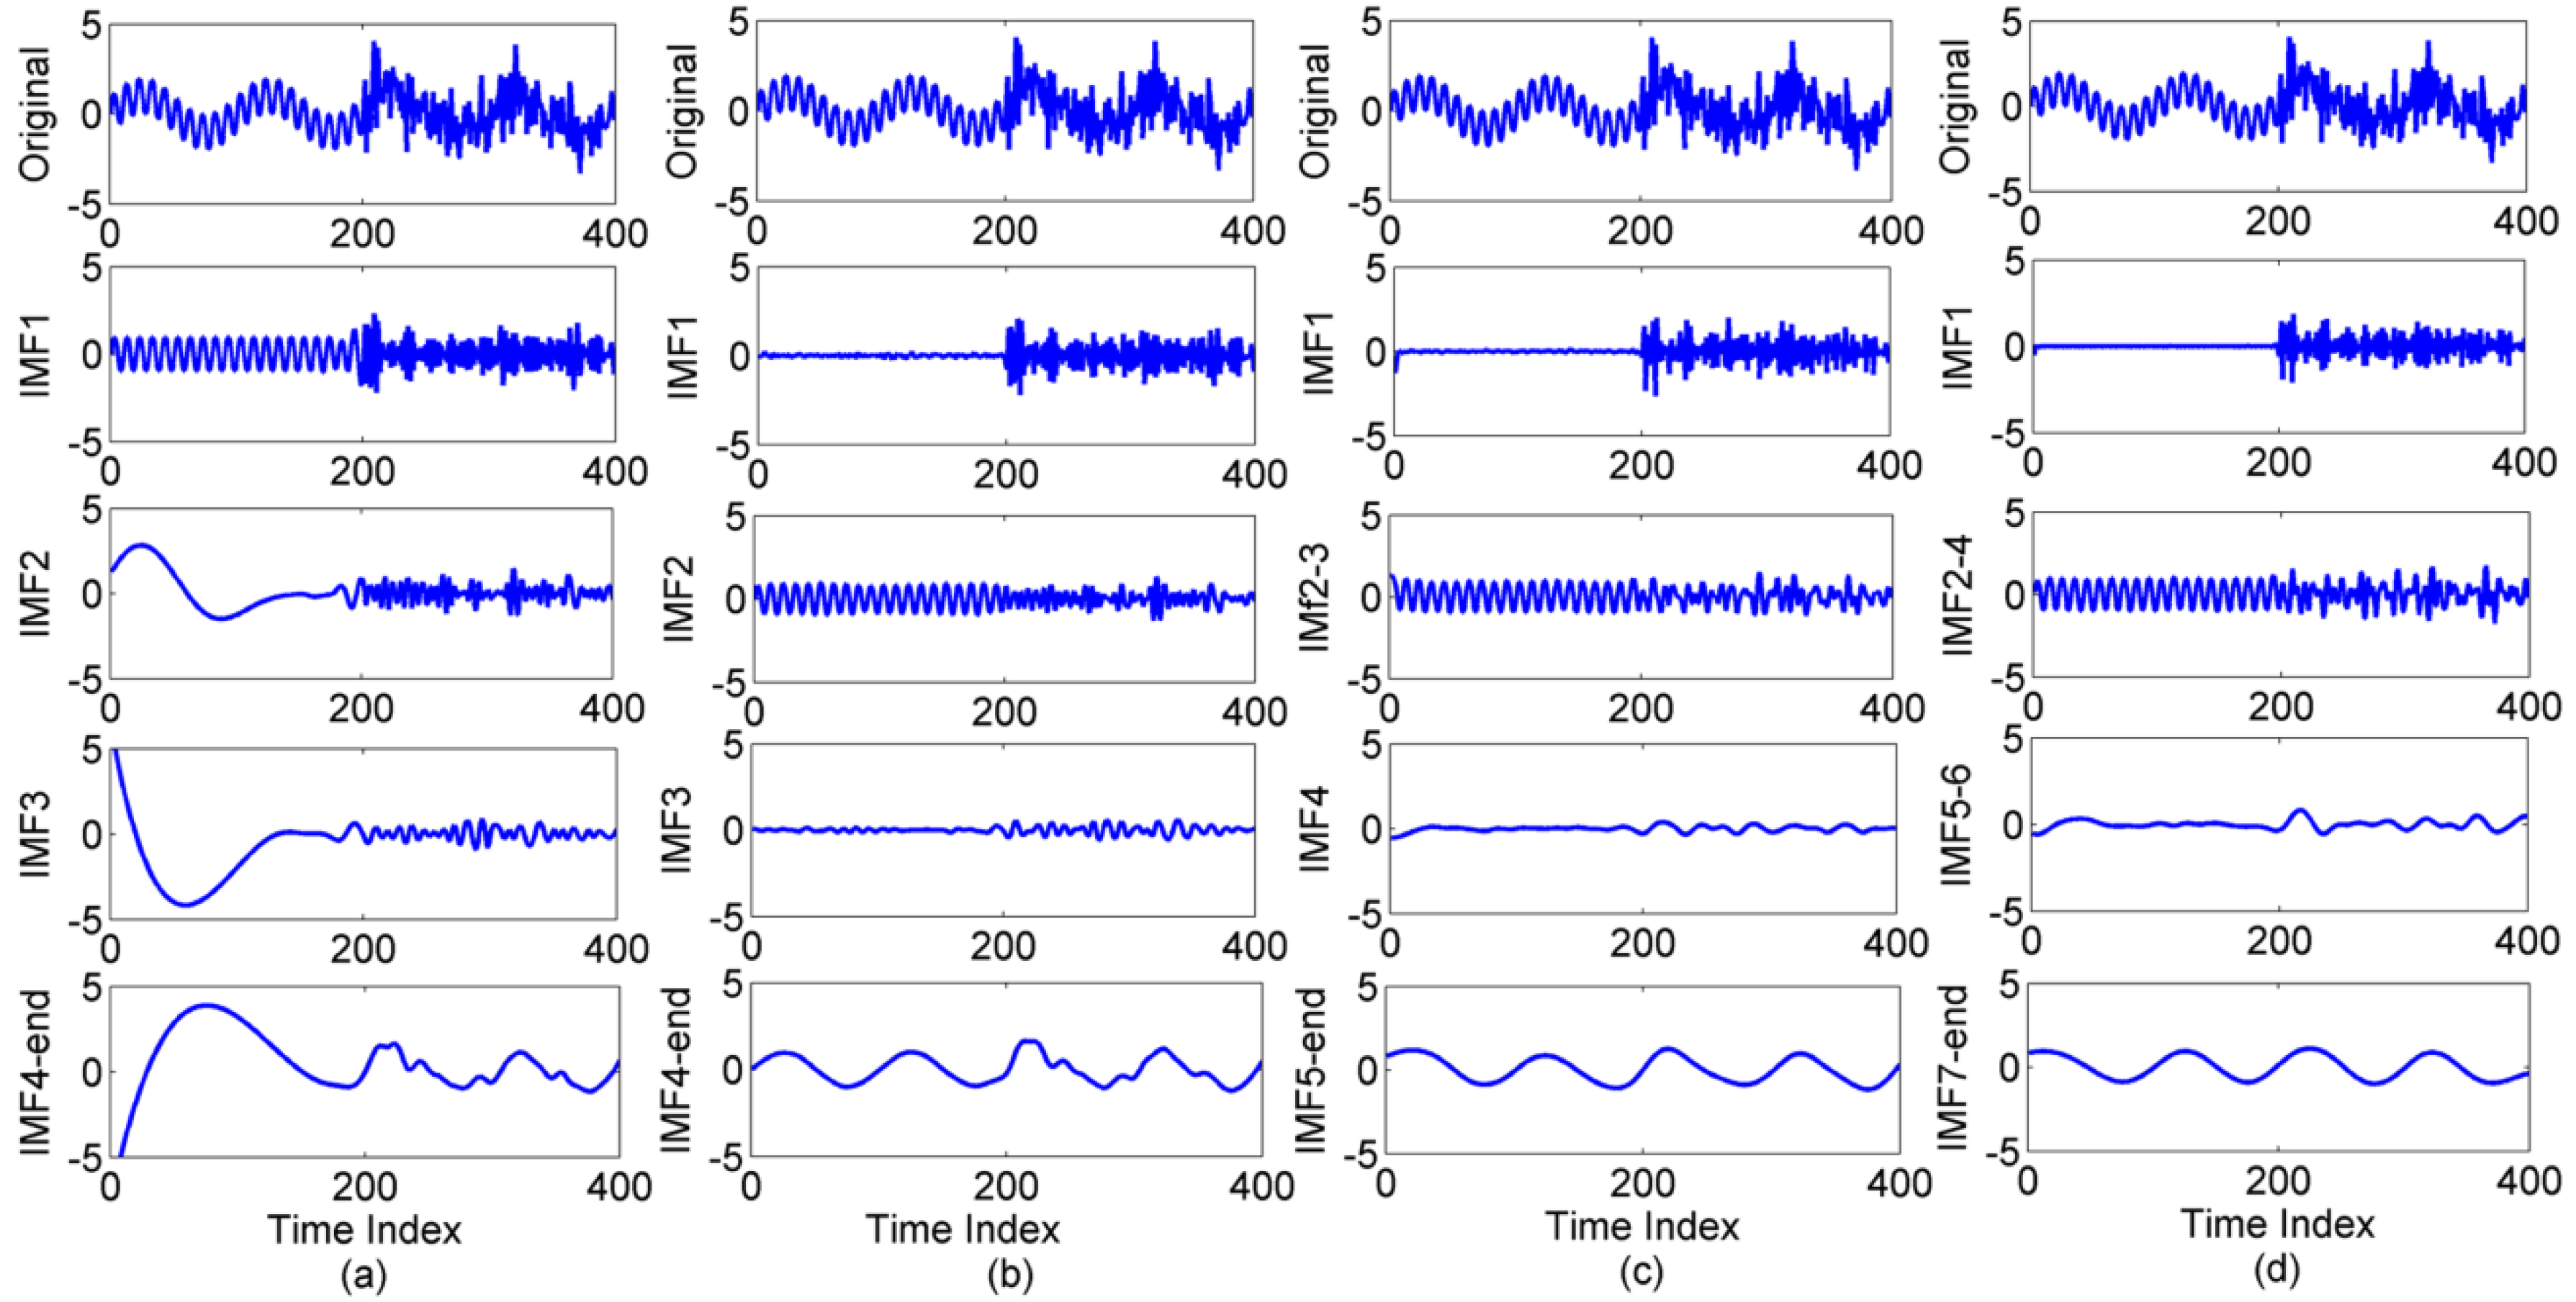
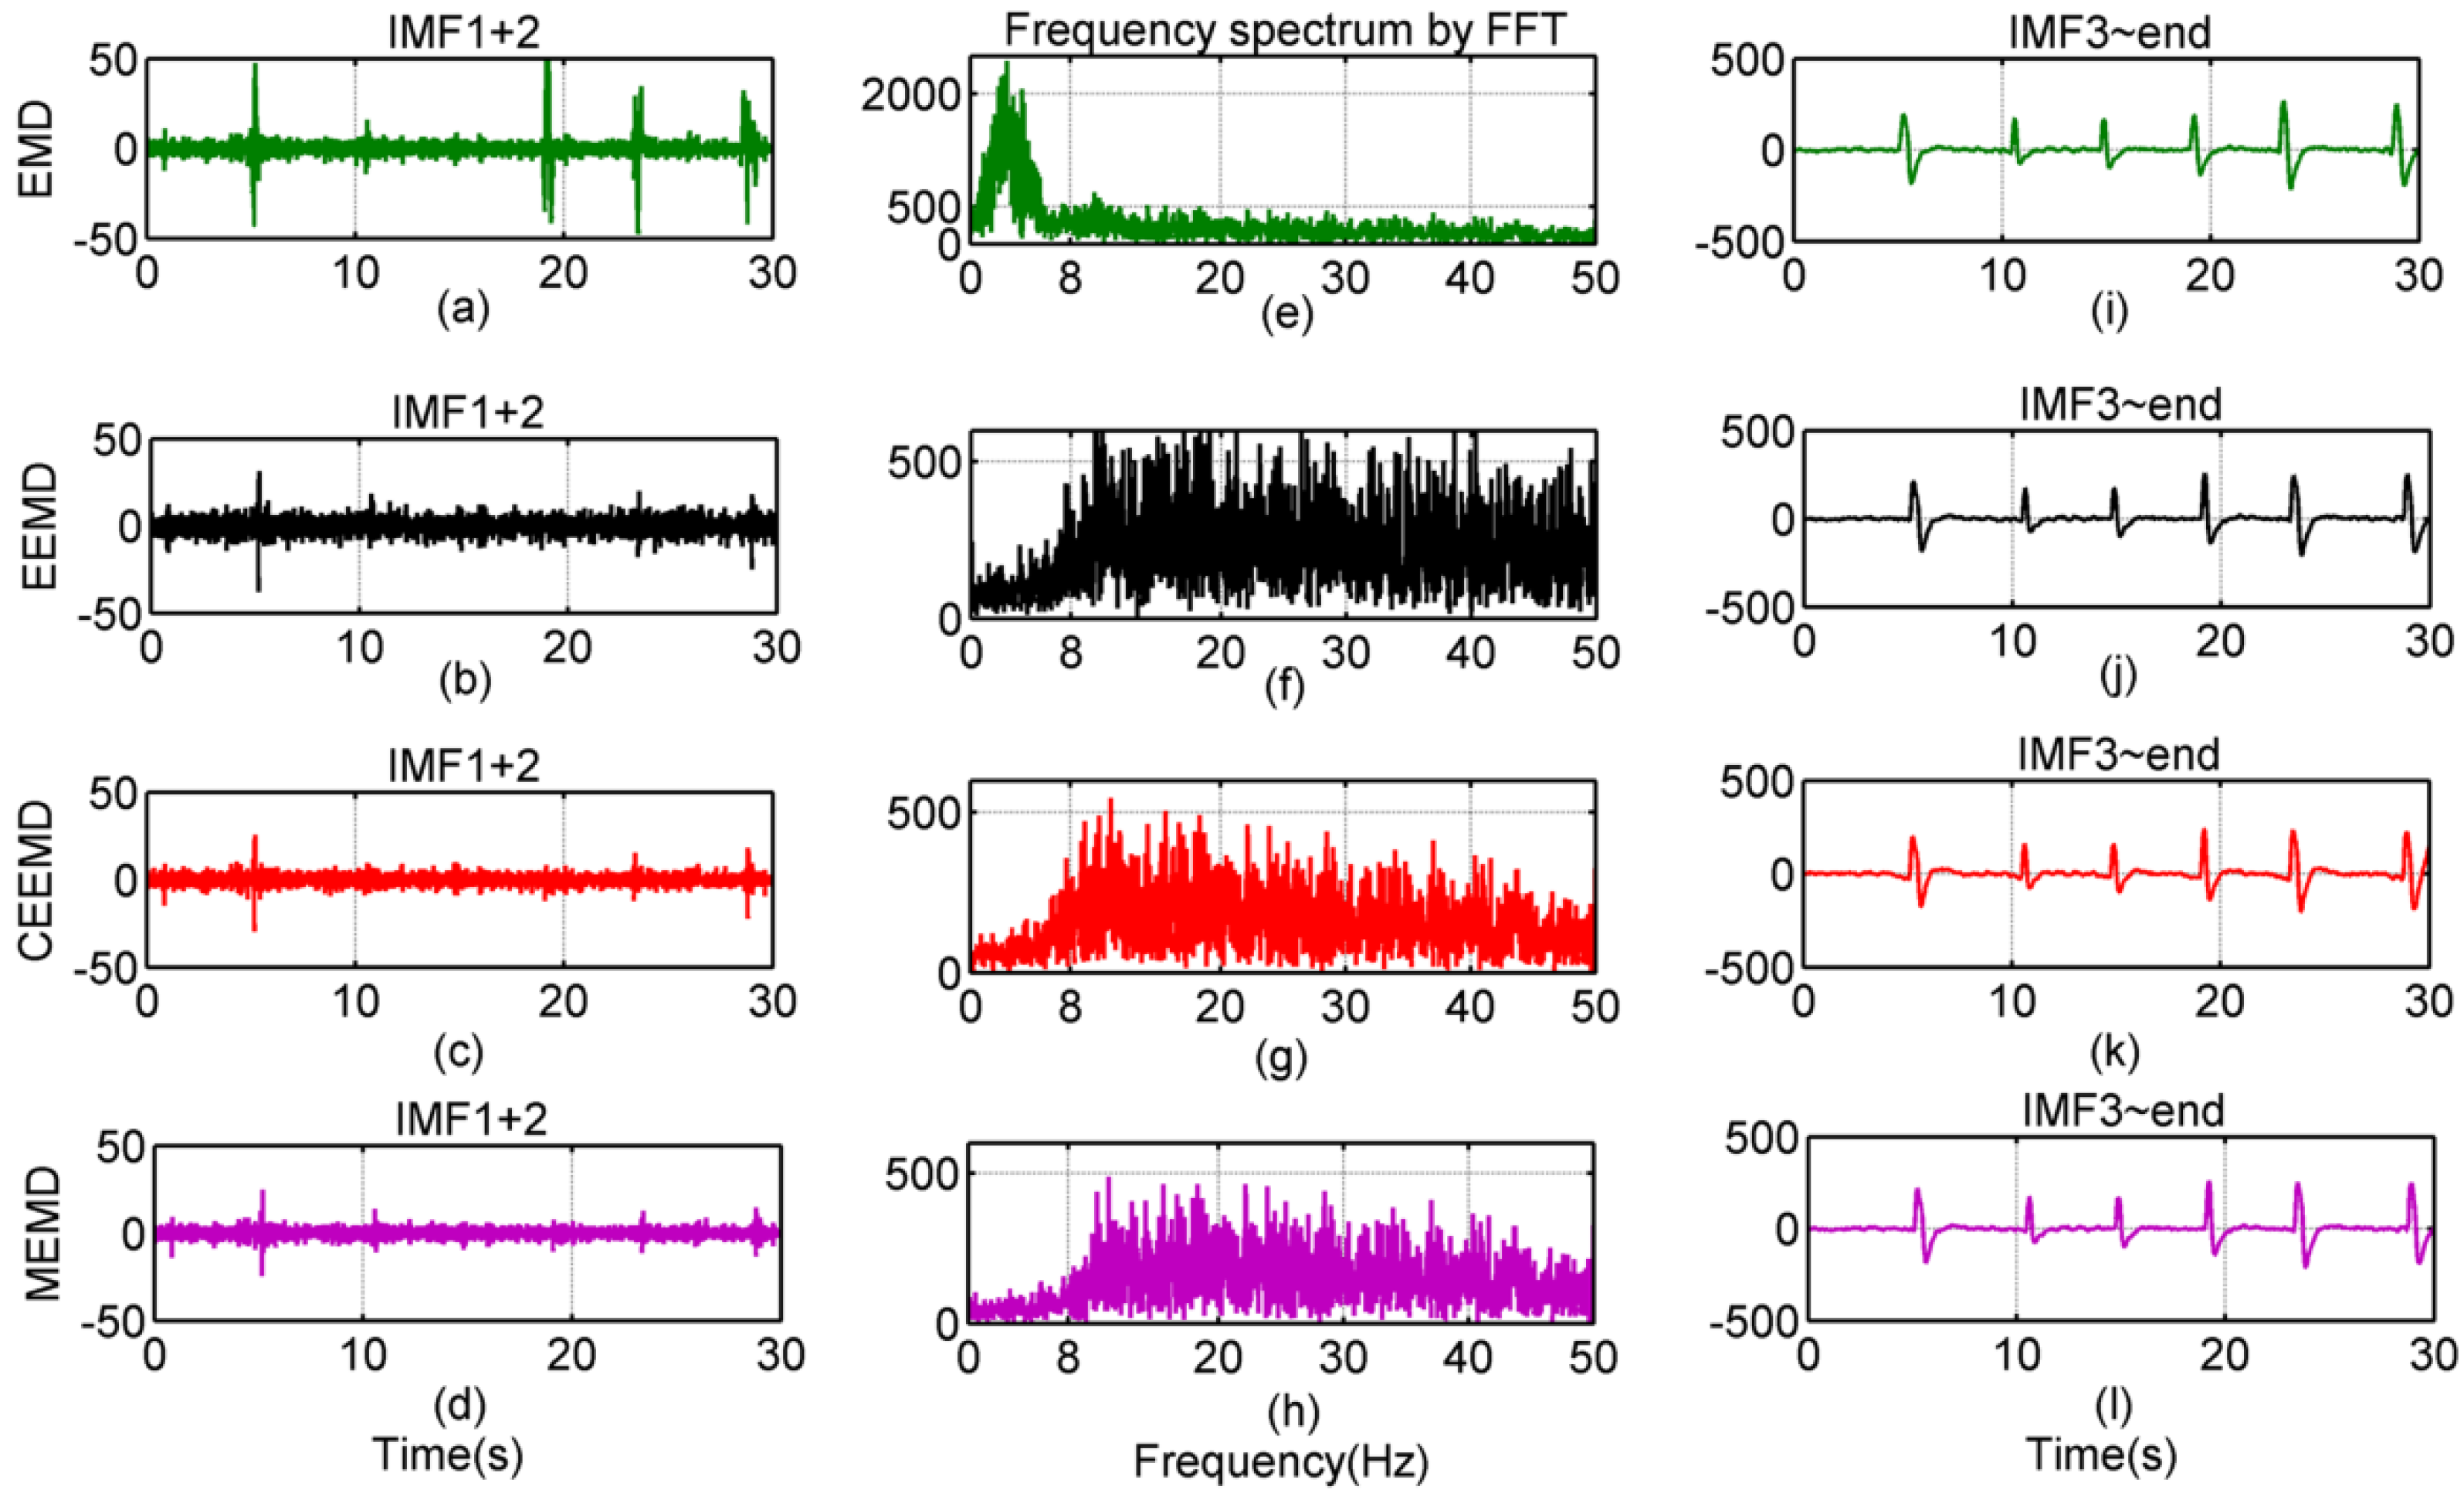
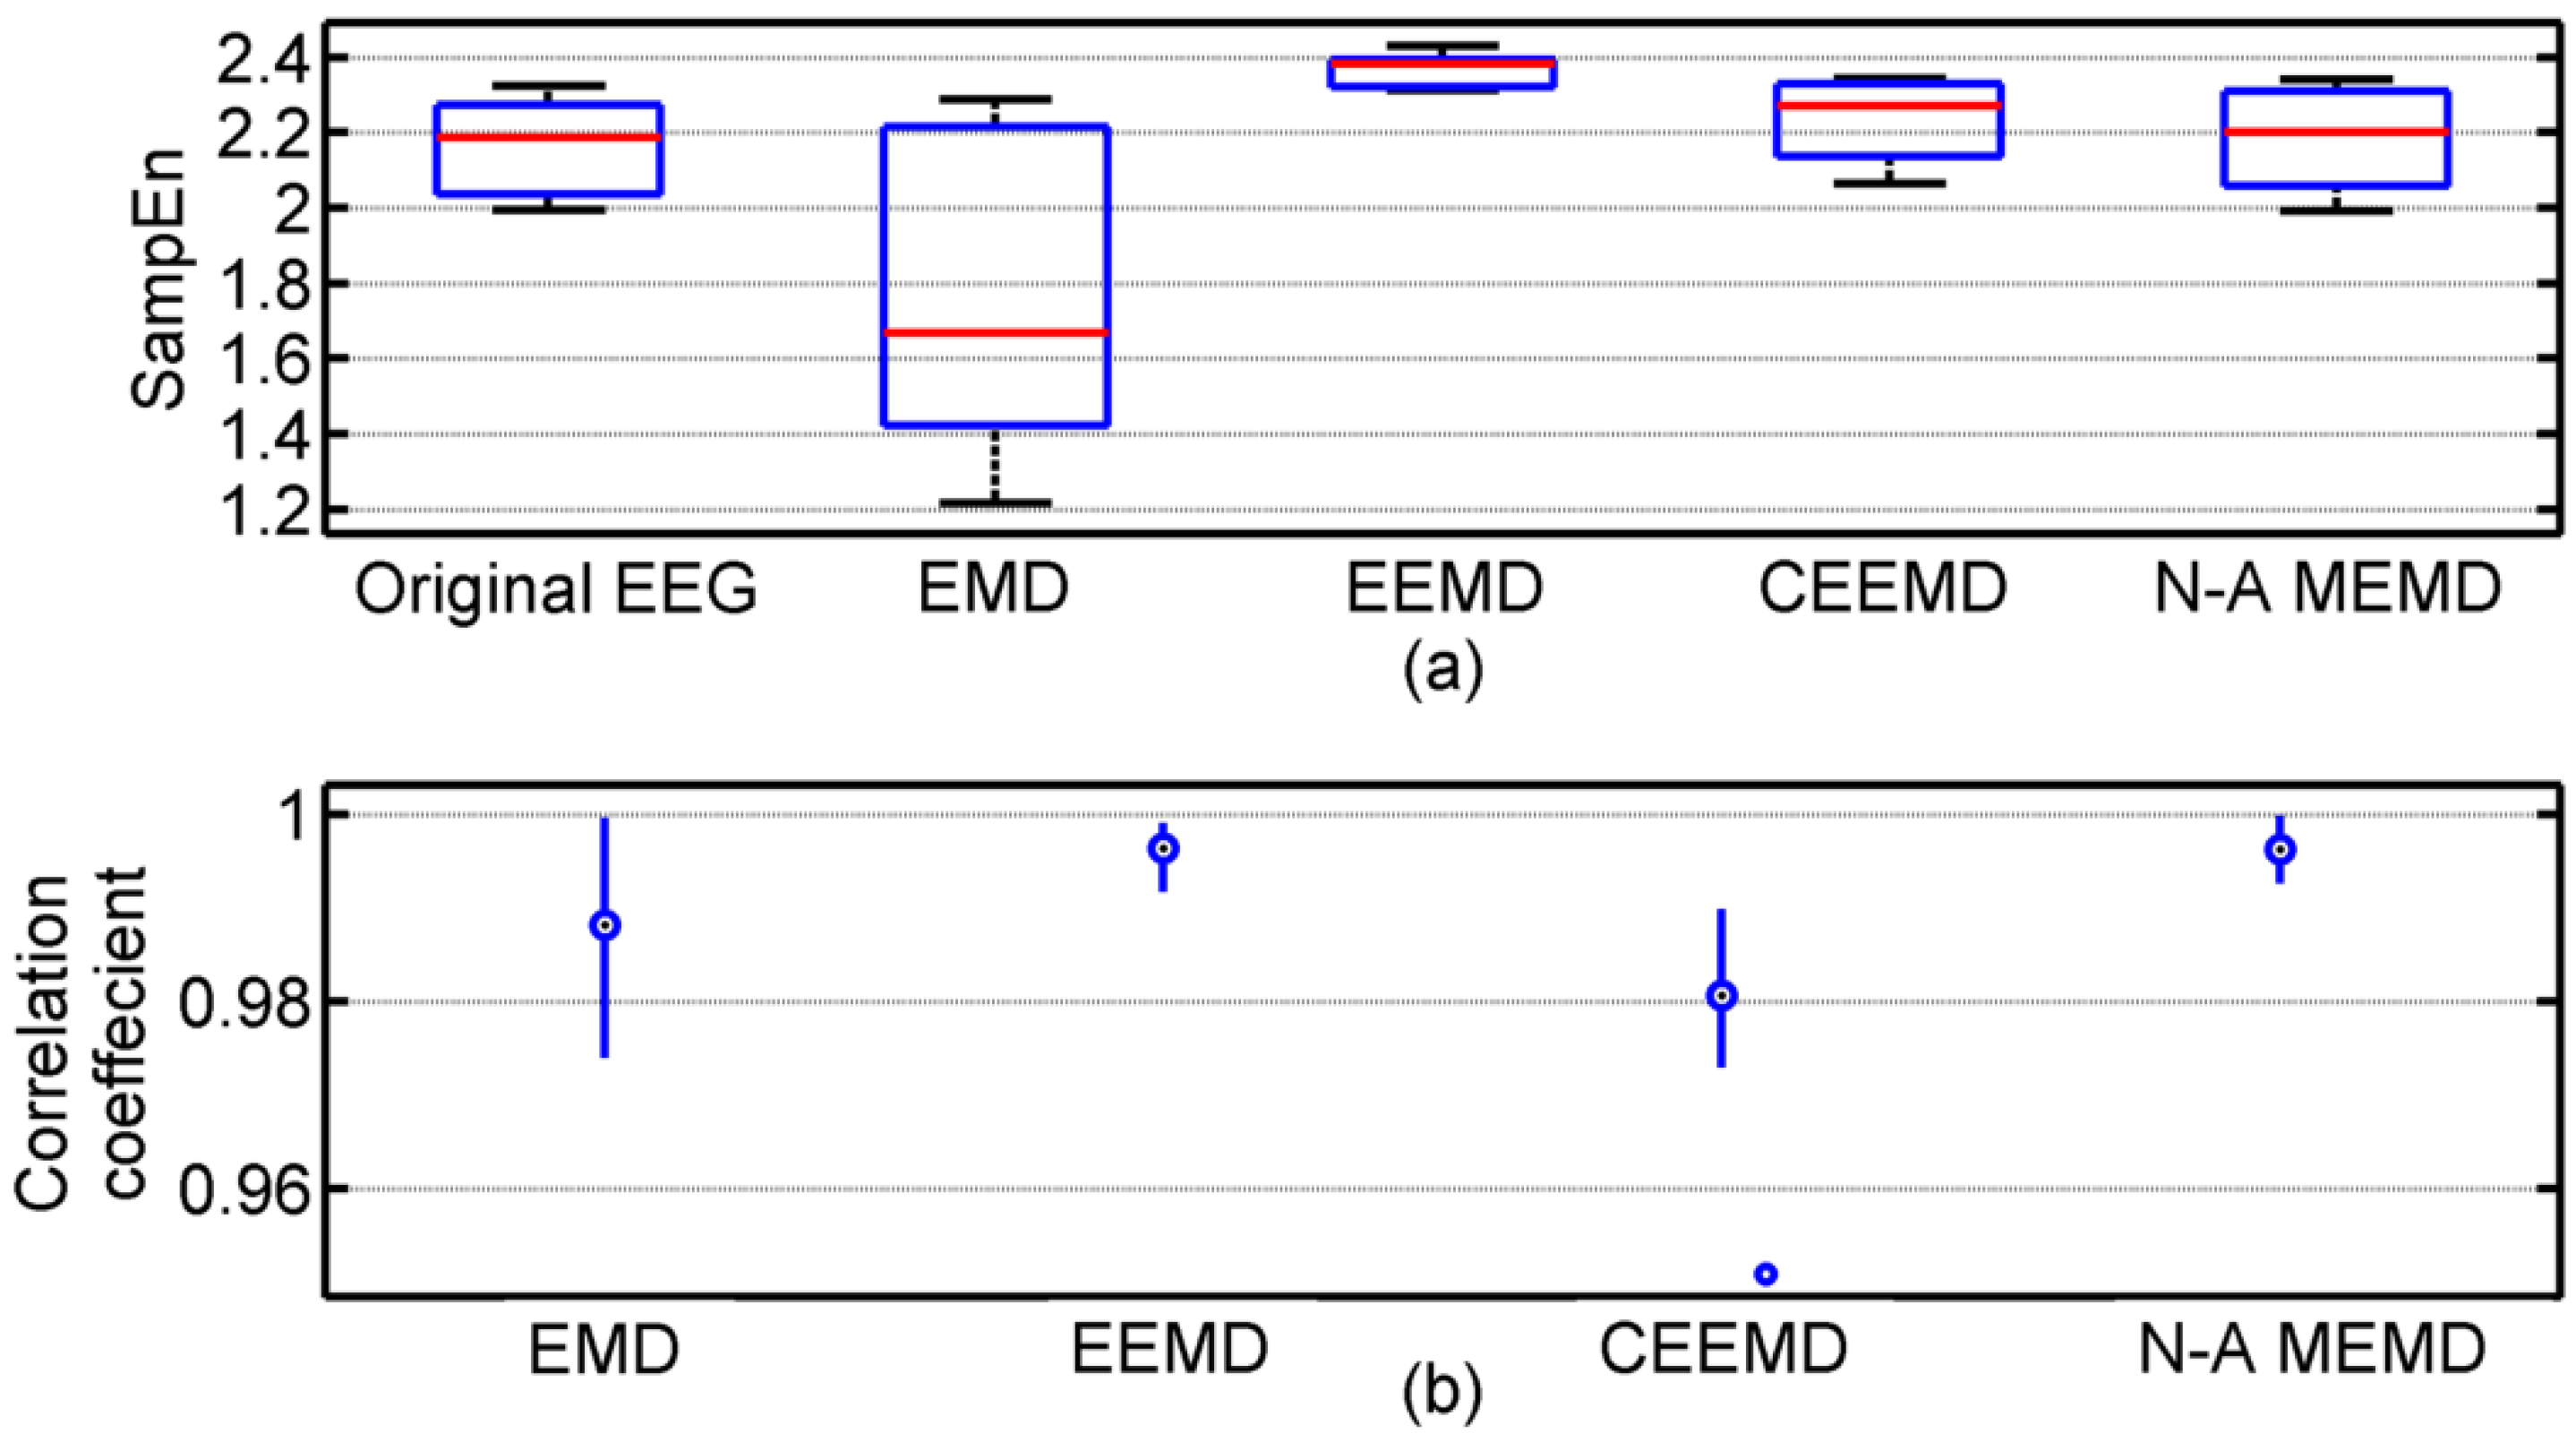
3.1. Results of Comparison among EMD, EEMD, CEEMD and N-A MEMD

Since extended EMD methods have been applied to the analysis and processing of various human physiological signals, it is important to figure out the performances and advantages of these extended EMD methods in the analysis of signals disturbed by noise. Thus, a comparison among them is essential. First of all, a comparison of performance in extracting simulated complex signal is presented among EMD, EEMD, CEEMD and N-A MEMD. The complex signal consists of three kinds of signals, which are sine waves with frequency 2 Hz and 20 Hz, and a white Gaussian noise, with which the first half part is composed by the two different frequency sine waves, and the latter half part is constituted by the sine wave with 2 Hz and the white Gaussian noise. This is shown in the first row of each column in Figure 1. To decompose and reconstruct the two sine waves, the EMD, EEMD, CEEMD and N-A MEMD are employed on the complex signal. On the basis of the frequency and amplitude of IMFs, the reconstructed results are shown in Figure 1. It is evident that EMD is useful for the sine waves of high frequency because the 20 Hz signal appears in the IMF1 immediately. Nevertheless, the 2 Hz sine wave as the background signal obtained by EMD is not detectable as shown in IMF2, 3, 4 of Figure 1(a). IMF1s in EEMD, CEEMD and N-A MEMD have clear white Gaussian noise results in the last half part, and the N-A MEMD has the best IMF1 in the first half part which is almost equal to zero. In Figure 1 (b)(c), the first half parts in IMF1s of the EEMD and CEEMD still retain the noise interferences, but this situation is eliminated by N-A MEMD, as shown in IMF1 of Figure 1(d). It is obvious that the two distinct sine waves are reconstructed by the combination of the different IMFs generated from EEMD (i.e., IMF2 and IMF4-end), CEEMD (i.e., IMF2-3 and IMF5-end) and N-A MEMD (i.e., IMF2-4 and IMF7-end), which are depicted in the third and fifth row of Figure 1(b–d). IMFs separated by the extended EMD are ensembles of many EMD decompositions into mixtures of the signal and different added white noises. The complicated signals, which may contain many intrinsic mode functions and are coupled with different added white noises, generate distinctive combinations of IMFs in extended EMD. Therefore, an intrinsic component of the original signal may appear in different orders through different EMD decompositions because of the coupling with different added noises. Two IMFs sharing the same frequency give good results when an intrinsic component is decomposed into two or three IMFs. In Figure 1, IMF2-3 in CEEMD and IMF2-4 in N-A MEMD sharing the same frequency are obvious examples of this phenomenon. This is not a big problem to deal with. The two or three IMFs sharing the same frequency can be merged together as a single IMF. Moreover, according to the difference between the two sine waves in frequency domain and the feature of acting as a dyadic filter bank in these extended EMD methods [13], the sine waves with 20 Hz and 2 Hz are involved in the front and back of IMFs respectively. In Figure 1(b–d), it is evident that there are IMFs with the low amplitude and the frequency between 20 Hz and 2 Hz in the middle of the two reconstructed sine waves, by which a specific division appears in the amplitude and frequency domains.
Figure 1. Comparison among extended EMD methods: (a) EMD, (b) EEMD, (c) CEEMD and (d) N-A MEMD used for decomposing and reconstructing two different sine waves of 2 Hz and 20 Hz, respectively, from a complex original signal which has the first half part consisting of two different sine waves, and the last half part is the 2 Hz sine wave disturbed by a white Gaussian noise.
Entropy 15 03458 g001
To estimate the effectiveness of these methods, the statistical similarities between original sine waves and results reconstructed by the extended EMD methods are calculated as shown in Table 1. Aside from the fact that the EMD has no result for the sine wave with 2 Hz in Figure 1(a), the correlation between original signals and reconstructed sine waves represents the performance of each extended EMD method in filtering noise and reconstructing signals. In summary, the N-A MEMD has the optimal performance in extracting the two sine waves with the different frequencies from the complex signals, and the sine wave with low frequency reconstructed by the CEEMD is better than the EEMD one, nevertheless, the order from best to worst performance in reconstructing the sine wave with the high frequency is the following sequence: CEEMD, EMD and EEMD.
Table 1. Correlation coefficient of oEEG vs. rEEG signals within 2 Hz and 20Hz.
Methods2 Hz20 Hz
EMDN/A0.9846
EEMD0.94490.9907
CEEMD0.96270.9826
N-A MEMD0.96740.9943
N/A: not available due to the fact that no 2 Hz sine wave was decomposed by the EMD algorithm.
After the simulation with normal signals, the extended EMD methods were applied to the analysis of real EEG signals. Twenty cases of 30 s oEEG signals were collected before the surgery when the patients had consciousness and closed eyes. Then a 30s EOG while eyes were blinking was filtered by a low-pass FIR filter with a 50 Hz cutoff frequency so as to filter out the high frequency noises. According to the amplitude and frequency band of the results analyzed using the EMD and its extended methods, the rEEG and EOG are composed of the combination of IMFs decomposed using EMD, EEMD, CEEMD and N-A MEMD (i.e., IMF1-2 and IMF3-end), which are displayed in the first and third columns of Figure 2. The frequency spectrum of the EEG reconstructed using each method in the first column is shown in the middle column of Figure 2, respectively. Compared to the oEEG, the spectrum in Figure 2(e) loses the high magnitude signals at 8~13 Hz; in Figure 2(f), there exists an intensive disturbance of added white noises; only the results in Figure 2(g)(h) include the high magnitude signals ranging from 8 to 20 Hz. Despite the oEEG and rEEG passed the test of normal distribution in a one-sample Kolmogorov-Smirnov test, the Wilcoxon non-parametric test is still employed to figure out the differences between oEEG and rEEG. The distributions of SampEn of oEEG and rEEG by EMD, EEMD, CEEMD and N-A MEMD in the twenty cases are shown in Figure 3a. Consequently, through the Wilcoxon non-parametric test, it illustrates that EMD and N-A MEMD (P = 0.065 and P = 0.212, respectively) are better than EEMD and CEEMD (P = 0.001 and P = 0.008 respectively) in reconstructing EEGs. Even though, it is apparent that the deviation in EMD is the biggest in all of them, and the coefficients of variance in the distribution of Figure 3(a) are 0.06, 0.25, 0.02, 0.05 and 0.06 in that order. Moreover, both EEMD and CEEMD have added white noises in the decomposition stage, so there is an increase in the averaged SampEn of rEEG. Furthermore, sometimes IMF1 decomposed by EMD consists of the intrinsic high frequency components, which are disabled to express the rhythmic activities in the frequency range of 8~13Hz. Therefore, only SampEn of the rEEG using N-A MEMD has effectively and significantly no difference with that of oEEG. So that the EOG reconstructed using N-A MEMD also has the better correlation coefficient with the added EOG compared to EMD and CEEMD as shown in Figure 3(b). To conclude, the N-A MEMD is more effective for reconstructing the EEG and EOG signals than the other extended EMD methods.
Figure 2. The rEEG and EOG analyzed by EMD, EEMD, CEEMD and N-A MEMD, respectively.
Entropy 15 03458 g002
Figure 3. Comparison of the performance among EMD, EEMD, CEEMD and N-A MEMD in extracting EEG and EOG. (a) The distribution of sample entropy of the oEEG and rEEG, and (b) the correlation between original and reconstructed EOG by EMD, EEMD, CEEMD and N-A MEMD in twenty cases.
Entropy 15 03458 g003

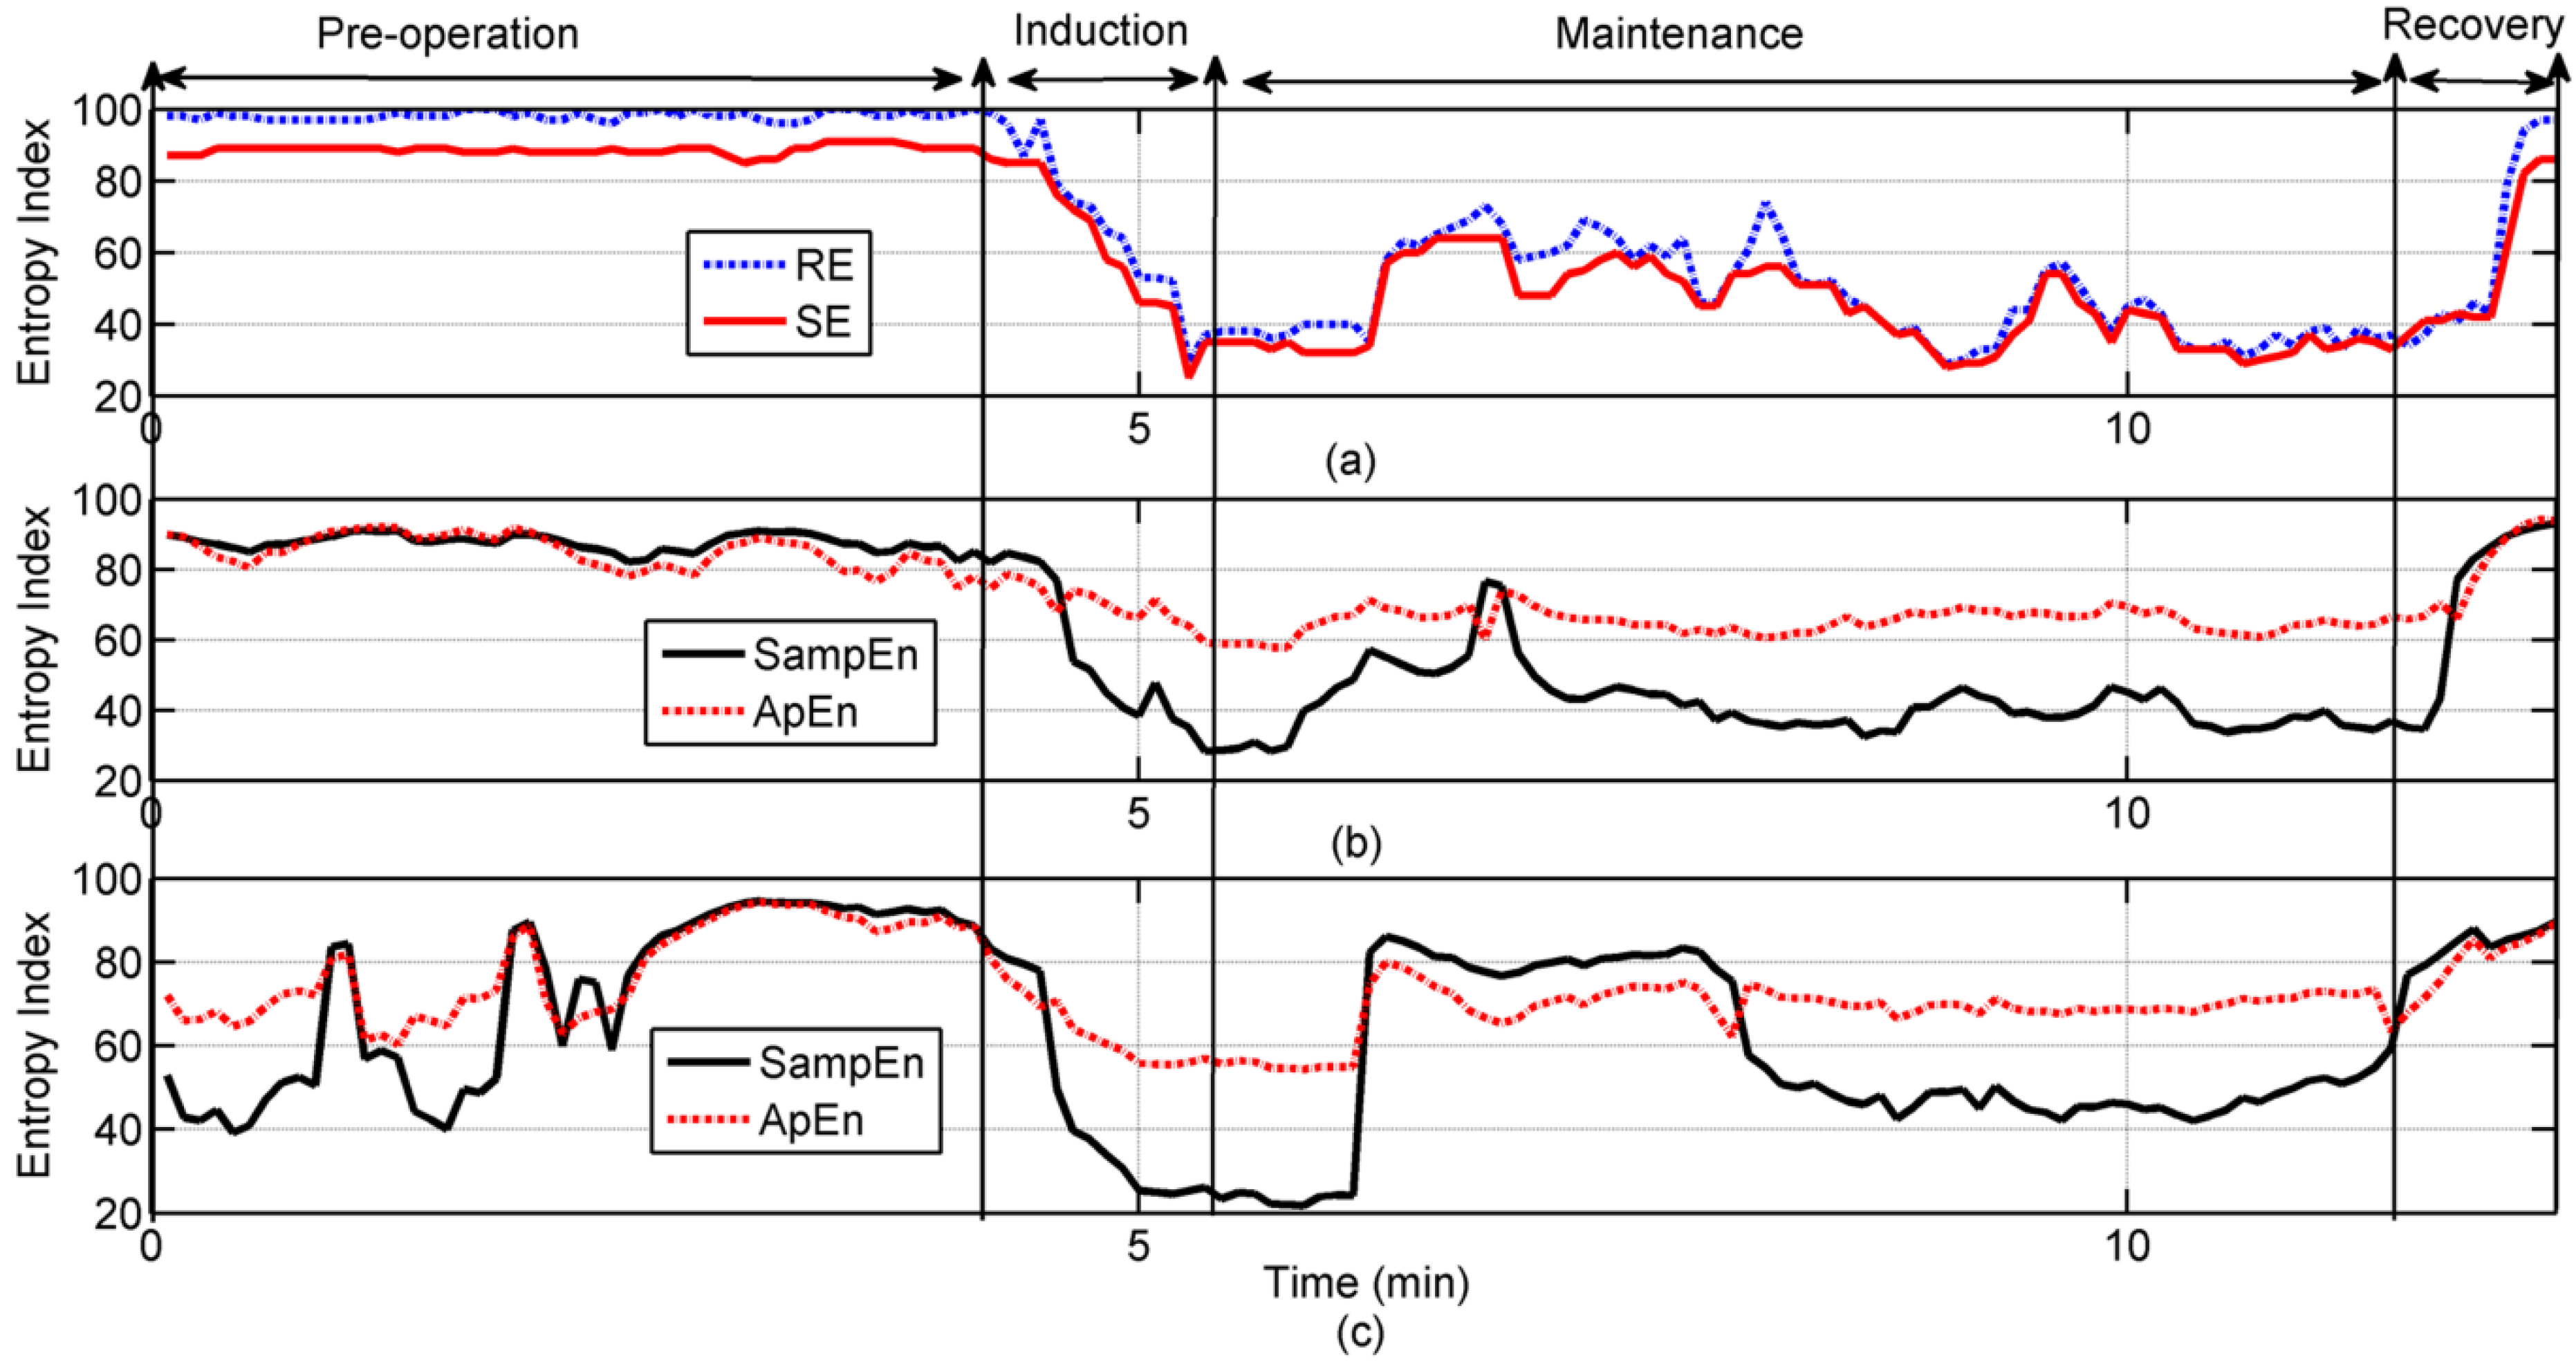
3.2. Results of the Application in Clinical EEG Recordings

This study was approved by the Research Ethics Review Committee of the Far Eastern Memorial Hospital (No. 099035-F). Participants and parents of minor participants were given adequate information before participating and freely signed a consent form approved by the ethics committee. After obtaining the written informed consent, EEG signals were collected from twenty patients, whose ages ranged from 15 to 60, undergoing urological surgery with general anesthesia. The EEG monitoring device is the Datex-Ohmeda S/5TM Compact Anesthesia Monitor, which has an EEG sampling rate of 100 Hz. The anesthetic used in the operations is propofol. According to the standard operation procedure, the process is divided into four stages: the pre-operation, induction, maintenance and recovery. During the pre-operation stage, patients always answered some questions during consciousness, thus the EEG signals were disturbed by the EOG and EMG at that time. During the induction stage and at the beginning of maintenance stage, movement of the patients’ head caused by the intubation also disturbs the EEG signals badly. Finally, during the recovery stage, the EEG signals are clearer than other stages because of the closure of the operation. In this paper, one EEG recording case was considered for a female patient, aged 52. Figure 4(a) displays the oEEG signals and the responses of the interferences occurring during the surgery. The results show that the rEEG signals are almost clean from EOG interferences, except for the movement caused by intubation during the induction and maintenance, shown in Figure 4(b). Moreover, the spectrum of EEG before and after analysis by N-A MEMD is shown in Figure 4(c), clearly most of the rEEG magnitudes have decreased over whole frequency range, in particular, in high frequency.
Figure 4. An EEG recording of a female patient, age 52 undergoing the urological surgery. (a) oEEG signals. (b) rEEG signals processed by N-A MEMD. (c) spectrum of (a) and (b).
Entropy 15 03458 g004
Consequently, the SampEn method is employed to analyze the DOA based on the rEEG signals. In [14], a system has been designed to monitor the EEG and DOA through SampEn in real time. The results have the same trend as RE and SE recorded every five seconds recorded by the system, however, the impacts of EMG and EOG still exist, even if a low-pass filter is used offline. Therefore, the extended EMD methods are useful to resolve this problem. In this study, the ApEn is also utilized to compare with SampEn in monitoring DOA of reconstructed and oEEG signals, in which the parameter r is set to 0.15 and m is 2. In order to be consistent with the RE and SE recordings and meet the requirement of ApEn with respect to the length of data, a time window of 30 seconds including 3,000 points of EEG signals is established for calculation, and it moves once every five seconds for real time analysis. In Figure 5, the real time RE and SE recordings of the same female patient mentioned above are depicted in the blue dashed line and red solid line, respectively, in Figure 5(a); while the SampEn and ApEn of the corresponding oEEG and rEEG signals are expressed in the black solid line and red dashed line in Figure 5(b)(c). Comparing Figure 5(b) to Figure 5(c), the impacts of disturbances in the pre-operation and maintenance are dismissed basically, both SampEn and ApEn have the same trend with the RE and SE. Even so, the SampEn has better performance than the ApEn in sensitivity to the consciousness of the patients and DOA, as shown in Figure 5(b).
Figure 5. Comparison of the SampEn and ApEn in the oEEG and rEEG. (a) The real time RE and SE recording from the device Datex-Ohmeda S/5. (b) SampEn and ApEn of the rEEG; (c) SampEn and ApEn of the oEEG.
Entropy 15 03458 g005
In order to figure out the relationship among RE/SE, SampEn and ApEn in monitoring DOA, the results of twenty patients in the pre-operation and maintenance stages were calculated statistically, because the time of intubation and recovery are very short and the other two processes of operation are relatively stable for all patients during surgeries. The outcome of the test of Pearson’s correlation among RE/SE, SampEn and ApEn of the oEEG and rEEG in the two processes of operation are shown in Table 2 and Table 3. It is evident that both the SampEn and ApEn of the rEEG signals have a linear relationship with the RE/ SE during the pre-operation of surgery (r > 0.7; α = 0.01 and r > 0.3; α = 0.01, respectively), which indicates the importance of reconstructing EEG using N-A MEMD in the pre-operation process. Besides, only SampEn is linearly related to RE/SE during the maintenance of surgery (α = 0.01), though the oEEG (r > 0.7) has bigger correlation coefficient compared to the rEEG (r > 0.4) in this process. According to the statistical analysis results, not only are the EOG and the EMG interferences in the pre-operation eliminated by the N-A MEMD, but the SampEn is also a better entropy index than ApEn in monitoring the status of patients undergoing general anesthesia.
Table 2. Statistical significance of RE/SE vs. SampEn/ApEn during the Pre-operation.
oEEGrEEG
Entropy SampEnApEnSampEnApEn
Index71.7 ± 20.3277.77 ± 11.086.53 ± 5.2984.08 ± 5.7
RE0.254b0.241b0.746a0.406a
97.16 ± 4.46
SE0.246b0.236b0.740a0.370a
87.86 ± 3.09
a Correlation is significant at the 0.01 level (2-tailed); b p > 0.05. The test of Pearson’s correlation among RE, SE and SampEn, ApEn in the twenty patients during the pre-operation is between the original (oEEG) and reconstructed (rEEG) EEG signals. Value of each entropy index is expressed as mean ± SD and the correlation coefficient is marked with its significance level. If the significance level (α) is less than 0.05 then the correlation is significant and the two variables are linearly related, and marked with a. If p > 0.05 then the correlation is not statistically significant, and marked with b.
Table 3. Statistical significance of RE/SE vs. SampEn/ApEn during the Maintenance.
oEEGrEEG
Entropy SampEnApEnSampEnApEn
Index60. 24 ± 16.870.48 ± 3.1443.065 ± 8.865.66 ± 3.14
RE0.724a0.304b0.495a0.007c
50.25 ± 13.1
SE0.717a0.312b0.507a0.034c
46.4 ± 11.21
a Correlation is significant at the 0.01 level (2-tailed); b Correlation is significant at the 0.05 level (2-tailed); c p > 0.05. The test of Pearson’s correlation among RE, SE and SampEn, ApEn in the twenty patients during the maintenance is between the original (oEEG) and reconstructed (rEEG) EEG signals. Value of each entropy index is expressed as mean ± SD and the correlation coefficient is marked with its significance level. If the significance level (α) is less than 0.05 then the correlation is significant and the two variables are linearly related, and marked with a. If p = 0.05 then the correlation is significant, and marked with b. If p > 0.05 then the correlation is not statistically significant, and marked with c.

4. Discussion and Conclusions

In this study, due to the non-linearly and non-stationary combination of EEG signals and interferences generated during clinical surgeries, methods based on EMD are employed to reconstruct the pure EEG signals. According to the simulation and practical application to the EEG signals, the EMD does not have the good performance in decomposing and reconstructing the signals with low frequency because of the problem of mode mixing. Even though this problem has been solved by the EEMD basically, it still has the similar IMFs with the EMD and contains noise in the residue. Although the CEEMD and N-A MEMD has improved the influence of the added white noise in the EEMD, only N-A MEMD acts as a good filter in decomposing the complex and physiological signals. Therefore, the N-A MEMD is selected to process the whole clinical recordings. In the N-A MEMD process, the EEG signals are put into the first channel, and two uncorrelated white Gaussian noises are added into the supplementary two channels. However, the relationship between the amount of added noise and the decomposed results needs to be figured out. Moreover, besides EEG, a multitude of physiological signals like ECG and blood pressure describe together the status of patients during surgery. The characteristics of mode alignment in the MEMD [12,13] may provide some interesting results with regards to the patient’s state while multiple physiological signals in the multi-channels are decomposed by the MEMD together. In addition, multivariate multi-scale entropy (MMSE) was also presented to adapt to the multivariate time series in practical experiments and biological systems [20,21]. Recently, the EEMD has been calculated at real time through the parallelization method [22], thus the real time computation of MEMD can absolutely be realized in future work after improvement and modification of the algorithm in accordance to the requirements.
In order to acquire a useful EEG signal, the validation of extended EMD methods applied to filter the EOG has been proven through the simulation and analysis of practical signals presented in this paper. The EEG signals denoised through N-A MEMD are more effective for correlating to the state of patients undergoing an operation. Although both the BIS and RE/SE indexes have been the commercial and popular measures to the DOA, the diagnosis of sophisticated anesthetists is the “golden standard” in clinical operations. Thereby, the SampEn and ApEn of denoised EEG have been compared to the commercial indexes firstly, and then the statistical analysis and comparison with diagnosis results of anesthetists will be the next step in our study. Moreover, other complexity measures of EEG signals would also be used in further analysis and improvement, like the permutation entropy [23], Hilbert-Huang spectral entropy [24], and so on.
Through the statistical analysis of SampEn and ApEn, it is evident that the IMFs used to reconstruct EEG through N-A MEMD in maintenance is not as good as in the pre-operation phase. Since the interferences such as EOG and EMG are distinct in the different periods of surgeries, SampEn of oEEG has better outcomes in linear relationship with RE/SE in the maintenance. However, both the SampEn and ApEn are suitable to provide the entropy index of DOA during clinical surgeries. The advantages of real time processing of SampEn for calculating the DOA is presented in this study. However, the high sensitivity to consciousness of patients could also become a disadvantage under the complex interferences originated from the operation, so it is significant to adopt an effective method to obtain pure EEG signals. The N-A MEMD can be the method used to assist the SampEn in analyzing the EEG signals for monitoring the DOA in the pre-operation stage. In conclusion, the N-A MEMD has the best performance for analyzing EEG signals with physiological interferences among the EMD, EEMD, CEEMD, and N-A MEMD. Moreover, the SampEn is a practical and efficient method to monitor the DOA of patients undergoing surgeries based on analysis of the EEG signals.

Acknowledgments

The authors wish to thank the advisement of Dr. C.K. Peng and the exchange PhD student program of Yuan Ze University in Taiwan and Wuhan University of Technology in China for supporting this research. This research was supported by the Center for Dynamical Biomarkers and Translational Medicine which is sponsored by National Science Council (grant number: NSC 101-2911-I-008-001). Moreover, it was supported by Chung-Shan Institute of Science & Technology in Taiwan (Grant Numbers: CSIST-095-V201 and CSIST-095-V202). Furthermore, it is also supported by the Key Project of Chinese Ministry of Education (No.313042) and the Fundamental Research Funds for the Central Universities under Grant No. 2013-VII-001.

Conflicts of interest

The authors declare no conflict of interest.

References

  1. Billard, V.; Gambus, P.L.; Chamoun, N.; Stanski, D.R.; Shafer, S.L. A comparison of spectral edge, delta power, and bispectral index as EEG measures of alfentanil, propofol, and midazolam drug effect. Clin. Pharmacol. Ther. 1997, 61, 45–58. [Google Scholar] [CrossRef]
  2. Katoh, T.; Suzuki, A.; Ikeda, K. Electroencephalographic derivatives as a tool for predicting the depth of sedation and anesthesia induced by sevoflurane. Anesthesiology 1998, 88, 642–650. [Google Scholar] [CrossRef] [PubMed]
  3. Mahon, P.; Greene, B.R.; Greene, C.; Boylan, G.B.; Shorten, G.D. Behaviour of spectral entropy, spectral edge frequency 90%, and alpha and beta power parameters during low-dose propofol infusion. Brit. J. Anaesth. 2008, 101, 213–221. [Google Scholar] [CrossRef] [PubMed]
  4. De Deyne, C.; Struys, M.; Decruyenaere, J.; Creupelandt, J.; Hoste, E.; Colardyn, F. Use of continuous bispectral EEG monitoring to assess depth of sedation in ICU patients. Intensive Care Med. 1998, 24, 1294–1298. [Google Scholar] [CrossRef] [PubMed]
  5. Vanluchene, A.L.G.; Vereecke, H.; Thas, O.; Mortier, E.P.; Shafer, S.L.; Struys, M.M. Spectral entropy as an electroencephalographic measure of anesthetic drug effect: a comparison with bispectral index and processed midlatency auditory evoked response. Anesthesiology 2004, 101, 34–42. [Google Scholar] [CrossRef] [PubMed]
  6. White, P.F.; Tang, J.; Romero, G.F.; Wender, R.H.; Naruse, R.; Sloninsky, A.; Kariger, R. A comparison of state and response entropy versus bispectral index values during the perioperative period. Anesth. Analg. 2006, 102, 160–167. [Google Scholar] [CrossRef] [PubMed]
  7. Liang, H.; Lin, Z.; McCallum, R.W. Artifact reduction in electrogastrogram based on empirical mode decomposition method. Med. Biol. Eng. Comput. 2000, 38, 35–41. [Google Scholar] [CrossRef] [PubMed]
  8. Sweeney-Reed, C.M.; Nasuto, S.J. A novel approach to the detection of synchronization in EEG based on empirical mode decomposition. J. Comput. Neurosci. 2007, 23, 79–111. [Google Scholar] [CrossRef] [PubMed]
  9. Huang, N.E.; Shen, Z.; Long, S.R.; Wu, M.C.; Shih, H.H.; Zheng, Q.; Yen, N.C.; Tung, C.C.; Liu, H.H. The empirical mode decomposition and the Hilbert spectrum for nonlinear and non-stationary time series analysis. Proc. R. Soc. Lond. 1998, 454, 903–995. [Google Scholar] [CrossRef]
  10. Wu, Z.H.; Huang, N.E. Ensemble empirical mode decomposition: A noise assisted data analysis method. Adv. Adaptive Data Anal. 2009, 1, 1–41. [Google Scholar] [CrossRef]
  11. Yeh, J.R.; Shieh, J.S.; Huang, N.E. Complementary ensemble empirical mode decomposition: A novel noise enhanced data analysis method. Adv. Adaptive Data Anal. 2010, 2, 135–156. [Google Scholar] [CrossRef]
  12. Rehman, N.; Mandic, D.P. Multivariate empirical mode decomposition. Proc. Royal Society A 2010, 466, 1291–1302. [Google Scholar] [CrossRef]
  13. Rehman, N.; Mandic, D.P. Filter bank property of multivariate empirical mode decomposition. IEEE Trans. Signal Process. 2010, 59, 2421–2426. [Google Scholar] [CrossRef]
  14. Wei, Q.; Huang, D.W.; Lu, J.W.; Liu, Q.; Shieh, J.S. Intelligent real time data mining of depth of aneasthesia. In Proceedings of the 13th International Conference on Intelligent System and Control (IASTED 13th), Cambridge, UK, 11–13 July 2011; pp. 35–40.
  15. Fan, S.Z.; Yeh, J.R.; Chen, B.C.; Shieh, J.S. Comparison of EEG approximate entropy and complexity measures of depth of anaesthesia during inhalational general anaesthesia. J. Med. Bio. Eng. 2011, 31, 359–366. [Google Scholar] [CrossRef]
  16. Liu, Q.; Wei, Q.; Fan, S.Z.; Lu, C.W.; Lin, T.Y.; Abbod, M.F.; Shieh, J.S. Adaptive computation of multiscale entropy and its application in EEG signals for monitoring depth of anesthesia during surgery. Entropy 2012, 14, 978–992. [Google Scholar] [CrossRef]
  17. Shalbaf, R.; Behnam, H.; Sleigh, J.; Voss, L. Measuring the effects of sevoflurane on electroencephalogram using sample entropy. Acta Anaesthesiol. Scand. 2012, 56, 880–889. [Google Scholar] [CrossRef] [PubMed]
  18. Pincus, S.M. Approximate entropy (ApEn) as a measure of system complexity. Proc. Natl. Acad. Sci. 1991, 88, 110–117. [Google Scholar] [CrossRef]
  19. Richman, J.S.; Moorman, J.R. Physiological time-series analysis using approximate entropy and sample entropy. Am. J. Physiol. Heart Circ. Physiol. 2000, 278, 2039–2049. [Google Scholar]
  20. Ahmed, M.U.; Li, L.; Cao, J.T.; Mandic, D.P. Multivariate multiscale entropy for brain consciousness analysis. In Proceedings of the 33rd Annual international conference of the IEEE Engineering in Medicine and Biology Society, Boston, MA, USA, 30 August–3 September, 2011; pp. 810–813.
  21. Ahmed, M.U.; Mandic, D.P. Multivariate multiscale entropy analysis. IEEE Signal Process Lett. 2012, 19, 91–94. [Google Scholar] [CrossRef]
  22. Chen, D.; Li, D.; Xiong, M.Z.; Bao, H.; Li, X.L. GPGPU-aided ensemble empirical-mode decomposition for EEG analysis during anesthesia. IEEE Trans. Inf. Technol. Biomed. 2010, 14, 1417–1427. [Google Scholar] [CrossRef] [PubMed]
  23. Olofsen, E.; Sleigh, J.W.; Dahan, A. Permutation entropy of the electroencephalogram: A measure of anaesthetic drug effect. Br. J. Anaesth. 2008, 101, 810–821. [Google Scholar] [CrossRef] [PubMed]
  24. Li, X.; Li, D.; Liang, Z.; Voss, L.J. Analysis of depth of anesthesia with Hilbert–Huang spectral entropy. Clin. Neurophysiol. 2008, 119, 2465–2475. [Google Scholar] [CrossRef] [PubMed]

