Article

Entropy Variation in the Two-dimensional Phase Transition of Anthracene Adsorbed at the Hg Electrode/Ethylene Glycol Solution Interface

Department of Chemistry, University of Modena and Reggio Emilia, Via Campi 183, 41125 Modena, Italy
Entropy 2010, 12(3), 570-577; https://doi.org/10.3390/e12030570
Submission received: 14 December 2009 / Revised: 25 February 2010 / Accepted: 11 March 2010 / Published: 16 March 2010
(This article belongs to the Special Issue Entropy in Model Reduction)

Abstract

:
The adsorption of anthracene (C 14 H 10 ), at the mercury electrode/ethylene glycol (EG) solution interface, is characterized by a low and almost constant capacity (about 8 μF cm 2 ) region (capacitive “pit” or “plateau”) in capacity vs. potential curves, upon selection of suitable values of temperature, bulk concentration and applied potential values. This result is rationalized assuming the occurrence of a 2D phase transition between two distinct adsorbed phases: (i) a “disordered” phase, characterized by a flat “parallel” disposition of the aromatic moiety on the electrode surface (ii) an “ordered” phase, characterized by a “perpendicular” disposition of the aromatic moiety on the electrode surface. The experimental evidence is rationalized by considering the chemical potential as an explicit function of the “electric field/adsorbed molecule” interaction. Such a modelistic approach enables the determination of the relevant standard entropy variation.

1. Introduction

The formation of ordered two-dimensional (2D) monomolecular films is currently a thoroughly studied subject, as well as exploited phenomenon, in physics and chemistry, mainly concerning the adsorption (physisorption or chemisorption) of organic compounds at the solid/liquid and liquid/liquid interface [1]. In the field of electrochemistry, the occurrence of the 2D phase transition of organics adsorbed at the electrode/aqueous solution interface is mostly observed at the Hg/aqueous (i.e., liquid/liquid) solution interface [2,3,4,5,6,7], and in some cases at the solid/liquid interface, on Au(111) single crystal [8,9] and HOPG (Highly Oriented Pyrolitic Graphite) electrode surfaces [10]. In the literature are present two elegant modelistic approaches aiming to model the occurrence of this kind of electrochemically induced phase transition [11,12]. Both based on the two-dimensional spin-1/2 Ising model, they are able to “qualitatively” account for the quadratic dependence of the transition potentials on temperature [11] and to estimate the adsorbate/adsorbate interaction energy [12]. Within this field of research, there is only one previous paper relating to the 2D phase transition due to the adsorption of organics from non-aqueous solution, which is the case of adenine adsorbed on Hg from ethylene glycol [13]. The opportunity to compare results obtained in different solvents appears particularly appealing to single out the influence of the solution medium on the 2D phase transition. To this end, the adsorption of anthracene (C 14 H 10 ) at the mercury electrode/ethylene glycol solution interface is studied, which features all of the experimental characteristics typical of an electrochemically induced 2D phase transition.

2. Results and Discussion

2.1. Theoretical Model

The details of the modelistic approach here used are reported in reference [7]. The main assumption is that the discontinuities in the capacity vs. potential (C-E) curves are due to a phase transition of the adsorbed organic compound, which can be represented as a one-component three-phase equilibrium, whereas the electroactive species, A, is present in the bulk and two distinct adsorbed phases: “disordered” (parallel ‖, liquid-like, 1/1) and “ordered” (perpendicular ⊥, ordered or solid-like, s/1)
l A ( ads , ) + m A ( bulk ) n A ( ads , )
equilibrium conditions imply:
l μ ( ads , ) + m μ ( bulk ) n μ ( ads , )
where μ is the chemical potential of the A species. In this peculiar case, beyond bulk concentration and temperature, the equilibrium condition is also a function of the applied potential. Thus, it is expedient to assume that the potential difference is mainly localized at the electrode surface/solution interface (i.e., only the adsorbed phases are experiencing its effects). Moreover, the contribution relevant to the electrostatic interaction between the applied field (ϕ) and the effective dipole moment of the adsorbed molecule can be accounted for by expressing the chemical potential as [7]:
μ ϕ = μ ϕ = 0 L p z 0 ϕ z ( 1 / 2 ) L α zz ϕ z 2
where p z 0 and α zz are, respectively, the component of the dipole moment and the molecular polarizability in the electric field ϕ z direction, L is the Avogadro constant [if ϕ z = 0 then μ ϕ μ , and eventually μ = μ + R T l n ( a ) ]. The electric field, at the polarizable interface (working electrode), is assumed to be a linear function of the externally applied potential difference ( E ext ), i.e., ϕ z = a + b E ext (a and b are two constants). The molar fraction (χ) is chosen as the reference function to represent the activity of the adsorbate in the parallel and perpendicular phases. Assuming that the adsorbed perpendicular and parallel phases are compact pure phases (i.e., the surface coverage, usually indicated as θ, is equal to one), which leads to a c t i v i t y χ = 1 for both the adsorbed phases, the chemical potentials of the species involved in Equation (2) can be expressed as:
μ ( ϕ ) = μ L p z 0 ( a + b E ext ) ( 1 / 2 ) L α zz ( a + b E ext ) 2
μ bulk = μ bulk + R T l n ( a A , bulk )
where, for sake of generality the constants a and b are primed for the ⊥ phase, as there is no ab initio indication that the same values are retained for the parallel and perpendicular orientations (in particular, b and b could be thought to be roughly inversely proportional to the adsorbed phase thickness, which are actually different in the perpendicular and parallel dispositions [7]). Exploiting the fundamental relation: μ = H T S and assuming E ext = E tr , where E tr is the equilibrium potential of the process represented by relation (2), then substituting Equations (3)–(6) into Equation (2) leads to:
R T l n ( a A , bulk ) = c 0 + c 1 T + c 2 E tr + c 3 E tr 2
where:
c 0 = n m H l m H H bulk + L l m p , z a n m p , z a + l 2 m α , zz a 2 n 2 m α , zz a 2
c 1 = n m S l m S S bulk
c 2 = L l m p , z b + l m α , zz a b n m p , z b n m α , zz a b
c 3 = L l 2 m α , zz b 2 n 2 m α , zz b 2
At variance of the c 0 , c 2 and c 3 terms (whose value is also a function of the unknown a, a , b and b quantities), the c 1 coefficient is determined by the phase transition standard entropy variation.
Note that, the assumption of the “perpendicular” to “parallel” change of orientation underlying the present modelistic approach, which is deemed responsible of the appearance of the capacitive “pit” in the C-E curves, is also supported by surface plasmon excitation measurements in the case of the thymine adsorbed at the mercury electrode/aqueous solution interphase [14].

2.2. Results

Figure 1 sets out capacity vs. potential (C-E) curves recorded at a stationary mercury-drop electrode for anthracene in a 0.5 mol dm 3 sodium perchlorate solution in ethylene glycol (EG).
Four different anthracene concentrations were studied (5.0, 2.5, 1.0 and 0.75 mmol dm 3 ) in the temperature range of 275–315 K. Note that, each capacity vs. potential curve is the combined result of two independent scans; both starting at the same potential, 0.05 V v s . SCE EG , which is roughly in the middle of the low capacitive “pit”. This choice aims to minimize the effect of hysteresis on the potential value of the discontinuity [15]; to the discontinuity potential is assigned the meaning of the intensive “thermodynamic potential” able to drive the phase transition. From the experimental point of view, the low and almost constant capacity (about 8 μ F cm 2 ) region, capacitive “pit” or “plateau”, is seen to widen its amplitude in the potential field as the temperature decreases and the anthracene bulk concentration increases; the two edge-potential values, which correspond to the sharp discontinuities in the C-E curves occurring at more positive ( E tr + ) and at more negative ( E tr ) potentials, can be experimentally determined (they are assumed to mark the boundary between the 2D compact adsorbed phase, corresponding to the capacitive “pit”, and the 2D disordered phase, potential values outside the capacitive “pit”). Qualitatively, this behavior well agrees with the published data regarding other organic compounds exhibiting electrochemical induced phase transition [2,3,4,5,6,7,13]. Figure 2a sets out the discontinuity potentials pattern at each concentration of anthracene and at each temperature. Note that the experimental values of the transition potentials (both E tr + and E tr ) follow a quadratic dependence with respect to the temperature at each bulk concentration of anthracene.
Figure 1. C-E curves recorded at a stationary mercury-drop electrode as a function of temperature, for 0.5 mmol dm 3 anthracene in a 0.5 mol dm 3 sodium perchlorate solution in EG, 5 mV s 1 scan rate. The dashed vertical line marks, as an example, the negative discontinuity potential at 283 K. Also the base electrolyte C-E curve is reported.
Entropy 12 00570 g001
Figure 2. (a) Transition potential values as a function of the temperature at different anthracene concentrations, the relevant values (in mol dm 3 units) are reported in the figure. (b) Fitness of the experimental results using Equation 14: c 0 = −62304.5 J mol 1 , c 1 = 133.8 J mol 1 K 1 , c 2 = 7844.3 J mol 1 V 1 , c 3 = 73921.4 J mol 1 V 2 .
Entropy 12 00570 g002
Thus, the phase transition of the adsorbed anthracene in EG is modeled as a one-component, three-phase equilibrium, compare Section 2.1 for the details of the model; the electroactive species is assumed to be present in the bulk and in two distinct adsorbed phases featuring a perpendicular (⊥) and flat/parallel (‖) orientation with respect to the electrode surface, compare Figure 3a,b (considering the electrode surface coplanar with the page surface, then Figure 3a shows the “flat” disposition while Figure 3b shows the “perpendicular” disposition).
This approach follows a similar route as also assessed on the basis of a related experimental evidence found in the case of adenine adsorbed both from water and EG solutions [13]. Then, for a fixed value of electrode surface area, a monolayer of the perpendicular phase (C 14 H 10 ( ads , ) ) comprises a larger number of adsorbed molecules that one of the parallel phase (C 14 H 10 ( ads , ) ), owing to the change from a planar orientation (0.77 nm 2 molecule 1 ) to a perpendicular one (0.4 nm 2 molecule 1 ) by and large in a 2/1 ratio. So, the 2D phase transition process can be expressed by the following equilibrium reaction:
C 14 H 10 ( ads , ) + C 14 H 10 ( bulk ) 2 C 14 H 10 ( ads , )
Thus implying the following relation between the chemical potentials:
μ ( ads , ) + μ ( bulk ) = 2 μ ( ads , )
where μ ads , , μ ads , and μ bulk are the anthracene chemical potentials in the flat adsorbed orientation, perpendicular adsorbed orientation and bulk solution phases. Note that, for fixed temperature and concentration values, the electric potential (i.e., the electric field, ϕ, active at the electrode/solution interface) determines which of the two phases is stable. From the operational point of view:
R T ln c C 14 H 10 , bulk = c 0 + c 1 T + c 2 E tr + c 3 E tr 2
where c C 14 H 10 , bulk is used in place of the activity owing to the low concentration of the anthracene and c 1 = 2 S ads , 0 S bulk 0 S ads , 0 = Δ S PT 0 is the standard entropy variation of the electrochemically induced 2D phase transition, compare Equation (9). In particular, the term C1 is determined by the standard entropy variation of the phase transition as represented in Equation (12); c 0 , c 1 , c 2 and c 3 values are obtained from the multivariate fit of the experimental data reported in Figure 2b, eventually yielding Δ S PT 0 = 133 J mol 1 K 1 . The negative value is in agreement both with the experimental evidences suggesting the evolution of the adsorbed phase toward a more ordered state and with the results obtained in previous studies [7,13]. It has to be noted that the Δ S PT 0 term contains also the entropic contribution from the entropy of the solute in the bulk solution. The entropy variation involving only adsorbed species can be determined, making the further assumption that the standard entropy of the solid and the perpendicular adsorbed phase are equivalent (owing to the low degree of freedom that can be reasonably assigned to the latter adsorbed phase, as already proposed in [7,13]). Thus, once determined experimentally the Δ S sol 0 = S bulk 0 S solid 0 quantity and considering the hypothesis S ads , 0 = S solid 0 the entropy change involving only the adsorbed species can be estimated, all in all: Δ S 2 D 0 = S ads , 0 S ads , 0 and after rearranging Δ S 2 D 0 = C 1 + Δ S sol 0 . Experimentally it is found Δ S sol 0 = 23 J mol 1 K 1 , thus yielding a modelistic value of Δ S 2 D 0 = − 110 J mol 1 K 1 .
Figure 3. Considering the page coplanar with the electrode surface: (a) parallel “flat” disposition, featuring side-to-side interactions; (b) perpendicular disposition featuring ring-to-ring interactions (possibly involving pi-staking). Light blue and white balls are representative of carbon and hydrogen atoms, respectively.
Entropy 12 00570 g003

3. Conclusions

As a whole, the theoretical model here used was applied to rationalize the experimental outcome concerning the 2D phase transition of five organic compounds adsorbed from the aqueous solution and two compounds (adenine and in the present work anthracene) adsorbed from ethylene glycol. In the case of the water solvent Δ S PT 0 values are found in −129 to −87 J mol 1 K 1 range [7], while −87 J mol 1 K 1 [13] and −133 J mol 1 K 1 are the values found for adenine and anthracene adsorbed from ethylene glycol in the present work. Thus, the experimentally determined Δ S PT 0 values appear almost independent of the solvent nature, further supporting the modelistic assumptions.

4. Experimental Section

Anthracene (A8637 Sigma) in ethylene glycol (102466 ReagentPlus Sigma-Aldrich, water content < 1% ) solutions were prepared using sodium perchlorate 0.5 mol dm 3 as base electrolyte. Solutions are de-aerated with argon for 15 minutes prior to any measurement session. The temperature is controlled and kept constant within ± 0.1 K by using a Haake C10/DC 10-K15 thermostat. Measurements are performed using an hanging drop mercury electrode, with a drop area of 2.2 mm 2 (the area reproducibility is better than 0.5%); the auxiliary electrode was a platinum wire and the reference a saturated calomel electrode in EG (SCE EG ) , a constant potential difference between the SCE in water and in EG of 6 mV is found. A.c. phase-sensitive polarographic measurements, usually addressed as capacity vs. potential (C-E) curves were recorded using a Solartron 1286 Electrochemical interface and a 1250 Frequency Response Analyzer (alternating current with a 5 mV peak-to-peak amplitude and 500 Hz frequency). The whole of the electrochemical apparatus and measurement procedure is controlled by using an original program implemented on an IBM PS/2 model 30, the RS 232 and GPIB ports are used as communication channels. The saturation concentration of anthracene in EG, as a function of the temperature, was determined by UV spectroscopy.

References

  1. Finklea, H.O. Electrochemistry of organized monolayers of thiols and related molecules. In Electroanalytical Chemistry. A Series of Advances; Bard, A.J., Rubinstein, I., Eds.; Marcel Dekker Inc.: New York, NY, USA, 1996; Volume 19, Chapter 3; pp. 110–223. [Google Scholar]
  2. Vetterl, V. Differentielle kapazitat der elektrolytischen doppelschicht in anwesenheit einiger purin und pyrimidinderivate. Coll. Czech. Chem. Commun. 1966, 31, 2105–2110. [Google Scholar] [CrossRef]
  3. Sridharan, R.; de Levie, R.; Rangarajan, S.K. Two-dimensional phase transitions at electrochemical interfaces. Chem. Phys. Lett. 1987, 142, 43–47. [Google Scholar] [CrossRef]
  4. De Levie, R. The dynamic double layer: two-dimensional condensation at the Mercury-Water interface. Chem. Rev. 1988, 88, 599–609. [Google Scholar] [CrossRef]
  5. Donner, C.; Baumgartel, H.; Pohlmann, L.; Retter, U.; Philip, R. Non-faradaic two-dimensional phase transitions on smooth surfaces-an example for time-dependent homogeneous nucleation. Ber. Bunsenges. Phys. Chem. 1996, 100, 403–412. [Google Scholar] [CrossRef]
  6. Buess-Herman, C. Self-assembled monolayers at electrode metal surfaces. Prog. Surf. Sci. 1994, 46, 335–375. [Google Scholar] [CrossRef]
  7. Fontanesi, C. Entropy change in the two-dimensional phase transition of adenine adsorbed at the Hg Electrode/Aqueous Solution Interface. J. Chem. Soc., Faraday Trans. 1994, 90, 2925–2930. [Google Scholar] [CrossRef]
  8. Striegler, H.; Krznaric, D.; Kolb, D.M. Two-dimensional condensation of camphor and its derivatives on Au(111) Electrodes. J. Electroanal. Chem. 2002, 532, 227–235. [Google Scholar] [CrossRef]
  9. Danckwerts, M.; Li, Y.; Oslonovitch, J.; Pettinger, B.; Krischer, K. Adsorption of camphor on Au(111) and its effects on the electroreduction of periodate ( IO 4 ). J. Phys. Chem. B 2004, 108, 14398–14406. [Google Scholar] [CrossRef]
  10. Tanaka, Y.; Sagara, T. Formation of Viologen Radical Cation condensed phase through two-dimensional molecular organization process on an HOPG Electrode Surface in Binary Viologen Solutions. J. Electroanal. Chem. 2008, 619–620, 65–74. [Google Scholar] [CrossRef]
  11. Sridharan, R.; De Levie, R.; Rangarajan, S.K. Two-dimensional phase transitions at Electrochemical Interfaces. Chem. Phys. Lett. 1987, 142, 43–46. [Google Scholar] [CrossRef]
  12. Retter, U. On adsorption according to the Lattice Gas Model (Ising Model). J. Electroanal. Chem. 1987, 236, 21–30. [Google Scholar] [CrossRef]
  13. Benedetti, L.; Camurri, G.; Fontanesi, C.; Ferrarini, P.; Giovanardi, R. On the 2D phase transition of Adenine adsorbed at the Mercury/Ethylene Glycol Solution Interface. Electrochim. Acta 2004, 36, 1655–1662. [Google Scholar] [CrossRef]
  14. Tadjeddine, A.; Rahmani, A. Formation of condensed Film at a Mercury-Electrolyte Interface observed by Surface Plasmon Excitation. Electrochim. Acta 1991, 49, 1855–1857. [Google Scholar] [CrossRef]
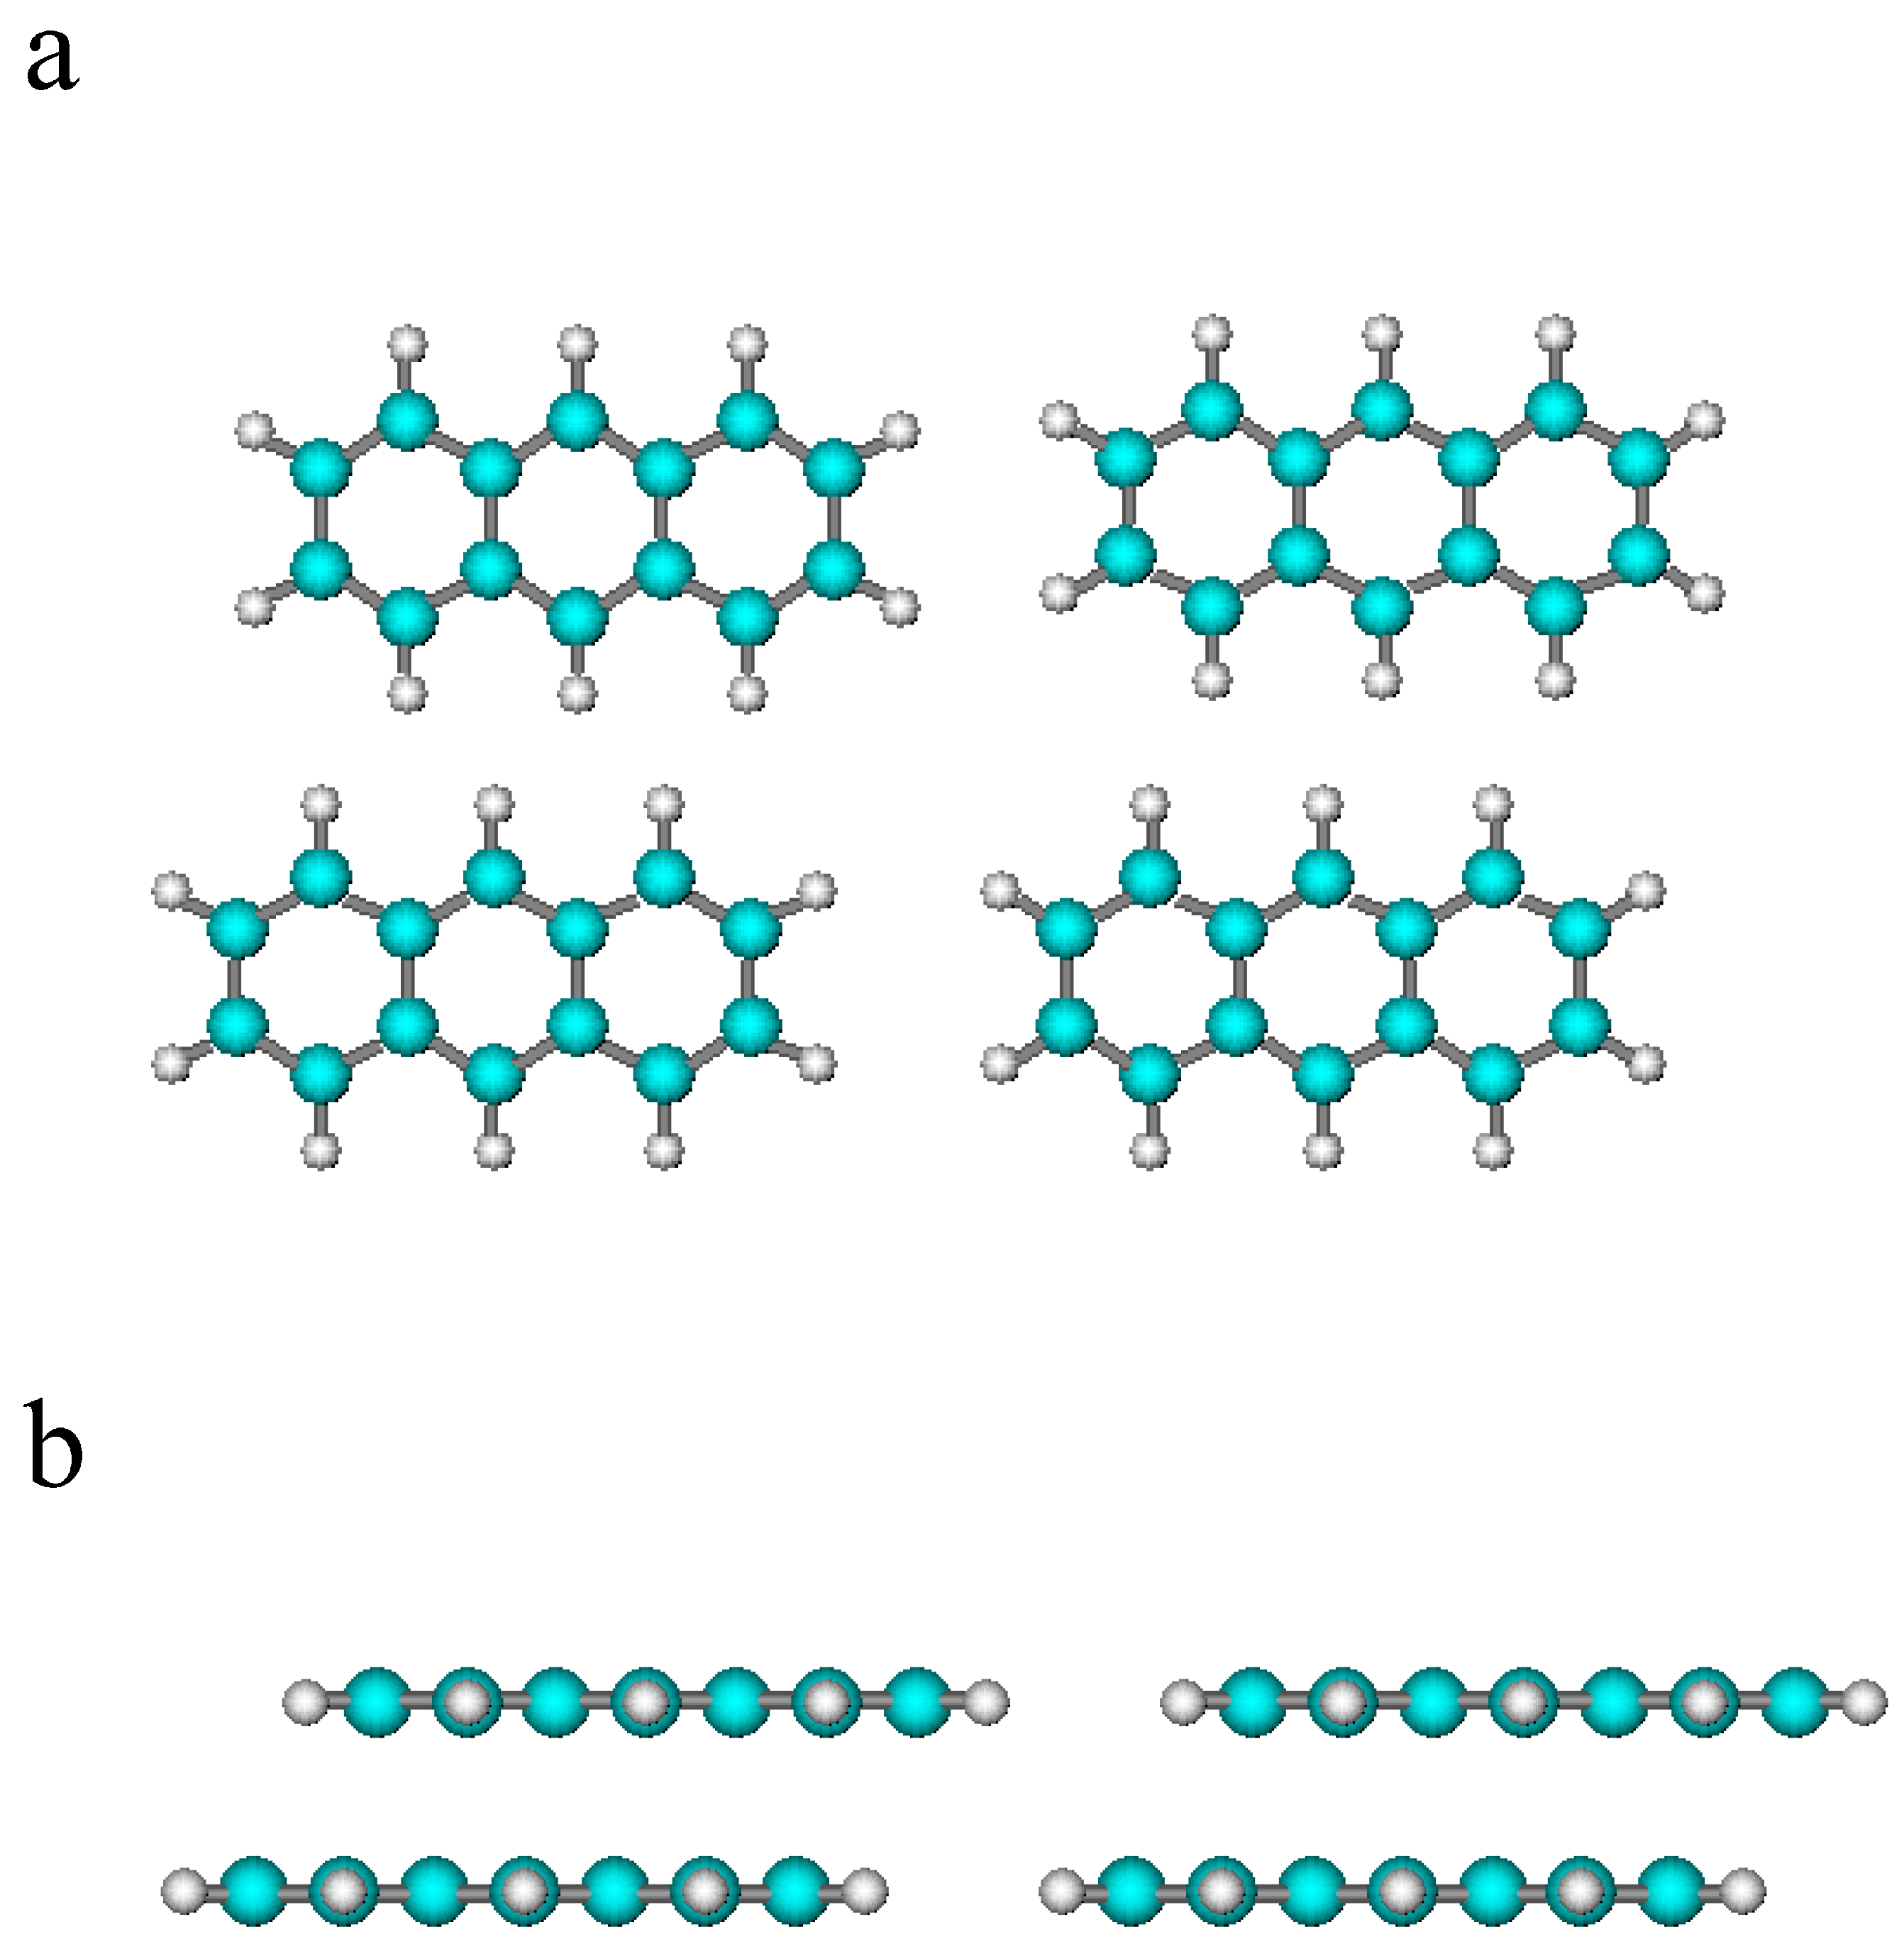
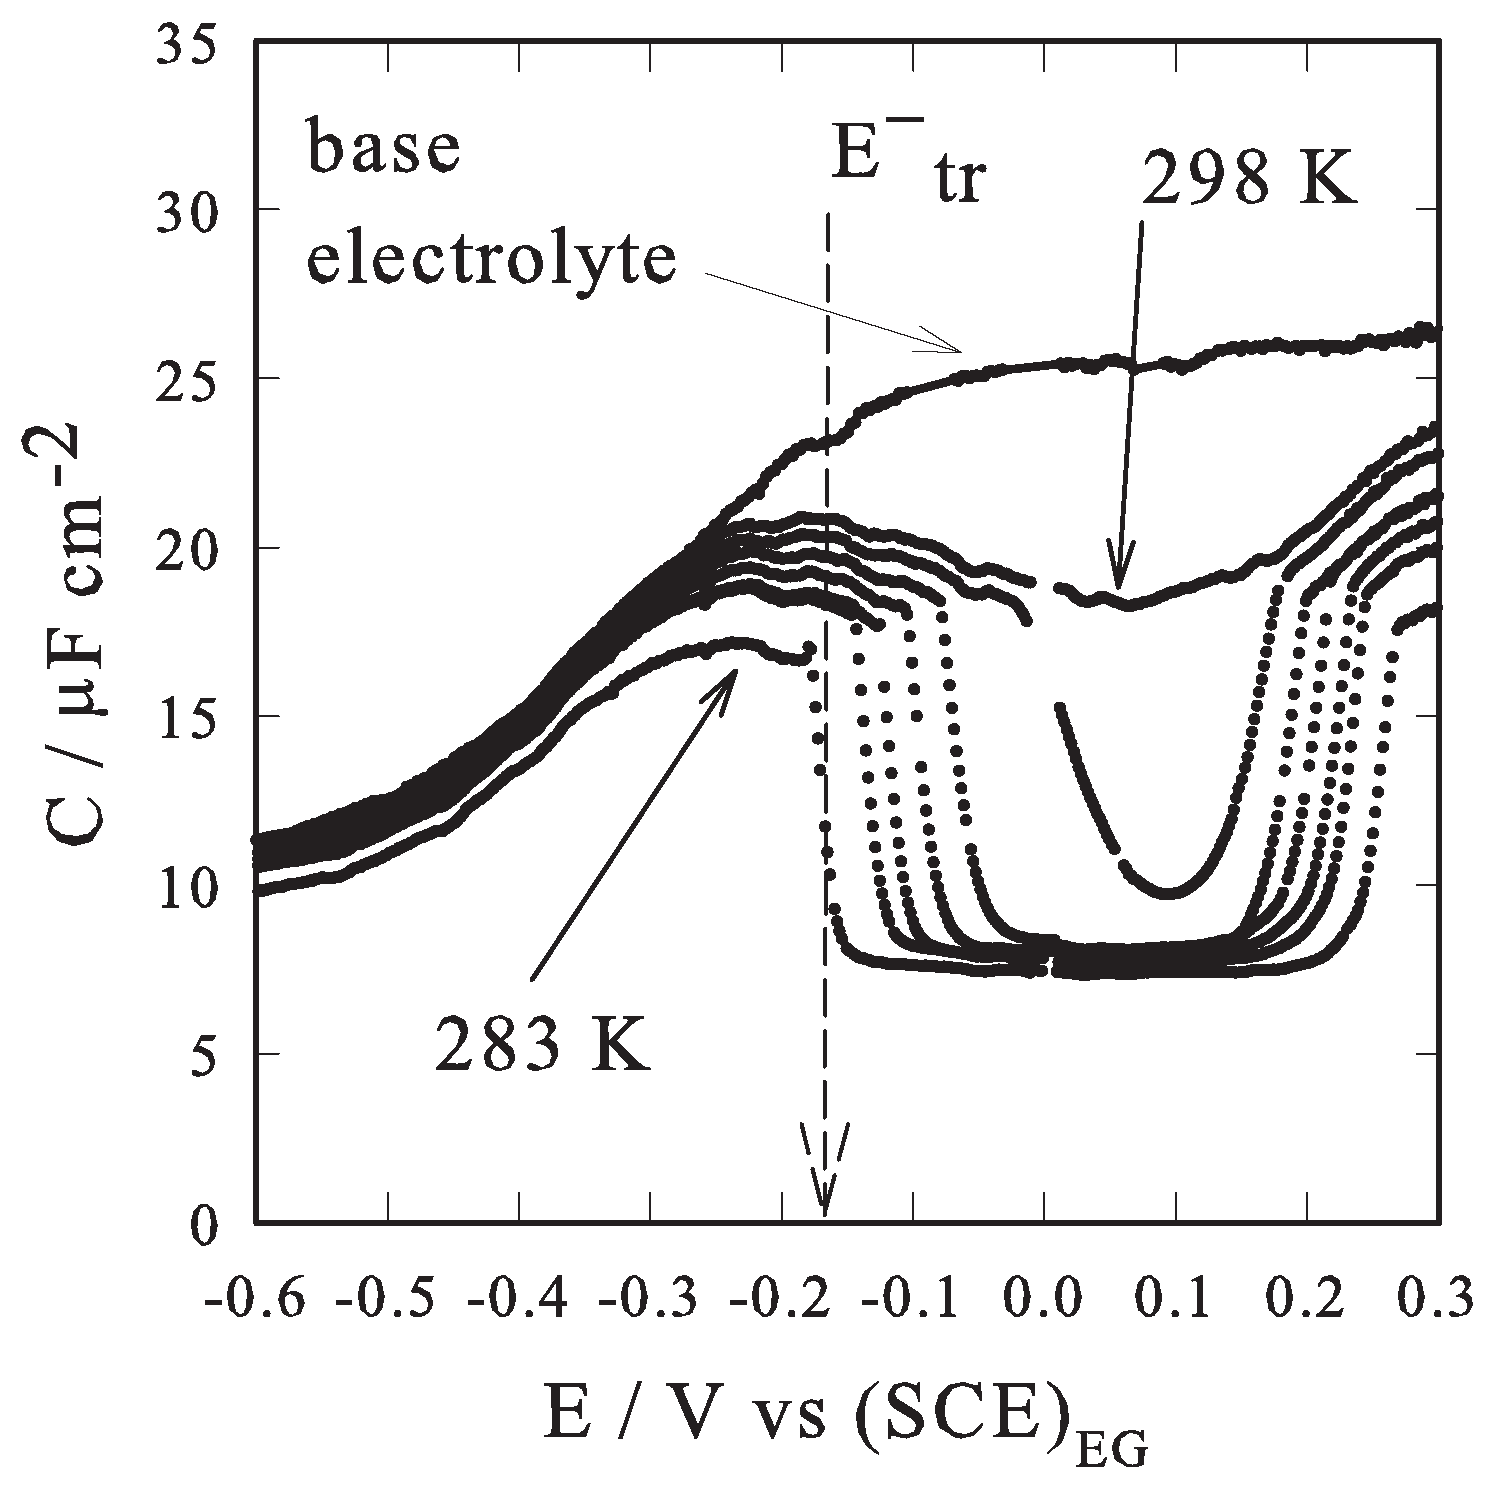
  15. In fact, hysteresis occurs because kinetic effects influence the transition potential values, upon selecting the potential scan direction, i.e., positive or negative (the condensed phase formation, from the “parallel” to “perpendicular” disposition of the adsorbate, has a slower kinetics if compared to the reverse process [2,3,4,5,6,7]). In the present work hysteresis effects are negligible when using a 10 mV s−1 potential scan rate, eventually a even lower scan rate, 5 mV s−1, was used in recording capacity vs. potential curves.

