by
Yu Li 1,2, Bo Pang 1,2,*, Ziqi Zheng 1,2, Haoming Chen 1,2, Dingzhi Peng 1,2 , Zhongfan Zhu 1,2 and Depeng Zuo 1,2
, Zhongfan Zhu 1,2 and Depeng Zuo 1,2
1
College of Water Sciences, Beijing Normal University, Beijing 100875, China
2
Beijing Key Laboratory of Urban Hydrological Cycle and Sponge City Technology, Beijing 100875, China
Remote Sens. 2023, 15(7), 1805; https://doi.org/10.3390/rs15071805 - 28 Mar 2023
Cited by 2 | Viewed by 2473
Abstract
The accurate estimation of urban extreme precipitation is essential for urban design and risk management, which is hard for developing countries, due to the fast urbanization and sparse rain gauges. Satellite precipitation products (SPPs) have emerged as a promising solution. Not only near
[...] Read more.
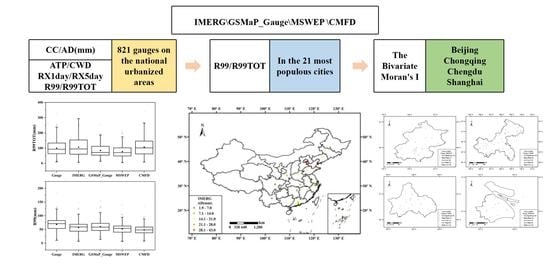
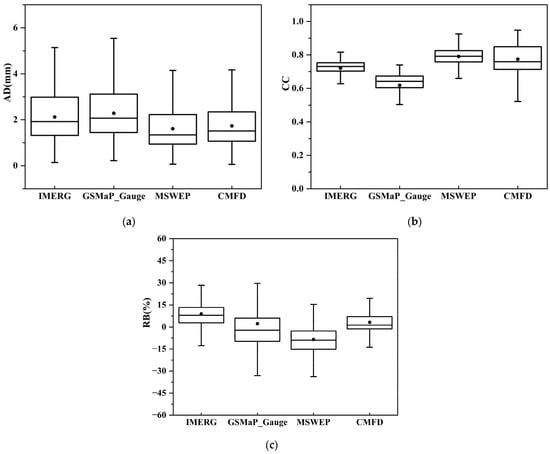
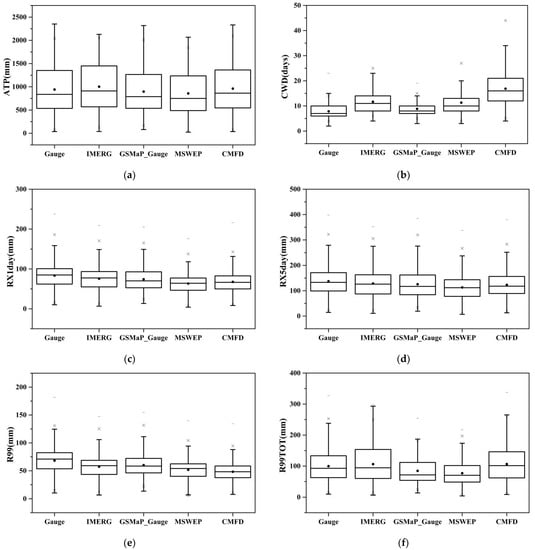
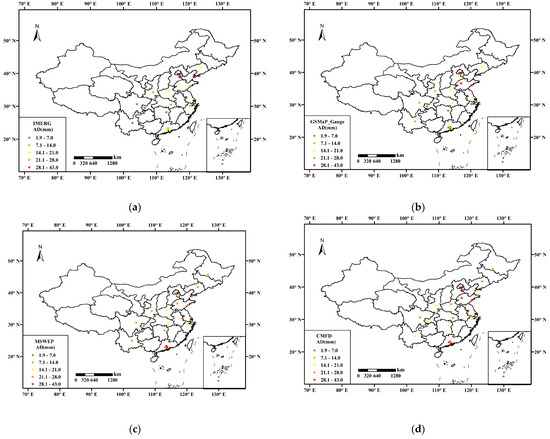
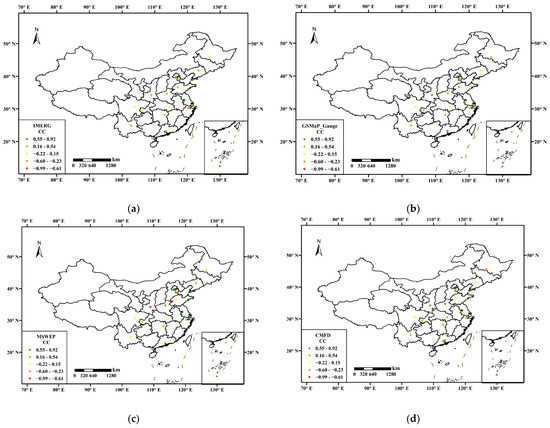
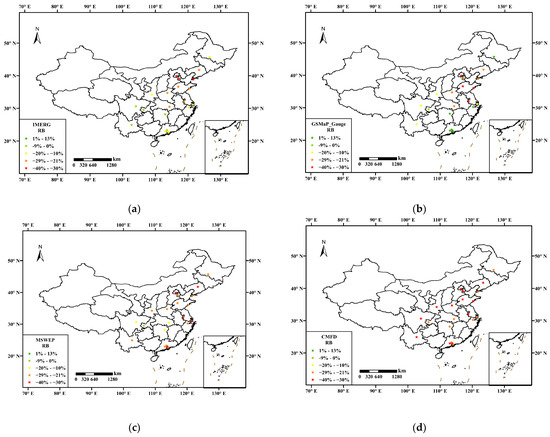
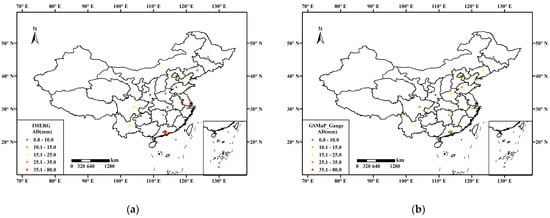
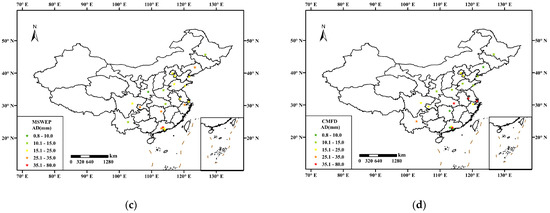
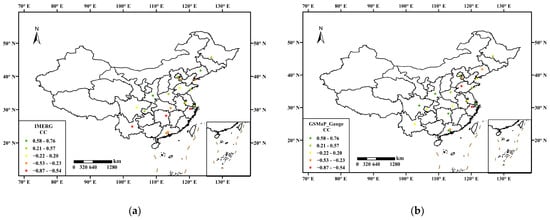
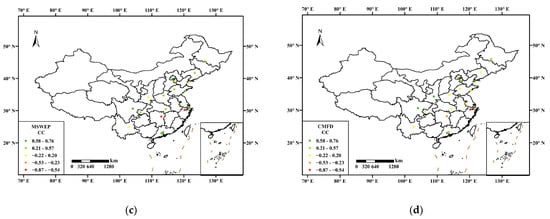
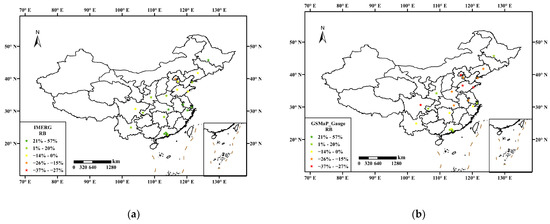
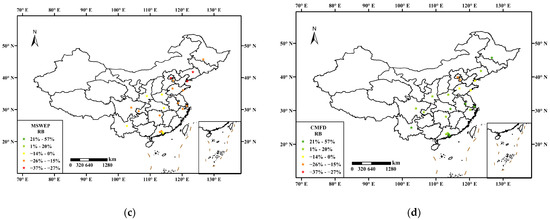
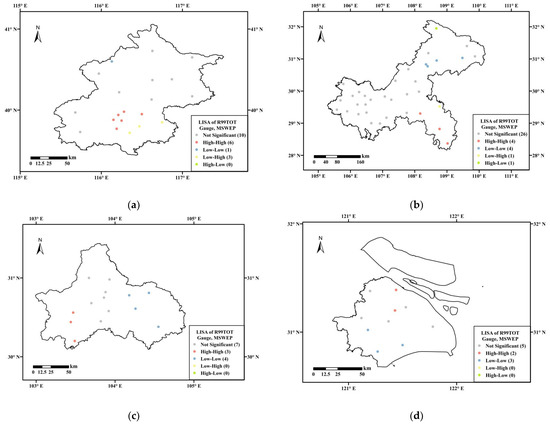
The accurate estimation of urban extreme precipitation is essential for urban design and risk management, which is hard for developing countries, due to the fast urbanization and sparse rain gauges. Satellite precipitation products (SPPs) have emerged as a promising solution. Not only near real-time SPPs can provide critical information for decision making, but post-processed SPPs can also offer essential information for climate change adaption, risk management strategy development, and related fields. However, their ability in urban extreme precipitation estimation has not been examined in detail. This study presents a comprehensive evaluation of four recent SPPs that are post-processed, including IMERG, GSMaP_Gauge, MSWEP, and CMFD, for their ability to capture urban extreme precipitation in mainland China at the national, city, and inner-city scales. The performance of the four SPPs was assessed using daily observations from the 821 urban gauges from 2001 to 2018. The assessment includes: (1) the extreme precipitation estimates from the four SPPs in the total urbanized areas of mainland China were evaluated using correlation coefficients (CC), absolute deviation (AD), relative deviation (RB), and five extreme precipitation indices; (2) The extreme precipitation estimates over 21 Chinese major cities were assessed with the two most important extreme indices, namely the 99th percentile of daily precipitation on wet days (R99) and total precipitation when daily precipitation exceeding R99 (R99TOT); and (3) Bivariate Moran’s I (BMI) was adopted to assess the inner-city spatial correlation of R99 and R99TOT between SPPs and gauge observations in four major cities with most gauges. The results indicate that MSWEP has the highest CC of 0.79 and the lowest AD of 1.61 mm at the national scale. However, it tends to underestimate urban precipitation, with an RB of −8.5%. GSMaP_Gauge and IMERG performed better in estimating extreme values, with close extreme indices with gauge observations. According to the 21 major cities, GSMaP_Gauge also shows high accuracy in estimating R99 and R99TOT values, with the best RB and AD in these cities, while CMFD and MSWEP exhibit the highest CC values for R99 and R99TOT, respectively, indicating a strong correlation between their estimates and those obtained from gauge observations. At the inner-city scale, MSWEP shows advantages in monitoring the spatial distribution of urban extreme precipitation in most of cities. The study firstly provided the multiscale assessment of urban extreme precipitation by SPPs over mainland China, which is useful for their applications.
Full article
(This article belongs to the Topic Hydro-Meteorological Hazards: Forecasting, Assessment and Risk Management)
▼
Show Figures
Graphical abstract


