Sensors 2017, 17(10), 2378; https://doi.org/10.3390/s17102378 - 18 Oct 2017
Cited by 48 | Viewed by 8152
Abstract
Landslides are major and constantly changing threats to urban landscapes and infrastructure. It is essential to detect and capture landslide changes regularly. Traditional methods for monitoring landslides are time-consuming, costly, dangerous, and the quality and quantity of the data is sometimes unable to
[...] Read more.
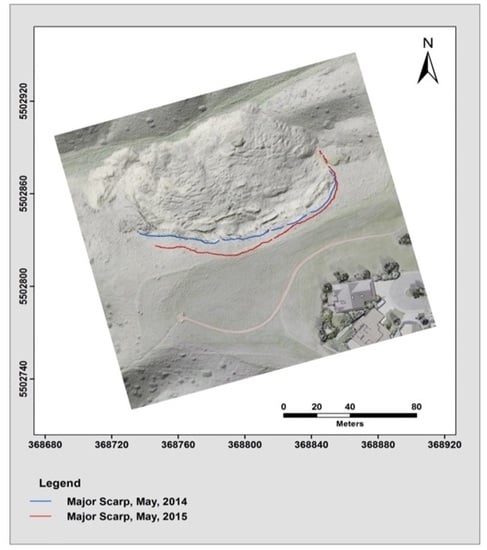
Landslides are major and constantly changing threats to urban landscapes and infrastructure. It is essential to detect and capture landslide changes regularly. Traditional methods for monitoring landslides are time-consuming, costly, dangerous, and the quality and quantity of the data is sometimes unable to meet the necessary requirements of geotechnical projects. This motivates the development of more automatic and efficient remote sensing approaches for landslide progression evaluation. Automatic change detection involving low-altitude unmanned aerial vehicle image-based point clouds, although proven, is relatively unexplored, and little research has been done in terms of accounting for volumetric changes. In this study, a methodology for automatically deriving change displacement rates, in a horizontal direction based on comparisons between extracted landslide scarps from multiple time periods, has been developed. Compared with the iterative closest projected point (ICPP) registration method, the developed method takes full advantage of automated geometric measuring, leading to fast processing. The proposed approach easily processes a large number of images from different epochs and enables the creation of registered image-based point clouds without the use of extensive ground control point information or further processing such as interpretation and image correlation. The produced results are promising for use in the field of landslide research.
Full article
(This article belongs to the Special Issue Remote Sensing and GIS for Geo-Hazards and Disasters)
►
Show Figures
Graphical abstract


